 Helena Berz Slapø1,2*
 Knut Ivar Karevold2
- 1Oslo Metropolitan University, Oslo, Norway
- 2GreeNudge, Oslo, Norway
Background: Food production and consumption contributes to one third of households' environmental impact. The environmental impact of different food categories varies and in general environmental footprint of meat is high than fish and vegetable options. Environmental food labels have been suggested as a means to sway consumption patterns. The purpose of this study is to test if different simple eco-labels in combination with posters can influence consumers to select environmentally friendly food options.
Method: Three different labeling systems were tested on warm dishes in a University cafeteria in Oslo, Norway. The first system was traffic-light labels with three symbols (red, yellow and green), the second system was a single-green label that only labeled the environmentally friendliest dishes, and the third system was a single-red label that only labeled the least environmentally friendly option. Posters were placed in the cafeteria, explaining the labeling systems and the climate impact of different food categories. Outcome measures was sales share of meat, fish and vegetarian dishes. The intervention period was separated in two; the first 20 days (period 1) and 22 last days (period 2) to evaluate if the effects of the labels was different when first introduced and after some months.
Results: The traffic-light labels significantly reduced sales of meat dishes with 9% in the period 1 (p < 0.1) but not in period 2. Sales share of fish or vegetarian dishes were not impacted. Single-green and single-red labeling had no effect on sales share of meat, fish or vegetarian dishes. Posters were present during all interventions.
Conclusion: Findings suggests that traffic-light labels in combination with posters can improve the eco-friendliness of customers food choices in a cafeteria setting, at least short-term. Future studies should investigate the long-term effects of simple eco-labels. Additionally, one should study the combined effect of symbols with other changes in the choice architecture.
Introduction
Food production and consumption is responsible for one third of European households' total environmental impact and is an important sector from an environmental perspective (Guinée et al., 2006b; European Environment Agency, 2015). The livestock sector is the key contributor to greenhouse gas (GHG) emissions and alone accounts for 15% of total global emissions (Guinée et al., 2006a; Steinfeld et al., 2006; Nordic Council of Minsters, 2012; Gerber et al., 2013; National Institutes of Health, 2015; Nelson et al., 2016; Springmann et al., 2018). A growing body of research suggests that a global shift toward a more plant-based diet is necessary in order to overcome the worst climate change scenario (Goodland, 1997; Goodland and Anhang, 2009; Krystallis et al., 2009; Stehfest et al., 2009; Audsley et al., 2010; Deckers, 2010a,b; Freibauer et al., 2011; Gerber et al., 2013; Green et al., 2015; Fischer and Garnett, 2016). This can either be achieved by substituting meat-based diets with plant-based diets (Berners-Lee et al., 2012; Sabate and Soret, 2014; Scarborough et al., 2014) or by substituting high GHG intensive meat products (e.g., beef and lamb) with lower GHG intensive products (e.g., chicken and fish) (McMichael et al., 2007; Committee, 2008; Green et al., 2015).
Traditionally policymakers have tried to change peoples' food habits trough restricting the access or limiting marketing of certain foods, providing people with information and education or economic incentives to change food habits (Gorski and Roberto, 2015). Such interventions build on economic theory and models of rational decision-making, assuming that human choices are reason based, rational and logical (Hollands et al., 2013). Some recent reviews have argued that such interventions have unclear effects on people's actual food choices (Grunert and Wills, 2007; Capacci et al., 2012; Wills et al., 2012). One explanation is the gap between knowledge and attitudes and actual behaviors, and that people make a high number of food choices every day making it difficult to adhere to all positive intentions (Camerer, 2003). Since food choices are often not planned in detail these purchases are largely characterized by habits and intuition (Meiselman and Bell, 2003).
Researchers, policy-makers, private companies and practitioners alike are therefore looking toward the relatively new field of behavioral economics for other interventions that may be better suited to change choices (Hallsworth et al., 2018). According to behavioral economics, many daily decisions are fast, intuitive and occur outside cognitive awareness (Sunstein and Thaler, 2008; King et al., 2013). By changing the context or decision architecture, people may be nudged toward better choices (Marteau et al., 2011). Changing the food environment and presentation of food options may therefore influence customers' food choices without removing options or changing economic incentives (Sunstein and Thaler, 2008).
Nudging involves changing the sequence of options presented and the available information about the options at the moment of choice (Sunstein and Thaler, 2008). Introducing environmental labels (eco-labels) can be considered adding information about the food choices. Some scholars have questioned if eco-labels qualify as ‘nudges' and should be considered as a traditional informative intervention (Kosters and Van der Heijden, 2015), while others argue that eco-labels provide additional information at the point of choice and therefore qualify as nudges (Ölander and Thøgersen, 2014). Simple labels that do not require high levels of literacy and numeracy (Rothman et al., 2006), and that reduce information overload are defined as simple labeling nudges (Iyengar and Lepper, 2000; Mitchell et al., 2005; Karevold et al., 2017) and are the labels this study investigates.
Eco-Labeling to Change Food Choices in a Cafeteria Setting
To our knowledge no studies have investigated the effect of simple labels as a strategy to get customers to change their food choices toward more eco-friendly options in a cafeteria. However, we have identified six reviews that have studied how labels and signs can influence consumers in cafeterias to eat healthier (Swartz et al., 2011; Hersey et al., 2013; Kiszko et al., 2014; Sinclair et al., 2014; Long et al., 2015; Fernandes et al., 2016). All reviews concluded that there is minimum evidence that supports the use of calorie labeling in cafeterias (Swartz et al., 2011; Kiszko et al., 2014; Sinclair et al., 2014; Long et al., 2015; Fernandes et al., 2016). The authors explained that the reason may be that detailed calorie labels only work on certain groups as women and health-conscious consumers (Swartz et al., 2011; Kiszko et al., 2014; Sinclair et al., 2014; Long et al., 2015). Two of the reviews argued that simple labels as traffic-light labels or labels that identify the best option attract more attention than detailed labels (Hersey et al., 2013; Fernandes et al., 2016). Therefore, simple labels may be more effective than numeric and detailed labels (Hersey et al., 2013; Fernandes et al., 2016).
Several studies on traffic-light labels found that they reduced the intake of unhealthy food products (Variyam et al., 1995; Borgmeier and Westenhoefer, 2009; Thorndike et al., 2012; Madhvapaty and DasGupta, 2015). It has been argued that traffic-light labels work well because consumers intuitively grasp the implicit messages of the relative colors and are able to compare options within the same category (Bargh, 1992). Another stream of research has studied how introducing a third option influences preferences, also called the compromise effect (Carroll and Vallen, 2014). The compromise implies that the middle option becomes more attractive or popular when a smaller or larger option is introduced, compared to when only the two extremes are available. In a calorie labeling study, customers avoided the largest and smallest caloric items and chose the items in-between (Carroll and Vallen, 2014). In another study, the middle size became more likely to be purchased when a larger and a smaller drink size option was added to the range of choices (Sharpe et al., 2008). Traffic-light labels may therefore lead to an increase in purchase of the middle option.
Simple signs may serve as reference points, indicating that an option has positive or negative characteristics. Previous research has investigated how reference points can lead to positive and negative contrast effects (Kahneman and Tversky, 1979, 2000, 2013; Kahneman, 1992). A reference point will typically influence people to experience options that are better as positive, while those under the reference point as negative (Kahneman and Tversky, 1979). Single positive signs such as a green label can communicate that an option is positive, while a red sign can imply a negative warning or signal not to choose. Introducing a single green label can make the other options seem less attractive and influence a reduced selection of these while increasing the consumption of the green option. On the other hand, a single-red label can make the other options seem more attractive and perhaps reduce the attraction of the red option.
A major gap in the literature is if simple food labels work over time in settings there customers are exposed to labels multiple times. None of the six reviews looked at the long-term effects of food labels. Thorndike et al. (2014) argued that customers develop “fatigue” for labels when exposed to them multiple times and that labels therefore stop working after some time (Thorndike et al., 2014). It is therefore important to determine the impact of eco-labels on real food purchase over time.
Cafeterias can be a venue for swaying food choices, as more and more meals are consumed in this context all over the western world (The Nielsen Company, 2016). If simple eco-labels can promote environmentally friendly choices, this can be a low-cost intervention to influence a high number of food choices for a high number of people in the population.
This paper makes several contributions. Our paper is the first to compare the effects of three different simple eco-label systems on environmentally friendlier food alternatives in a cafeteria setting. Previous studies have tested eco-labels in grocery stores (Vanclay et al., 2011; Elofsson et al., 2014; Vlaeminck et al., 2014). Further, this study investigates the effects of eco-labels on actual food choices. Previous studies have assessed attitudes and intentions that do not necessarily translate into actual food choices (Chatzidakis et al., 2007; de Boer et al., 2009; Krystallis et al., 2009; Bray et al., 2011; de Barcellos et al., 2011; Brouhle and Khanna, 2012).
Hypothesis
Based on the discussion above, we expect simple eco-labeling systems to impact consumers' food choices. A green sign is expected to function as a positive contrast and a red sign is expected to function as a negative contrast. This study will investigate the effects of three different simple labels; a traffic-light, a single-green label and a single-red label.
Thus, the present study explores three hypotheses:
Hypotheses (1): The three-colored traffic-light labeling will stimulate customers to choose more of the green-labeled dishes and yellow-labeled dishes, and less of the red-labeled dishes.
Hypotheses (2): The single-green labeling will stimulate customers to choose more of the green-labeled dishes, and less of the two other dishes.
Hypotheses (3): The single-red labeling will stimulate customers to choose less of the red-labeled dishes, and more of the two other dishes.
Methods
Intervention
As shown in Figure 1, the traffic-light system labeled all three warm dishes, while the single-green and single-red marked one single dish on the menu. For the single-green labeling format only the vegetarian dish was labeled with the “Low CO2” sign. In contrast, the single-red labeling format exclusively marked the meat dish with a “High CO2” label.
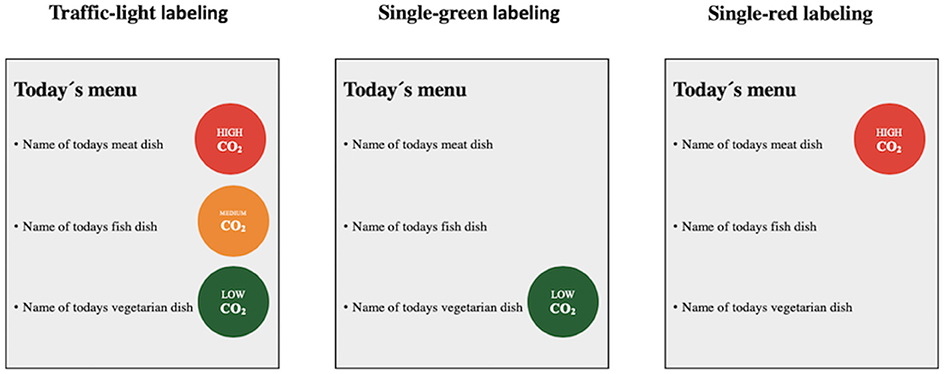
Figure 1. The three different labeling systems used in the experiment.
As previously discussed, the environmental footprint of meat, fish and vegetarian diets are significantly different from each other. Based on a general categorization of these differences, all meat dishes were labeled as “High CO2” dishes, all fish dishes as “Medium CO2” and all vegetarian as “Low CO2” dishes. The labels used a simple color-coded scheme in combination with words inside the labels to visualize the environmental impact of the dish, which has been found to improve the efficacy of eco-labels (Tang et al., 2004).
The labels were placed on the menu board next to the dish description where consumers ordered their food. Menu labeling made sure that consumers were exposed to the active labeling formats during the time of decision making. Photos illustrating the placement of the labels on the menu board are provided in Appendix A.
In addition to labels, posters were placed in the cafeteria, explaining the labeling system and the climate impact of the different food categories. The posters are shown in Appendix B. Based on Golan et al.'s (2001) and Weiss and Tschirhart (1994) recommendations, information on the posters was held clear, concise and informative to avoid the possibility of information overload (Golan et al., 2001) and correspond with assumed prior knowledge of the target audience (Weiss and Tschirhart, 1994). We expected customers to have knowledge about carbon dioxide impact on climate change. However, we did not assume consumers as much knowledge about the environmental consequences of food production. The posters therefore did not explain carbon dioxide but focused on meat products' environmental impact. The posters were placed both at the entrance of the cafeteria and on a shelf next to the warm dishes. Besides, table cards with the same design as the posters were placed on the tables in the cafeteria.
Research Setting
This study was conducted in the largest cafeteria at the campus of the University of Oslo. The cafeteria sold three different warm dishes every day; one meat, one fish, and one vegetarian dish, in addition to other products. Warm dishes were selected for analysis, firstly because it was relatively easy to estimate the environmental impact of the different dish categories, and secondly because the price was the same for all dishes and constant during the study period. The cafeteria was open five days a week and served warm dishes from 11:00 a.m. to 6:00 p.m. Monday to Thursdays. Fridays were not included in the sample due to short opening hours (until 3:00 p.m.).
Control sales data were collected for 17 days prior to intervention. We used a pre-intervention control period and no parallel control period so that the measured purchase behavior during the control period was completely unaffected by the labeling intervention. We aimed to provide enough time to detect an effect on sales of the labeling intervention and similar duration for the intervention periods. The intervention period was 42 days and the Christmas holidays divided the intervention period. Since it is likely that many of the same guests visited the cafeteria several times, this gave us the opportunity to compare the effect of the labels when first introduced and after several months. Sales data were collected for the 22 days before the Christmas holidays (period 1) and 22 days after the holidays (period 2) separately. Two days in fall were taken out of the sample because the cafeteria sold out of warm dishes. Intervention period 1 was therefore reduced from 22 days to 20 days.
Since we in this study compared the effects of the different labeling systems, we needed to make sure that the impact of “popular dishes” was not mistaken for the effect of the labeling intervention. We therefore rotated the three labeling systems during each day of the intervention. Each day was divided into three time periods: late morning (11:00 a.m.−01:00 p.m.), early afternoon (01:00–03:00 p.m.) and late afternoon from (03:00–06:00 p.m.). The different labeling-systems randomly rotated between the different time periods each day. Thus, an even distribution amongst the three labeling designs was ensured during each measurement day. When the different labeling systems were at place is shown in Appendix C.
Output Data
Information about number of warm dishes sold was collected from the cash registry. The cafeteria's cash registers were programmed to capture the information needed to identity the different warm dishes, the time and day of sale. The cafeteria staff was informed about the purpose of the experiment and they were asked to not influence the customers' dish choices. Since the study aimed to identify the labeling treatments' effect on relative changes in dish purchases, the sales data were converted from absolute numbers into share of total sales each day. By using shares of total sale, we accounted for weekly fluctuations in number of sales of the warm dishes as a whole.
Data Analysis
Ordinary Least Squares regression (OLS) was used to analyze the impact of the labeling systems on sales share of different dishes. The regression controlled for other variables not captured by the labeling systems in order to best isolate the true relationship between the sales share of dishes under different labeling systems. We controlled for the effect of weekday and time of the day in the regression. Independent variables were categorical and were converted to binary dummy variables before serving as inputs for the estimated regression model. The results from the statistical tests were considered significant for p = 0.1. Regression results are shown in Appendix D.
We did not register any information about the individual guests and their personal choices. The guests in the cafeteria were staff and students working in this section of the campus, and it is probable that the same guests visited the restaurant on several occasions during the intervention periods. The observations of sales data are therefore not independent observations. Our study design allows us to investigate the effects of eco-labels on the food choices of the same guest over time.
Results
The total number of observations was 228; control period 51 observations (3 per day × 17 days), 60 observations in intervention period 1 (3 per day × 20 days), and 66 in intervention period 2 (3 per day × 22 days).
Figure 2 shows the daily sales share of the three different warm dishes in the cafeteria before and after the introduction of the labeling systems.
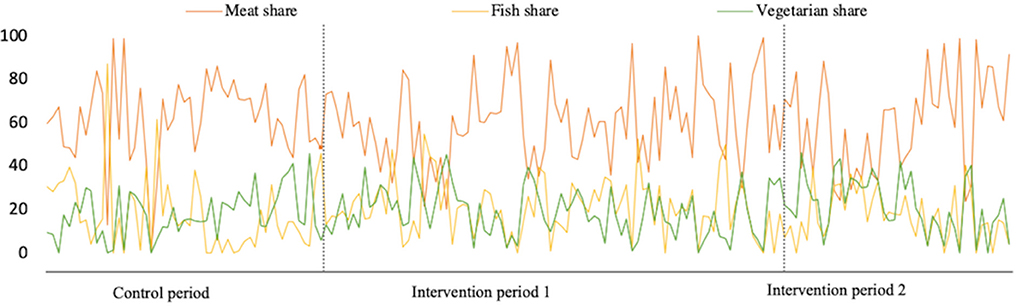
Figure 2. Percentage share of different dishes of total sales during control period and intervention periods.
Sales of meat dishes was higher than sales of vegetarian dishes during the whole period, indicating that meat dishes in general were more popular than vegetarian and fish dishes. In addition, sales of the different warm dishes highly fluctuated from day to day, leading to a high variation in daily sales data. Sales share for each day during the experiment are shown in Appendix E.
Hypotheses Testing
Hypotheses (1) was that the three-colored traffic-light labeling will stimulate customers to choose more of the green-labeled dishes and yellow-labeled dishes, and less of the red-labeled dishes.
Figure 3 shows the share of different dishes under the control and the different intervention periods under traffic-light labeling.
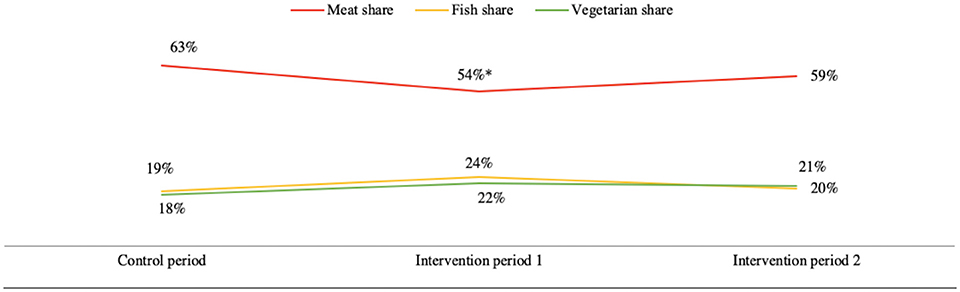
Figure 3. Sales share of different dishes under traffic-light labels vs. no labeling. * indicates significance difference at the 90% significance level.
Results from the regression analysis show that traffic-light labeling did not significantly impact sales share of green-labeled vegetarian or yellow-labeled fish dishes on any of the intervention periods (p > 0.1). For meat dishes the results show that traffic-light labeling reduced sales with 9% in period 1 and that traffic-light labeling can explain about 7% of the reduction (COEF traffic-light = −0.069, p = 0.10). Traffic-light labeling did not have a significant effect on sales of meat dishes during the second intervention period (p = 0.38).
Hypotheses (2) was that the single-green labeling will stimulate customers to choose more of the green-labeled dishes, and less of the two other dishes.
Figure 4 shows the share of different dishes under the control period and the different intervention periods under single-green labeling. Under this system only the vegetarian dish was marked with a green label.
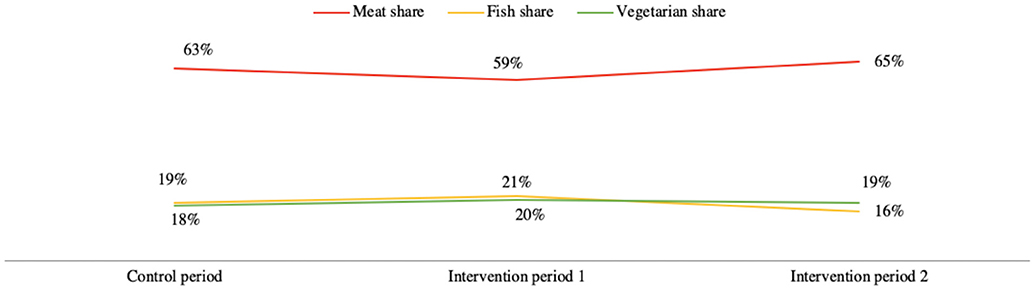
Figure 4. Sales share of different dishes under single-green labels vs. no labeling.
The results from the regression analysis show that the single-green labels did not sway customers to choose more of the green-labeled vegetarian dishes (p > 0.1) nor less of the meat or fish dish (p > 0.1).
Hypotheses (3) was that the single-red labeling will stimulate customers to choose less of the red-labeled dishes, and more of the two other dishes.
Figure 5 shows the sales share of different dishes under the control period and the different intervention periods under single-red labeling. Here only the meat dish was marked with a red label.
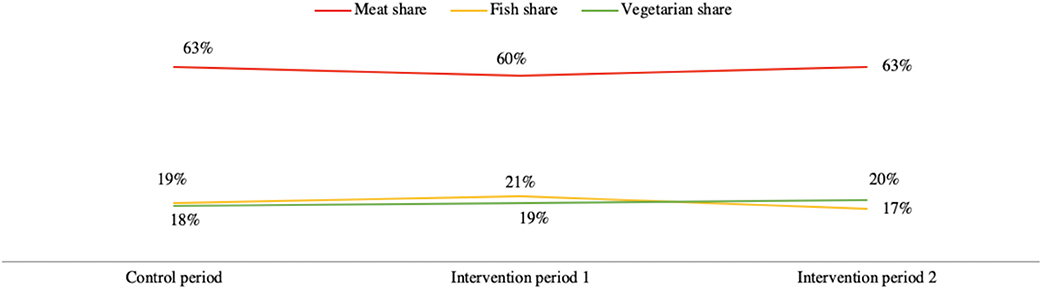
Figure 5. Sales share of different dishes under single-red labels vs. no labeling.
According to the analysis the introducing the single red-label did not sway customers to choose less of the red-labeled meat dishes (p > 0.1) nor more of the vegetarian or fish dish (p > 0.1).
Discussion
This experiment tested three different simple labels to promote eco-friendly food choices in a cafeteria setting. We expected that all three simple labels would improve the eco-friendliness of food choices.
However, we found that only the traffic-light labels significantly influenced customers to choose less meat dishes and only during period 1, but the traffic-light labels did not significantly increase sales of more environmentally friendly options. The effects of the traffic-lights suggest that the red traffic-light stopped some customers from going for the least eco-friendly option, but that the green lights did not make more customers go for the most eco-friendly option. However, the traffic-lights effects seemed to be time limited and faded away in the second intervention period since we only observed a significant change during the first intervention period.
The results suggest that the traffic-lights led to a switch from red choices to the yellow middle option. Sales of the green labeled vegetarian dish did not increase as much as sales of the middle yellow labeled fish dish. This can be interpreted as support for the compromise effect (Carroll and Vallen, 2014), meaning that the traffic-light labeling led to an increase of the middle option, and not to a switch to the more extreme green option. Another interpretation of the same result might be that meat hungry guests prefer fish proteins to pure vegetarian meals and that the meat and fish dish were considered more simulate to each other than a vegetarian dish.
The single green- and red-light systems did not sway food choices in a systematic direction. One explanation for the weak influence of the single eco-label might be that these contained even less information than the traffic-lights with comparable references. The single symbols might have been difficult to make sense of, as environmental labeling was a newly introduced marker on the dishes and customers did not have any prior knowledge about the labels used in this study.
We considered the cafeteria setting to be a relatively low involvement choice setting where customers less actively process available information about the food alternatives (Meiselman and Bell, 2003; Karevold et al., 2017). Therefore, it may be that costumers did not notice the labels. Also, perhaps the guests had limited previous knowledge about the connection between food choices and environmental consequences. In addition, perhaps the environmental signage was inconsistent with the guests' perceived need in the choice situation; the guests might have been more focused on effective delivery of a tasty meal than preserving the environment through eating something different. It may be that costumers had low environmental awareness or motivation to make eco-friendly.
We expected that the same set of customers were exposed to the labels during intervention period 1 and 2. Customers seemed to react favorable to the traffic-light label when first introduced, but their eco-friendly behavior declined over time and almost returned to control period behavior after some months during period 2. These results could be seen as an evidence for customers developing “fatigue” for the labels and that the effect of the eco-labels in this study was only relatively short lived. These findings may reflect typical customer behaviors and reactions to signage (Thorndike et al., 2014).
Strengths and Limitations
A notable strength of the study is that we measured changes in actual purchase choices rather than relying on self-reported behavior. This is important as previous studies suggest that people in general exaggerate their environmentally friendly behavior when responding to questionnaires (Chatzidakis et al., 2007; de Boer et al., 2009; Bray et al., 2011). Using real sales data may have limited our ability to control for external factors or events that might have occurred during the cafeteria intervention compared to a laboratory experiment, but still showed what the guests actually preferred.
By using the cafeteria's overall design for the labels and for posters (colors, typography and logos) we camouflaged the experiment and limited the risk influence of social desirability and other third variables. Since the customers were not aware that they were part of an experiment, they were less liable to modify their behavior in a socially desirable direction (Benz and Meier, 2008; Monahan and Fisher, 2010). Influencing the customers to believe that the labels and posters originated from the cafeteria operator may have increased the labels and posters credibility (Weiss and Tschirhart, 1994). Since the cafeteria employees collected sales data electronically through the cash register, customers were not aware that their food purchase was being analyzed. This reduced the risk of researcher and participant bias. This supports that the observed effect was strongly related to the intervention as opposed to any other confounding bias.
A strength of the study is that we rotated the interventions in a random manner for each observation day. Another strength is that we split the intervention periods in two, naturally divided by the Christmas holidays. As the guests were from the same area of the campus, we expect that same set of guests was exposed to several different versions of the signage during the period, but that this did not skew the results in a systematic way as the interventions were rotated randomly.
A limitation of the study is the relatively low number of observations (n = 228). Due to day-to-day variations in sales shares, it was difficult to detect a clear trend caused by the interventions. In addition, the labeling system only included warm dishes. One may argue that the labeling system would have had a greater and more detectable effect on sales if all food products in the cafeteria had been labeled. This would have allowed customers to more directly compare the environmental information provided by the labels across products.
Another limitation was that we could not separate the effect of the labels to the effect of the posters, as posters were visible to customers during the entire intervention period. As we did not collect information about the individual customers, we do not know how the guests perceived the signs and labels during the process of choosing what to eat.
Conclusions
This study suggests that traffic-light labeling according to the environmental impact of different dishes in combination with posters might have an effect, but that the effects may fade over time. Labeling of the eco-friendliest or lest eco-friendly dish does not seem to sway food choices in an environmentally friendly direction. Further studies should test the use of traffic-light labels for a longer period of time to determine if the label can have long-term effects on food choices.
As meat consumption has a significant negative environmental foot print, and more traditional policy interventions do not fully seem to capture peoples' motivations when choosing what to eat, behavioral economics interventions can be relevant future area of research. Future studies could combine signage tools with other nudge interventions to assess the combined effect of symbols with other changes in the choice architecture. It might be beneficial to look into the research on choice architecture interventions for health food choices as a reference.
Ethics Statement
An ethics approval was not required as per the guidelines from Norwegian School of Economics, nor the Norwegian research ethics committees' guidelines. The participants in the study were anonymous cafeteria customers and diners at a University of Oslo cafeteria. No information about the guests was collected. We only collected information about the number of food choices in the restaurant. No oral informed consent was obtained from the participants, and no other another consent procedure were followed.
Author Contributions
HS designed the study and collected the date as part of her master thesis at the Norwegian School of Economics under supervision of Mathias Ekström (https://openaccess.nhh.no/nhh-xmlui/bitstream/handle/11250/2404108/masterthesis.pdf?sequence=1). HS analyzed the data and was primary responsible for the final content. KIK contributed the writing of the paper. All authors have approved the final manuscript.
Conflict of Interest Statement
The authors declare that the research was conducted in the absence of any commercial or financial relationships that could be construed as a potential conflict of interest.
Acknowledgments
This paper is based on the HS master thesis at the Norwegian School of Economics. We thank supervisor Mathias Ekström for his contribution to the design of the study. We also thank Per Chistensen, Inger-Merethe Seljeseth and the entire cafeteria staff at the Faculty of Social Sciences at the University of Oslo for their cooperation, and enthusiasm during the study.
Supplementary Material
The Supplementary Material for this article can be found online at: https://www.frontiersin.org/articles/10.3389/fsufs.2019.00040/full#supplementary-material
Data Sheet 1. Appendix A, B, C, D, and E.
References
Audsley, E., Brander, M., Chatterton, J. C., Murphy-Bokern, D., Webster, C., and Williams, A. G. (2010). How Low Can We Go? An Assessment of Greenhouse Gas Emissions from the UK Food System and the Scope Reduction by 2050. Report for the WWF and Food Climate Research Network.
Bargh, J. A. (1992). The ecology of automaticity: toward establishing the conditions needed to produce automatic processing effects. Am. J. Psychol. 105, 181–199. doi: 10.2307/1423027
Benz, M., and Meier, S. (2008). Do people behave in experiments as in the field?—evidence from donations. Exp. Econ. 11, 268–281. doi: 10.1007/s10683-007-9192-y
Berners-Lee, M., Hoolohan, C., Cammack, H., and Hewitt, C. (2012). The relative greenhouse gas impacts of realistic dietary choices. Energy Pol. 43, 184–190. doi: 10.1016/j.enpol.2011.12.054
Borgmeier, I., and Westenhoefer, J. (2009). Impact of different food label formats on healthiness evaluation and food choice of consumers: a randomized-controlled study. BMC Public Health 9:184. doi: 10.1186/1471-2458-9-184
Bray, J., Johns, N., and Kilburn, D. (2011). An exploratory study into the factors impeding ethical consumption. J. Business Ethics 98, 597–608. doi: 10.1007/s10551-010-0640-9
Brouhle, K., and Khanna, M. J. E. E. (2012). Determinants of participation versus consumption in the Nordic Swan eco-labeled market. Ecol. Econ. 73, 142–151. doi: 10.1016/j.ecolecon.2011.10.011
Camerer, C. F. (2003). Behavioural Economics: Past, Present and Future. Pittsburgh. Retrieved from: http://www.its.caltech.edu/~camerer/ribe239.pdf
Capacci, S., Mazzocchi, M., Shankar, B., Macias, J. B., Verbeke, W., Pérez-Cueto, F. J., et al. (2012). Policies to promote healthy eating in Europe: a structured review of policies and their effectiveness. Nutr. Rev. 70, 188–200. doi: 10.1111/j.1753-4887.2011.00442.x
Carroll, R., and Vallen, B. (2014). Compromise and attraction effects in food choice. Int. J. Consumer Stud. 38, 636–641. doi: 10.1111/ijcs.12135
Chatzidakis, A., Hibbert, S., and Smith, A. P. (2007). Why people don't take their concerns about fair trade to the supermarket: the role of neutralisation. J. Business Ethics 74, 89–100. doi: 10.1007/s10551-006-9222-2
Committee, C. C. (2008). Building a Low-Carbon Economy-the UK's Contribution to Tackling Climate Change. Norwich. Retrieved from: https://www.theccc.org.uk/wp-content/uploads/2008/12/Building-a-low-carbon-economy-Committtee-on-Climate-Change-2008.pdf
de Barcellos, M. D., Krystallis, A., de Melo Saab, M. S., Kügler, J. O., and Grunert, K. G. (2011). Investigating the gap between citizens' sustainability attitudes and food purchasing behaviour: empirical evidence from Brazilian pork consumers. Int. J. Consumer Stud. 35, 391–402. doi: 10.1111/j.1470-6431.2010.00978.x
de Boer, J., Boersema, J. J., and Aiking, H. (2009). Consumers' motivational associations favoring free-range meat or less meat. Ecol. Econ. 68, 850–860. doi: 10.1016/j.ecolecon.2008.07.001
Deckers, J. (2010a). Should the consumption of farmed animal products be restricted, and if so, by how much? Food Pol. 35, 497–503. doi: 10.1016/j.foodpol.2010.06.003
Deckers, J. (2010b). What policy should be adopted to curtail the negative global health impacts associated with the consumption of farmed animal products? Res Publ. 16, 57–72. doi: 10.1007/s11158-010-9117-z
Elofsson, K., Matsdotter, E., and Arntyr, J. (2014). Got Green Milk?: A Field Experimental Trial of Consumer Demand for a Climate Label. Institutionen för Ekonomi, Sveriges lantbruksuniversitet.
European Environment Agency. (2015). Agriculture and Climate Change. Copenhagen. Retrieved from: https://www.eea.europa.eu/signals/signals-2015/articles/agriculture-and-climate-change
Fernandes, A. C., Oliveira, R. C., Proença, R. P., Curioni, C. C., Rodrigues, V. M., and Fiates, G. M. (2016). Influence of menu labeling on food choices in real-life settings: a systematic review. Nutr. Rev. 74, 534–548. doi: 10.1093/nutrit/nuw013
Fischer, C. G., and Garnett, T. (2016). Plates, Pyramids, and Planets: Developments in National Healthy and Sustainable Dietary Guidelines: A State of Play Assessment. Food and Agriculture Organization of the United Nations.
Freibauer, A., Mathijs, E., Brunori, G., Damianova, Z., Faroult, E., i Gomis, J. G., et al. (2011). Sustainable Food Consumption and Production in a Resource-constrained World Summary Findings of the EU SCAR Third Foresight Exercise La production et la consommation alimentaires durables dans un monde aux ressources limitées Résumé des résultats du 3ème exercice de prospective du Comité permanent pour la recherche agricole de l'Union européenne Nachhaltiger Lebensmittelkonsum und nachhaltige Lebensmittelproduktion in einer Welt mit begrenzten Ressourcen Zusammenfassung der Ergebnisse aus dem dritten Vorausschauverfahren des Ständigen Agrarforschungsausschusses (SCAR) der EU. EuroChoices 10, 38–43. doi: 10.1111/j.1746-692X.2011.00201.x
Gerber, P. J., Steinfeld, H., Henderson, B., Mottet, A., Opio, C., Dijkman, J., et al. (2013). Tackling Climate Change Through Livestock: A Global Assessment of Emissions and Mitigation Opportunities. Food and Agriculture Organization of the United Nations (FAO).
Golan, E., Kuchler, F., Mitchell, L., Greene, C., and Jessup, A. (2001). Economics of food labeling. J. Consumer Pol. 24, 117–184. doi: 10.1023/A:1012272504846
Goodland, R. (1997). Environmental sustainability in agriculture: diet matters. Ecol. Econ. 23, 189–200. doi: 10.1016/S0921-8009(97)00579-X
Goodland, R., and Anhang, J. (2009). Livestock and Climate Change: What if the Key Actors in Climate Change are…Cows, Pigs, and Chickens? Livestock and Climate Change: What if the Key Actors in Climate Change are…Cows, Pigs, and Chickens?
Gorski, M. T., and Roberto, C. A. (2015). Public health policies to encourage healthy eating habits: recent perspectives. J. Healthc. Leadership 7:81. doi: 10.2147/JHL.S69188
Green, R., Milner, J., Dangour, A. D., Haines, A., Chalabi, Z., Markandya, A., et al. (2015). The potential to reduce greenhouse gas emissions in the UK through healthy and realistic dietary change. Climat. Change 129, 253–265. doi: 10.1007/s10584-015-1329-y
Grunert, K. G., and Wills, J. M. (2007). A review of European research on consumer response to nutrition information on food labels. J. Public Health 15, 385–399. doi: 10.1007/s10389-007-0101-9
Guinée, J., Heijungs, R., De Koning, A., Van, L., Geerken, T., Van Holderbeke, M., et al. (2006a). Environmental Impact of Products (EIPRO) Analysis of the Life Cycle Environmental Impacts Related to the Final Consumption of the EU25. Retrieved from: http://ec.europa.eu/environment/ipp/pdf/eipro_report.pdf
Guinée, J., Heijungs, R., De Koning, A., Van, L., Geerken, T., Van Holderbeke, M., et al. (2006b). Environmental Impact of Products (EIPRO) Analysis of the Life Cycle Environmental Impacts Related to the Final Consumption of the EU25.
Hallsworth, M., Egan, M., Rutter, J., and McCrae, J. (2018). Behavioural Government: Using Behavioural Science to Improve How Governments Make Decisions. The Behavioural Insights Team. London. Retrieved from: https://www.bi.team/wp-content/uploads/2018/08/BIT-Behavioural-Government-Report-2018.pdf
Hersey, J., Wohlgenant, K., Arsenault, J., Kosa, K., and Muth, M. (2013). Effects of front-of-package and shelf nutrition labeling systems on consumers. Nutr. Rev. 71, 1–14. doi: 10.1111/nure.12000
Hollands, G. J., Shemilt, I., Marteau, T. M., Jebb, S. A., Kelly, M. P., Nakamura, R., et al. (2013). Altering micro-environments to change population health behaviour: towards an evidence base for choice architecture interventions. BMC Public Health 13:1218. doi: 10.1186/1471-2458-13-1218
Iyengar, S. S., and Lepper, M. R. (2000). When choice is demotivating: can one desire too much of a good thing? J. Personal. Soc. Psychol. 79:995. doi: 10.1037//0022-3514.79.6.995
Kahneman, D. (1992). Reference points, anchors, norms, and mixed feelings. Organ. Behav. Human Decision Processes 51, 296–312. doi: 10.1016/0749-5978(92)90015-Y
Kahneman, D., and Tversky, A. (1979). Prospect theory: an analysis of decision under risk. Econ. J. Econ. Soc. 47, 263–291. doi: 10.2307/1914185
Kahneman, D., and Tversky, A. (2000). Choices, values, and frames. Am. Psychol. 39, 341–350. doi: 10.1037//0003-066X.39.4.341
Kahneman, D., and Tversky, A. (2013). “Prospect theory: an analysis of decision under risk,” in Handbook of the Fundamentals of Financial Decision Making: Part I, eds L. C. MacLean and W. T. Ziemba (World Scientific), 99–127. doi: 10.1142/9789814417358_0006
Karevold, K., Bugge, A. B., Ueland, Ø., Slapø, H. B., Schjøll, A., Rosenlund, T. G., et al. (2017). From Knowledge to Action: The Behavioral Insights of Food Choices: Influencing Consumer to Eat Healthier. Oslo. Retrieved from: http://greenudge.org/wp-content/uploads/2018/03/GreeNudge-From-Knowledge-to-Action-report-2017.pdf
King, D., Greaves, F., Vlaev, I., and Darzi, A. (2013). Approaches based on behavioral economics could help nudge patients and providers toward lower health spending growth. Health Affairs 32, 661–668. doi: 10.1377/hlthaff.2012.1348
Kiszko, K. M., Martinez, O. D., Abrams, C., and Elbel, B. (2014). The influence of calorie labeling on food orders and consumption: a review of the literature. J. Commun. Health 39, 1248–1269. doi: 10.1007/s10900-014-9876-0
Kosters, M., and Van der Heijden, J. (2015). From mechanism to virtue: evaluating Nudge theory. Evaluation 21, 276–291. doi: 10.1177/1356389015590218
Krystallis, A., de Barcellos, M. D., Kügler, J. O., Verbeke, W., and Grunert, K. G. (2009). Attitudes of European citizens towards pig production systems. Livestock Sci. 126, 46–56. doi: 10.1016/j.livsci.2009.05.016
Long, M. W., Tobias, D. K., Cradock, A. L., Batchelder, H., and Gortmaker, S. L. (2015). Systematic review and meta-analysis of the impact of restaurant menu calorie labeling. Am. J. Public Health 105, e11-e24. doi: 10.2105/AJPH.2015.302570
Madhvapaty, H., and DasGupta, A. (2015). A study of food product labelling for products aimed at children. J. Business Manag. 17, 88–96. doi: 10.9790/487X-17338896
Marteau, T. M., Ogilvie, D., Roland, M., Suhrcke, M., and Kelly, M. P. (2011). Judging nudging: can nudging improve population health? Br. Med. J. 342:d228. doi: 10.1136/bmj.d228
McMichael, A. J., Powels, J. W., Butler, C. D., and Uauy, R. U. (2007). Food, livestock production, energy, climate change and health. Lancet 370, 1253–1263. doi: 10.1016/S0140-6736(07)61256-2
Meiselman, H. L., and Bell, R. (2003). Eating habits. Encycl. Food Sci. Nutr. 2, 1963–1968. doi: 10.1016/B0-12-227055-X/00379-5
Mitchell, V.-W., Walsh, G., and Yamin, M. (2005). Towards a conceptual model of consumer confusion. Assoc. Consumer Res. 32:2005. Available online at: https://pdfs.semanticscholar.org/6373/169e0bb772bfcc554200d30f55195b19a324.pdf
Monahan, T., and Fisher, J. A. (2010). Benefits of ‘observer effects': lessons from the field. Qual. Res. 10, 357–376. doi: 10.1177/1468794110362874
National Institutes of Health. (2015). A Compilation of Dietary Supplement Statements. From the Scientific Report of the 2015 Dietary Guidelines Advisory Committee. Washington, DC. Retrieved from: https://ods.od.nih.gov/About/2015_DGAC_Report.aspx
Nelson, M. E., Hamm, M. W., Hu, F. B., Abrams, S. A., and Griffin, T. S. (2016). Alignment of healthy dietary patterns and environmental sustainability: a systematic review. Adv. Nutr. Int. Rev. J. 7, 1005–1025. doi: 10.3945/an.116.012567
Nordic Council of Minsters. (2012). Nordic Nutrition Recommendations 2012—Integrating Nutrition and Physical Activity.
Ölander, F., and Thøgersen, J. (2014). Informing versus nudging in environmental policy. J. Consumer Pol. 37, 341–356. doi: 10.1007/s10603-014-9256-2
Rothman, R. L., Housam, R., Weiss, H., Davis, D., Gregory, R., Gebretsadik, T., et al. (2006). Patient understanding of food labels: the role of literacy and numeracy. Am. J. Prevent. Med. 31, 391–398. doi: 10.1016/j.amepre.2006.07.025
Sabate, J., and Soret, S. (2014). Sustainability of plant-based diets: back to the future. Am. J. Clin. Nutr. 100, 476–482. doi: 10.3945/ajcn.113.071522
Scarborough, P., Appleby, P. N., Mizdrak, A., Briggs, A. D. M., Travis, R. C., Bradbury, K. E., et al. (2014). Dietary greenhouse gas emissions of meat-eaters, fish-eaters, vegetarians and vegans in the UK. Clim. Change 125, 179–192. doi: 10.1007/s10584-014-1169-1
Sharpe, K. M., Staelin, R., and Huber, J. (2008). Using extremeness aversion to fight obesity: policy implications of context dependent demand. J. Consumer Res. 35, 406–422. doi: 10.1086/587631
Sinclair, S. E., Cooper, M., and Mansfield, E. D. (2014). The influence of menu labeling on calories selected or consumed: a systematic review and meta-analysis. J. Acad. Nutr. Diet. 114, 1375–1388. doi: 10.1016/j.jand.2014.05.014
Springmann, M., Clark, M., Mason-D'Croz, D., Wiebe, K., Bodirsky, B. L., Lassaletta, L., et al. (2018). Options for keeping the food system within environmental limits. Nature 562, 519–525. doi: 10.1038/s41586-018-0594-0
Stehfest, E., Bouwman, L., Van Vuuren, D. P., Den Elzen, M. G., Eickhout, B., and Kabat, P. (2009). Climate benefits of changing diet. Clim. Change 95, 83–102. doi: 10.1007/s10584-008-9534-6
Steinfeld, H., Costales, A., Rushton, J., Scherf, B., Bennett, T., and Hall, D. (2006). Underneath the Livestock Revolution Rome, Italy: The 2006 Livestock Report FAO. Rome: FAO. Retrieved from: ftp://ftp.fao.org/docrep/fao/009/a0255e/a0255e02.pdf
Sunstein, C. R., and Thaler, R. H. (2008). Nudge: Improving Decisions About Health, Wealth and Happiness. New Haven: Yale University Press.
Swartz, J. J., Braxton, D., and Viera, A. J. (2011). Calorie menu labeling on quick-service restaurant menus: an updated systematic review of the literature. Int. J. Behav. Nutr. Phys. Activity 8:135. doi: 10.1186/1479-5868-8-135
Tang, E., Fryxell, G. E., and Chow, C. S. (2004). Visual and verbal communication in the design of eco-label for green consumer products. J. Int. Consumer Marketing 16, 85–105. doi: 10.1300/J046v16n04_05
The Nielsen Company. (2016). What's in Our Food and on Our Mind Ingredient and Dinning-Out Trends Acround the World. New York, NY. Retrieved from: https://www.nielsen.com/content/dam/nielsenglobal/eu/docs/pdf/Global%20Ingredient%20and%20Out-of-Home%20Dining%20Trends%20Report.pdf
Thorndike, A. N., Riis, J., Sonnenberg, L. M., and Levy, D. E. (2014). Traffic-light labels and choice architecture: promoting healthy food choices. Am. J. Prevent. Med. 46, 143–149. doi: 10.1016/j.amepre.2013.10.002
Thorndike, A. N., Sonnenberg, L., Riis, J., Barraclough, S., and Levy, D. E. (2012). A 2-phase labeling and choice architecture intervention to improve healthy food and beverage choices. Am. J. Public Health 102, 527–533. doi: 10.2105/AJPH.2011.300391
Vanclay, J. K., Shortiss, J., Aulsebrook, S., Gillespie, A. M., Howell, B. C., Johanni, R., et al. (2011). Customer response to carbon labelling of groceries. J. Consumer Pol. 34, 153–160. doi: 10.1007/s10603-010-9140-7
Variyam, J. N., Blaylock, J., and Smallwood, D. (1995). Modeling Nutrient Intake: The Role of Dietary Information. US Department of Agriculture. Economic Research Service.
Vlaeminck, P., Jiang, T., and Vranken, L. (2014). Food labeling and eco-friendly consumption: experimental evidence from a Belgian supermarket. Ecol. Econ. 108, 180–190. doi: 10.1016/j.ecolecon.2014.10.019
Weiss, J. A., and Tschirhart, M. (1994). Public information campaigns as policy instruments. J. Pol. Anal. Manag. 13, 82–119. doi: 10.2307/3325092
Keywords: food choices, behavioral economics interventions, nudging, eco-labels, simple-labels, environmental impact
Citation: Slapø HB and Karevold KI (2019) Simple Eco-Labels to Nudge Customers Toward the Most Environmentally Friendly Warm Dishes: An Empirical Study in a Cafeteria Setting. Front. Sustain. Food Syst. 3:40. doi: 10.3389/fsufs.2019.00040
Received: 14 September 2018; Accepted: 02 May 2019;
Published: 28 May 2019.
Edited by:
Mark Andrew Lawrence, Deakin University, AustraliaReviewed by:
Catherine Georgina Russell, Deakin University, AustraliaAida Turrini, Council for Agricultural and Economics Research, Italy
Copyright © 2019 Slapø and Karevold. This is an open-access article distributed under the terms of the Creative Commons Attribution License (CC BY). The use, distribution or reproduction in other forums is permitted, provided the original author(s) and the copyright owner(s) are credited and that the original publication in this journal is cited, in accordance with accepted academic practice. No use, distribution or reproduction is permitted which does not comply with these terms.
*Correspondence: Helena Berz Slapø, aGVsZW5hQGdyZWVudWRnZS5ubw==