 Alexandra C. Morel1,2*
 Mark Hirons1
 Michael Adu Sasu3Marvin Quaye3Rebecca Ashley Asare3John Mason3
 Stephen Adu-Bredu4
 Emily Boyd5
 Constance L. McDermott1
 Elizabeth J. Z. Robinson6
 Robert Straser7
 Yadvinder Malhi1Ken Norris2
- 1School of Geography and the Environment, Environmental Change Institute, University of Oxford, Oxford, United Kingdom
- 2Institute of Zoology, Zoological Society of London, London, United Kingdom
- 3Nature Conservation Research Centre, Accra, Ghana
- 4CSIR-Forestry Research Institute of Ghana, Kumasi, Ghana
- 5Lund University Centre for Sustainability Studies, Lund, Sweden
- 6School of Agriculture, Policy and Development, University of Reading, Reading, United Kingdom
- 7Department of Entomology, University of California, Riverside, Riverside, CA, United States
Cocoa yields in Ghana remain low. This has variously been attributed to low rates of fertilizer application, pollinator limitation, and particularly dry growing conditions. In this paper we use an African forest-agriculture landscape dominated by cocoa (Theobroma cacao) to develop an ecological production function, allowing us to identify key ecological and management limits acting on cocoa yields simultaneously. These included more consistent application of fertilizers inter-annually, distributing rotting biomass throughout the farm and reducing the incidence of capsid attacks. By relaxing these limits, we estimate plausible increases in yields and, by extension, farm incomes. Our analysis reveals that resulting increases in cocoa yields requiring both ecological and intensive management interventions could be significant (113 ± 60%); however, benefits are disproportionately realized by the wealthiest households. We found that wealthier households benefited proportionally more from ecological intensification methods (e.g., leaving more rotting biomass in their farms) and the poorest households benefited proportionally more from capital-intensive intensification methods (e.g., pesticide and fertilizer applications). We treated poverty as multi-dimensional, and show that only certain dimensions of poverty (school attendance, assets, and food security) are significantly related to cocoa incomes, while several other dimensions (access to clean water, sanitation and electricity, and infant mortality) are not. We explore how increased household cocoa incomes could impact different dimensions of poverty. Our findings suggest, that if all households adopted the optimal level of each of these management options, and in so doing had similar poverty profiles to those households already managing optimally, we would see the community-averaged probability: a child of a household misses school decrease from 47 to 31%, a household would be able to acquire assets increase from 40 to 59% and a household would have access to an adequate amount of food increase from 62 to 79%.
Introduction
With many of Africa's low-income households dependent on small-scale agriculture and experiencing among the world's highest yield gaps, efforts to support economic development across the continent are increasingly addressing the need to improve crop yields (Irz et al., 2001; Minten and Barrett, 2008; Kassie et al., 2011; Davis et al., 2012; Tittonell and Giller, 2013), which can improve both incomes and food security (Pretty et al., 2011; Tilman et al., 2011; Vanlauwe et al., 2014). Across Sub-Saharan Africa (SSA), low crop yields make it difficult for agricultural households to overcome impoverished conditions (Dzanku et al., 2015). At the national level, growth in a country's agricultural sector can be a successful driver of economic development, as exemplified by cocoa (Theobroma cacao) production in Ghana (Byerlee et al., 2009). In contrast, low agricultural productivity in Africa can “push” migration from rural areas to over-crowded urban centers (Christiaensen et al., 2011; Collier and Dercon, 2014; Dercon and Gollin, 2014; Dorosh and Thurlow, 2016).
Much agricultural production across Africa consists of low intensity cultivation with little chemical and mechanical input. Low-income African farmers that have little financial capacity to intensify could benefit from an “ecological” approach to intensification, using methods that are more labor-intensive rather than capital-intensive (Tittonell and Giller, 2013). However, predicting the effectiveness of ecological approaches requires a relatively sophisticated understanding of a crop's dependence on its immediate ecosystem's dynamics and functions (Kremen, 2005; Mace et al., 2012; Jonsson et al., 2014). At present, few studies have focused on more than one or two ecological influences, or ecosystem services (ES), on a crop at a time, such as pollination (Kremen et al., 2007; Potts et al., 2010; Boreux et al., 2013; Deguines et al., 2014), pest control (Boyd et al., 2013; Maas et al., 2013; Jonsson et al., 2014), or nutrient cycling (Beynon et al., 2012; Tully et al., 2012). Particularly in the case of an agro-forestry system, without considering the contribution of the landscape of ecosystem services more holistically, it is not possible to fully explore the linkages between yield improvements and farming practices (Tallis et al., 2008; Bisseleua et al., 2009; Clough et al., 2009; Wade et al., 2010; Tscharntke et al., 2012; Bommarco et al., 2013; Howe et al., 2014; Tittonell, 2014). The literature describes models that incorporate ecosystem services that enhance the productivity of agriculture as “ecological production functions,” which can be used, for example, to understand how management of several contributing ES can be optimized to maintain or increase the productivity of an agricultural system (Power, 2010; Bommarco et al., 2013). Whilst some yield-enhancing ES occur “on-farm,” others can flow into a farm from less managed or “natural” areas in the landscape (Zhang et al., 2007; Klein, 2009; Power, 2010). These “off-farm” ES can be attributed to nearby intact habitat, such as forest conservation areas, if a landscape is organized more as a “land-sparing” scenario or diverse land-covers in a more “land-sharing” design (Green et al., 2005; Tscharntke et al., 2005). As a result, the scale of a development-motivated, policy intervention is important depending on the ecosystem service (ES) being managed (Tittonell, 2014; Vanlauwe et al., 2014).
Increasing low-income farmers' yields is one potential approach to reducing poverty through increasing food security and/or farmers' incomes. The effectiveness of such an approach depends on farmers' access to land, and revenues from yield increases outweighing the extra costs, whether due to increased purchased inputs or increased labor demand (Irz et al., 2001). However, in this paper we recognize that poverty is increasingly recognized as being multi-dimensional (Bourguignon and Chakravarty, 2003; Alkire, 2007; Alkire and Foster, 2011), dynamic (Hulme and Shepherd, 2003; Barrett, 2005; Shepherd, 2011) and socially disaggregated (Daw et al., 2011). Dimensions of poverty that are regularly measured in the development literature are often living standard based, encompassing basic needs (e.g., access to clean water, sanitation and electricity), education and health. At the same time, the dynamics of poverty can be stochastic or structural, whereby stochastic poverty is driven by factors beyond the control of the household (e.g., droughts or floods impacting agricultural incomes) and structural poverty is perpetuated for individuals or households who lack access to productive assets, such as land, often underpinning persistent or chronic poverty (Carter and May, 2001; Adato et al., 2006; Carter and Barrett, 2006). Therefore, efforts to alleviate poverty in a specific setting must take account of the prevailing dynamics households are facing.
The formal interface between ES and poverty alleviation in the literature is relatively new, although, the development of this multi-disciplinary field has benefitted from a rich literature in both the ecology and development realms (Daw et al., 2011; Fisher et al., 2013). Further, this field remains relatively nascent when it comes to understanding the ecological underpinnings of the dynamics between ES and poverty alleviation, with articles often solely focusing on provisioning ES, such as yields, and rarely considering more than three dimensions of poverty (Suich et al., 2015). There are few studies investigating poverty alleviation in cash-crop, agro-forest contexts, much less in the cocoa sector. At the same time, relatively basic understanding of the agro-ecosystem underpinning cocoa smallholder production is still under development (Leakey, 2014). Indeed, little research, thus far, has considered a more holistic view of cocoa cultivation and there remains a dearth of knowledge on the dependence of cocoa production on its surrounding ecology. The largest focus of ES research in cocoa cultivation has been on the importance of maintaining shade for ecological co-benefits (e.g., biodiversity conservation and carbon sequestration) (Zuidema et al., 2005; Tscharntke et al., 2011; Blaser et al., 2018); however, there are other “ecological” cultivation strategies that can be harnessed by farmers to impact cocoa yields, such as weeding, composting, pruning and intercropping. In light of these gaps in the literature, we present an integrated approach that combines detailed ecological and socio-economic data to produce a novel case-study of an African forest-agriculture landscape. We compared and contrasted ecological and traditional methods of intensification in a cocoa-dominated landscape and their potential impacts on community-averaged poverty outcomes.
Study System
Smallholder agroforestry systems, such as cocoa, are recognized as having the potential to alleviate poverty (Cerda et al., 2014), mitigate climate change (Montagnini and Nair, 2004), and conserve biodiversity (Schroth et al., 2004; Tscharntke et al., 2005, 2012), sometimes all at once (Tscharntke et al., 2011; De Beenhouwer et al., 2013). Cocoa is native to South America, but is currently the fastest growing agricultural commodity across Sub-Saharan Africa (Ordway et al., 2017). West Africa produces 70% of cocoa globally and the sector supports about two million farmers. Ghana is the second largest exporter of cocoa globally, after neighboring Côte d'Ivoire, with more than half its production managed by smallholders with farms of 2 ha or less (Anim-Kwapong and Frimpong, 2005). The Government of Ghana has made commitments to increase national annual production to one million tons, up from an annual average of 800,000 tons (Kpodo, 2017).
Management of cocoa across Ghana is relatively intensive (Freud et al., 1996). Ghana is among the driest regions growing cocoa, with rainfall as an important predictor of the following year's harvest (McKinley et al., 2016). Cocoa trees flower and produce pods throughout the year, requiring continuous investment in labor by farmers, although there are generally two peak harvests a year (known as the heavy and light crop) (Glendinning, 1972). Historically, cocoa cultivation followed a “boom-and-bust cycle,” whereby aging and under-productive cocoa farms were abandoned in favor of establishing new farms under recently thinned forest (Clough et al., 2009; Tscharntke et al., 2011). This trend has continued, particularly at the expense of forestry concessions in Ghana (Tutu Benefoh et al., 2018), although Ghana's Cocoa-Forest REDD + Programme (GCFRP) was recently established to better monitor this practice.
For this study, we monitored 36 farms during pollination, pod development and harvesting of the 2014/15 heavy crop. Our study landscape is located around the Kakum Conservation Area in Ghana's Central Region, which allowed us to assess whether proximity to a protected forest area had a net benefit on cocoa yields. We collected data on flowering, disease incidence, micro-climate, soil fertility, and shade tree characteristics in order to develop a cocoa yield model that allowed us to identify the key ecological and management factors contributing to cocoa productivity in a smallholder system. Using this model and considering the yield factors that a farmer could realistically influence, we estimate potential maximum yields and subsequent income increases across monitored farms. From a household survey we undertook in the region and empirically observed relationships between cocoa income and poverty (Hirons et al., 2018b), we estimate the possible impact of modeled yields on household poverty outcomes. These methods allowed us to ask the following research questions: (i) what are the ecological limits to cocoa production; (ii) if specific limits can be relaxed, what is the potential to increase yields and improve incomes; and (iii) how might cocoa income improvements affect household living standards?
Materials and Methods
Study Area and Sampling Design
Our study site is a cocoa-dominated landscape surrounding the Kakum Conservation Area (5°26′53″, N1°20′42″W), comprising the Kakum National Park and the adjacent Assin-Attandanso Resource Reserve, in Ghana's Central Region. Kakum was gazetted in 1992, covers 37,500 ha and is predominantly in the moist evergreen forest zone. Annual precipitation ranges from 1,200 to 1,400 mm per year and average temperatures 24 to 27°C. Soils are primarily weathered oxisols with high sand content. Elevation ranges between 0 and 200 m above sea-level, with a mean of 100 m. As we were interested to assess the influence of intact forest and shade management on ecosystem services (ES) to cocoa yield, we stratified the placement of our plots by distance from forest edge (e.g., 100, 500 m, 1 and 5 km) and shade level. We established three transects of 5 km, with three replicate plots per chosen forest distance. These transects intersected six communities consisting of predominantly cocoa-growing households. We established cocoa monitoring plots with 36 farmers whose combined area of cocoa cultivation totalled 163 ha, sampling across a forest-agriculture landscape of roughly 25,600 ha.
Yields, Farm Management, and Ecological Data Collection
All established plots were 60 m by 60 m, consisting of nine 20 m by 20 m sub-plots, within which all trees >10 cm diameter at breast height (DBH) were tagged, identified to species and measured, which was consistent with Global Environmental Monitoring (GEM) protocols (Marthews et al., 2014). In five sub-plots of area 10 m by 10 m, trees with DBH between 2 and 10 cm were measured. These measurements provided estimates of carbon stock, cocoa density, shade tree density and plot-level tree diversity. Canopy gap over cocoa trees was calculated by averaging leaf area index (LAI) photos taken at 4.5 m above the ground for all nine sub-plots. Eighteen cocoa trees were randomly chosen, two per sub-plot, for monthly disease measures. All ripe and unripe pods were counted by size class (S- 5-10 mm, M- 11-60 mm and L- >60 mm), all over-ripe pods by size class, number of pods infected with black pod (Phytopthera palmivora or Phytophthera megakarya), number of pods attacked by mammals, number of pods attacked by cocoa pod borer (Conopomorpha cramerella), intensity of capsid attack (e.g., number of lesions per infected pod), evidence of stem borer attack (Distantiella theobroma or Sahlbergella singularis), presence of epiphytic parasites (e.g., mistletoe, Tapinanthus bangwensis), presence and number of ant tents (known as conduits of black pod infection) and volumetric water content of soil near the tree.
Four trees in the central sub-plot were visited for monitoring pollination and cherelle set. Each month flower buds, open flowers, new cherelles, wilted cherelles, marked cherelles, and pods by size class (S-L) were counted using the protocols outlined in Frimpong et al. (2009, 2011). Pollinator collections were undertaken during a subset of months (e.g., during peak flowering and to contrast wet and dry season communities) following (Frimpong et al., 2009). During these collections distance to rotting biomass measures were taken. The types of biomass we noted were rotting banana trees and piles of harvested cocoa shells, both known to be preferred larval habitat for cocoa's chief pollinators (Glendinning, 1972; Winder and Silva, 1972; Young, 1982; Adjaloo et al., 2013). Soil samples were collected from all plots for the top 30 cm to assess bulk density, soil pH, soil texture, nutrient content (N, P, K, etc.), cation exchange capacity (CEC) and carbon content following ClimAfrica protocols (https://www.climafrica.eu). Micro-climate was monitored in all plots using a combination of Campbell Scientific ground stations and Lascar USB dataloggers. Daily calculations of mean temperature, max temperature, minimum temperature and maximum vapor pressure deficit were made. Evaporative water demand was also calculated per plot based on precipitation and radiation measurements made from one automatic weather station established in a study community and plot-level mean temperature using the equation (Turc, 1961):
Where ET0 is the reference crop evapotranspiration, Tmean is daily mean temperature (°C), Rs is solar radiation (MJ m−2 d−1), λ is the latent heat of vaporization (MJ kg−1) given as 2.45, aT is 1.0 if RHmean is 50% or 1.0 + (50- RHmean)/70 where RHmean < 50%. Plot-level infiltration rates were estimated from measured soil texture and combined with hourly precipitation measurements to estimate plot-level, daily infiltration and run-off. Water stress (mm) was calculated per month by summing daily differences in ET0 and soil infiltration estimates.
Final yield calculations were made by summing monthly per tree yields derived from our disease survey and estimating dried bean weights from pod weight field measurements, focusing on the months the Ghana Cocoa Board considered to be the heavy crop harvesting period (October 2014–June 2015). Plot-level per tree yield estimates, for our ecological production function, were the median values of our 18 monitored trees. Disease incidence, pollination and micro-climate were averaged over the same time period, as in theory pods are harvested continuously throughout this season.
Income Calculations
To relate our field measurements to our household survey's reported income values, we calculated the cash income the farmer would have received from their harvests per hectare using Equation (2).
Where R is the per hectare revenue generated from the farm (cedis ha−1), yt is the measured median yield per tree (kg tree−1), Cd is the cocoa tree density for that farm (tree ha−1), Cpis the government established cocoa price for the relevant year (cedis/65 kg bag).
To calculate each farmer's per hectare net farm margin we used Equations (3–5), where variable (e.g., chemical inputs, LBC and sharehold) and fixed (e.g., labor, rent etc.) costs were subtracted from R.
Where Nfarm is the net farm margin (cedis ha−1), V is the variable costs and F are the farm's fixed costs.
Where LBCloss is the proportion of dried beans weight that licensed buying companies under weigh the farmers' harvests, S is the proportion of the harvest the farmer must share with the landowner (if applicable) and I are the cost of inputs the farmer reported purchasing.
Where r is the rent a farmer pays per hectare and L is the per hectare cost of harvesting and weeding labor reported in our survey.
Transportation costs for inputs were included in their reported values and, as LBCs were physically located within the communities, transport costs for bean sale were considered to be negligible. Monetary values are reported in US$ using a conversion factor of 0.23.
Household Survey
Our household survey questions were based on survey modules for Ghana (http://www.ophi.org.uk/2013-country-briefings/) as well as missing dimensions modules (http://www.ophi.org.uk/research/missing-dimensions/survey-modules/) from the Oxford Poverty and Human Development Initiative (OPHI). They were then adapted following piloting and focus groups. These themes were further explored in detail through in-depth interviews with plot farmers and a series of focus groups (6 male groups, 6 female groups). Household surveys were conducted with the 36 farmers working on our monitored plots and an additional 72 randomly sampled (gender stratified) households, evenly distributed across our 6 study communities. These surveys addressed farm management, different dimensions and dynamics of poverty, and access to key institutions. Specifically, data was collected on: fertilizer and other input use, weeding and harvesting labor, yield variability, shade tree decision-making, access to credit and extension, household demographics (size, age, ethnicity, and gender), land tenure arrangements, other assets, living standards, security, cash expenditure and income as well as overall household satisfaction and choice. More details on our approach can be found in Hirons et al. (2018b).
Poverty Metrics
We assessed poverty using multi-dimensional measures; however, we linked these measures to our ecological data using cocoa income and income quartiles. Therefore, to determine the importance of cocoa income to key dimensions of poverty we compared poverty measures across cocoa income and income quartiles. The indicators we chose for our basic needs index were access to clean water, sanitation and electricity, whereby households scored 1 for each indicator and those that did not scored 0. For assets, data was collected on 12 important assets, although preliminary analysis indicated owning a TV (0 or 1) was the most informative. For education, households were asked if their child had missed school in the past year, the households that had were scored 1 and those that had not scored 0. For health the widely used under 5 mortality indicator was used, with 0 being assigned to households that had experienced a loss and 1 being assigned where it had not. Finally, food security was measured as whether a household reported having access to an adequate amount of food throughout the year, 0 for households that did not and 1 for households that did. Statistical differences between income quartiles were tested using Analysis of Variance (ANOVA) and logistic regression used with income as a continuous variable (Table S2).
Ecological Limits to Yields
Development of our ecological production function was performed using R v. 3.2.3 (R Core Team, 2018) and the mcgv package (Wood, 2011, 2019). Candidate variables for analysis were chosen based on Table S1 and checked for collinearity, particularly within hypothesized categories of identified ecological processes. Generalized additive models (GAMs) were fit with a Gaussian link after confirming errors were normally distributed (Figure S1), using restricted maximum likelihood (REML) and thin plate regression spline (TPRS) smoothers for each variable. We modeled yields for the median tree of all 18 monitored trees per farm resulting in 36 replicates. We allowed each variable to be penalized to zero to remove poor predictors.
Improving Yields and Incomes
To relate our field measurements to our household survey's reported income values, we calculated the cash income the farmer would have received from their harvests per hectare using our estimated median tree yield and measured cocoa density. We were aware that the final cocoa bean weight a farmer receives is dependent on scales managed by community-embedded purchasing clerks, who represent a number of licensed buying companies (LBCs). We were not able to weigh all beans harvested during our first year of monitoring; however, throughout the subsequent harvest season (2015/16) we weighed all dried beans that were sold by our monitored farmers on a part of their farm that was contiguous with our plot. A member of our team recorded the weight the farmers were paid for by the LBC. We made a note of any discrepancies in the two weights and took an average “LBC loss” value for the season. We assumed this loss to LBCs from the 2015/16 harvest to be the same for the 2014/15 harvest and, therefore, for this analysis consider it to be a “variable” cost much like a sharehold being extracted from the farmers.
Using the final ecological production function, we chose a subset of influential factors we felt farmers could realistically manage in a short time frame and estimated theoretical yields for each monitored farm by maximizing these factors separately and all together. From these new yield estimates and reported farm sizes, we calculated potential landscape-scale increases in yield and report proportional increases for each factor explored. To calculate potential net margins from increased yields, we first estimated higher input costs for the two “traditional” intensification methods using derived relationships between existing yield and inputs and labor costs (Figure S2). As labor outlays were not significantly related to yields, we focused on extrapolating higher chemical input costs from increasing yields and assumed unchanged labor costs. We then calculated new income levels and net farm margins under these new conditions using Equations (3–5). Reported net margins are based on field-estimated incomes, which often differed from household survey reported incomes. In order to relate estimated increases in net margins to household survey reported incomes, we calculated proportional increases in net margins. This was straightforward for the cases where original net margins were positive. However, when original net margins were negative and potential net margins were still negative, we assumed no change in reported incomes, whereas for the cases where original net margins were negative and potential net margins were positive, which depending on the factor occurred for up to 10 farms at a time, we calculated proportional increases in income without considering outlays (e.g., estimated potential revenue from the farm divided by estimated current revenue for the farm).
Poverty Outcomes
To explore the potential impact of these yield increases on household poverty outcomes, we first looked at how the combined estimated increase in income of our monitored farmers for each management factor would be distributed across income quartiles. This was intended to assess whether more intensive vs. less intensive management options would be beneficial to poorer or wealthier farmers. Then, for the poverty dimensions identified as being correlated to cocoa income, we evaluated whether the scale of increased income would be of the magnitude we observed would be required to significantly change predicted household outcomes. We used relationships derived from logistic regression of the complete household survey (n = 108) and assumed that households adopting optimal management options would have similar poverty profiles to those households already managing optimally, to estimate the probability of a household experiencing a particular poverty outcome based on the estimated increase in cocoa income. We reported the average probability across monitored farms at current incomes and again for each identified management factor to explore potential impacts at the community-scale. More detailed description of our methods and results for this aspect of our study can be found in Hirons et al. (2018b).
Results
Ecological Limits to Yield
Our analysis generated an ecological production function with seven key predictors of cocoa yield (Figure 1). The final model was checked for bias and predictive power (Figure S1). Yields were higher on farms that applied fertilizers more regularly. Application rates in our study varied from 0 to 7 times per year, although these rates were calculated as annual averages after asking farmers how many times they applied fertilizers in the previous 5 years. Our analysis also included the volume of fertilizer farmers reported using in the year of monitoring, but this variable was not significant, suggesting that consistently applying fertilizer inter-annually was more influential. Yields were higher if cocoa trees were closer to rotting plant biomass, which included banana tree stems, piles of harvested cocoa shells, rotting fruit fallen from on-farm fruit trees and palm fronds. This variable was included as a measure of potential breeding resources available to pollinating insects (cocoa is midge-pollinated), and hence a proxy for pollinator abundance and diversity. Measured distances to rotting biomass ranged from 7 to 60 m, with trees where no rotting biomass was visible given a value of 100 m. Planting densities of cocoa trees ranged from 30 to 840 trees ha−1. Per tree yields were higher on farms with a relatively higher planting density of cocoa trees. Higher densities were considered to be a proxy for intensity of management as well as beneficial for enhancing pollinator visitation of open cocoa flowers on tree trunks. Yields were higher on farms with lower capsid incidence, proxied by the percent of pods attacked averaged over the growing season, which varied from 0.23 to 17.4%. Yields decreased with increasing distance from primary/secondary forest, with the maximum distance being 5 km. To consider whether age of cocoa farm was a factor related to forest distance, we modeled relationships between distance from forest and age of cocoa farm as well as soil characteristics such as available phosphorus, the ratio of carbon to nitrogen and potassium. None of these were significant (Figure S3), suggesting ES benefits from remnant forest habitat to cocoa yields are significant and are not a function of an aging forest frontier. Canopy gap and soil moisture remained in the final model, although they were not individually significant.
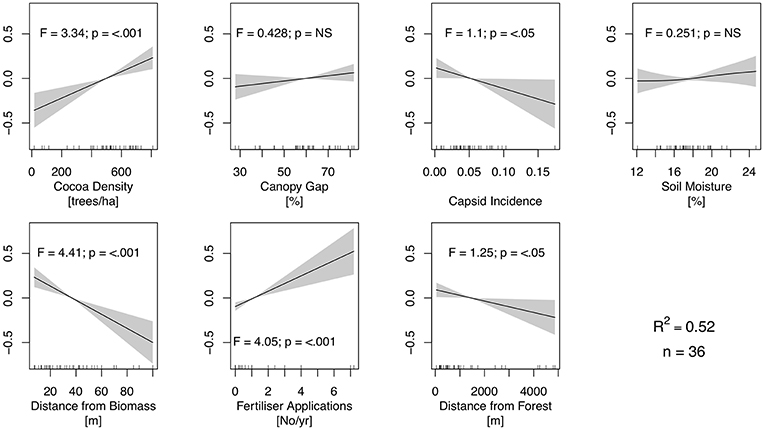
Figure 1. Ecological production function. These are the key factors influencing per tree yields with effect sizes presented over the range of measured values and confidence intervals estimated using a generalized additive model (GAM). Significance of factors are presented by F-values and p-values. The dependent variable is median tree yield calculated from 18 trees for each of 36 farms monitored. R-squared value and sample size are presented.
Potential to Improve Cocoa Yields and Income
We explored the potential to improve cocoa yields and income in a two-stage process. First, we used the ecological production function to estimate realistic improvements in cocoa yields assuming farmers were able to lower capsid incidence through pesticide application, more consistently apply fertilizers throughout and between years as well as distribute more rotting biomass within their farms through changes to composting practices. We focused on these three variables as we felt farmers could manipulate them within a reasonable time frame. The first two variables can be considered “traditional” intensification options and the third an “ecological” intensification option. We estimated potential yield improvements using maximum or minimum levels of these variables observed within our study farms, depending on the sign of the relationship. The resulting farm-level yield improvements for each plot are shown in Figure S4 for each factor separately and all factors combined. Extrapolating the per farm yield increases to the land-scape scale showed a potential increase of total cocoa bean production of 14 ± 37, 31 ± 38, 67 ± 49, and 113 ± 60% for reducing capsid incidence, increasing rotting biomass in the farm, increasing inter-annual fertilizer application rates and combining all activities, respectively (Figure 2).
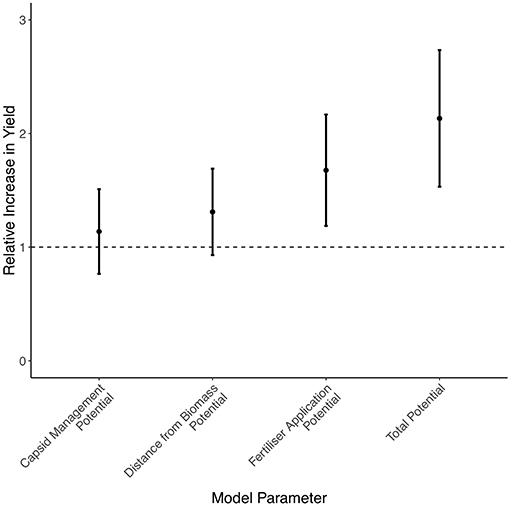
Figure 2. Potential community-level increase in yield. Using the identified factors influencing per tree yields, potential yield increases were calculated per farm and proportional increases in yield at the community level estimated. Ninety-five percent confidence intervals are depicted.
Next, we calculated cocoa net margins for our study farms based on current yields and associated production costs. Among these costs, we documented significant errors in final cocoa bean weights by community-based purchasing clerks of the major cocoa licensed buying companies (LBCs), which ranged from 7 to 52%, with a mean of 17%1. We then calculated new net margins for each farm based on the potential yield improvements estimated from our ecological production function and associated production costs generated from Figure S4. According to our estimates ~30% of monitored farmers, during this year of monitoring, expended more cash on cultivation than they earned in cocoa bean sales. This could be due to a number of a reasons. For instance, farmers may have overestimated their cash outlays for labor and chemical inputs during the household survey or, due to the almost continuous management and harvesting of their cocoa trees throughout the year, farmers were not able to predict whether their bean sales were going to compensate for their investments. If losses to LBCs are removed, the number of farmers operating at a loss would drop to ~21%. After taking account of estimated yield improvements the number of farms operating at a loss would be reduced to 23, 18, 15, or 5% by reducing capsid incidence, managing rotting biomass, increasing fertilizer application rates or combining all three activities, respectively (Figure 3). Increases in median net margins across all farms were 0, 44, 49, and 190%, respectively.
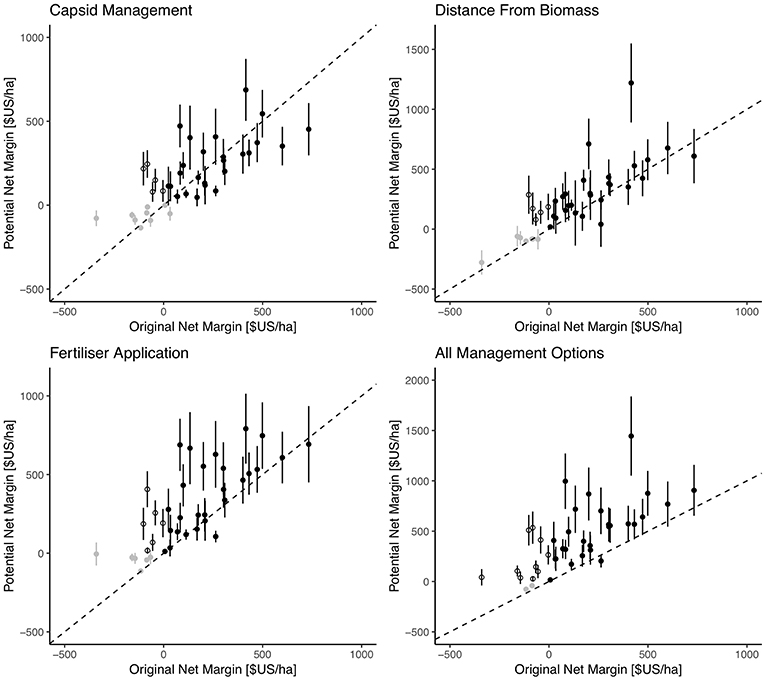
Figure 3. Comparison of current and potential net margins. Net margins were calculated for each farm (see Materials and Methods for details) for monitored yields and reported fixed and variable costs and compared to modeled yields and input costs for each factor explored. Gray points indicate farms where net margins remained negative after yield increases and hollow points indicate farms that went from negative to positive net margins. Dotted lines represents 1:1. The assumed exchange rate was US$ 1 to GHS 4.5.
Poverty Outcomes
Ninety-seven percent of households in our household survey (n = 108), which included our monitored farmers, received at least some income from cocoa, varying between 4 and 100% (average of 45%) of income from all sources. Also, comparing cocoa incomes of our monitored farmers with our household survey, we find their median cocoa income was US$466 compared to US$377, suggesting our sample of monitored farmers has a slight skew toward farmers with higher cocoa incomes than the community at large. By looking at the distribution of potential income benefits across income quartiles of our monitored farmers, we found that the wealthiest quartile consistently captured ~70–81% of total additional income, while the poorest households hovered around 1.3 and 2.3 % (Figure 4). Greater application of rotting biomass had the largest benefit for the wealthiest households and the more intensive options were proportionally more beneficial for the poorest households. There was more variation for the two middle quartiles across management factors, with greater fertilizer application and combining all options being the most beneficial.
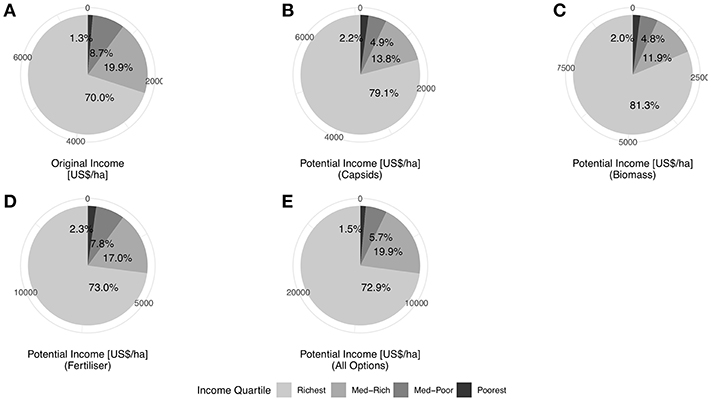
Figure 4. Estimated distribution of income across quartiles. By summing total income and potential incomes across monitored farms, we estimated the proportion of income for each cocoa income quartile. (A) Presents current reported distribution of income, (B) distribution of increased incomes due to capsid management, (C) distribution of increased incomes due to changes in rotting biomass management, (D) distribution of increased incomes due to greater fertilizer application, and (E) distribution of increased incomes if all options are adopted.
To explore the potential implications of increased incomes from higher yields on household poverty outcomes, we assessed poverty using multi-dimensional metrics (Table S2), and followed a two-stage process. First, we identified the poverty dimensions that appear to be related to cocoa incomes using our household survey data. We found that cocoa incomes were related to three poverty dimensions (measured by relevant indicator): education (a child was less likely to miss school as cocoa incomes increased), assets2 (a household was more likely to own a TV as cocoa incomes increased) and food security (a family was more likely to have adequate access to food throughout the year as cocoa incomes increased). In contrast, household income was not related to indicators for access to basic needs (access to electricity, clean water and sanitation) or health (under five mortality or reported adequate access to health care). Cocoa income as a continuous variable was significantly related to our education and assets indicators, while food security was only correlated to cocoa income quartiles. However, for all three metrics, the only significant difference in outcomes was between households within the poorest and wealthiest income quartiles (e.g., Q1 and Q4, Table S2) and, therefore, this suggests only very large increases in cocoa income would have a discernible effect on these metrics. While there may be several complementary activities that could improve the outcomes of these indicators, we focused our analysis on the scale of income increase from enhancing cocoa yields that would be feasible given the ecological constraints we identified. We then estimated potential changes in the probabilities of identified poverty indicators using these calculated incomes for each household for education and assets (Figure S5) and recalculated membership to originally delineated income quartiles for food security (Figure S6). Instead of reporting per household changes in probability, we averaged the probabilities across our monitored farms to compare the potential benefits of cocoa yield increases at the community-scale for each management factor (Figure 5). For whether a child would miss school, management interventions around capsids, rotting biomass, fertilizer applications or all options combined reduced current community-scale probabilities from 47 to 42%, 40, 38, and 31%, respectively. Regarding the probability a household can acquire assets, management interventions around capsids, rotting biomass, fertilizer applications or all options combined increased current community-scale probabilities from 40 to 46%, 48, 51, and 59%, respectively. Finally, for the probability that a household would have access to an adequate amount of food, management interventions around capsids, rotting biomass, fertilizer applications or all options combined increased current community-scale probabilities from 62 to 72%, 73, 74, and 79%, respectively.
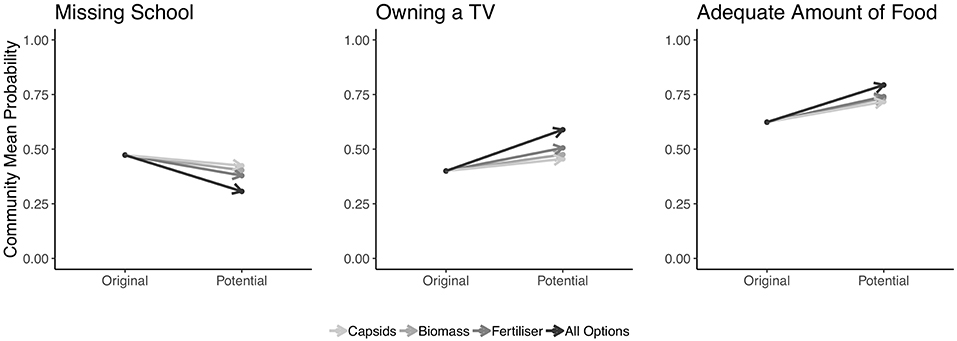
Figure 5. Community Changes in Poverty Indices. Paired data plots showing changes in household poverty measures, averaged over the community, based on “original” conditions compared with changes expected if cocoa yields and incomes were improved for each factor separately and all together.
Discussion
Relaxing Ecological Limits
Our analysis explored management options for farmers to maximize their yields without considering their capacities to do so. This was a conscious decision to push the limits of this forest-agriculture system to assess the extent to which large-scale yield improvements were feasible through farm-level interventions, and the impact of such increases on poverty. We identified factors a farmer could influence related to soil nutrient mining, pest control and maintenance of beneficial insect habitat (e.g., pollinators). Farmers that reported applying chemical fertilizers relatively more frequently inter-annually had a distinct yield advantage over those who applied less frequently or not at all, which is consistent with previous studies (McKinley et al., 2016). We found capsid attack had a negative effect on yield, though we did not see a direct relationship between pest incidence and reported pesticide application rates and, therefore, in future we will be exploring other mechanisms that could be controlling capsid incidence, such as natural pest control. Nevertheless, for this analysis we assumed capsid management and greater fertilizer application to be more intensive farm management options, requiring higher cash outlays. Conversely, dispersing more rotting biomass around the farm, such as intercropping with banana and leaving the labile biomass to rot in close proximity to flowering cocoa trees, would be a method available to farmers with lower capacities to intensify their production (Waldron et al., 2012). It was interesting to note from our income analysis, that increases in yields from less intensive methods had proportionally higher benefits to the wealthiest households, while adopting more intensive methods had a proportionally higher benefit to the poorest households. This would suggest what methods farmers within these income quartiles are already using. We found canopy openness to have a marginal influence, which somewhat contradicts previous studies assuming a trade-off between shade management and yields (Zuidema et al., 2005; Blaser et al., 2018). However, this could be related to the relatively small variation in shade management we encountered and that we were not comparing smallholder plots with intensively-managed, mono-cropped cocoa farms. This relatively uniform shade management could be related to government policies on tree tenure acting as a disincentive to maintain more than a minimum number of shade trees (Hirons et al., 2018a). Regarding location in the landscape, we detected a small yield benefit for farms within 1 km of a contiguous forest area, suggesting an economic benefit forest conservation is having in this landscape for those able to benefit directly from cocoa cultivation. We did not see a yield signal related to black pod incidence; however, as monitored prevalence across these farms was <5%, we suspect our study site is less-prone to this pest due to lower annual rainfall than other cocoa growing regions.
It has been documented in several smallholder cocoa growing regions in West and Central Africa that adequate fertilizer application is rare (Jagoret et al., 2011; Asare et al., 2017), which is consistent with what we have observed across our 36 farms. However, we also noted that cocoa yields were not related to the volume of fertilizer applied during the year of monitoring, but instead an estimate of the number of times a farmer had applied fertilizers in the previous 5 years. We found that only six farmers reported applying fertilizers more than twice a year and, therefore, the confidence intervals around this factor in Figure 1 increase significantly with reported applications. We also recognize that this measure is only a rough estimate of fertilizer volumes and, therefore, does not allow us a mechanistic understanding of its influence on yields. At the time of writing, research is ongoing as to the optimal fertilizer management for cocoa cultivation, particularly with respect to addressing declining soil fertility in smallholder systems (Koko, 2014). More broadly, there is a dearth of data collected from smallholder systems, which is increasingly being recognized by development donors (Tollefson, 2018), with the majority of agronomic best practice based on recommendations from highly-controlled trials performed ex situ by research institutes. As a result, we view this study as contributing valuable data on the ecological and social reality of smallholder cocoa farming in Ghana, which is one of the largest producers of cocoa globally and almost entirely dependent on smallholders.
Comparing the yield potentials from identified ecological and intensive management options for landscape-scale estimates reveals the limited scope of purely ecological intensification for realizing significant yield and income improvements. On the other hand, our net margin estimates for more traditional intensification methods show much higher uncertainty in yield potentials as well as little net economic benefit to farmers, particularly in the lowest two cocoa income quartiles, suggesting a possible conflict between the national government's cocoa production targets and poverty alleviation goals.
Alleviating Poverty
School attendance and asset acquisition were found to be the most strongly correlated with cocoa incomes, suggesting that if farmers were to adopt optimal management practices, we might expect to see these poverty indicators exhibit the most improvement. The ability for farmers to be able to afford more advanced education for their children (Nukunya, 2003), who then often aspire to non-farm related livelihoods (Anyidoho et al., 2012), is an important driver of social mobility in Ghana. In addition, the ability to afford adequate farm labor would lessen the expectation of school-age children to help on the farm and, therefore, would likely result in higher school attendance. The impact on asset acquisition in general, not specifically televisions (see section Materials and Methods), also suggests a potential transformation for the community, buttressing those households from the more pernicious effects of structural or chronic poverty. Smallholder farmers have traditionally had a difficult time growing out of poverty through yield increases on their two-hectare-or-less farm; therefore, efforts to alleviate poverty at the community level should consider unequal access to land (Jayne et al., 2003, 2018; Barrett et al., 2006) and how women are disproportionately affected (Friedman et al., 2019). In addition, we found a substantial loss of income due to imprecise scales managed by the purchasing clerks of LBCs based in each community. The proportion of income loss was negatively related to volume of beans sold, suggesting a regressive mechanism of “wage theft” that was disproportionately impacting less productive farmers. While, net margins for almost all of our farmers increased following yield enhancements, providing farmers with a more transparent weighing system would also result in a significant improvement in incomes. Finally, from our household survey we observed that the wealthiest quartile had better access to extension services, which would likely result in more productive farms and higher incomes (Hirons et al., 2018b).
We found some aspects of farm management to be affected by government policies; such as low rates of fertilizer application potentially due to inconsistent and unequal distribution of subsidized fertilizers over the past several years. Fertilizer subsidies appear to have had the effect of dampening the market for direct fertilizer purchasing and may have contributed to the current low rates of fertilizer application (Jayne et al., 2018). As a national policy, focusing on distribution of private goods, such as fertilizer, has fewer development benefits than investments in public goods, such as access to extension services (López and Galinato, 2007). However, when combined with improved planting material, higher fertilizer application rates have achieved the largest yield improvements on the continent (Dzanku et al., 2015). Another potential policy trade-off relates to the government's pursuit of Climate Smart Cocoa (McKinley et al., 2016), which includes advice on minimizing carbon emissions from cocoa cultivation. Yet efforts to increase yields through greater nitrogen fertilizer application could increase nitrous oxide emissions (Hickman et al., 2015). Cocoa is also considered to be vulnerable to predicted temperature increases due to climate change (Schroth et al., 2016). At the same time, several multi-national chocolate companies have made commitments at the recent Conference of the Parties (COP) in Bonn to remove deforestation from their supply chains (UNFCCC, 2017), putting further pressure on improving productivity on existing cocoa areas that may become increasingly marginal.
Due to the large amount of ecological data required to understand the yield gaps acting on cocoa farms, we recognize that our analysis is biased toward this sole livelihood stream when assessing poverty alleviation potentials. From our household survey data, we know that our study communities are largely dependent on cocoa production; however, they also report they receive income from an average of five income streams, the top two after cocoa being annual crops (~8%) and petty trading (~6%) (Hirons et al., 2018b). Therefore, to produce an exhaustive analysis of all of the ecologically-dependent mechanisms available to farmers to improve their household poverty outcomes, additional data would be needed that was beyond the scope of this study. In addition, we recognize that there are dimensions of poverty linked to services provided by government (e.g., the National Health Insurance Scheme), including access to electricity, drinking water, adequate sanitation, and health centres. Not surprisingly, we found that these poverty metrics did not relate to household income, largely due to the isolated nature of these communities. We appreciate that our study design is not able to capture the indirect effects of increased household income at the community level. These indirect effects could be an increased demand for non-farm labor, thereby, contributing to rural development through enhanced employment (Kassie et al., 2011; Jayne et al., 2018).
Conclusion
There are several structural factors that need to change for smallholder farmers in Africa to realize significant increases in productivity (Jayne et al., 2018). Through our novel combination of ecological and household socio-economic data, we find that relying solely on improvements in farm productivity to reduce poverty rates is limited. We identify the specific poverty indices a farmer could improve through enhanced yields (e.g., child school attendance, food security, and ability to acquire assets) and the several indices that would be better served by community-level infrastructure investments (e.g., access to clean water, electricity, sanitation, and a health center). We chose to focus on identifying the agro-ecological limits to direct increases in incomes in this agricultural system, which few, if any, studies have really grappled with. While we find that productivity gains may be large if both ecological and traditional intensification options are adopted, with concomitant national benefits on foreign exchange from cocoa exports, ecological intensification (e.g., enhanced composting) alone realizes marginal yield and income improvements and, for intensive management adoption (e.g., greater fertilizer and pesticide application), income gains are minimal for the poorest farmers after accounting for increased purchasing of chemical inputs. Multiplier effects of increases in household income on domestic consumption could lead further to noticeable improvements in community-level, poverty outcomes, but were beyond the scope of this study to explore. The literature asserts that economic growth in rural areas is necessary for achieving significant poverty alleviation globally (Byerlee et al., 2009), which our findings support; however, we have identified several important trade-offs for national governments and donor agencies to consider when designing agricultural interventions intended to improve farmer poverty outcomes. For instance, our results suggest that improving yields through greater fertilizer application could have trade-offs for farmer incomes and national greenhouse gas emission targets. Finally, in an attempt to counteract the increasing compartmentalization of social vs. natural science-led studies in the rapidly maturing field of ES (Abson et al., 2014), we hope this study will enhance understanding of some of the myriad links between ES and poverty alleviation.
All analytical datasets and R code will be made available upon publication, either hosted on the University of Oxford's online research archive (ORA) or with the Nature Environment Research Council (NERC) Environmental Data Center.
Ethics Statement
This study was carried out in accordance with the recommendations of the Statement of Ethical Practice for the British Sociological Association (www.britsoc.co.uk/about/equality/statement-of-ethical-practice.aspx) and the University of Oxford's Central University Research Ethics Committee (CUREC), with written or verbal informed consent from all subjects. Given the non-sensitive and non-physical/medical nature of the survey instrument, and the non-involvement of potentially vulnerable participants (e.g., there were no children involved), verbal informed consent was deemed acceptable. Especially in the case where respondents may be made to feel uncomfortable if, for example, they were illiterate and not able to sign a hard-copy paper form. This was considered to be consistent with the Statement of Ethical Practice for the British Sociological Association, whereby [the researchers] will describe the nature and objectives of the study in appropriate detail and in terms meaningful to participants. They will offer them the option of providing verbal consent and/or signing a written consent form. The option of verbal consent may be preferred by some of the rural residence farmer participants [who may, for example, be illiterate]. The protocol was approved by the University of Oxford's Central University Research Ethics Committee (CUREC).
Author Contributions
AM, MH, RA, JM, SA-B, EB, CM, ER, YM, and KN designed the research. AM, MH, MA, MQ, and RS collected the data. AM, MH, KN, and RS performed analysis and interpretation. AM, MH, and KN drafted the paper.
Funding
This work Exploring the ecosystem limits to poverty alleviation in African forest-agriculture landscapes (Project Code NE/K010379-1), was funded with support from the Ecosystem Services for Poverty Alleviation (ESPA) program. The ESPA program is funded by the Department for International Development (DFID), the Economic and Social Research Council (ESRC) and the Natural Environment Research Council (NERC). YM is supported by the Jackson Foundation.
Conflict of Interest Statement
The authors declare that the research was conducted in the absence of any commercial or financial relationships that could be construed as a potential conflict of interest.
Acknowledgments
The authors are grateful to the following individuals, institutions, and communities for supporting this research in the field, including: Robert Bamfo and Yaw Kwakye of the Climate Change Unit, Ghana Forestry Commission; Enoch Ashie and Mohammed Adams of Ghana's Wildlife Division; Prosper Kapoti of the Nature Conservation Research Center and the people and leaders of Assin Homaho, Nsuakyi, Kwame Amoabeng, Tufokrom, Aboabo, and Asorefie (Assin South District).
Supplementary Material
The Supplementary Material for this article can be found online at: https://www.frontiersin.org/articles/10.3389/fsufs.2019.00057/full#supplementary-material
Footnotes
1. ^It is widely known in Ghana that this is a problem; however, few studies have been able to properly document this discrepancy. We continue to work with our local partners to raise awareness about this issue.
2. ^Owning a TV was selected to be the indicator for assets as it showed the highest correlation with potential asset indices derived from Principle Component Analysis (PCA) and was the most consistent approach for comparing with non-indexed indicators for our other poverty dimensions of interest.
References
Abson, D. J., von Wehrden, H., Baumgärtner, S., Fischer, J., Hanspach, J., and Härdtle, W. (2014). Ecosystem services as a boundary object for sustainability. Ecol. Econ. 103, 29–37. doi: 10.1016/j.ecolecon.2014.04.012
Adato, M., Carter, M. R., and May, J. (2006). Exploring poverty traps and social exclusion in South Africa using qualitative and quantitative data. J. Dev. Stud. 42, 226–247. doi: 10.1080/00220380500405345
Adjaloo, M., Banful, B. K. B., and Oduro, W. (2013). Evaluation of breeding substrates for Cocoa Pollinator, Forcipomyia spp. and subsequent implications for yield in a tropical cocoa production system. Am. J. Plant Sci. 4, 203–210. doi: 10.4236/ajps.2013.42027
Alkire, S. (2007). Choosing dimensions: the capability approach and multidimensional poverty. Chronic Poverty Research Center Working Paper (Manchester, UK), 88.
Alkire, S., and Foster, J. (2011). Counting and multidimensional poverty measurement. J. Public Econ. 95, 476–487. doi: 10.1016/j.jpubeco.2010.11.006
Anim-Kwapong, G. J., and Frimpong, E. B. (2005). Vulnerability of Agriculture to Climate Change- Impact of Climate Change on Cocoa Production. New Tafo Akim: Cocoa Research Institute of Ghana.
Anyidoho, N. A., Leavy, J., and Asenso-Okyere, K. (2012). Perceptions and aspirations: a case study of young people in ghana's cocoa sector. IDS Bull. 43, 20–32. doi: 10.1111/j.1759-5436.2012.00376.x
Asare, R., Asare, R. A., Asante, W. A., Markussen, B. O., and RÆBild, A. (2017). Influences of shading and fertilization on on-farm yields of cocoa in Ghana. Exp. Agric. 53, 416–431. doi: 10.1017/S0014479716000466
Barrett, C. B. (2005). Rural poverty dynamics: development policy implications. Agric. Econ. 32, 45–60. doi: 10.1111/j.0169-5150.2004.00013.x
Barrett, C. B., Carter, M. R., and Little, P. D. (2006). Understanding and reducing persistent poverty in Africa: introduction to a special issue. J. Dev. Stud. 42, 167–177. doi: 10.1080/00220380500404587
Beynon, S. A., Mann, D. J., Slade, E. M., and Lewis, O. T. (2012). Species-rich dung beetle communities buffer ecosystem services in perturbed agro-ecosystems. J. Appl. Ecol. 49, 1365–1372. doi: 10.1111/j.1365-2664.2012.02210.x
Bisseleua, D. H. B., Missoup, A. D., and Vidal, S. (2009). Biodiversity conservation, ecosystem functioning, and economic incentives under cocoa agroforestry intensification conservación de biodiversidad, funcionamiento del ecosistema e incentivos económicos en la intensificación de la agroforestería de cacao. Conserv. Biol. 23, 1176–1184. doi: 10.1111/j.1523-1739.2009.01220.x
Blaser, W. J., Oppong, J., Hart, S. P., Landolt, J., Yeboah, E., and Six, J. (2018). Climate-smart sustainable agriculture in low-to-intermediate shade agroforests. Nat. Sustain. 1, 234–239. doi: 10.1038/s41893-018-0062-8
Bommarco, R., Kleijn, D., and Potts, S. G. (2013). Ecological intensification: harnessing ecosystem services for food security. Trends Ecol. Evol. 28, 230–238. doi: 10.1016/j.tree.2012.10.012
Boreux, V., Kushalappa, C. G., Vaast, P., and Ghazoul, J. (2013). Interactive effects among ecosystem services and management practices on crop production: pollination in coffee agroforestry systems. Proc. Natl. Acad. Sci. U.S.A. 110, 8387–8392. doi: 10.1073/pnas.1210590110
Bourguignon, F., and Chakravarty, S. R. (2003). The measurement of multidimensional poverty. J. Econ. Inequal. 1, 25–49. doi: 10.1023/a:1023913831342
Boyd, I. L., Freer-Smith, P. H., Gilligan, C. A., and Godfray, H. C. J. (2013). The consequence of tree pests and diseases for ecosystem services. Science 342:1235773. doi: 10.1126/science.1235773
Byerlee, D., de Janvry, A., and Sadoulet, E. (2009). Agriculture for development: toward a new paradigm. Annu. Rev. Resour. Econ. 1, 15–31. doi: 10.1146/annurev.resource.050708.144239
Carter, M. R., and Barrett, C. B. (2006). The economics of poverty traps and persistent poverty: an asset-based approach. J. Dev. Stud. 42, 178–199. doi: 10.1080/00220380500405261
Carter, M. R., and May, J. (2001). One kind of freedom: poverty dynamics in post-apartheid South Africa. World Dev. 29, 1987–2006. doi: 10.1016/S0305-750X(01)00089-4
Cerda, R., Deheuvels, O., Calvache, D., Niehaus, L., Saenz, Y., Kent, J., et al. (2014). Contribution of cocoa agroforestry systems to family income and domestic consumption: looking toward intensification. Agroforest. Syst. 88, 957–981. doi: 10.1007/s10457-014-9691-8
Christiaensen, L., Demery, L., and Kuhl, J. (2011). The (evolving) role of agriculture in poverty reduction—an empirical perspective. J. Dev. Econ. 96, 239–254. doi: 10.1016/j.jdeveco.2010.10.006
Clough, Y., Faust, H., and Tscharntke, T. (2009). Cacao boom and bust: sustainability of agroforests and opportunities for biodiversity conservation. Conserv. Lett. 2, 197–205. doi: 10.1111/j.1755-263X.2009.00072.x
Collier, P., and Dercon, S. (2014). African agriculture in 50 years: smallholders in a rapidly changing world? World Dev. 63, 92–101. doi: 10.1016/j.worlddev.2013.10.001
Davis, K., Nkonya, E., Edward, K., Mekonnen, D., Odendo, M., and Miiro, R. (2012). Impact of farmer field schools on agricultural productivity and poverty in East Africa. World Dev. 40, 402–413. doi: 10.1016/j.worlddev.2011.05.019
Daw, T., Brown, K., Rosendo, S., and Pomeroy, R. (2011). Applying the ecosystem services concept to poverty alleviation: the need to disaggregate human well-being. Environ. Conserv. 38, 370–379. doi: 10.1017/S0376892911000506
De Beenhouwer, M., Aerts, R., and Honnay, O. (2013). A global meta-analysis of the biodiversity and ecosystem service benefits of coffee and cacao agroforestry. Agric. Ecosyst. Environ. 175, 1–7. doi: 10.1016/j.agee.2013.05.003
Deguines, N., Jono, C., Baude, M., Henry, M., Julliard, R., and Fontaine, C. (2014). Large-scale trade-off between agricultural intensification and crop pollination services. Front. Ecol. Environ. 12, 212–217. doi: 10.1890/130054
Dercon, S., and Gollin, D. (2014). Agriculture in African development: theories and strategies. Annu. Rev. Resour. Econ. 6, 471–492. doi: 10.1146/annurev-resource-100913-012706
Dorosh, P., and Thurlow, J. (2016). Beyond agriculture versus non-agriculture: decomposing sectoral growth–poverty linkages in five African Countries. World Dev. 440–451.
Dzanku, F. M., Jirström, M., and Marstorp, H. (2015). Yield gap-based poverty gaps in rural Sub-Saharan Africa. World Dev. 67, 336–362. doi: 10.1016/j.worlddev.2014.10.030
Fisher, J. A., Patenaude, G., Meir, P., Nightingale, A. J., Rounsevell, M. D. A., Williams, M., et al. (2013). Strengthening conceptual foundations: analysing frameworks for ecosystem services and poverty alleviation research. Glob. Environ. Change 23, 1098–1111. doi: 10.1016/j.gloenvcha.2013.04.002
Freud, E. H., Petithuguenin, P., and Richard, J. (1996). The diffusion and impact of cocoa research themes in Ghana and Cote d'Ivoire. Presented at the Proceedings of the 12th International Cocoa Research Conference, Salvadore.
Friedman, R., Hirons, M. A., and Boyd, E. (2019). Vulnerability of Ghanaian women cocoa farmers to climate change: a typology. Clim. Dev. 11, 446–458. doi: 10.1080/17565529.2018.1442806
Frimpong, E. A., Gemmill-Herren, B., Gordon, I., and Kwapong, P. K. (2011). Dynamics of insect pollinators as influenced by Cocoa production systems in Ghana. J. Pollination Ecol. 5, 74–80. doi: 10.26786/1920-7603(2011)12
Frimpong, E. A., Gordon, I., Kwapong, P. K., and Gemmill-Herren, B. (2009). Dynamics of cocoa pollination: tools and applications for surveying and monitoring cocoa pollinators. Int. J. Trop. Insect Sci. 29, 62–69. doi: 10.1017/S1742758409990117
Glendinning, D. R. (1972). Natural pollination of cocoa. New Phytol. 71, 719–729. doi: 10.1111/j.1469-8137.1972.tb01284.x
Green, R. E., Cornell, S. J., Scharlemann, J. P. W., and Balmford, A. (2005). Farming and the fate of wild nature. Science 307, 550–555. doi: 10.1126/science.1106049
Hickman, J. E., Tully, K. L., Groffman, P. M., Diru, W., and Palm, C. A. (2015). A potential tipping point in tropical agriculture: avoiding rapid increases in nitrous oxide fluxes from agricultural intensification in Kenya. J. Geophys. Res. Biogeosci. 120, 938–951. doi: 10.1002/2015JG002913
Hirons, M., McDermott, C., Asare, R., Morel, A., Robinson, E., Mason, J., et al. (2018a). Illegality and inequity in Ghana's cocoa-forest landscape: how formalization can undermine farmers control and benefits from trees on their farms. Land Use Policy 76, 405–413. doi: 10.1016/j.landusepol.2018.02.014
Hirons, M., Robinson, E., McDermott, C., Morel, A., Asare, R., Boyd, E., et al. (2018b). Understanding poverty in agro-forestry cash-crop systems: evidence from Ghana and Ethiopia. Ecol. Econ. 154, 31–41. doi: 10.1016/j.ecolecon.2018.07.021
Howe, C., Suich, H., Vira, B., and Mace, G. M. (2014). Creating win-wins from trade-offs? Ecosystem services for human well-being: a meta-analysis of ecosystem service trade-offs and synergies in the real world. Glob. Environ. Change 28, 263–275. doi: 10.1016/j.gloenvcha.2014.07.005
Hulme, D., and Shepherd, A. (2003). Conceptualizing chronic poverty. World Dev. 31, 403–423. doi: 10.1016/S0305-750X(02)00222-X
Irz, X., Lin, L., Thirtle, C., and Wiggins, S. (2001). Agricultural productivity growth and poverty alleviation. Dev. Policy Rev. 19, 449–466. doi: 10.1111/1467-7679.00144
Jagoret, P., Michel-Dounias, I., and Malézieux, E. (2011). Long-term dynamics of cocoa agroforests: a case study in central Cameroon. Agroforest. Syst. 81, 267–278. doi: 10.1007/s10457-010-9368-x
Jayne, T. S., Mason, N. M., Burke, W. J., and Ariga, J. (2018). Review: taking stock of Africa's second-generation agricultural input subsidy programs. Food Policy 75, 1–14. doi: 10.1016/j.foodpol.2018.01.003
Jayne, T. S., Yamano, T., Weber, M. T., Tschirley, D., Benfica, R., Chapoto, A., et al. (2003). Smallholder income and land distribution in Africa: implications for poverty reduction strategies. Food Policy 28, 253–275. doi: 10.1016/S0306-9192(03)00046-0
Jonsson, M., Bommarco, R., Ekbom, B., Smith, H. G., Bengtsson, J., Caballero-Lopez, B., et al. (2014). Ecological production functions for biological control services in agricultural landscapes. Methods Ecol. Evol. 5, 243–252. doi: 10.1111/2041-210X.12149
Kassie, M., Shiferaw, B., and Muricho, G. (2011). Agricultural technology, crop income, and poverty alleviation in Uganda. World Dev. 39, 1784–1795. doi: 10.1016/j.worlddev.2011.04.023
Klein, A.-M. (2009). Nearby rainforest promotes coffee pollination by increasing spatio-temporal stability in bee species richness. Forest Ecol. Manage. 258, 1838–1845. doi: 10.1016/j.foreco.2009.05.005
Koko, L. (2014). Teractiv cacao as a new fertilizer based reactive phosphate rock for cocoa productivity in côte d'ivoire: a participatory approach to update fertilization recommendation. Procedia Eng. 83, 348–353. doi: 10.1016/j.proeng.2014.09.027
Kremen, C. (2005). Managing ecosystem services: what do we need to know about their ecology? Ecol. Lett. 8, 468–479. doi: 10.1111/j.1461-0248.2005.00751.x
Kremen, C., Williams, N. M., Aizen, M. A., Gemmill-Herren, B., LeBuhn, G., Minckley, R., et al. (2007). Pollination and other ecosystem services produced by mobile organisms: a conceptual framework for the effects of land-use change. Ecol. Lett. 10, 299–314. doi: 10.1111/j.1461-0248.2007.01018.x
Leakey, R. R. B. (2014). The role of trees in agroecology and sustainable agriculture in the tropics. Annu. Rev. Phytopathol. 52, 113–133. doi: 10.1146/annurev-phyto-102313-045838
López, R., and Galinato, G. I. (2007). Should governments stop subsidies to private goods? Evidence from rural Latin America. J. Public Econ. 91, 1071–1094. doi: 10.1016/j.jpubeco.2006.10.004
Maas, B., Clough, Y., and Tscharntke, T. (2013). Bats and birds increase crop yield in tropical agroforestry landscapes. Ecol. Lett. 16, 1480–1487. doi: 10.1111/ele.12194
Mace, G. M., Norris, K., and Fitter, A. H. (2012). Biodiversity and ecosystem services: a multilayered relationship. Trends Ecol. Evol. 27, 19–26. doi: 10.1016/j.tree.2011.08.006
Marthews, T., Riutta, T., Oliveras Menor, I., Urrutia, R., Moore, S., Metcalfe, D., et al. (2014). Measuring Tropical Forest Carbon Allocation and Cycling: A RAINFOR-GEM Field Manual for Intensive Census Plots (v 3.0). Global Ecosystems Monitoring network. Available online at: http://gem.tropicalforests.ox.ac.uk/ (accessed January, 2014).
McKinley, J., Nalley, L. L., Asare, R. A., Dixon, B. L., Popp, J. S., and D'Haese, M. (2016). Managing risk in cocoa production: assessing the potential of climate-smart crop insurance in Ghana. J. Int. Agric. Trade Dev. 10, 53–79.
Minten, B., and Barrett, C. B. (2008). Agricultural technology, productivity, and poverty in Madagascar. World Dev. 36, 797–822. doi: 10.1016/j.worlddev.2007.05.004
Montagnini, F., and Nair, P. K. R. (2004). Carbon sequestration: An underexploited environmental benefit of agroforestry systems, in New Vistas in Agroforestry: A Compendium for 1st World Congress of Agroforestry, 2004, eds P. K. R. Nair, M. R. Rao, and L. E. Buck (Dordrecht: Springer Netherlands, 281–295.
Nukunya, G. K. (2003). Tradition and Change in Ghana: An Introduction to Sociology. Accra: Ghana Universities Press.
Ordway, E. M., Asner, G. P., and Lambin, E. F. (2017). Deforestation risk due to commodity crop expansion in sub-Saharan Africa. Environ. Res. Lett. 12:044015. doi: 10.1088/1748-9326/aa6509
Potts, S. G., Imperatriz-Fonseca, V., Ngo, H. T., Aizen, M. A., Biesmeijer, J. C., Breeze, T. D., et al. (2010). Safeguarding pollinators and their values to human well-being. Nature 540, 220–229. doi: 10.1038/nature20588
Power, A. G. (2010). Ecosystem services and agriculture: tradeoffs and synergies. Philos. Trans. R. Soc. B 365, 2959–2971. doi: 10.1098/rstb.2010.0143
Pretty, J., Toulmin, C., and Williams, S. (2011). Sustainable intensification in African agriculture. Int. J. Agric. Sustain. 9, 5–24. doi: 10.3763/ijas.2010.0583
R Core Team (2018). R: A Language and Environment for Statistical Computing. R Foundation for Statistical Computing.
Schroth, G., da Fonseca, G. A. B., Harvey, C. A., Gascon, C., Vasconcelos, H., and Izac, A. N. (2004). Agroforestry and Biodiversity Conservation in Tropical Landscapes. Washington, DC: Island Press.
Schroth, G., Läderach, P., Martinez-Valle, A. I., Bunn, C., and Jassogne, L. (2016). Vulnerability to climate change of cocoa in West Africa: patterns, opportunities and limits to adaptation. Sci. Total Environ. 556, 231–241. doi: 10.1016/j.scitotenv.2016.03.024
Shepherd, A. (2011). Tackling Chronic Poverty: The Policy Implications of Research on Chronic Poverty and Poverty Dynamics. London: Chronic Poverty Research Centre.
Suich, H., Howe, C., and Mace, G. (2015). Ecosystem services and poverty alleviation: a review of the empirical links. Ecosyst. Serv. 12, 137–147. doi: 10.1016/j.ecoser.2015.02.005
Tallis, H., Kareiva, P., Marvier, M., and Chang, A. (2008). An ecosystem services framework to support both practical conservation and economic development. Proc. Natl. Acad. Sci. U.S.A. 105, 9457–9464. doi: 10.1073/pnas.0705797105
Tilman, D., Balzer, C., Hill, J., and Befort, B. L. (2011). Global food demand and the sustainable intensification of agriculture. Proc. Natl. Acad. Sci. U.S.A. 108, 20260–20264. doi: 10.1073/pnas.1116437108
Tittonell, P. (2014). Ecological intensification of agriculture—sustainable by nature. Curr. Opin. Environ. Sustain. 8, 53–61. doi: 10.1016/j.cosust.2014.08.006
Tittonell, P., and Giller, K. E. (2013). When yield gaps are poverty traps: the paradigm of ecological intensification in African smallholder agriculture. Field Crops Res. 143, 76–90. doi: 10.1016/j.fcr.2012.10.007
Tollefson, J. (2018). Big-data project aims to transform farming in world's poorest countries. Nature. 561. doi: 10.1038/d41586-018-06800-8
Tscharntke, T., Clough, Y., Bhagwat, S. A., Buchori, D., Faust, H., Hertel, D., et al. (2011). Multifunctional shade-tree management in tropical agroforestry landscapes – a review. J. Appl. Ecol. 48, 619–629. doi: 10.1111/j.1365-2664.2010.01939.x
Tscharntke, T., Clough, Y., Wanger, T. C., Jackson, L. E., Kormann née Motzke, I., Perfecto, I., et al. (2012). Global food security, biodiversity conservation and the future of agricultural intensification. Biol. Conserv. 151, 53–59. doi: 10.1016/j.biocon.2012.01.068
Tscharntke, T., Klein, A. M., Kruess, A., Steffan-Dewenter, I., and Thies, C. (2005). Landscape perspectives on agricultural intensification and biodiversity – ecosystem service management. Ecol. Lett. 8, 857–874. doi: 10.1111/j.1461-0248.2005.00782.x
Tully, K. L., Lawrence, D., and Scanlon, T. M. (2012). More trees less loss: Nitrogen leaching losses decrease with increasing biomass in coffee agroforests. Agric. Ecosyst. Environ. 161, 137–144. doi: 10.1016/j.agee.2012.08.002
Turc, L. (1961). Estimation of irrigation water requirements, potential evapotranspiration: a simple climatic formula evolved up to date. Ann. Agronomy 12, 13–49.
Tutu Benefoh, D., Villamor, G. B., van Noordwijk, M., Borgemeister, C., Asante, W. A., and Asubonteng, K. O. (2018). Assessing land-use typologies and change intensities in a structurally complex Ghanaian cocoa landscape. Appl. Geogr. 99, 109–119. doi: 10.1016/j.apgeog.2018.07.027
Vanlauwe, B., Leigh Coyne, D., Gockowski, J., Hauser, S., Huising, J., Masso, C., et al. (2014). Sustainable intensification and the African smallholder farmer. Curr. Opin. Environ. Sustain. 8, 15–22. doi: 10.1016/j.cosust.2014.06.001
Wade, A. S. I., Asase, A., Hadley, P., Mason, J., Ofori-Frimpong, K., Preece, D., et al. (2010). Management strategies for maximizing carbon storage and tree species diversity in cocoa-growing landscapes. Agric. Ecosyst. Environ. 138, 324–334. doi: 10.1016/j.agee.2010.06.007
Waldron, A., Justicia, R., Smith, L., and Sanchez, M. (2012). Conservation through Chocolate: a win-win for biodiversity and farmers in Ecuador's lowland tropics. Conserv. Lett. 5, 213–221. doi: 10.1111/j.1755-263X.2012.00230.x
Winder, J. A., and Silva, P. (1972). Cacao pollination: Microdiptera of cacao plantations and some of their breeding places. Bull. Entomol. Res. 61, 651–655. doi: 10.1017/S0007485300047465
Wood, S. N. (2011). Fast stable restricted maximum likelihood and marginal likelihood estimation of semiparametric generalized linear models. J. R. Statist. Soc. 73, 3–36. doi: 10.1111/j.1467-9868.2010.00749.x
Young, A. M. (1982). Effects of shade cover and availability of midge breedings sites on pollinating midge populations and fruit set in two cocoa farms. J. Appl. Ecol. 19, 47–63. doi: 10.2307/2402990
Zhang, W., Ricketts, T. H., Kremen, C., Carney, K., and Swinton, S. M. (2007). Ecosystem services and dis-services to agriculture. Ecol. Econ. 64, 253–260. doi: 10.1016/j.ecolecon.2007.02.024
Keywords: ecosystem services, poverty alleviation, ecological production function, agroforestry, cocoa
Citation: Morel AC, Hirons M, Adu Sasu M, Quaye M, Ashley Asare R, Mason J, Adu-Bredu S, Boyd E, McDermott CL, Robinson EJZ, Straser R, Malhi Y and Norris K (2019) The Ecological Limits of Poverty Alleviation in an African Forest-Agriculture Landscape. Front. Sustain. Food Syst. 3:57. doi: 10.3389/fsufs.2019.00057
Received: 09 August 2018; Accepted: 03 July 2019;
Published: 23 July 2019.
Edited by:
Ademola Braimoh, World Bank, United StatesReviewed by:
Wil De Jong, Kyoto University, JapanGabriel da Silva Medina, Universidade Federal de Goiás, Brazil
Copyright © 2019 Morel, Hirons, Adu Sasu, Quaye, Ashley Asare, Mason, Adu-Bredu, Boyd, McDermott, Robinson, Straser, Malhi and Norris. This is an open-access article distributed under the terms of the Creative Commons Attribution License (CC BY). The use, distribution or reproduction in other forums is permitted, provided the original author(s) and the copyright owner(s) are credited and that the original publication in this journal is cited, in accordance with accepted academic practice. No use, distribution or reproduction is permitted which does not comply with these terms.
*Correspondence: Alexandra C. Morel, YWxleGFuZHJhLm1vcmVsQGdtYWlsLmNvbQ==