 Sylvia L. R. Wood
 Mahbubul Alam2
 Jérôme Dupras
- 1Institut des Sciences de la Forêt Tempérée, Université de Québec en Outaouais, Ripon, QC, Canada
- 2Conservation International, Arlington, VA, United States
Our food choices, food production pathways and household behaviors together govern the impact that our diet has on our health as well as the environment. As the planetary population grows, there is an increasing awareness of the need to both improve the quality of our diets for health reasons and to reduce its impact on the Earth. From the consumer perspective, however, it is not always clear which healthy diet options and behaviors contribute most to reductions in our dietary footprint. In this paper we model and contrast the impact of the current American diet and three recommended diets from the 2015–2020 Dietary Guidelines for Americans on six environmental dimensions of the dietary footprint: land area required, blue water use, fertilizer application, primary energy input, ammonia emissions, and greenhouse gas emissions based on LCIA studies. For each diet we test the relative impact of a shift in diet composition, caloric intake and the reduction in food waste on the dietary footprint. We find that there are multiple pathways to significantly reduce the environmental impact of our diets. Shifts in diet composition from the current diet to a vegetarian diet had the greatest impact on reducing the dietary footprint, however, combinations of reducing caloric intake from 2,600 to 2,000 kcal/d combined with 50% reduction in food waste could achieve similar results in some cases. In line with results of other studies, we find that reducing red-meat and dairy contribute most to reducing the dietary footprint. However, recommended increases in fruits and vegetables with dietary shifts are accompanied by significant increases in blue water use. By combining a number of incremental shifts in diet composition, intake level, and food waste, significant land currently under production could be spared from production for other uses while still providing a nutritious diet for all.
Introduction
What we eat and how we produce it define our most fundamental relationship with the planet. Over the past 200 years, farming has become the most influential driver of land use change (Ramankutty and Foley, 1999; Steffen et al., 2015). Today 37% of the terrestrial surface of the planet and over two thirds of our freshwater resources are dedicated to producing food (Foley et al., 2005; Pretty et al., 2006; Dobermann and Nelson, 2013; HLPE, 2013). Agriculture has also become a leading source of nutrient pollution (Howarth, 2008), biodiversity loss (Lenzen et al., 2012) and greenhouse gas (GHG) emissions globally, accounting for 10–20% of GHGs and 70% of land use change emissions (Hosonuma et al., 2012; Smith et al., 2014; Tubiello et al., 2015). Together, the twin drivers of population growth and increasing per-capita food consumption have, and continue, to fuel food demand and land use change (Tilman et al., 2001). With the global population projected to reach, and possibly exceed 9 billion by 2050 (United Nations DESA, 2017), new modalities of production and consumption are necessary to nourish the planet.
A limited number of options exist to meet these rising food demands: expanding cropland area, increasing productivity on current land, managing consumer demand, and/or reducing food loss along the value chain (Foley et al., 2011; Springer and Duchin, 2014; Martin-Guay et al., 2017). In many regions, the capacity to increase food supply through further agricultural expansion is limited (Tilman et al., 2001; Bruinsma, 2009), especially if we hope to preserve habitat for the other species (Dobrovolski et al., 2011). Thus, it is generally accepted that substantial conventional and/or sustainable intensification will be required to keep pace with food demands (FAO, 2014). Yield improvements are still possible in many under-invested regions such as Africa and Asia (IIASA/FAO, 2012), yet studies suggest that even if it were possible to close current yield gaps, it would be insufficient to secure global diets and spare land from conversion (Ray et al., 2013; Bajželj et al., 2014; Zhao et al., 2017). Bajželj et al. (2014) predict that even under the most promising scenarios of yield increases, up to 20% more agricultural land area will be needed by 2050 to feed the world.
To limit expansion and potentially spare cultivated land for conservation, increasing attention is being paid to options to manage food demand by shifting diets and reducing waste (Bajželj et al., 2014; Mbow and Rosenzweig, 2019). Until recently, these drivers were often overlooked by research and policy communities (Guyomard et al., 2012). Over the past half-century diets in many wealthy countries have evolved. Since the 1970s, average diets in the United States (US) quickly surpassed the average 2,000 kcal per day recommendations (Ford and Dietz, 2013) and today are as high as 2,500 kcal per day amongst some communities (Wright and Wang, 2010) with the portion of meat and oils in the diet rising in tandem (Rehm et al., 2016). This is leading to a number of diet-related negative health outcomes in the US (Lim et al., 2012; McEvoy et al., 2012; da Costa Louzada et al., 2015; Monteiro et al., 2018). Similarly, many emerging economies (e.g., China, Brazil, India) are also undergoing transitions away from plant-based protein to animal foods as incomes rise (Speedy, 2003). Studies comparing resource inputs show that animal-based foods are particularly resource-intensive (Eshel et al., 2014; Tilman and Clark, 2014; van Dooren et al., 2014; Heller and Keoleian, 2015; Peters et al., 2016; Tom et al., 2016), due to low energy conversion efficiencies in animals (Pimentel, 1997; Eshel et al., 2014), placing added strain on production systems.
In recent decades, studies have suggested shifting toward greater plant-based diets as a means of meeting future food demands without increasing agricultural areas (e.g., Pimentel, 2003; Foley et al., 2011; Bajželj et al., 2014). In the US, a number of studies have explored the impacts of shifting diet composition on resource use (Heller and Keoleian, 2015; Peters et al., 2016; Tom et al., 2016; Birney et al., 2017; Conrad et al., 2017, 2018; Blackstone et al., 2018). Overall, these studies have found lower meat diets lead to a greater carrying capacity of the land (Peters et al., 2016), and that current land use, if better organized, could support larger populations on better quality diets (Conrad et al., 2017, 2018). At the same time, a number of these studies show that shifts to healthier diets—high in fruits and vegetables—could increase agricultural water use, energy input, GHG emissions in the US (Heller and Keoleian, 2015; Tom et al., 2016; Birney et al., 2017). This suggests that important trade-offs may exist in environmental dimensions beyond land use in the American food system. It is not clear, however, how generalizable these results are to other countries with different food productions systems.
Similarly, it has been suggested that current and future food demand could be met, in part, through the reduction of food waste (Foley et al., 2011; Bajželj et al., 2014). In the US, ~30% of all produced food is thrown away along the food chain from producer to consumer, accounting for 133 billion pounds of uneaten food (Buzby et al., 2014). This is equivalent to 141 trillion calories per year (Buzby et al., 2014) or sufficient calories to feed an additional 154 million people per year on a 2,500 kcal/d diet. Buzby and colleagues (2014) found that the largest food losses were in meats, poultry, fish (30%), and dairy (17%), the most resource-intensive food groups, as well as more highly perishable vegetables (19%). Such losses have been estimated to add an additional 1.4 kg/d CO2-equivalents to the per capita carbon footprint of the average American diet (Heller and Keoleian, 2015) and to account for ~34–35% of energy use, blue water use, fertilizer use and GHG emissions related to an individual's diet (Birney et al., 2017). Thus, even moderate reductions in food waste could substantially improve the resource-use efficiency of food production systems.
Given the large number of studies, with at time conflicting recommendations, it can be hard for the average consumer identify diet strategies to achieve their environmental and health goals. This requires understanding the relative impact of their dietary choices cross multiple environmental dimensions. To help inform consumer decision, in this article we explore the relative environmental impacts of (i) a shift in diet composition toward more plant-based foods, (ii) a shift in caloric intake from 2,000, 2,600, to 3,200 kcal/d, and (iii) a reduction in food waste by 10, 25, and 50% on resource demands of three diets outlined in the 2015–2020 Dietary Guidelines for Americans (USDHHS and USDA, 2015) as compared to the current American diet. We contrast the impact of each diet in terms of its land footprint, blue water and phosphate use, primary energy input as well as ammonia and GHG emissions.
Finally, we project these results out to 2051 when the US population is set to reach 400 million people to identify dietary pathways that provide healthy diets while minimizing the domestic land demand to support the new population (results for values in 2051 presented in Supplemental Materials SM8.2 and Table SM4).
Materials and Methods
Constructing Diet Scenarios
To build representative diet scenarios we use the recommended daily intake values (i.e., servings) from the 2015–2020 Dietary Guidelines for Americans for three available diet patterns: the Healthy, Mediterranean and Vegetarian diets. The Healthy diet provides recommendations on the appropriate balance of daily fruit, vegetables, grains, protein and fat intake, and includes both plant and animal-based protein with an emphasis on terrestrial livestock protein sources (meat and dairy). The Mediterranean diet has similar or slightly higher intake levels of fruits, vegetables, grains and seafood, but a lower emphasis on terrestrial animal products. In the Vegetarian diet, meats and seafood are replaced by higher intakes of nuts, legumes, and tofu products. These three patterns represent diets across a decreasing spectrum of animal protein intake. From these three diet patterns, we create intake scenarios at three caloric levels (2,000, 2,600, and 3,200 kcal/d) based on recommended intake values in the 2015–2020 Dietary Guidelines. These intake levels were selected to represent the globally recommended intake (2,000 kcal/d), average intake in the US (2,600 kcal/d) and the highest available intake included in the Dietary Guidelines (3,200 kcal/d).
To represent current actual diets of the American populace, we extract data from Rehm et al. (2016) on dietary intake patterns amongst American adults surveyed in 2012 in the National Health and Nutrition Examination Survey (NHANES) (2012), which approximates a 2,600 kcal/d diet. Rehm et al. (2016) presents summarized intake quantities for each food group from dietary recall data from a cross section of the American population. We use aggregated intake quantities for all adults sampled. We scale the reported average portion sizes of each food group to recreate the current American diet at 2,000 and 3,200 kcal/d to match the other diet pattern scenarios.
For both the current diet and the diet scenarios, we selected a single food item for each 2015–2020 Dietary Guidelines food group (e.g., Fruit) and sub-group (i.e., Vegetables–dark green) to compose the diet (Table 1). Food items were selected based on the crop or livestock product within each food group with the greatest total land area dedicated to production in the United States in 2014 using national level data in FAOSTAT (FAO, 2014). This was done to best represent linkages between patterns in current land use in the country and likely food preferences. For more details on construction of diet scenarios (see Supplemental Materials SM8.1).
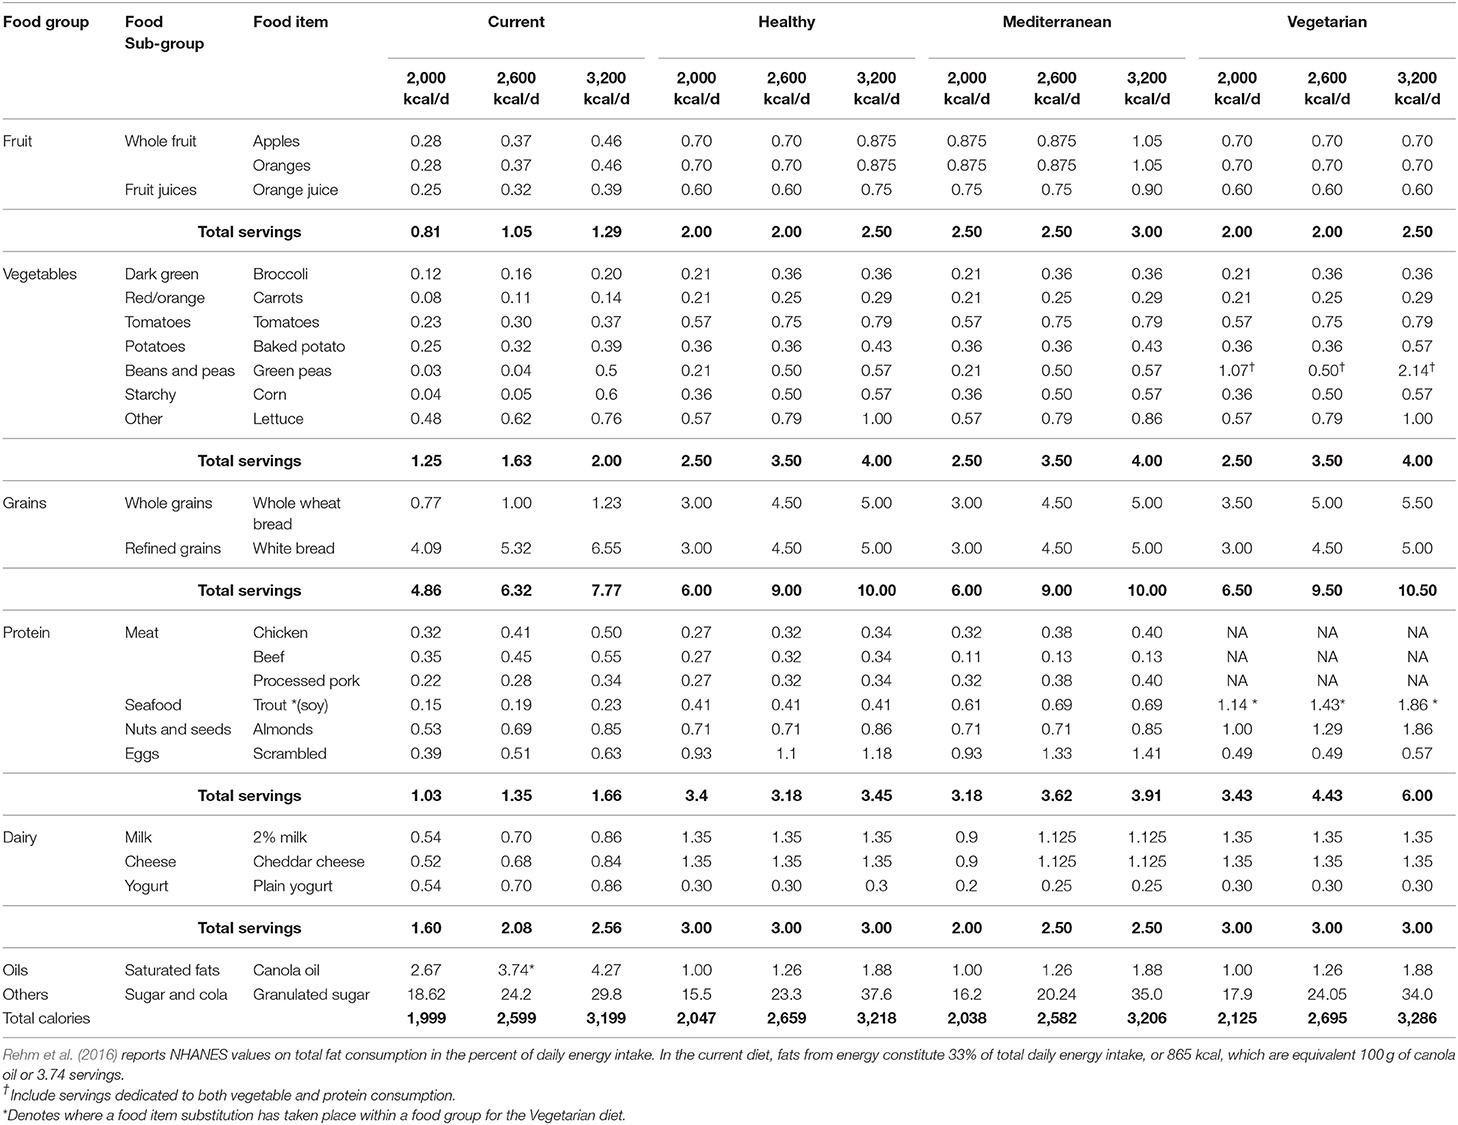
Table 1. Servings per food group for the current diet and three recommended diet patterns at three caloric intake-levels.
Estimating the Land Footprint of Diet Scenarios
To estimate the land area needed to produce each diet we first calculate the total annual per-capital demand in kg/capita/yr for each food item based on daily actual or recommended intake (g/d) rates. We translate these values to land area by multiplying the total annual per-capita demand (kg) by national crop productivity values (i.e., yield/ha) for each food item. Productivity values for meat and animal-based proteins (eggs and dairy), as well as sugars and oils are taken from (Davis, 2017), while crop productivity data were extracted from FAOSTAT database for 2014. We assign productivity from the FAOSTAT category “Cauliflower and Broccoli” for broccoli, as it was not reported separately. Estimates of the terrestrial contribution to the production of seafood were taken from agricultural input estimates for feed from Meier and Christen (2012). We tested the sensitivity of our calculation framework to the specific food items selected by substituting each food item for another widely produced domestic food product in the current average diet (see Table SM1).
In order to better represent the resources required to support these diets, we accounted for the amount of postharvest food lost at the retail and consumer levels in the United States based on USDA loss-adjusted food availability (LAFA) [U.S. Department of Agriculture Economic Research Service (USDA-ERS), 2016]. To accomplish this, we multiplied the calculated land area requirement of each food item by 1+ % LAFA item-specific food loss rate. Food loss-adjusted land area requirements were then summed across all food items to estimate the gross land area needed to support one person on each diet for 1 year. We extrapolate these values to the 2016 US population size (324 million) and the expected population size in 2051 (400 million) to estimate the total land area required per year (ha/yr) for each diet scenario. The results of the analyses out to 2051 are shown in Table SM4.
Estimating the Environmental Footprint of Diet Scenarios
We also estimate environmental impacts of diet scenarios in terms of the amount of blue water required (m3), phosphate applied (kg), energy used (GJ), as well as ammonia (kg) and greenhouse gases emitted (eCO2 tn) to produce the foods using compiled life cycle impact assessment (LCIA) estimates from Meier and Christen (2012). Meier and Christen (2012) use a cradle-to-store bounded LCIA to calculate the resource inputs required to produce 1 kg of each food group including processing, packaging and transport and are based primarily on studies from German food system. We use LCIA values from Meier and Christen, rather than separate LCIA studies for individual products as they provide comparable estimates of resource use intensity across six common environmental indicators. Calculated per-capital annual quantities of each food item from our diet scenarios were multiplied by food-item specific LAFA values and these LCIA values and summed within diets. Total resource inputs and outputs of scenario diets were then contrasted with those of the current diet to illustrate the relative change in resource use associated with both diet composition and caloric intake shifts.
Impact of Reducing Food Waste Along the Retail Chain
In addition to estimating the change in the environmental indicators with different diet compositions and caloric intake levels, we examine the relative impact of reducing food waste along the retail chain from producer to consumer. For each diet scenario we estimate change in resources required to produce the diet if food waste were reduced by 10, 25 and 50% across all food items using values provided in the USDA loss-adjusted food tables [U.S. Department of Agriculture Economic Research Service (USDA-ERS) (2016)]. These are then contrasted in terms of land use and resource use with shifts in diet composition and caloric intake.
Results
Estimated energy (kcal) intake from our actual and recommended diets corresponded well with the expected caloric intakes. In each of the diets examined, the calculated energy intake, based on the energy density of the food items and the quantities consumed or recommended resulted in diets that fell within 100 kcal of the targeted intake levels (Table 1). The identity of the food items selected for each food-group had only a minor influence on the land area impacts. Exchanging each crop and dairy food item for the second most widely produced food item (rather than the first) in the current average diet only increased the estimated land area demand by about 4%. Swapping all crops in any one food-group category resulted in changes in total land footprint by <2%, however, percentage changes within food groups were higher. In contrast, the relative proportions of the beef, chicken and pork in the current diet had a much larger impact on the total land footprint. Increasing proportion of red meat from 36 to 50% increased the land footprint by 21%. However, adjusting the proportion of either chicken or pork to make up 50% of meat intake (with the remainder split between the two other meat types) reduced the land footprint by 28% in both cases (see Table SM1). Due to the extremely low land area productivity of beef, our calculation framework is highly sensitive the quantity of red meat in the diet. Thus, our assumptions on the relative proportions of red meat in the recommended Healthy and Mediterranean diets have a strong influence on our results.
Shifting Dietary Composition Vs. Intake on Land-Area Footprint
We found a more pronounced effect of shifting diet composition than shifting caloric intake on the per-capita land area required to produce each diet (Table 2). Shifting from the current diet at 2,600 kcal/d to the Mediterranean and Vegetarian diet at the same caloric intake reduced the area requirement by half and 4-fold respectively. In comparison, reducing intake from 3,200 to 2,000 kcal/d while maintaining the food composition in the current diet would only reduce land demand by about 40%.
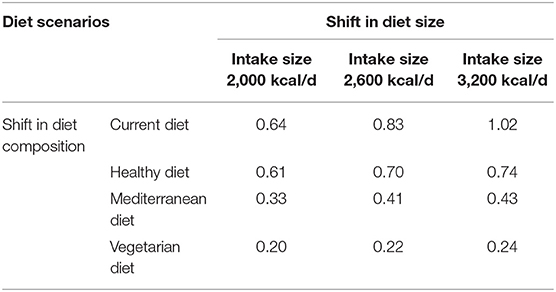
Table 2. Per capita land area (ha) required to support the current diet and US Dietary Guideline recommended “Healthy,” “Mediterranean,” and “Vegetarian” diets at three levels of caloric intake.
Across all intake levels, the largest reduction in land area accompanied shifts from a Healthy to a Mediterranean diet, likely due to the large decrease in red meat assumed in the Mediterranean diet. Interestingly, for the Healthy and Mediterranean diets, reducing intake from 2,600 to 2,000 kcal/d had a proportionally larger impact on per-capita land area requirements, than would reducing consumption from 3,200 to 2,600 kcal/d despite representing similar caloric change. Looking at the red meat consumption quantities of these diets in Table 1, we can see that there is a larger decrease in recommended beef intake from 2,600 to 2,000 kcal/d, than there is for the same diet from 3,200 to 2,600 kcal/d. Together, these highlight both the impact of red meat consumption on land demand, but also the sensitivity of our models to assumptions of the relative proportions of meats consumed. Similar patterns were not seen in the current diet as we linearly scaled existing proportions of all food groups to estimate the composition of diets at 2,000 and 3,200 kcal/d.
When we extrapolate these numbers to the US population in 2016, we estimate that the current diet requires ~270 million hectares of land to feed its 324 million people. A comparable Mediterranean diet at 2,600 kcal would require just 50% as much land and a Vegetarian diet of the same energy intake requires about a quarter of the land area, and would save 200 million ha of land. Of all the diets analyzed, the Vegetarian diet at 2,000 kcal had the smallest land footprint, requiring only 64.7 million ha to supply the US population in 2016 with a nutritionally adequate diet. However, even a less drastic shift from the current diet to a Healthy diet at 2,600 kcal, would save ~44 million ha of arable land (approximately the size of the state of California), while a shift to a Healthy diet and reduction to 2,000 kcal diet could save ~74 million ha that could be dedicated to other land-uses or conservation.
Shifting Composition vs. Food Waste on Diet Footprint
Reducing food waste along the retail chain from producer to consumer, without any change in diet composition, can make significant impacts on the land area needed to support a diet (Table 3). For the current diet, reducing food waste for each food item by 50% reduced the land area footprint of the diet by 0.13 ha per-capita and would spare ~44 million hectares of land area from production, making it equivalent in land-use to the Healthy diet with no waste reduction. Similarly for the Healthy diet, a 50% reduction in food waste could make significant reductions to the land footprint of the diet, sparing ~35 million ha from production. For the Mediterranean and Vegetarian diets, food waste reduction had a much smaller absolute impact, compared to shifts in diet due to their significantly lower land-demands (Figure 1). Overall, reducing food waste generally had a smaller impact on land footprint than shifting the composition of the diet. However, impacts from a 50% reduction in food waste were comparable to shifting caloric intake by 600 kcal within a particular diet.
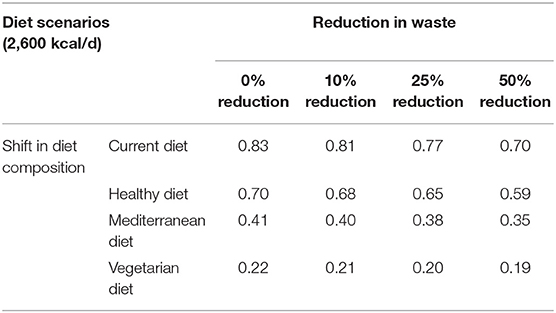
Table 3. Land area (ha) required per person to support the current diet and US Dietary Guideline recommended “Healthy,” “Mediterranean,” and “Vegetarian” diets at three levels of waste reduction.
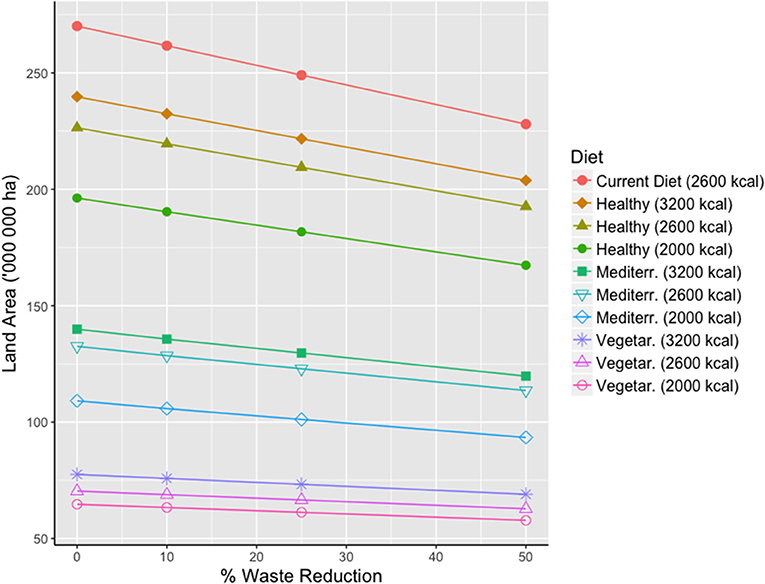
Figure 1. Estimated land area required to meet dietary requirements of the US population following the current diet and 9 dietary scenarios with a 0, 10, 25, and 50% reduction in food waste along the retail-consumer chain.
Looking across all diets patterns, caloric intakes, and waste reduction levels we can see the relative impact that these consumption decisions have on the total land area required to support the US population in 2016 (Figure 1). It is clear that the most significant reductions in land footprints come from shifts in diet composition, while caloric intake and waste reduction can also make important but less substantial contributions.
Environmental Footprints
Beyond the land area required to grow the crops and livestock, we also examined the amount of inputs of water, fertilizers, energy required, and GHG emissions from the production, packaging and transport of food items. The total estimated resource inputs vary between our diet scenarios as a function of the relative quantities of different food groups in the diet (e.g., meat vs. fruits vs. vegetables), which each have their own individual resource input requirements throughout their life cycle (Meier and Christen, 2012).
As we have shown above, shifting current consumption both toward a recommended diet and/or limiting consumption to 2,000 kcal could spare significant land area from production. These shifts in diet composition, however, may be accompanied by concomitant increases in other resource inputs. In Figure 2 we can see the relative impacts of shifting diet composition and caloric intake on the environmental impact of each diet as compared to the current diet (for absolute per-capita and population level values see Table SM1). All diet scenarios involve an increase in the amount of water needed to produce the recommended diets ranging from an increase of 33% for the Healthy diet at 2,000 kcal to a 92% increase in water use in the Vegetarian diet at a 3,200 kcal intake. Shifting to any of the recommended diets is also accompanied by an increase in energy use (up to 39%), except for Vegetarian diets at or below 2,600 kcal, which is more comparable (−9%) to the current diet energy use.
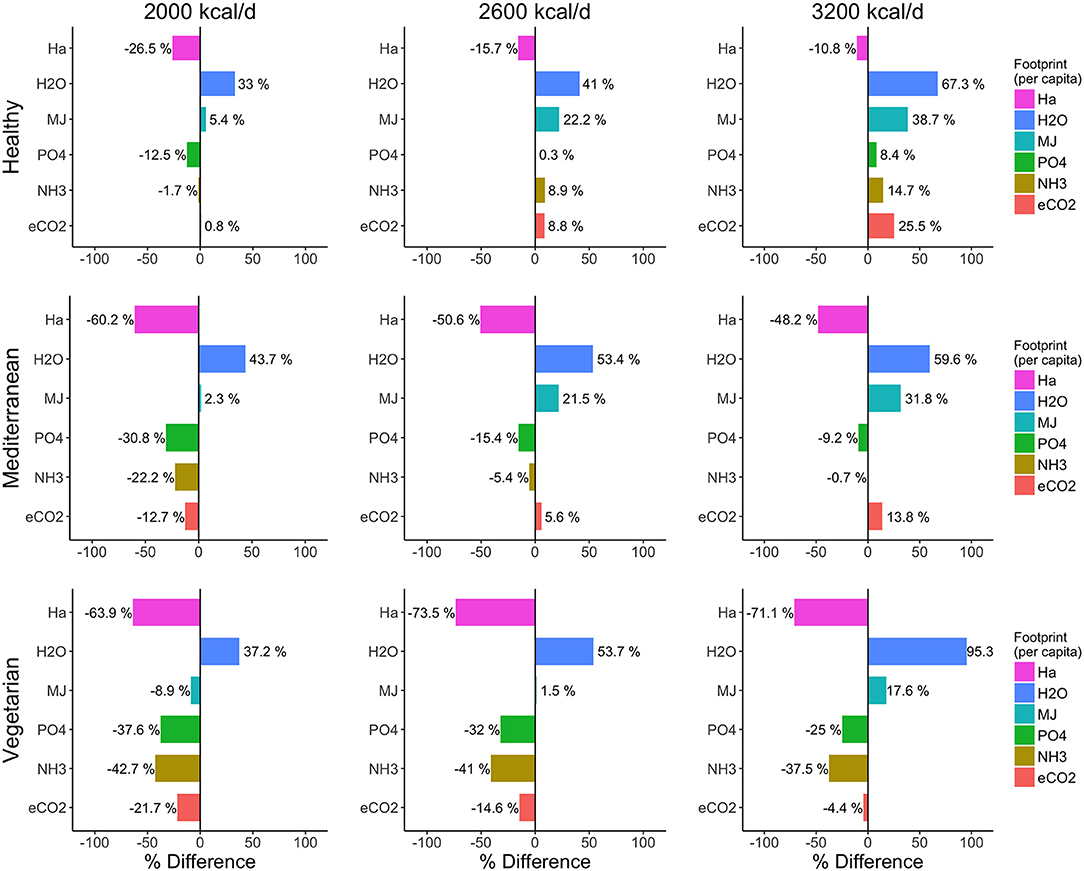
Figure 2. Relative percent difference in land area (purple), energy (blue), phosphate (green), water (olive) inputs as well as CO2 greenhouse gas equivalent emissions (red) required for the production, processing and transport to retail for the nine dietary scenarios as compared with the impacts for the current diet (sensu Rehm et al., 2016) based on LCIA estimates of food groups by Meier and Christen (2012).
In contrast, all recommended diets, except for the Healthy diets above 2,000 kcal, reduce phosphate use and ammonia emissions, in some cases by as much as 38–43%. However, GHG emissions can only be reduced by shifting from the current diet to a Mediterranean or Vegetarian diet. Shifting from the current to a Healthy diet produces more GHGs, even when intake is limited to 2,000 kcal. These results all assume there is no change in food waste along the supply chain and are based on LCIA values from Meier and Christen (2012). It is conceivable that many of these values would shrink or change direction if a shift in diet intake and composition were further accompanied by reductions in food waste.
Environmental Impact by Food Group
Comparing the breakdown in land area needed to produce each of the recommended food-groups in examined diet scenarios (at a constant caloric intake of 2,600 kcal), we find across diets that most land area requirements are dedicated to supporting the provision of protein and dairy foods with relatively little land needed for the production of fruits, vegetables or grains (Figure 3A). A similar pattern emerges for phosphate inputs, as well as ammonia and GHG emissions, which are mainly tied to the production of animal-based foods (Figures 3D–F). In contrast, blue water inputs are much higher for fruits, and this becomes important as all recommended diets have much higher recommended intakes of fruits and vegetables than consumed in the current diet (Fgure 3B). Energy inputs are more evenly distributed across the six food-groups with the total energy required to produce the Healthy and Mediterranean diets slightly higher than current or Vegetarian diet due to the increase in fruit and vegetable alongside the continued consumption of meat (Figure 3C). Thus, apart from blue water inputs, the production of animal-based protein and dairy products is considerably more resource-intensive and polluting than other food groups, and the overall impact of the diet is mostly changed by the amount of protein consumed. As we shift the composition of our diets, we can see that these decisions have important implication for their relative environmental impacts.
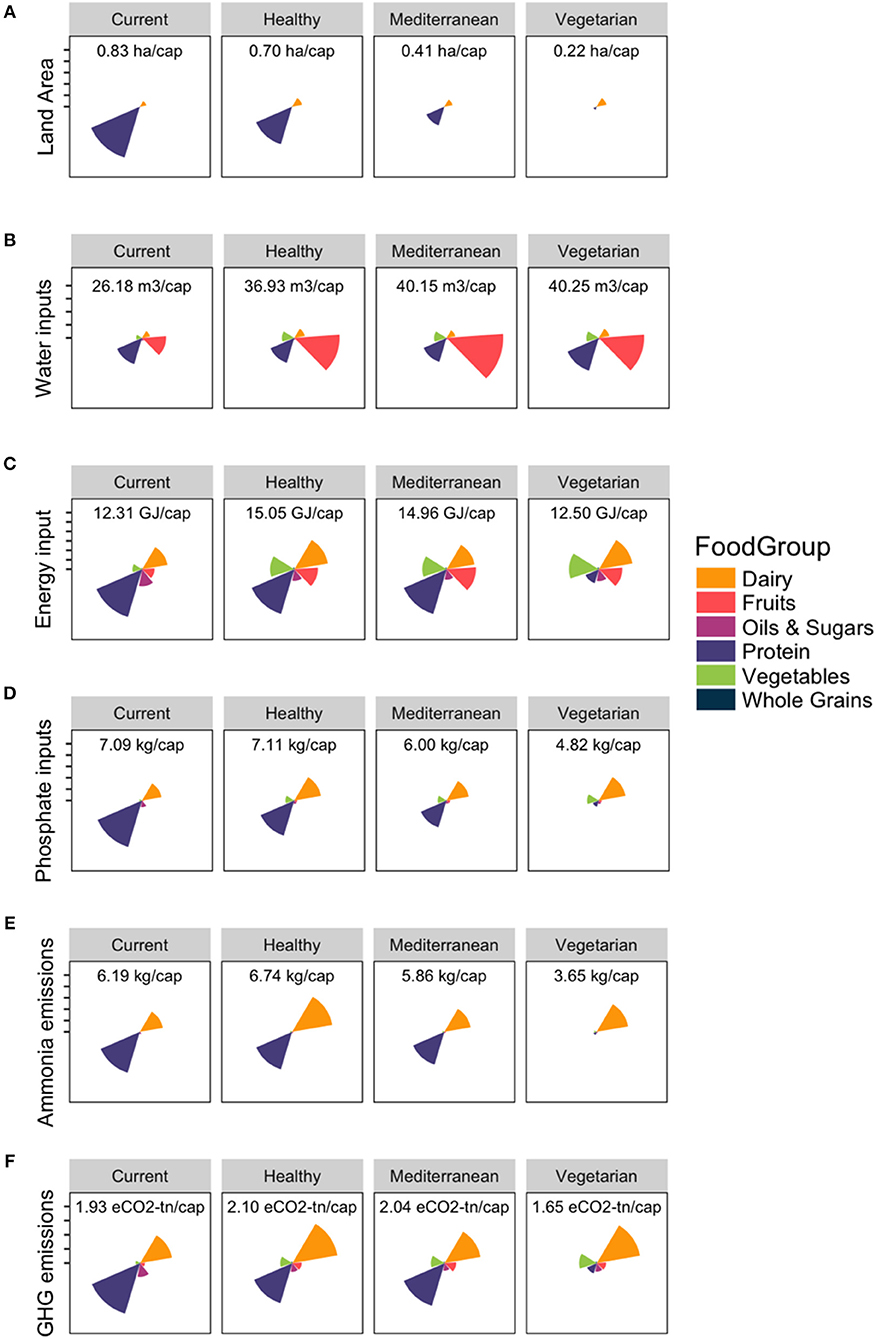
Figure 3. Comparison of the relative environmental footprints for the six major diet food groups as measured by (A) land area, (B) blue water input requirements, (C) energy input requirements, (D) phosphate input requirements, (E) ammonia emissions and (F) greenhouse gas emissions (eCO2) for the current diet and three recommended diet patterns from the 2015–2020 Dietary Guidelines for Americans at a common 2,600 kcal intake level. Petal size is scaled relative to the largest value within an environmental footprint category and the total per-capita size of each diet's footprint is listed at the top of each panel.
Discussion
This study aims to provide information to consumers on the relative impact that changes in diet composition, caloric intake, and food waste behaviors can have on their dietary footprint. Overall we find that shifting composition of the diet from the current American diet toward Healthy, Mediterranean or Vegetarian diets can have a stronger impact on multiple environmental indicators than reducing caloric intake or food waste alone. In particular, we found that reduction of animal-protein foods, especially red meat and dairy, dramatically reduces the quantity of resources need to produce a diet, while increasing fruits and vegetables led to increases in blue water requirements and potentially energy demand. Combining a shift in diet composition with either reduced caloric intake and/or food waste provided additional benefits that together could spare significant land and resources from production. Only reducing caloric intake and/or reducing food waste still led to important reductions in the dietary footprint that together could spare over 50 million hectares of land from production while feeding the US population in 2051. Together these results suggest there are multiple pathways for consumers to transition to more environmentally sustainable diets.
Sustainable Diets for a Sustainable Planet
In 2010, the FAO defined sustainable diets as those “with low environmental impacts which contribute to food and nutrition security and to healthy life for present and future generations. Sustainable diets are protective and respectful of biodiversity and ecosystems, culturally acceptable, accessible, economically fair and affordable; nutritionally adequate, safe and healthy; while optimizing natural and human resources” (Burlingame and Dernini, 2012). Agriculture is at the center of the sustainability crisis through its links to land use, water, nutrition, health, economy and global nutrient cycles (Willett et al., 2019). As the population increases to 9 billion over the coming decades, so to will the pressure to identify and characterize more sustainable diets that address the social, ecological and economically-linked challenges. Efforts to date have also focused on identifying the appropriate metrics to evaluate the sustainability of diets. Gustafson et al. (2016) proposed a framework to evaluate the performance of national food systems based on seven dimensions of sustainable nutrition security, which has recently been applied to evaluate national food systems in 156 countries (Chaudhary et al., 2018). In general, this assessment found that wealthy countries performed well across most metrics; however, they scored poorly on environmental, waste and health-sensitive nutrient intake indicators (Chaudhary et al., 2018).
In an effort to guide the transformation to sustainable and healthy food systems, Willett et al. (2019) used an integrative framework on healthy diets and sustainable food systems combined with scientific targets to identify a universal reference diet that is both healthy and environmentally sustainable, and adaptable to all local food cultures. Globally, a transformation to such healthy diets by 2050 will require significant dietary shifts, including at least a 50% reduction in consumption of red meat and sugar, as well as doubling in consumption of nuts, fruits, vegetables and legumes. However, the shifts needed by region differ greatly. In line with such recommendations, the Canadian dietary guidelines is, to date, one of the first to recognizing both health and environmental sustainability concerns as well as food literacy in their recommendations (Grant and Jenkins, 2018). In the United States, the proposed universal reference diet is most similar to an combination of the 2015–2020 Dietary Guidelines' Mediterranean diet pattern at 2,000 kcal/d (but with half the recommended portion of meats, eggs, and diary) with the greater intake of vegetables and whole grains from the Vegetarian diet at 3,200 kcal/d.
However, Willett et al. (2019) suggest that simply following this universal healthy reference diet with our current food production system will not in itself be environmentally sustainable. These systems can be deeply inefficient in terms of inputs (especially in many wealthy nations such as the US) as well as inefficient in terms of outputs (e.g., yield gaps in many developing countries). Shifts in diet must be accompanied by major technological improvements in input-efficiency, closing of yield gaps, reduction in food waste and shifts in farming practices toward low-carbon systems (Foley et al., 2011; Ray et al., 2013; Bajželj et al., 2014; Willett et al., 2019). A multi-pronged approach, with targeted actions at each step in the food system, from farm production system, retail transformation, to consumer behavior will need to be implemented in order to achieve healthy diets for people and the planet. They also stress that governance systems must implement a zero expansion policy of new agricultural land, and should aim to restore and reforest degraded lands that can be taken out of production.
Sparing Land Through Diet Choices
In 2016, there were 154.2 million hectares of arable land cultivated in the United States, of which ~2.6 million were permanent crops (FAO, 2018). A further 251 million hectares were classified as permanent meadows and pastures and used to raise livestock (FAO, 2018). Biophysical diet simulations by Peters et al. (2016) suggest that the carrying capacity of the agricultural land in the United States is highly dependent on the diets adopted by people. Their models suggest that the national land base could potentially support between 400 and 800 million people, on a current or lacto-ovo-vegetarian diet, respectively. Based on our calculation of the current diet, ~259 Mha of the 270 Mha required to support the 2016 population on this diet are pasture and feed crops to support the production of animal-based food items, with the remaining 11 Mha dedicated to grains, fruits, vegetables, sugars, and oils.
Even relatively small changes in diet patterns and food waste reduction could potentially spare millions of hectares of land that could be re-oriented toward other production systems (e.g., biofuels production) or retired from production and restored. As suggested in Peters et al. (2016) biophysical simulations, the majority of the land that would be “spared” with diet shifts will result from decreases in meat consumption. This implies these would be composed primarily of rangeland, pasture and permanent meadows used to support animal production, and to a smaller extent cropland currently used to produce livestock feed. As in other landscapes, slopping and/or marginal lands with low or degraded soil quality and low productivity would conceivably be taken out of production first (e.g., Gellrich and Zimmermann, 2007; Sluiter and de Jong, 2007; Prishchepov et al., 2013) and allowed to regenerate into natural habitats, supporting biodiversity and ecosystem services. Rangelands, due to their low fertility, are also more likely to be abandoned. In contrast, cultivated fertile lands released from food production for domestic consumption, may remain under new forms of production with products destined for other markets (Harvey and Pilgrim, 2011).
Shifts in food consumption patterns are also recommended from a dietary perspective. The current diet is considered to have an overly high consumption of oils, sugars and processed foods and low intake of fruits, vegetables, and whole grains for achieving a healthy life (Rehm et al., 2016; Steele et al., 2016). These intake patterns have been linked with rising rates of obesity (da Costa Louzada et al., 2015; Monteiro et al., 2018) and the risk of non-communicable diseases (Lim et al., 2012; McEvoy et al., 2012), in combinations with other health factors such as activity level. Thus, in order to address the double challenge of negative impacts of diets on both human and environmental health, shifts in the composition of diets are needed.
Shifting Impacts of Shifting Diets
Changes in diet lead to changes in environmental outcomes owing to the unique resource requirements to produce food items and their environmental impacts. Each of our scenarios presents a unique composition of environmental impacts based on the combination and quantity of foods included in the diet. We found that shifting the composition and/or intake level from the current diet toward healthier diets could lead to larger environmental footprints when multiple indicators were assessed. Using a different methodology to compose diets and estimate impacts, Blackstone et al. (2018) also compared the environmental and policy implications of the three diet patterns from the 2015–2020 Dietary Guidelines for Americans. Similar to ours, their study found the Vegetarian diet resulted in lower impacts across indicators (42–84%) than the Healthy or Mediterranean diet patterns, with the exception of water depletion (which was similar). However, they did not compare these impacts with those of the current American diet.
In our study, we find that two of the three recommended diet patterns from the 2015–2020 Dietary Guidelines result in higher environmental impacts that the current average American diet. These findings are confirmed by Tom et al. (2016) who found that a switch from the current diet to one (based in part) on the 2015–2020 Dietary Guidelines, would increase GHG emissions by 11%, blue water use by 16%, and energy input by 43%; meanwhile reducing the size of the diet generally would help to reduce inputs, but could still lead to small increases resource use in the case of a healthier diet. Similarly, Birney et al. (2017) found that a shift in diet composition accompanied by a reduction in food waste would still increase per capita food-related energy and increase fertilizer use by 12%, but decrease blue and green water consumption (4–23%), land use (32%), as well as GHG emissions across sectors. This suggests that there is a need to address food waste, diet size and diet composition simultaneously in order to mitigate environmental impacts of healthier diets.
For the average consumer, navigating these trade-offs to reduce their impact across one or more environmental dimension can be overwhelming. Studies have shown that the average American consumer incorrectly believes that the greatest environmental impacts of their diet come from excess packaging, and that reducing meat consumption has few environmental benefits (Tobler et al., 2011), despite numerous studies reporting to the contrary (Tilman and Clark, 2014; van Dooren et al., 2014; Heller and Keoleian, 2015; Peters et al., 2016). When presented with health and environmental impacts, Western consumers are often least willing to change their meat consumption due social and culture values associated with meat (Macdiarmid, 2013). Instead efforts to present healthy food choices in socially and culturally compelling ways are more likely to result in changes to food choices (Turnwald and Crum, 2019; White et al., 2019). Rehm et al. (2016) also show that between 1999 and 2012 diets have slowly improved in the US, albeit in some segments of society faster than others, suggesting we are on the right track but moving too slowly.
Increasingly health-oriented dietary guidelines for middle-income and wealthy countries (Grant and Jenkins, 2018), as well as studies (Tilman and Clark, 2014) recommend reducing intake of animal-based foods, in particular of red and processed meats, due to negative health implications [(Lim et al., 2012; International Agency for Research on Cancer (IARC), 2015); Richi et al., 2015] in favor of plant-based foods. It will be increasingly important that national dietary guidelines take environmental health into consideration during their design (Blackstone et al., 2018), as has been done in Canada (Grant and Jenkins, 2018). From the above studies it is clear that the three, equally-recommended healthy diet patterns of the 2015–2020 Dietary Guidelines very different environmental impacts. By providing information on the relative impacts of a shift in diet, intake and/or food waste by food groups, this study hopes to provide consumers with more practical information on the impacts of their individual food choices on the environment. As well, it illustrates that there are multiple dietary pathways to reducing environmental footprints by combining shifts in composition, intake and importantly, waste reduction.
Strengths and Limitations
We found that our study design was relatively robust to the specific foods selected to represent each food group. Our estimates of the impacts of the current diet, constructed from average diets from the NHANES reported by Rehm et al. (2016), were similar to GHG emissions and energy impacts recently estimated for individual self-selected diets from the NHANES (Heller et al., 2018). Using a database of over 6,000 as-consumed foods and dishes from 1 day dietary recall data linked to food lifecycle assessments (LCA), Heller and colleagues (2018) estimated that the average individual self-selected diet in the US was associated with 1.7 tn GHG emissions and 9.2 GJ of energy input per year. These values are slightly lower than our estimates (1.9 tn/yr and 12.3 GJ/yr respectively), which is partly explained by their consideration of cradle-to-farm-gate LCA values while values used from Meier and Christen (2012) used in our study are cradle-to-store bounded values. However, by using average LCIA values for food groups rather than as-consumed food items we do not distinguish between raw foods and ultra-processed foods, which make up a large component of American diets (Steele et al., 2017). Highly and ultra-processed food items require significantly more resources to produce due to wider list of sourced-ingredients, and greater processing and transportation (Tasca et al., 2017). Thus, our calculations may underestimate the full impact of the current diet.
We also found that our analytical framework was particularly sensitive to the ratio of meats included in the diet. For the Healthy diet we assigned equal portions 1:1:1:1 of the three meat types (beef, chicken, and processed pork) and egg based on the ratio of consumption in the current diet, while we shifted the composition to 1:3:3:3 in the Mediterranean diet. This drove a significant portion of the difference in land use and phosphate requirements between the two diets, despite similar levels of recommended animal-protein intake. Thus, assumptions about the relative impact of these diets depend strongly on the quantity of red meat in the diet. People following a recommended Healthy diet whose protein intake is composed primarily of chicken and pork will have a substantially smaller the environmental footprint compared to people following a Healthy diet whose protein intake is composed primarily of red meat (Richi et al., 2015). Such an dietary shift may help to simultaneously achieve a healthy diet, reduce land demands while balancing increased water demands associated with recommended fruit and vegetables intake that are very high under a Mediterranean diet.
Another limitation of our study is the assumption that all food consumed in our scenarios is produced within the United States under Western industrial farming and economic systems. A non-trivial portion of the food consumed within the United States is imported from other countries (~17%) (Tom et al., 2016), who bare the environmental burden for its production in terms of land, resource inputs and pollution. In this study, we do not explicitly consider the ecological impacts of consuming foods grown in other countries, of which the primary imports are tropical fruits and vegetables from countries in Mexico and Central America, and grain and animals from Canada (Table SM3, FAO, 2018). While production in Canada is likely similar to that in the US and Germany (where the LCAI values are derived), produce from Mexico and Central America are likely grown under very different agro-ecological, environmental and economic conditions that may lead to differences in resource requirements and food waste along the retail chain. This adds an important uncertainty to our estimations of environmental impact, as well as consideration for where these impacts are most likely to occur. Fruits and vegetables grown in tropical climates may have better access to rainfall and not require greenhouses than the same crops grown in more temperate climates, thereby reducing the resource inputs required, however average productivity in these countries is often lower.
Conclusions
We find that there are multiple pathways for health-conscious and environmentally-conscious consumers to reduce their dietary footprint. Our results show shifting diet composition has a greater impact on resource inputs needed to support diets than shifts in caloric intake or waste reduction. Nevertheless, reducing caloric intake and food waste each have significant individual and as well as additive impacts on resource efficiency that should not be overlooked in strategies toward healthier and more sustainable food systems. Overall, reducing animal products in the diets had the greatest impact on reducing land and phosphate inputs, while increasing fruit and vegetable intake leads to substantial increases in the amount of water and possibly energy needed to produce these diets. The trade-offs between food groups based on the inherent the resource-intensity of their production challenge our capacity to achieve balanced, healthy and sustainable diets without significant changing the way our food is produced. However, by combining a number of incremental shifts to diet composition, intake level, and food waste, significant reductions in the diet footprint could be achieved and potentially spare millions of hectares of land from production in the future. These results suggest that in our efforts to guide people toward healthier diets, food guidelines must also be cognizant of impacts recommendations have on multiple dimensions of environmental health.
Data Availability Statement
Publicly available datasets were analyzed in this study. This data can be found here: https://jamanetwork.com/journals/jama/fullarticle/2529628?platform=hootsuite.
Author Contributions
MA conceived the initial study. SW carried out data collection, analysis, and interpretation of results. All authors contributed to the design of the study and the writing of the manuscript.
Conflict of Interest
The authors declare that the research was conducted in the absence of any commercial or financial relationships that could be construed as a potential conflict of interest.
Acknowledgments
We acknowledge financial support from Social Sciences and Humanities Research Council of Canada (Grant: 435-2017-1078).
Supplementary Material
The Supplementary Material for this article can be found online at: https://www.frontiersin.org/articles/10.3389/fsufs.2019.00089/full#supplementary-material
References
Bajželj, B., Richards, K. S., Allwood, J. M., Smith, P., Dennis, J. S., Curmi, E., et al. (2014). Importance of food-demand management for climate mitigation. Nat. Clim. Chang. 4:924. doi: 10.1038/nclimate2353
Birney, C. I., Franklin, K. F., Davidson, F. T., and Webber, M. E. (2017). An assessment of individual foodprints attributed to diets and food waste in the United States. Environ. Res. Lett. 12:105008.
Blackstone, N. T., El-Abbadi, N. H., McCabe, M. S., Griffin, T. S., and Nelson, M. E. (2018). Linking sustainability to the healthy eating patterns of the Dietary Guidelines for Americans: a modelling study. Lancet Planetary Health 2, e344–e352. doi: 10.1016/S2542-5196(18)30167-0
Bruinsma, J. (2009). “The resource outlook to 2050: by how much do land, water and crop yields need to increase by 2050,” in Expert Meeting on How to Feed the World, Vol. 2050 (Rome: Food and Agriculture Organization of the United Nations, 24–26.
Burlingame, B., and Dernini, S. (2012). “Sustainable diets and biodiversity: directions and solutions for policy, research and action,” in International Scientific Symposium, Biodiversity and Sustainable Diets United Against Hunger, 3–5 November 2010 (Rome, Italy: Food and Agriculture Organization of the United Nations).
Buzby, J. C., Farah-Wells, H., and Hyman, J. (2014). The estimated amount, value, and calories of postharvest food losses at the retail and consumer levels in the United States. USDA ERS Econ. Inf. Bull. 121, 1–30. doi: 10.2139/ssrn.2501659
Chaudhary, A., Gustafson, D., and Mathys, A. (2018). Multi-indicator sustainability assessment of global food systems. Nat. Commun. 9:848. doi: 10.1038/s41467-018-03308-7
Conrad, Z., Johnson, L. K., Peters, C. J., and Jahns, L. (2018). Capacity of the US food system to accommodate improved diet quality: a biophysical model projecting to 2030. Curr. Dev. Nutr. 2:nzy007. doi: 10.1093/cdn/nzy007
Conrad, Z., Peters, C., Chui, K., Jahns, L., and Griffin, T. (2017). Agricultural capacity to increase the production of select fruits and vegetables in the US: a geospatial modeling analysis. Int. J. Environ. Res. Public Health 14:1106. doi: 10.3390/ijerph14101106
da Costa Louzada, M. L., Baraldi, L. G., Steele, E. M., Martins, A. P. B., Canella, D. S., Moubarac, J. C., et al. (2015). Consumption of ultra-processed foods and obesity in Brazilian adolescents and adults. Prevent. Med. 81, 9–15. doi: 10.1016/j.ypmed.2015.07.018
Davis, E. (2017). Evaluating agricultural land use patterns in relation to food systems, bioenergy, and carbon mitigation (Doctoral dissertation), State College, United States: Pennsylvania State University.
Dobermann, A., and Nelson, R. (2013). Opportunities and Solutions for Sustainable Food Production. Paris: Sustainable Development Solutions Network.
Dobrovolski, R., Diniz-Filho, J. A. F., Loyola, R. D., and Júnior, P. D. M. (2011). Agricultural expansion and the fate of global conservation priorities. Biodivers. Conserv. 20, 2445–2459. doi: 10.1007/s10531-011-9997-z
Eshel, G., Shepon, A., Makov, T., and Milo, R. (2014). Land, irrigation water, greenhouse gas, and reactive nitrogen burdens of meat, eggs, and dairy production in the United States. Proc. Natl. Acad. Sci, U.S.A. 111, 11996–12001. doi: 10.1073/pnas.1402183111
FAO (2014). FAOStat Data on Production of Crops and Live Animals for the United States of America in 2014. Rome: The Food and Agriculture Organization of the United Nations. Avail;able online at: http://www.fao.org/faostat/en/#data/QC (accessed February 8, 2018).
FAO (2018). FAOStat Selected Indicators for the United States of America in 2018. Rome: The Food and Agriculture Organization of the United Nations. Avail;able onl;ine at: http://www.fao.org/faostat/en/#country/231 (accessed April 5, 2019).
Foley, J. A., DeFries, R., Asner, G. P., Barford, C., Bonan, G., Carpenter, S. R., et al. (2005). Global consequences of land use. Science 309, 570–574. doi: 10.1126/science.1111772
Foley, J. A., Ramankutty, N., Brauman, K. A., Cassidy, E. S., Gerber, J. S., Johnston, M., et al. (2011). Solutions for a cultivated planet. Nature 478:337. doi: 10.1038/nature10452
Ford, E. S., and Dietz, W. H. (2013). Trends in energy intake among adults in the United States: findings from NHANES. Am. J. Clin. Nutr. 97:848. doi: 10.3945/ajcn.112.052662
Gellrich, M., and Zimmermann, N. E. (2007). Investigating the regional-scale pattern of agricultural land abandonment in the Swiss mountains: a spatial statistical modelling approach. Landsc. Urban Plan. 79, 65–76. doi: 10.1016/j.landurbplan.2006.03.004
Grant, J. D., and Jenkins, D. J. (2018). Resisting influence from agri-food industries on Canada's new food guide. Can. Med. Assoc. J. 190:e451. doi: 10.1503/cmaj.180037
Gustafson, D., Gutman, A., Leet, W., Drewnowski, A., Fanzo, J., and Ingram, J. (2016). Seven food system metrics of sustainable nutrition security. Sustainability 8:196. doi: 10.3390/su8030196
Guyomard, H., Darcy-Vrillon, B., Esnouf, C., Marin, M., Russel, M., and Guillou, M. (2012). Eating patterns and food systems: critical knowledge requirements for policy design and implementation. Agric. Food Secur. 1:13. doi: 10.1186/2048-7010-1-13
Harvey, M., and Pilgrim, S. (2011). The new competition for land: food, energy, and climate change. Food Policy 36, S40–S51. doi: 10.1016/j.foodpol.2010.11.009
Heller, M. C., and Keoleian, G. A. (2015). Greenhouse gas emission estimates of US dietary choices and food loss. J. Ind. Ecol. 19, 391–401. doi: 10.1111/jiec.12174
Heller, M. C., Willits-Smith, A., Meyer, R., Keoleian, G. A., and Rose, D. (2018). Greenhouse gas emissions and energy use associated with production of individual self-selected US diets. Environ. Res. Lett. 13:044004. doi: 10.1088/1748-9326/aab0ac
HLPE (2013). Investing in Smallholder Agriculture for Food Security. A Report by the High Level Panel of Experts on Food Security and Nutrition of the Committee on World Food Security. Rome.
Hosonuma, N., Herold, M., De Sy, V., De Fries, R. S., Brockhaus, M., Verchot, L., et al. (2012). An assessment of deforestation and forest degradation drivers in developing countries. Environ. Res. Lett. 7:044009. doi: 10.1088/1748-9326/7/4/044009
Howarth, R. W. (2008). Coastal nitrogen pollution: a review of sources and trends globally and regionally. Harmful Algae 8, 14–20. doi: 10.1016/j.hal.2008.08.015
IIASA/FAO (2012). Global Agro-Ecological Zones (GAEZ v3.0). IIASA, Laxenburg, Austria and FAO, Rome, Italy.
International Agency for Research on Cancer (IARC) (2015). “Red mean and processed meat/IARC working group on the evaluation of carcinogenic risks to humans,” in IARC Monographs on the Evaluation of Carcinogenic Risks to Humans, Vol. 14, 1–511. Available online at: https://monographs.iarc.fr/wp-content/uploads/2018/06/mono114.pdf
Lenzen, M., Moran, D., Kanemoto, K., Foran, B., Lobefaro, L., and Geschke, A. (2012). International trade drives biodiversity threats in developing nations. Nature 486:109. doi: 10.1038/nature11145
Lim, S. S., Vos, T., Flaxman, A. D., Danaei, G., Shibuya, K., Adair-Rohani, H., et al. (2012). A comparative risk assessment of burden of disease and injury attributable to 67 risk factors and risk factor clusters in 21 regions, 1990–2010: a systematic analysis for the Global Burden of Disease Study 2010. Lancet 380, 2224–2260. doi: 10.1016/S0140-6736(12)61766-8
Macdiarmid, J. I. (2013). Is a healthy diet an environmentally sustainable diet? Proc. Nutr. Soc. 72, 13–20. doi: 10.1017/S0029665112002893
Martin-Guay, M. O., Paquette, A., Dupras, J., and Rivest, D. (2017). The new green revolution: agricultural intensification by intercropping. Sci. Total Environ. 615, 767–772. doi: 10.1016/j.scitotenv.2017.10.024
Mbow, C., and Rosenzweig, C. (2019). “Chapter 5: food security,” in Climate Change and Land: an IPCC Special Report on Climate Change, Desertification, Land Degradation, Sustainable Land Management, Food Security, and Greenhouse Gas Fluxes in Terrestrial Ecosystems.
McEvoy, C. T., Temple, N., and Woodside, J. V. (2012). Vegetarian diets, low-meat diets and health: a review. Public Health Nutr. 15, 2287–2294. doi: 10.1017/S1368980012000936
Meier, T., and Christen, O. (2012). Environmental impacts of dietary recommendations and dietary styles: Germany as an example. Environ. Sci. Technol. 47, 877–888. doi: 10.1021/es302152v
Monteiro, C. A., Moubarac, J. C., Levy, R. B., Canella, D. S., da Costa Louzada, M. L., and Cannon, G. (2018). Household availability of ultra-processed foods and obesity in nineteen European countries. Public Health Nutr. 21, 18–26. doi: 10.1017/S1368980017001379
National Health and Nutrition Examination Survey (NHANES). (2012). US Centers for Disease Control and Prevention: MEC in-Person Dietary Interviewers Procedures Manual. Available online at: http://www.cdc.gov/nchs/data/nhanes/nhanes_09_10/DietaryInterviewers_Inperson.pdf (accessed September 28, 2014).
Peters, C. J., Picardy, J., Wilkins, J. L., Griffin, T. S., Fick, G. W., and Darrouzet-Nardi, A. F. (2016). Carrying capacity of US agricultural land: ten diet scenarios. Elementa 4:1. doi: 10.12952/journal.elementa.000116
Pimentel, D. (1997). “Livestock production: energy inputs and the environment,” in Canadian Society of Animal Science, Proceedings, Vol. 47, eds S. L. Scott and X. Zhao (Montreal, QC: Canadian Society of Animal Science, 17–26.
Pimentel, M. (2003). Sustainability of meat-based and plant based diets and the environment. Am. J. Clin. Nutr. 78, 660–663. doi: 10.1093/ajcn/78.3.660S
Pretty, J. N., Noble, A. D., Bossio, D., Dixon, J., Hine, R. E., Penning de Vries, F. W., et al. (2006). Resource-conserving agriculture increases yields in developing countries. Environ. Sci. Technol. 40, 1114–1119. doi: 10.1021/es051670d
Prishchepov, A. V., Müller, D., Dubinin, M., Baumann, M., and Radeloff, V. C. (2013). Determinants of agricultural land abandonment in post-Soviet European Russia. Land Use Policy 30, 873–884. doi: 10.1016/j.landusepol.2012.06.011
Ramankutty, N., and Foley, J. A. (1999). Estimating historical changes in global land cover: croplands from 1700 to 1992. Global Biogeochem. Cycles 13, 997–1027. doi: 10.1029/1999GB900046
Ray, D. K., Mueller, N. D., West, P. C., and Foley, J. A. (2013). Yield trends are insufficient to double global crop production by 2050. PLoS ONE 8:e66428. doi: 10.1371/journal.pone.0066428
Rehm, C. D., Peñalvo, J. L., Afshin, A., and Mozaffarian, D. (2016). Dietary intake among US adults, 1999-2012. JAMA 315, 2542–2553. doi: 10.1001/jama.2016.7491
Richi, E. B., Baumer, B., Conrad, B., Darioli, R., Schmid, A., and Keller, U. (2015). Health risks associated with meat consumption: a review of epidemiological studies. Int. J. Vitam. Nutr. Res. 85, 70–78. doi: 10.1024/0300-9831/a000224
Sluiter, R., and de Jong, S. M. (2007). Spatial patterns of Mediterranean land abandonment and related land cover transitions. Landsc. Ecol. 22, 559–576. doi: 10.1007/s10980-006-9049-3
Smith, P., Bustamante, M., Ahammad, H., Clark, H., Dong, H., Elsiddig, E. A., et al. (2014). “Agriculture, Forestry and Other Land Use (AFOLU),” in Climate Change 2014: Mitigation of Climate Change. Contribution of Working Group III to the Fifth Assessment Report of the Intergovernmental Panel on Climate Change, eds O. Edenhofer, R. Pichs-Madruga, Y. Sokona, E. Farahani, S. Kadner, K. Seyboth, et al. (Cambridge; New York, NY: Cambridge University Press), 811–922.
Speedy, A. W. (2003). Global production and consumption of animal source foods. J. Nutr. 133, 4048S–4053S.
Springer, N. P., and Duchin, F. (2014). Feeding nine billion people sustainably: conserving land and water through shifting diets and changes in technologies. Environ. Sci. Technol. 48, 4444–4451. doi: 10.1021/es4051988
Steele, E. M., Baraldi, L. G., da Costa Louzada, M. L., Moubarac, J. C., Mozaffarian, D., and Monteiro, C. A. (2016). Ultra-processed foods and added sugars in the US diet: evidence from a nationally representative cross-sectional study. BMJ Open 6:e009892. doi: 10.1136/bmjopen-2015-009892
Steele, E. M., Popkin, B. M., Swinburn, B., and Monteiro, C. A. (2017). The share of ultra-processed foods and the overall nutritional quality of diets in the US: evidence from a nationally representative cross-sectional study. Popul. Health Metr. 15:6. doi: 10.1186/s12963-017-0119-3
Steffen, W., Richardson, K., Rockström, J., Cornell, S. E., Fetzer, I., Bennett, E. M., et al. (2015). Planetary boundaries: guiding human development on a changing planet. Science 347:1259855. doi: 10.1126/science.1259855
Tasca, A. L., Nessi, S., and Rigamonti, L. (2017). Environmental sustainability of agri-food supply chains: an LCA comparison between two alternative forms of production and distribution of endive in northern Italy. J. Clean. Prod. 140, 725–741. doi: 10.1016/j.jclepro.2016.06.170
Tilman, D., and Clark, M. (2014). Global diets link environmental sustainability and human health. Nature 515:518. doi: 10.1038/nature13959
Tilman, D., Fargione, J., Wolff, B., D'antonio, C., Dobson, A., Howarth, R., et al. (2001). Forecasting agriculturally driven global environmental change. Science 292, 281–284. doi: 10.1126/science.1057544
Tobler, C., Visschers, V. H., and Siegrist, M. (2011). Eating green. Consumers' willingness to adopt ecological food consumption behaviors. Appetite 57, 674–682. doi: 10.1016/j.appet.2011.08.010
Tom, M. S., Fischbeck, P. S., and Hendrickson, C. T. (2016). Energy use, blue water footprint, and greenhouse gas emissions for current food consumption patterns and dietary recommendations in the US. Environ. Syst. Decisions 36, 92–103. doi: 10.1007/s10669-015-9577-y
Tubiello, F. N., Salvatore, M., Ferrara, A. F., House, J., Federici, S., Rossi, S., et al. (2015). The contribution of agriculture, forestry and other land use activities to global warming, 1990–2012. Glob. Chang. Biol. 21, 2655–2660. doi: 10.1111/gcb.12865
Turnwald, B. P., and Crum, A. J. (2019). Smart food policy for healthy food labeling: leading with taste, not healthiness, to shift consumption and enjoyment of healthy foods. Prevent. Med. 119, 7–13. doi: 10.1016/j.ypmed.2018.11.021
U.S. Department of Agriculture Economic Research Service (USDA-ERS) (2016). Food Availability (Per Capita) Data System Loss-Adjusted Food Availability.
U.S. Department of Health Human Services U.S. Department of Agriculture. (2015). 2015–2020 Dietary Guidelines for Americans, 8th Edn. Available online at: http://health.gov/dietaryguidelines/2015/guidelines/ (accessed December 2017).
United Nations DESA (2017). 2017 Revision of World Population Prospects. Available online at: https://population.un.org/wpp/
van Dooren, C., Marinussen, M., Blonk, H., Aiking, H., and Vellinga, P. (2014). Exploring dietary guidelines based on ecological and nutritional values: a comparison of six dietary patterns. Food Policy 44, 36–46. doi: 10.1016/j.foodpol.2013.11.002
White, K., Habib, R., and Hardisty, D. J. (2019). How to SHIFT consumer behaviors to be more sustainable: a literature review and guiding framework. J. Mark. 83, 22–49. doi: 10.1177/0022242919825649
Willett, W., Rockström, J., Loken, B., Springmann, M., Lang, T., Vermeulen, S., et al. (2019). Food in the Anthropocene: the EAT–Lancet Commission on healthy diets from sustainable food systems. Lancet 393, 447–492. doi: 10.1016/S0140-6736(18)31788-4
Wright, J. D., and Wang, C. Y. (2010). Trends in Intake of Energy and Macronutrients in Adults From 1999–2000 Through 2007–2008. NCHS Data Brief no. 49. Available online at http://www.cdc.gov/nchs/data/databriefs/db49.htm
Keywords: diet composition, food waste, caloric intake, land use, ecological footprint, sustainability
Citation: Wood SLR, Alam M and Dupras J (2019) Multiple Pathways to More Sustainable Diets: Shifts in Diet Composition, Caloric Intake and Food Waste. Front. Sustain. Food Syst. 3:89. doi: 10.3389/fsufs.2019.00089
Received: 26 April 2019; Accepted: 23 September 2019;
Published: 23 October 2019.
Edited by:
Rakesh Bhardwaj, National Bureau of Plant Genetic Resources (ICAR), IndiaReviewed by:
Jai Chand Rana, National Bureau of Plant Genetic Resources (ICAR), IndiaRené Cerritos, National Autonomous University of Mexico, Mexico
Copyright © 2019 Wood, Alam and Dupras. This is an open-access article distributed under the terms of the Creative Commons Attribution License (CC BY). The use, distribution or reproduction in other forums is permitted, provided the original author(s) and the copyright owner(s) are credited and that the original publication in this journal is cited, in accordance with accepted academic practice. No use, distribution or reproduction is permitted which does not comply with these terms.
*Correspondence: Sylvia L. R. Wood, c3lsdmllLndvb2RAZ21haWwuY29t