 Eros Borsato
 Lorenzo Rosa
 Francesco Marinello
 Paolo Tarolli
 Paolo D'Odorico
- 1Department of Land, Environment, Agriculture and Forestry, University of Padua, Padua, Italy
- 2Department of Environmental Science Policy and Management, University of Berkeley, Berkeley, CA, United States
Agriculture strongly relies on irrigation. While irrigated land accounts for roughly 20% of the global cultivated area, it contributes to about 40% of crop production. In the last few decades, the growing demand for agricultural commodities has translated into an increasing pressure on the global freshwater resources, often leading to their unsustainable use. Here we investigate the sustainability of irrigation, balancing farmers' profit generation objectives and the needs of ecological systems. We ask the question “sustainability of what?” to stress how the sustainability of irrigation is often evaluated with respect the opposing needs of humans and nature. While from the farmers' perspective irrigation is sustainable when it provides uninterrupted access to water resources at a price not exceeding the marginal revenue they generate (clearly without accounting for environmental externalities), from the standpoint of water resources, irrigation is sustainable if it does not deplete freshwater stocks or environmental flows. We invoke the notions of “weak” and “strong” sustainability to develop a novel framework for the evaluation of tradeoffs between human needs and the conservation of natural capital. Through the analysis of criteria of performance, we relate water deficit and irrigation overuse to the reliability and resilience of irrigation. This approach is applied to the case of Australia, a major agricultural country affected by water scarcity. The application of the framework to the case of Australia shows how this approach can be used to highlight areas in which irrigation contributes to a weakly sustainable use of water resources with impacts on environmental flows and groundwater stocks. Solutions, such as increasing efficiencies or reducing water applications through the adoption of deficit irrigation, can enhance water sustainability in some water scarce locations.
Introduction
The economic productivity of a number of human activities depends on access to water resources (Sullivan, 2002; D'Odorico et al., 2018). With about 24% of global land area suffering from severe water scarcity (Alcamo et al., 2003), and 35% of the global population living in areas affected by water shortages (Rockström et al., 2014), economic development often occurs at the cost of overexploitation of water resources (Savenije and van der Zaag, 2002), which ultimately leads to ecosystem degradation (Sullivan, 2002).
Agriculture is a major player in the human appropriation of water resources (Green et al., 2015). About 70% of global freshwater withdrawals are used for irrigation to sustain global crop production (Rockström et al., 2017). In fact, irrigated areas account for 18% of global croplands but contribute to about 40% of global food production (Chartzoulakis and Bertaki, 2015; Food Agriculture Organization, 2019). At the same time 40% of global irrigation practices are unsustainable because they deplete environmental flows and/or groundwater stocks (Wada and Bierkens, 2014; Rosa et al., 2018). The strong coupling existing between economic and environmental needs for water resources raises important questions that are the core of the water sustainability debate: How can human appropriation of water resources sustain economic activities—e.g., agriculture—without depleting water stocks, aquatic habitats, or other ecosystem services? (D'Odorico et al., 2018; Rosa et al., 2018). In the specific context of agriculture, sustainable irrigation strategies need to allow for an increase in crop production to meet rising food needs, while ensuring that natural resources (e.g., groundwater stocks, freshwater ecosystems, and water quality) are not irreversibly depleted (Borsato et al., 2019; Rosa et al., 2019).
The terms “sustainability” is often used to indicate the management, use, and conservation of natural resources in a way that they remain available to future generations (Sands and Podmore, 2000; FAO, 2013; Borsato et al., 2018a). In more anthropocentric terms, “sustainability” is also used to indicate a condition that allows the needs of the present generation to be satisfied “without compromising the ability of future generations to meet their own needs” (FAO, 1989). According to this perspective, the focus is on human needs and not on the preservation of natural resources. Lack of recognition of the central role of natural resources and environmental endowments—also known as “natural capital”—in the definition of sustainability has led to a “weak” notion of sustainability (Solow, 1974). “Weak sustainability” corresponds to conditions that allow natural capital to be replaced by human-made capital, as long as their sum (i.e., natural + human-made) does not decrease over time (Solow, 1974; Hartwick, 1978). Thus, the total amount of endowments or assets future generations can enjoy is not less than that of their ancestors (Groenfeldt, 2019). In a weakly sustainable system, natural and human capital are interchangeable, in the sense that natural capital can be sacrificed in the process of producing human-made capital (i.e., human-made goods). For instance, crop production and the associated profits can occur at the cost of aquatic habitat destruction and groundwater depletion (Wada et al., 2010; Gerten et al., 2013; Jägermeyr et al., 2017; Rosa et al., 2018). The loss of natural capital, however, poses questions of intergenerational justice and often leads to socio-environmental systems that are vulnerable and prone to collapse because natural capital is the long-term foundation of humanity's livelihoods, while human capital may vanish (Gowdy and McDaniel, 1999; Carrão et al., 2016). In contrast, “strong sustainability,” ensures that natural capital is not replaced by human capital in the sense that it is not degraded in the process of generating human capital. Thus, the ecological and economic aspects of sustainability can be analyzed jointly through the notions of weak and strong sustainability to highlight the paradox of offsetting the cost of environmental deterioration with human (manufactured) capital (Rennings and Wiggering, 1997). Weak and strong sustainability can be evaluated as the depreciation cost of manufactured and natural capital, or as the impact of human activities on natural resources (Dietz and Neumayer, 2006).
With specific reference to irrigation, it is possible to aim for strong sustainability because water is overall a renewable resource. Of course, locally, water resources may be unrenewable, as in the case of desert regions with little rainfall inputs and substantial non-renewable groundwater stocks. In those regions, the use of groundwater is a classic example of unsustainable water use (often known as “groundwater mining”) (e.g., Konikov and Likhodedova, 2011). Sustainable irrigation needs to ensure that (1) water stocks (e.g., aquifers, rivers, or lakes) are not depleted by keeping withdrawal rates lower than those of natural replenishment; (2) withdrawals from water bodies do not lead to losses of aquatic habitat and irreversible ecosystem degradation; and (3) irrigation does not cause other forms of environmental damage (e.g., soil salinization) with associated losses of ecosystem services and functions, here collectively referred to as “natural capital” (e.g., de Perthuis and Jouvet, 2015).
Sustainability is often characterized through indicators that express the performance of an irrigation system not only in terms of its ability to deliver the water needed by agriculture with no loss of natural capital, but also from the standpoint of economic viability. Strong sustainability is achieved when irrigation does not entail the depletion of either natural or human capital (Aeschbach-Hertig and Gleeson, 2012). This means that both conditions of environmental and economic sustainability are met. The former entails that irrigation water requirement can be met while preserving environmental flows and freshwater stocks (Jägermeyr et al., 2017). Economic sustainability requires that the cost of irrigation does not exceed the value of the marginal productivity of irrigation with respect to the baseline of rainfed production.
In this context suitable indicators of sustainability could be a valid tool to evaluate the (weak and strong) sustainability of irrigation and adopt adequate policy responses (Juwana et al., 2012). Moreover, a separate analysis may be necessary for surface water bodies and aquifers to ensure that both environmental flows and groundwater stocks are not depleted (Gleeson et al., 2012; Vanham et al., 2018). As defined by the 6.4 Sustainable Development Goals, indicators of water use should account for both the inter-annual and intra-annual variability of water availability (FAO, 2015, 2018; Vanham et al., 2018). Likewise, they should be spatially explicit to account for the spatial variability of water scarcity as a result of climatic, topographic, and land use conditions (Falkenmark, 1997; Vanham et al., 2018). Moreover, natural water resources should be differentiated from surface, groundwater, and non-conventional water sources (e.g., water reuse) both for withdrawal and consumption (Vanham et al., 2018). In addition to the hydrological and environmental dimensions, it is also crucial to evaluate the social aspects and the participatory capacity of water users and their ability to adapt to changes in water availability and needs (Pahl-Wostl, 2002).
Although indicators of sustainable irrigation have been developed to express the effects of water scarcity and interannual variability (Sandoval-Solis et al., 2011; Butler et al., 2017), they are not generally used to evaluate the weak and strong sustainability of irrigation. Here we used criteria of performance based on the irrigation “water deficit” (i.e., the gap between renewable water availability and irrigation water use) to determine irrigation sustainability as the fraction of irrigation withdrawals contributing to water deficit (or “relative overuse”), the probability that in a given year no water deficit occurs (or “reliability”), and the likelihood of recovery from water deficit (or “resilience”) as three criteria of performance for sustainable irrigation (Hazbavi and Sadeghi, 2017; Park and Um, 2018). Each indicator is evaluated considering both water (or “hydrologic”) deficit and economic losses (Holling, 1973; Balaei et al., 2018). This work aims at providing a novel framework to analyse the sustainability of irrigation water use. The present framework is first introduced briefly in chapter 2.1, where, the “weak and strong sustainability paradox” is also explained, and then described in detail in chapter 2.2 where we addressed the framework to a case study.
Materials and Methods
Sustainability Framework
We developed a framework to evaluate water sustainability based on the analysis of indicators (Table 1) expressing the overuse, reliability, and resilience of irrigation water in terms of both hydrologic (i.e., environmental) and economic impacts.
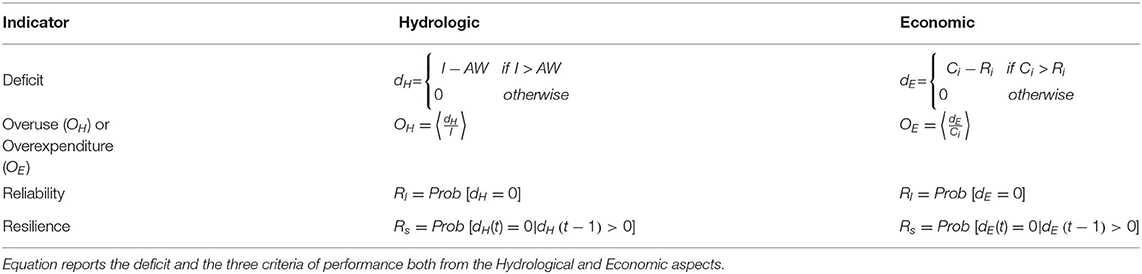
Table 1. Framework for the evaluation of water sustainability.
From a hydrologic/environmental standpoint the deficit, dH is the difference between the volume (Ia) of irrigation water applications (withdrawn from natural sources) in a given year and the water available for irrigation in that year (AW). Overuse expresses the fraction of irrigation water applications that contributes to water resource deficit, dH (Rosa et al., 2018) or “hydrologic deficit” (Rosa et al., 2018). Reliability expresses the probability (or frequency) that in a given year irrigation will not induce a water deficit. Finally, resilience expresses the ability of the system to recover from conditions of water deficit. This may result either from year-to-year changes in precipitation (i.e., a rainy year occurring after a dry year) or from changes in crop or adoption of water saving technology (i.e., human adaptation; Borsato et al., 2018b). Despite its simplicity, the resilience indicator used in this study aims to account for temporal autocorrelation in hydrologic conditions (i.e., that it is more likely that a drought year will follow a drought year) and the ability of the system to recover from conditions of deficit (Sandoval-Solis et al., 2011).
From the environmental perspective deficit is the positive difference between water withdrawals for irrigation and the available water (AW). Water withdrawals were considered instead of water consumption, because they are of primary importance to water allocation, the evaluation of water costs paid by farmers, and, direct local impacts on Environmental Flows.
with the available water calculated as the difference between the sum of annual runoff (RO) and deep percolation (DP) (groundwater recharge), and environmental flows (EF) as in Rosa et al. (2018):
It is important to stress that the available water (AW) is here defined accounting for environmental flows [Equation (2)]. The total water available is considered as the sum of surface water runoff and deep percolation (i.e., groundwater recharge). The hydrologic deficit as well as the indicators of overuse, reliability, and resilience relate to the natural capital services produced by hydrological systems, and are not just based on an analysis of depletion in flow conditions per se (Sandoval-Solis et al., 2011). In other words, we are not looking at deficits in water stocks and flows, but at those deficits that harm ecosystems. Likewise, reliability is here defined in relation to the risk of deficits that negatively affect environmental health.
This analysis can be performed separately for surface water and groundwater resources. Therefore, the occurrence of hydrologic deficit corresponds to water overuse by irrigation at the expenses of environmental flows and the consequent loss of aquatic habitat. In this sense hydrologic depletion is associated with losses of natural capital. The environmental flow requirement is typically expressed as a fraction, r, of the total runoff (i.e., EF = r × RO). For annual analysis, the value of r is typically taken equal to 0.6–0.8 (Richter et al., 2012; Gerten et al., 2013).
The overuse (OH) indicator accounts for the magnitude of the hydrologic deficit (dH) with respect to the irrigation water withdrawal (I). In other words, OH is the fraction of irrigation water application that cannot be met sustainably because it exceeds water availability. It is calculated by determining the dH/I ratio for every year and then by taking the average over the study period of N years (Table 1).
where di, and Ii are the water deficit and the irrigation water withdrawals in year i, respectively.
The reliability (Rl) indicator is the probability of years with no deficit (see Table 1). Thus, Rl is the fraction of the growing season in which irrigation water requirements are met and is expressed as:
where H is the Heaviside function [i.e., H[di] = 1 if di > 0; H[di] = 0 otherwise].
The resilience (Rs) is the system's ability to recover from a failure (e.g., Holling, 1973).
Resilience is the probability that a year with water deficit is followed by a year with no deficit (Table 1):
From an economic perspective, deficit dE is the positive difference between irrigation costs (Ci) and the marginal revenue (Ri) generated by irrigation (calculated as explained in section Method: Framework Application)
The marginal revenue of irrigation is the difference between the revenues from irrigated and rainfed production. Overexpenditure (OE), the economic counterpart overuse, represents the fraction of irrigation costs that contributes to economic deficit averaged for all years in the study period. Therefore, OE is calculated as:
Likewise, reliability, and resilience are calculated using Equations (4), and (5), with deficit expressed as in (6). In Equation (7) the economic demand is expressed as the annual irrigation costs.
When such a deficit exists, farmers are using water unsustainably and depleting natural capital. We quantified the occurrence of strong and weak sustainability conditions by comparing the overuse and overexpenditure indicators, which are good metrics for the magnitude of hydrologic and economic stress in the system. If both indicators are relatively low (e.g., <0.25) the system is strongly sustainable. However, when, OE < 0.25, while OH is large (OH > 0.25) the system is at most weakly sustainable because it is economically sustainable (from the producer's perspective and without considering environmental externalities), but the occurrence of water deficit entails the loss of environmental flows, water stocks, and natural capital. Unsustainable conditions occur when both overuse and overexpenditure are not negligible (Table 2). We stress that in this analysis weak sustainability does not assess whether the value of human-made capital generated by agricultural production exceeds the value of natural capital loss caused by the loss of environmental flows. We refrain from performing such a valuation effort because whether losses of ecosystem services and functions can even be valuated has been the focus of heated debates (i.e., the question of placing a “price tag” on nature). Indeed, the whole point of the notion of“weak sustainability” is to present a critic to the substitutability between natural and human-made capital (e.g., Jouvet and de Perthuis, 2013). We performed our analysis considering a threshold of 0.25 (first lower quartile ranking from 0 to 1), however, we recognize that decision makers might assign priority to different factors and can adjust the sustainability threshold here applied.
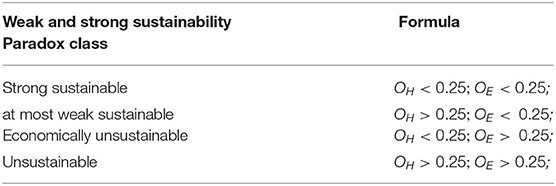
Table 2. The paradigm of Weak and Strong Sustainability is calculated with the following classification concerning the use of the concepts of Overuse and Overexpenditure.
The parameters used for the deficit assessment are described further in the following sections.
Description of the Case Study
We apply this framework to the case of Australia because it is a major agricultural country and global food producer that is prone severe water scarcity (ABARES, 2018). More specifically, we evaluate to what extent water use for irrigation meets the farmers' income expectations with or without detrimental environmental consequences. Moreover, we carry out a sensitivity analysis to investigate the impact of a 25% increase in irrigation technology efficiency across the Australian continent. In addition, we investigate the sensitivity of our results to two different environmental flow scenarios. We chose Australia for our case study because it is a major crop producer in the world and a unique dataset on irrigation water consumption and associated costs is available for this country through open access sources.
Description of the Study Area
Crop production in Australia is practiced in regions with very different climate conditions ranging from subtropical in the north—where the climate is warmer with well-defined dry (winter) and wet (summer) seasons—and temperate in the south—where four distinct seasons exist, temperature contrast between winter and summer is stronger, and precipitation is more uniformly distributed throughout the year (CSIRO Bureau of Meteorology, 2015; ABARES, 2018). South-eastern Australia has a “Mediterranean” climate with most precipitation occurring in winter and spring. Moreover, Australia exhibits relatively high interannual rainfall variability. In recent years this region was affected by a major drought (the “millennium drought,” 1996–2010) followed by a period (2010–2013) with very heavy rainfall events (van Dijk et al., 2013).
The “breadbasket” of Australia is in the region of the Murray-Darlin Basin, where irrigation is used to mitigate the effects of a very variable climate (Williams, 2017). In this basin the irrigated area planted with seasonal crops exceeds the irrigated area cultivated with permanent crops. After the 2009 drought some irrigated crops were replaced with drought resistant crops such as grape or citrus (ABARES, 2018). Irrigation is for most part based on drip systems, especially in permanent crops, while most seasonal crops use surface irrigation (Sue Argus Research, 2015). Irrigation allows for the attainment of yields that are up to three to five times greater than with rainfed production (Meyer, 2005). Hence, many irrigated enterprises differ in their gross return per ha or per m3, depending on land management and investments in technology.
Data Sources
Irrigation and crop production data were taken from the database of the Australian Bureau of Statistic (ABS, 2018), which provides information on annual water withdrawals for irrigation both from surface water bodies and groundwater. Moreover, ABS provides province-level and region-level data on irrigated area, the number of farm holders practicing irrigation, the irrigation water source (surface water and/or ground water), the type of irrigation system used per unit of area (i.e., surface, sprinkler, or drip), and indicators of the cost and benefits of irrigation, including the cost of water, operation, administration, infrastructure, and equipment, and the irrigation revenue. Estimates of water availability and total evapotranspiration in irrigated areas were based on outputs from the Australian Water Availability Project model (AWAP), available from the CSIRO website (Rapauch et al., 2009). Surface water availability is determined as surface runoff minus environmental flow requirements, while the (sustainable) groundwater availability was estimated as the rate of groundwater recharge or “deep drainage.” The AWAP model is a model-data fusion based on remote sensing data assimilation (vegetation greenness and land surface temperature) and assembling weather data and discharge measurements from 200 unimpaired catchments (Rapauch et al., 2009). The model predicts soil moisture in two layers (typically to 0.2 m and from 0.2 to 1.5 m depth) and terrestrial water fluxes due to rainfall, transpiration, soil evaporation, surface runoff, and deep drainage; model prediction is therefore combined with remote sensing observations providing maps of river discharge and deep drainage (i.e., groundwater recharge) across the Australian continent using a 5 km spatial resolution and daily time resolution. The model calculates the soil water balance considering inflows as precipitation (P) and possible irrigation (I), and outflows as plant transpiration (T), soil evaporation (E), runoff (RO), and drainage to groundwater (DG) (Raupach et al., 2018). In this study the AWAP values of runoff, deep drainage, and actual evapotranspiration (ET) were used.
We analyse the sustainability of irrigation through criteria of performance, based on indicators that change in space and time. We concentrate on a 15 year period from 2002 to 2016 at the spatial resolution of the Australian Natural Resources Management regions (NRM) and territories (Figure 1).
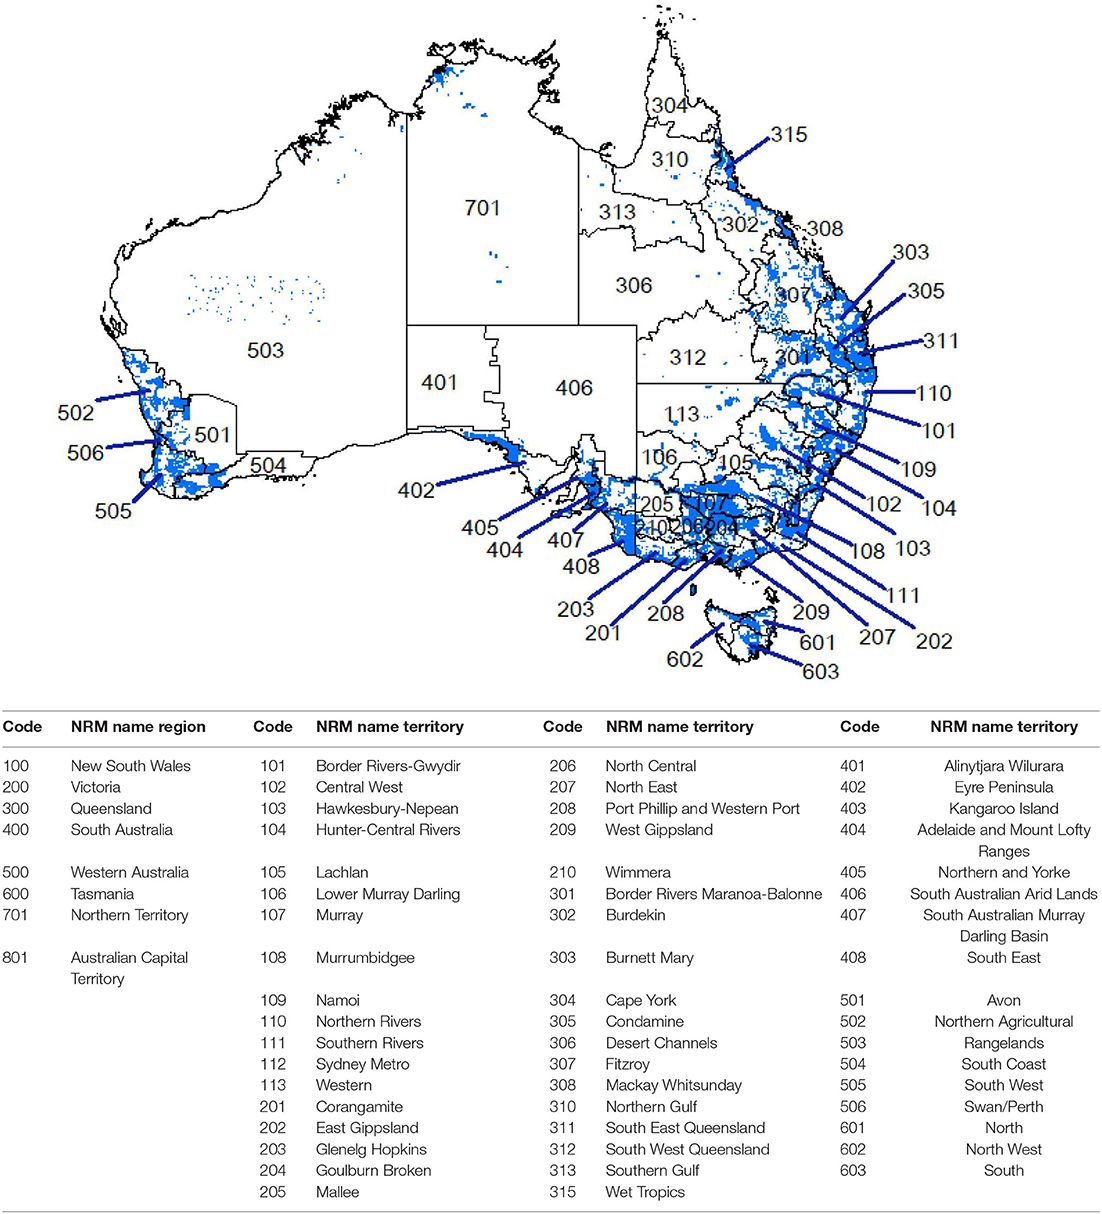
Figure 1. Map of irrigated area (Siebert et al., 2013) within the Natural Resource Management regions (NRM) regions and territories. The table refers to the NRM regions codes on the map (ABS, 2018).
Method: Framework Application
We evaluate environmental and socio-economic sustainability of irrigation water use in agriculture using a dataset of irrigation water use and crop production that allows us to analyse effective annual costs and incomes of irrigated agriculture, while for the hydrological analyses, we rely on the output from model simulations. We consider the case of surface water and groundwater separately and calculate the hydrologic and economic deficits, dH and dE, separately for these two water sources. The monthly raster files of surface runoff (for surface water availability) and deep drainage (for groundwater availability) from the AWAP model were aggregated to the annual scale, while the monthly raster files of evapotranspiration (ET) were aggregated through the growing season. The cumulative annual values of surface runoff, deep drainage and ET were averaged within each NRM province. Equations (1) and (6) were used to calculate the hydrologic and economic deficits, dH and dE, respectively. In the case of surface water, dH considers the volume of irrigation applications I from surface water sources, while the available water (AW) is determined as the annual surface runoff, RO, minus the environmental flow requirement (EF), which is the amount of water needed to maintain ecological function in in-stream aquatic ecosystems. Here EF was taken equal to 80% of annual runoff (Richter et al., 2012; Gerten et al., 2013). In the case of irrigation from groundwater, the available water was equal to the cumulative annual deep drainage (DG), and I from groundwater sources.
The socio-economic deficit (dE) evaluates whether the cost of irrigation exceeds the net revenue generated by irrigation (see Equation 6). The ABS database provides the annual income from irrigated area and the irrigation costs (ABS, 2018). The variable irrigation costs include the cost of purchase and the cost of water access (water license), which are increasing functions of the volume I of irrigation water applications. In this analysis the fixed costs of irrigation include the operational costs, the cost of investments in infrastructures and irrigation equipment. The cost these investments was amortized on 50 and 20 years for infrastructure and equipment, respectively. The amortization period is considered the average lifetime before replacement or update (Sands et al., 1982; Pietrucha-Urbanik, 2015). In this analysis the irrigation costs differ between irrigation with surface water and groundwater only by the costs of water pricing, while the fixed costs are assumed to be about the same.
The marginal revenue from irrigation depends on the increase in crop yield afforded by irrigation with respect to the baseline of rainfed production. If Δ is the fraction of agricultural revenues contributed by irrigation (i.e., due to the increase in irrigated crop production with respect to rainfed yields) the marginal revenue of irrigation (Ri) can be calculated as a function of the total agricultural income (RT) from irrigated areas as
The value of Δ is here estimated as the difference between irrigated and rainfed yields divided by the irrigated yield using the Doorenbos and Pruitt (1977) equation:
where PET is potential evapotranspiration and ET is the actual evapotranspiration in the case of rainfed agriculture. Therefore, the difference between PET and ET is assumed to be the irrigation volume consumed by crops, Ic (ABS, 2018), and the equation can be written as:
where ky is a crop-specific yield response factor. Because values of Ic and RT are provided by ABS (2018) for entire provinces or regions where multiple crops are cultivated, we are unable to estimate the marginal revenue of irrigation for individual crops. Therefore, we evaluate Ri as a regional aggregate value. To that end, we use an estimate of Δ that is not crop-specific, Thus, we adopt a value of ky that is representative of each region. Based on the crops cultivated in Australia, ky is expected to vary between 0.9 and 1. Hence, we considered an averaged ky equal to 0.95 for all crops. The ET values were taken from the output of the AWAP model and aggregated to the annual scale and integrated over the irrigated area within all the NRM territories. Irrigation water consumption, Ic, was calculated as the annual irrigation water application Ia from the ABS (2018) database times the irrigation system efficiency (IE), IC = Ia × IE. IE was calculated as the average of the IE values of the main irrigation system used in each NRM region and territories, weighed on the extent of areas in which each type of irrigation systems is used. We used a value of IE = 0.9 for drip irrigation, 0.7 for sprinkler irrigation, and 0.5 for surface irrigation (Grafton et al., 2018).
Results and Discussion
Water Depletion Trend
Secondary data from the ABS archive and AWAP simulations allow us to calculate the hydrological and socio-economic deficits and investigate trends in water use for irrigation. The data summarized in Table 3 show a reduction in the number of agricultural businesses practicing irrigation between 2002 and 2017, a trend that is not consistently paralleled by a reduction in irrigated area except during the 2006–2010 drought. Indeed, the Murray-Darling Basin of Australia is pursuing a program of acquiring existing water entitlements from farmers to reduce consumptive use by 20% and restore environmental flows in the Murray-Darling Region (Richter, 2014). Moreover, these data show that surface water use for irrigation exhibits interannual fluctuations that ultimately affect the water price (Debaere et al., 2014). Overall, the gross value of irrigated crops (AUD -Australian Dollars) rises by 66% from 2002 to 2017 and reflected the increasing gross value of agricultural production (+87%). Therefore, the irrigation revenue per hectare (AUD/ha) increased by 50% between 2002 and 2017, while irrigation costs per hectare (AUD/ha) increased by 7% as a result of changes in the variable costs of water.
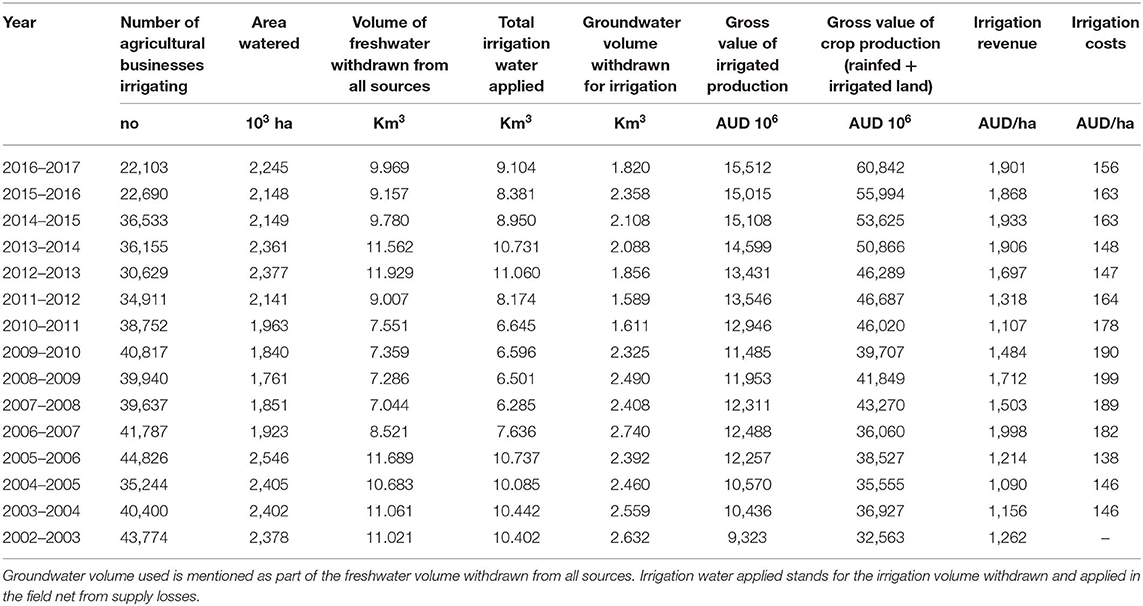
Table 3. Environmental and socio-economic indicators of irrigation in Australia, based on the ABS database.
Moreover, we considered 8 NRM regions; each region comprises provinces or territories (Figure 1). The main irrigated area in Australia is situated in the Murray Darling Basin, between New South Wales, Victoria, and Queensland. In these regions, irrigation is used by a relatively large number of businesses over a large irrigated area (Table 4). As shown in Table 4, surface water is the predominant source for irrigation in Australia except for the Northern Territory which strongly relies on groundwater. The Northern Territory and the Australian Capital Territory have a small fraction of irrigated land.
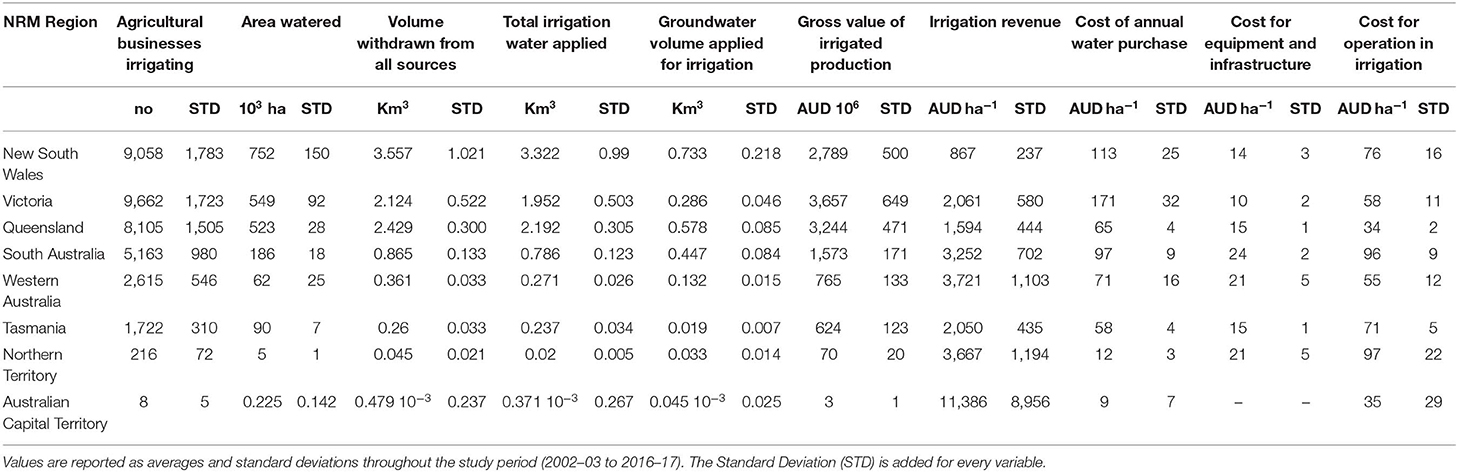
Table 4. Environmental and socio-economic indicators of the NRM regions.
The irrigation revenue differs among regions depending on the productivity of crops cultivated in each area. Irrigation costs include variable costs associated with the purchase of water, and fixed costs for operation, infrastructure, and equipment purchase (Table 4). The operation costs account for the costs of maintenance and labor during irrigation and vary between 34 AUD/ha in Queensland to 97 AUD/ha in the Northern Territory. The highest cost of water purchase is found in Victoria and New South Wales with 171 AUD/ha and 113 AUD/ha, respectively.
Fifty-eight percent of irrigated lands in Australia use surface irrigation, followed by various types of sprinkler (32%) and drip irrigation (10%) (Table 5). Our estimates of the hydrologic deficit indicate that in the Australian continent water use for irrigation tends to deplete surface water resources and environmental flows more than groundwater (Figure 2). In fact, groundwater is seldom in a deficit (Table 6). The occurrence of hydrologic deficit conditions indicates that farmers have withdrawn more water than it would have been sustainable to do. In other words, withdrawals (irrigation volume applied) exceed the available water, which means that they occur at the expenses of environmental flows or groundwater depletion. In the case of Australia, it seems that the main concerns should be for the loss of environmental flows. Recent news article reported that fish died from a severe water overuse in the Murray-Darling Basin (AFP, 2019).
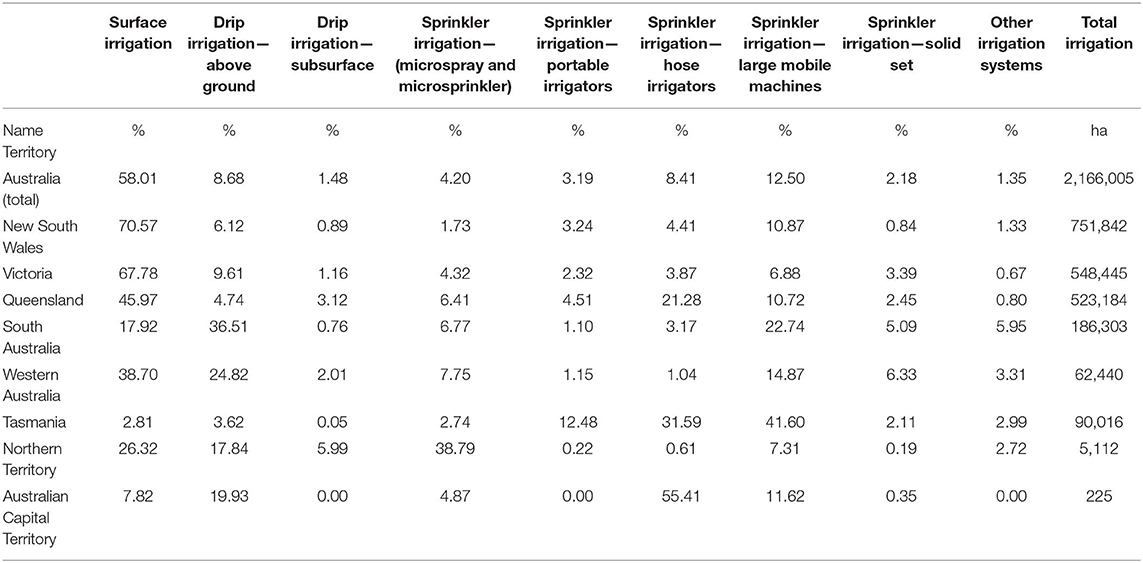
Table 5. Average fraction of area irrigated with different type of systems.
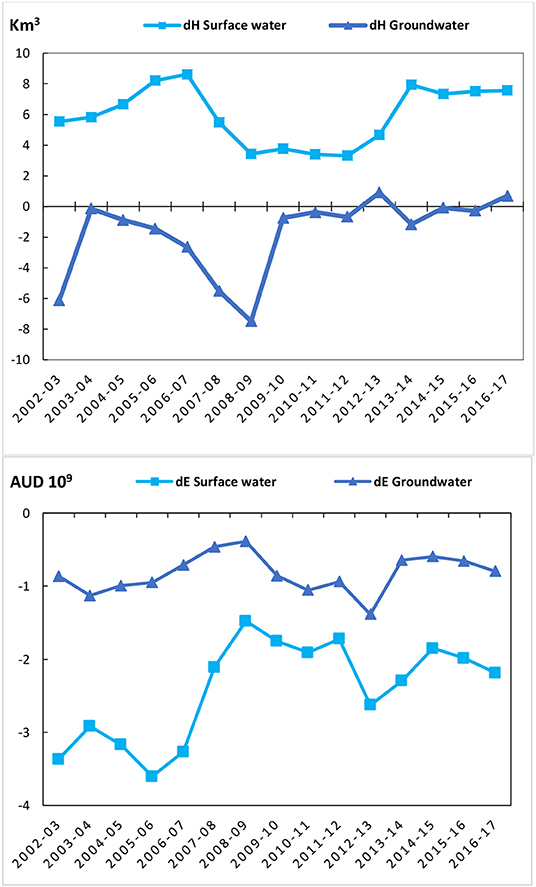
Figure 2. Trend (2002–2017 period) of environmental deficit dH (km3), on the left, and the socio-economic deficit dE (AUD 109), on the right at the Australian continent scale.
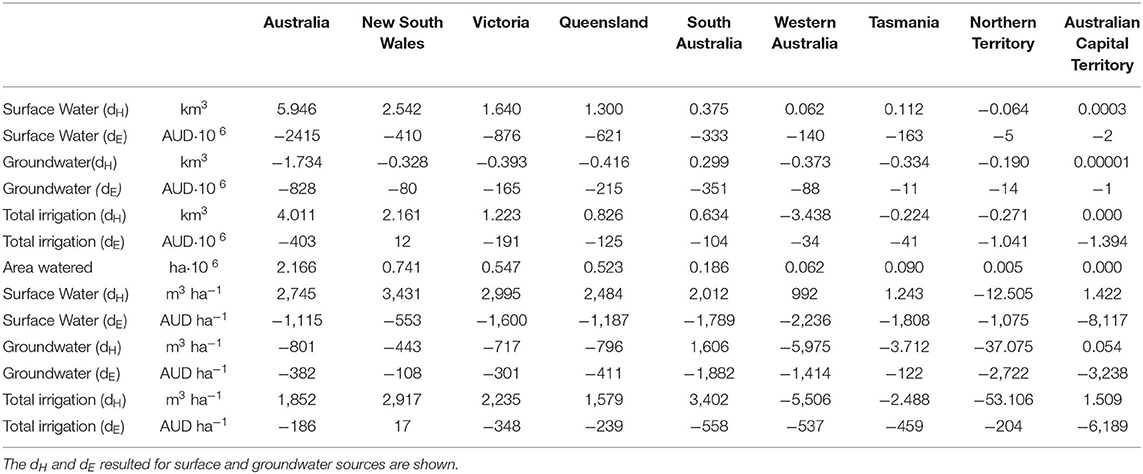
Table 6. Average hydrological deficit (dH) and socio-economic deficit (dE) over the period 2002–2017 for 8 NRM regions.
Conditions of socio-economic deficit (on the right) do not emerge at the average country scale, but they do occur at the scales of the individual NRM territories. Changes in economic deficit can result from changes in water price or in water productivity as shown in Tables 4, 6. Economic deficit conditions correspond to situations in which the cost of water exceeds the marginal revenues generated by irrigation.
Analysis of the Criteria of Performance for Surface Water
We first consider the sustainability of surface water resources, which account for almost 80% of irrigation withdrawals in Australia. We look at indicators of performance of irrigation for both the hydrologic and economic aspects of sustainability (Figure 3). In other words, we look at the overuse or overexpenditure, unreliability (i.e., 1-Rl, with Rl being the Reliability; see Table 1) and the persistence of deficit conditions (i.e., 1-Rs). Considering the hydrologic/environmental aspect of sustainability, overuse is widespread across Australia (Figure 3, panel 1a) except for the Northern Territory. The unreliability of surface water use is also relatively high across the country except for the northern territories (Figure 3, panel 1b), where climate is tropical sub-humid. Likewise, water deficit conditions appear to persist across the country, as reflected by the high probability that years with hydrologic deficit are followed by deficit years (Figure 3, panel 1c), indicating inability for the system to overcome (and recover from) stress (i.e., low resilience).
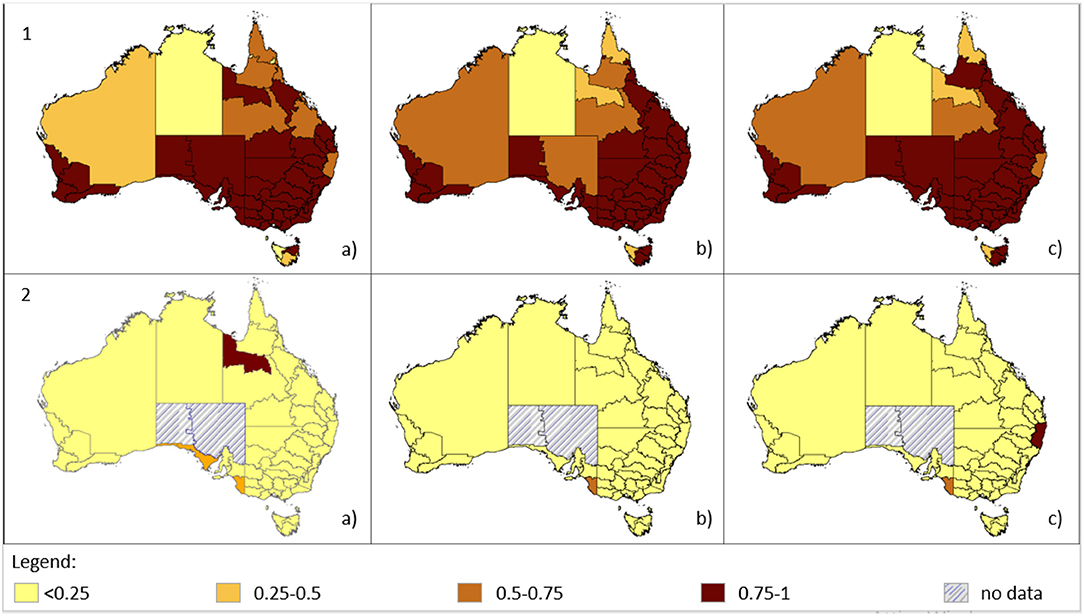
Figure 3. Maps of criteria of performance on the environmental (1) and socio-economic (2) aspects. The figure shows the Overuse/Overexpenditure (a), the non-Reliability (b), and the non-Resilience (c), of surface water use for irrigation purposes in the Australian continent.
The indicators of socio-economic performance show a different picture because overexpenditure is overall low across Australia (<0.25; Figure 3, panel 2a), except for the territories of Southern Gulf and the southern coast of Victoria where overexpenditure is >0.5 or even 0.75. This means that in these regions the revenue of irrigated agricultural production is not sufficient to offset the cost of irrigation. However, other than in these regions, the use of surface irrigation seldom leads to an economic deficit (Table 6). Moreover, economic deficit has a low likelihood of occurrence (i.e., irrigation is economically reliable) and does not persist (i.e., irrigation is economically resilient; Figure 3, panels 2b,c).
To evaluate the strong and weak sustainability of irrigation, we map (Figure 4) areas affected by both high hydrologic and economic deficits (strongly unsustainable), high hydrologic but relatively low economic deficit (weakly sustainable) and low hydrologic and economic deficit (sustainable), as explained in the methods section (Table 2). We also consider the case in which irrigation is sustainable hydrologically but not economically. The results of this analysis (Figure 4) show that in most of Australia surface water use for irrigation is weakly sustainable, in that it can generate good profits on most years but “usurps” environmental flows. In fact, hydrologic deficits correspond to conditions in which surface water withdrawals for irrigation exceed the available water, which is here estimated as the difference between surface runoff and environmental flows. Thus, the use of surface water for irrigation is strongly sustainable in the Northern Territory, and Northeast Tasmania. In the rest of Australia, surface water withdrawals for irrigation are weakly sustainable, except for the Southern Gulf in Queensland, Northern Rivers in New South Wales, and Eyre Peninsula and South East province in South Australia that are affected by economic unsustainability.
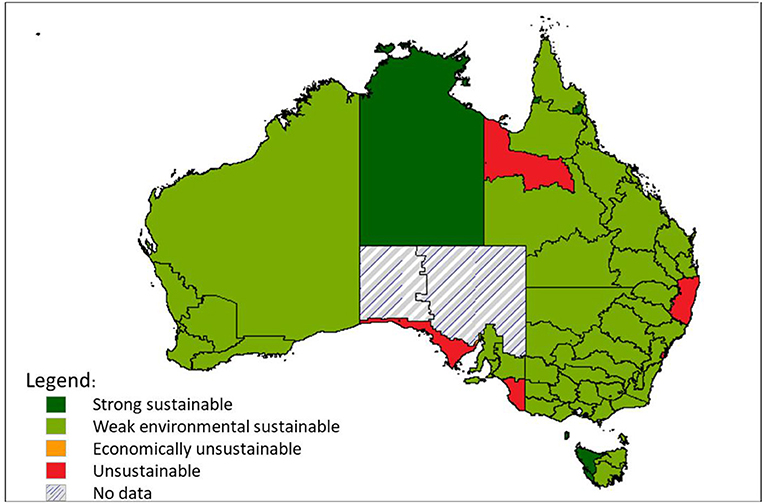
Figure 4. Map of the sustainability paradigm of the irrigation practice using surface water.
Analysis of the Criteria of Performance for Groundwater
Groundwater sustains about 20% of irrigation in Australia, particularly in those areas where surface water is not sufficient to meet irrigation water requirement. In Figure 5, the sustainability of groundwater use for irrigation is evaluated through the three criteria of performance. Overuse is generally higher than 0.5 in areas with lower surface water supply. In those areas, groundwater stocks are often depleted by irrigation with withdrawals (Figure 5, panel 1a). The unreliability of irrigation and persistence of groundwater deficit is relatively high in the Northern Territory, Western Australia, and in some provinces such as the Lower Murray Darlyn in South New Wales and Fitzroy in Queensland (Figure 5, panels 1B,C). From the standpoint of the economic performance, overexpenditure is high in the Southern Gulf and Northern Rivers, where it exceeds 0.75. In North Central Victoria and in the Eyre Peninsula overexpenditure is in the 0.50–0.75 range (Figure 5, panel 2a). The probability of occurrence of years with economic deficit (or “unreliability”) is relatively low (Figure 5, panel 2b). Likewise, probability of persistence of economic deficit is relatively small (<0.25), except for Southern Gulf in Queensland, North Central in Victoria, Eyre Peninsula in South Australia and South in Tasmania (Figure 5, panel 2c).
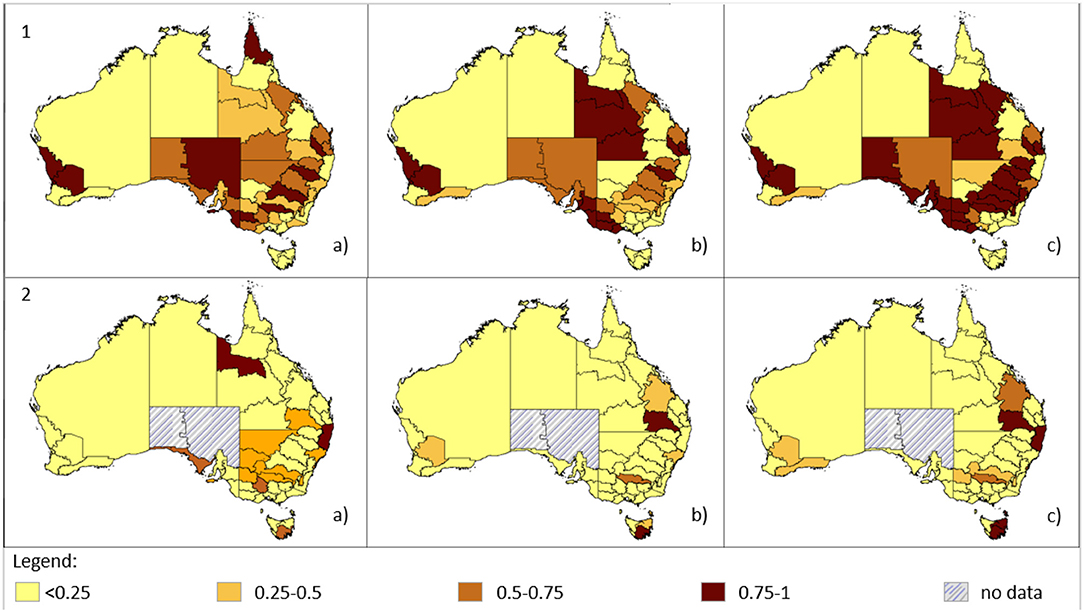
Figure 5. Maps of criteria of performance on the environmental (1) and socio-economic (2) aspects. The figure shows, the Overuse/Overexpenditure (a), the non-Reliability (b), and the non-Resilience (c) of groundwater use for irrigation purposes in the Australian continent.
In Figure 6, the environmental and socio-economic deficits are compared to determine conditions of weak and strong sustainability of groundwater use for irrigation across Australia. The consistent pattern of weak sustainability indicates that groundwater use contributes to groundwater depletion in most of the areas irrigated with groundwater. Only few provinces situated in the northern part of the country exhibit strong sustainability in groundwater use for irrigation. Murray in New South Wales, Border Rivers Maranoa-Balonne in Queensland, and South in Tasmania show an economically unsustainable groundwater use for irrigation. In those provinces, the marginal revenues of irrigation do not fully cover the irrigation costs.
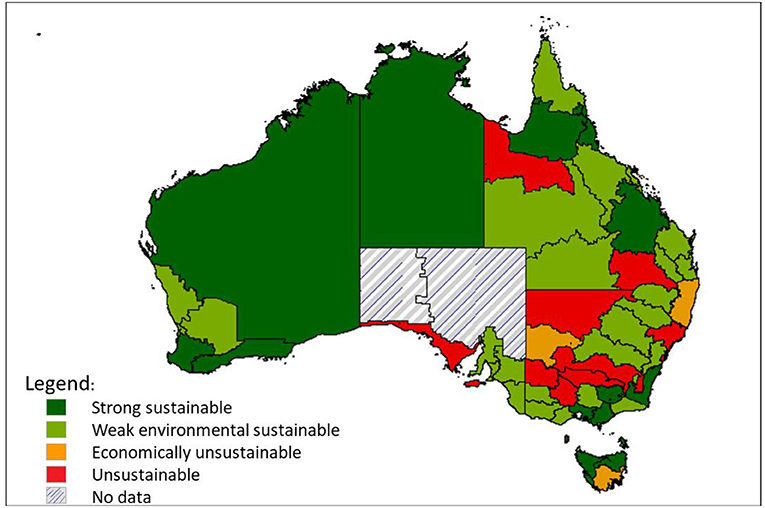
Figure 6. Map of sustainability paradigm of the irrigation practice using groundwater.
Sustainable for What? A Different Point of View
Previous studies have analyzed the use of water for agricultural purposes under scarcity conditions focusing on the sustainability of irrigation from the standpoint of the environment (Khan et al., 2006; Gerten et al., 2013; Hazbavi and Sadeghi, 2017). When the focus is on the environment, an irrigation practice is said to be sustainable when water resources are not depleted and their use does not compromise the availability of ecosystem goods and services in the future (Butler et al., 2017; Unver et al., 2017; Papas, 2018). From the standpoint of farmers, however, the analysis of sustainability can also evaluate to what extent water for irrigation can be consistently available in a certain region (reliability) and whether water deficit years may persist in time (Juwana et al., 2012; van Dijk et al., 2013). This requires an analysis of the magnitude and frequency of water deficit, and the evaluation of the sustainability of irrigation using a set of indicators of performance (Sandoval-Solis et al., 2011) instead of using an aggregated index. In addition, farmers are also interested in the economic aspect of sustainability to evaluate whether and to what extent the cost of irrigation may exceed the marginal revenues it can generate. This study addresses the environmental and economic sustainability of irrigation looking at water use under water scarce conditions. Irrigation typically meets farmers' expectation of a greater income because the cost of water is often very small and most of the irrigation costs are associated with infrastructure, equipment and operation (Grafton and Wheeler, 2018). This type of analysis, however, has often neglected the environmental consequences of irrigation.
The intensification of food production allows for the attainment of higher yields within smaller areas. However, it may entail overuse and depletion of water resources and prevent their preservation (Rockström et al., 2017). The development of a sustainable intensive agriculture needs to focus on ways to enhance agricultural productivity while reducing the environmental impacts of irrigation. In many cases, water is used inefficiently and action needs to be taken to promote policies that integrate the dimensions of technology, economics, and governance (Unver et al., 2017).
A common approach to enhance water sustainability focuses on the implementation of new irrigation technologies that improve efficiency (i.e., IE). In fact, the study of a scenario of increased efficiency (i.e., 25% increase in IE, see methods section; Figure 7) shows that an increase in IE tends to enhance water sustainability. As shown in Table 7 the increase in efficiency allows for both water and economic savings. Thus, regions that in the current scenario exhibit both hydrologic and economic deficits (e.g., Eyre Peninsula, Fitzroy, and Murrumbidgee), can become sustainable in the scenario of increased efficiency. Likewise, areas that are presently weakly sustainable (e.g., Southern Rivers and East Gippsland) can become strongly sustainable (Figure 7). However, these improved efficiencies typically do not result in a benefit to the environment because farmers tend to use the water they save for additional irrigation (e.g., by increasing the irrigated land), thereby often leading to reduced return flows to the environment (downstream water courses and groundwater), a phenomenon known as “irrigation paradox” that is not accounted for in this study (Foster and Perry, 2010; Pfeiffer and Lin, 2010).
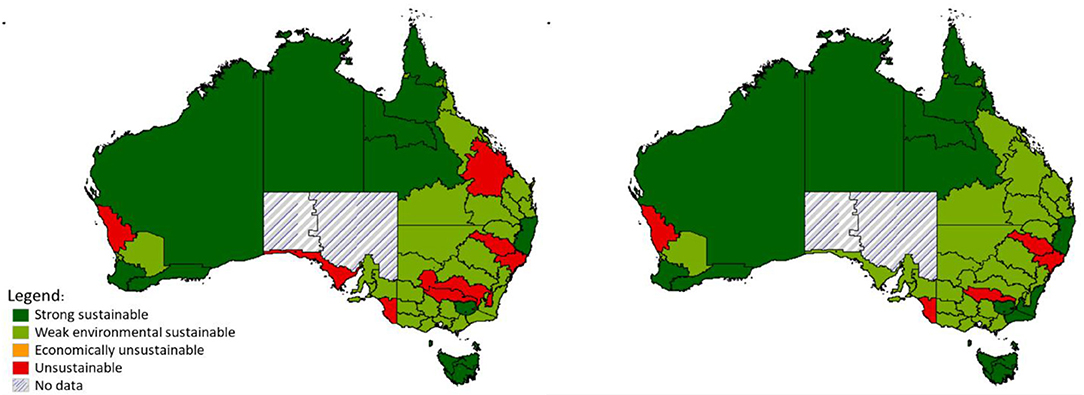
Figure 7. Weak and Strong sustainability calculation in case irrigation efficiency rise up by 25%. On the left, the current scenario A; on the right, scenario B where irrigation efficiency increases by 25%.
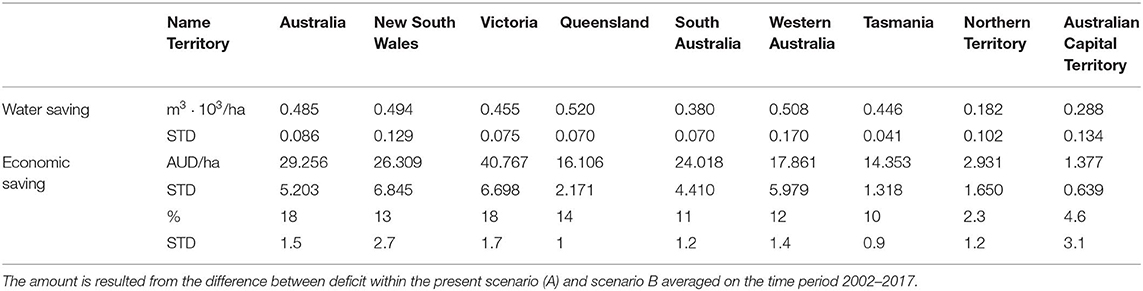
Table 7. Water Saving and Economic Saving when irrigation efficiency rises up of 25% (scenario B).
The 25% increase in IE allows for water savings ranging from 182 m3 ha−1 in Northern Territory up to 520 m3 ha−1 in Queensland (Table 7), which correspond to an increase in profits of 2.3% and 14%, respectively (Table 7). These results show that the enhanced efficiency of irrigation systems has a positive impact on water productivity However, it has been reported that the farm-scale increase in irrigation efficiency may increase water consumption (the so called “irrigation paradox”) if farmers use the water savings resulting from the increased irrigation efficiency to plant crops that are more water-intense or irrigate more land (Grafton et al., 2018).
We have also invoked the notions of weak and strong sustainability (Gowdy and McDaniel, 1999; Dietz and Neumayer, 2006; Nasrollahi et al., 2018) to relate biophysical conditions of hydrologic deficit to economic deficit between revenues and costs. In this way, the analysis of hydrologic and economic deficit shows whether irrigation is strongly sustainable, unsustainable or weakly sustainable. In the case of weakly sustainable irrigation, the marginal income generated by irrigation is obtained at the cost of sacrificing groundwater stocks or aquatic habitat and associated ecosystem function in surface water bodies. In this sense, an increase in water withdrawal causes a depletion of the environmental flows. We also performed a sensitivity analysis with a scenario where only 40% (instead of 80%) of available water is left for environmental flow preservation. Table 8 shows how the framework performs an increase in water exploitation. There is a decrease of the magnitude of the irrigation water deficit (dE) and an increase of the resilience and reliability of the system but at the expense of Environmental Flows. The overuse decreases by 25% in the overall Australian continent, which can reach even the 72% decrease, for example, in Tasmania.
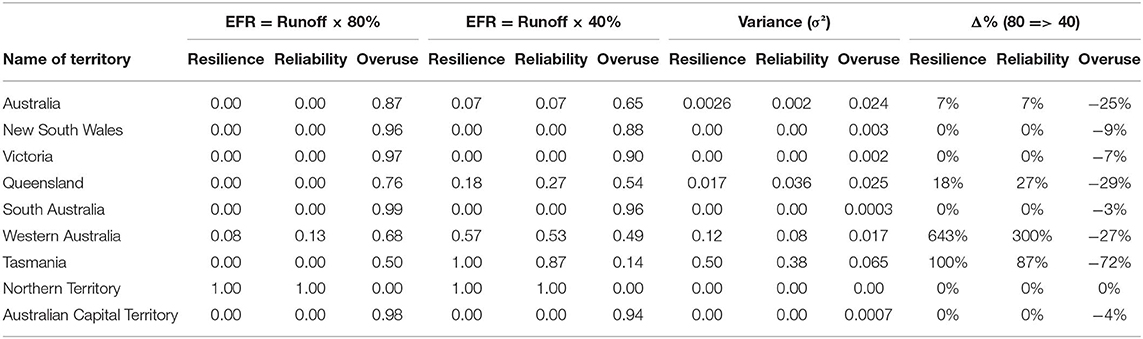
Table 8. Sensitivity analysis of using the 60% of EFR for irrigation from surface water.
Conclusions
The novelty of the study stems from the introduction of the framework evaluating the sustainability of irrigation practice both from the hydrological and socio-economic points of view. We evaluated to what extent irrigation take place without compromising environmental flows while generating net profits for farmers or agribusinesses. This approach allows us to quantify the weak and strong sustainability of irrigation.
More specifically, this framework (i) provides indicators of performance that can be used to evaluate in quantitative terms the sustainability of irrigation and its likelihood; (ii) it shows how the notions of reliability, resilience and overuse/overexpenditure can be translated into suitable indicators addressing both the environmental and socio-economic aspects of sustainability. These indicators provide a rather comprehensive picture of the sustainability of the system, from the perspective of both farmers and the environment; (iii) it can be applied at different spatial and temporal scales and used by stakeholders to support decision-making in the context of water management and water policy development.
To develop a framework that can be applied at different scales to a variety of agricultural regions and with a relatively limited amount of data, we had to make some simplifying assumptions on the way irrigation water requirements and the difference between irrigated and rainfed crop production are calculated.
The case study focused on cultivated land in Australia. In this specific context, we found that Australian irrigation is for most part weakly sustainable. In other words, irrigation water is unsustainably used to produce commodities at the expenses of the environment. Interestingly, our analysis shows that irrigation has stronger negative impacts on environmental flows, while groundwater use for irrigation tends to be more sustainable. Overall, irrigation contributes to a more reliable and resilient crop production with a relatively high level of economic water profitability.
Data Availability Statement
The datasets generated for this study are available on request to the corresponding author.
Author Contributions
EB implemented data collection and elaboration, wrote the draft, and revised the manuscript. LR supervised data collection, data processing, and the draft. PD'O suggested the framework methodology, supported the analysis, and revised the draft. PT and FM helped conceiving and designing the framework and indicators, revised the manuscript, and supported financially.
Funding
EB was supported by the Fondazione Ing. Aldo Gini and the Fondazione Cassa di Risparmio di Padova e Rovigo (CARIPARO).
Conflict of Interest
The authors declare that the research was conducted in the absence of any commercial or financial relationships that could be construed as a potential conflict of interest.
Acknowledgments
Authors thanks Dr. Peter Briggs for his generous availability and to provide access to the AWAP database.
References
ABARES (2018). Australian Crop Report, 187th Edn, Australian Bureau of Agriculture and Resource Economics and Sciences. Australian Bureau of Agricultural and Resource Economics and Sciences, Canberra, ACT, Australia.
Aeschbach-Hertig, W., and Gleeson, T. (2012). Regional strategies for the accelerating global problem of groundwater depletion. Nat. Geosci. 5, 853–861. doi: 10.1038/ngeo1617
AFP (2019). New Australia Mass Fish Deaths in Key River System. Available online at: https://phys.org/news/2019-01-australia-mass-fish-deaths-key.html (accessed January 28, 2019).
Alcamo, J., Döll, P., Henrichs, T., Kaspar, F., Lehner, B., Rösch, T., et al. (2003). Global estimates of water withdrawals and availability under current and future “business-as-usual” conditions. Hydrol. Sci. J. 48, 339–348. doi: 10.1623/hysj.48.3.339.45278
Balaei, B., Wilkinson, S., Potangaroa, R., Hassani, N., and Alavi-Shoshtari, M. (2018). Developing a framework for measuring water supply resilience. Nat. Hazards Rev. 19:04018013. doi: 10.1061/(ASCE)NH.1527-6996.0000292
Borsato, E., Galindo, A., Tarolli, P., Sartori, L., and Marinello, F. (2018a). Evaluation of the grey water footprint comparing the indirect effects of different agricultural practices. Sustainability 10:3992. doi: 10.3390/su10113992
Borsato, E., Giubilato, E., Zabeo, A., Lamastra, L., Criscione, P., Tarolli, P., et al. (2019). Comparison of water-focused life cycle assessment and water footprint assessment: the case of an Italian wine. Sci. Total Environ. 666, 1220–1231. doi: 10.1016/j.scitotenv.2019.02.331
Borsato, E., Tarolli, P., and Marinello, F. (2018b). Sustainable patterns of main agricultural products combining different footprint parameters. J. Clean. Prod. 179, 357–367. doi: 10.1016/j.jclepro.2018.01.044
Butler, D., Ward, S., Sweetapple, C., Astaraie-Imani, M., Diao, K., Farmani, R., et al. (2017). Reliable, resilient and sustainable water management: the Safe & SuRe approach. Glob. Challenges 1, 63–77. doi: 10.1002/gch2.1010
Carrão, H., Naumann, G., and Barbosa, P. (2016). Mapping global patterns of drought risk: an empirical framework based on sub-national estimates of hazard, exposure and vulnerability. Glob. Environ. Change 39, 108–124. doi: 10.1016/j.gloenvcha.2016.04.012
Chartzoulakis, K., and Bertaki, M. (2015). Sustainable water management in agriculture under climate change. Agric. Agric. Sci. Procedia 4, 88–98. doi: 10.1016/j.aaspro.2015.03.011
CSIRO and Bureau of Meteorology (2015). Climate Change in Australia: Projections for Australia's NRM Regions, Climate Change in Australia Information for Australia's Natural Resource Management Regions. Technical Report. CSIRO and Bureau of Meteorology.
de Perthuis, C., and Jouvet, P. A. (2015). Green Capital. A New Perspective on Growth. New York, NY: Columbia University Press. doi: 10.7312/columbia/9780231171403.001.0001
Debaere, P., Richter, B. D., Davis, K. F., Duvall, M. S., Gephart, J. A., O'Bannon, C. E., et al. (2014). Water markets as a response to scarcity. Water Policy 16, 625–649. doi: 10.2166/wp.2014.165
Dietz, S., and Neumayer, E. (2006). Weak and strong sustainability in the SEEA: concepts and measurement. Ecol. Econ. 1, 617–626. doi: 10.1016/j.ecolecon.2006.09.007
D'Odorico, P., Davis, K. F., Rosa, L., Carr, J. A., Chiarelli, D., Dell'Angelo, J., et al. (2018). The global food-energy-water nexus. Rev. Geophys. 56, 456–531. doi: 10.1029/2017RG000591
Doorenbos, J., and Pruitt, W. O. (1977). Guidelines for Predicting Crop Water Requirements. FAO Irrigation and Drainage Paper 24. FAO.
Falkenmark, M. (1997). Society's interaction with the water cycle: a conceptual framework for a more holistic approach. Hydrolog. Sci. J. 42, 451–466. doi: 10.1080/02626669709492046
FAO (1989). “Sustainable development and natural nesources management,” in Twenty-Fifth Conference, Paper C 89/2 - Sup. 2 (Rome).
FAO (2013). Sustainability Assessment of Food and Agriculture Systems. Guidelines Version 3.0. Rome: FAO.
FAO (2015). FAO (2015). FAO and the SDGs Indicators: Measuring up to the 2030 Agenda for Sustainable Development. Rome: FAO.
Foster, S. S. D., and Perry, C. J. (2010). Improving groundwater resource accounting in irrigated areas: a prerequisite for promoting sustainable use. Hydrogeol. J. 18, 291–294. doi: 10.1007/s10040-009-0560-x
Gerten, D., Hoff, H., Rockström, J., Jägermeyr, J., Kummu, M., and Pastor, A. V. (2013). Towards a revised planetary boundary for consumptive freshwater use: role of environmental flow requirements. Curr. Opin. Environ. Sustain. 5, 551–558. doi: 10.1016/j.cosust.2013.11.001
Gleeson, T., Wada, Y., Bierkens, M. F. P., and van Beek, L. P. H. (2012). Water balance of global aquifers revealed by groundwater footprint. Nature 488, 197–200. doi: 10.1038/nature11295
Gowdy, J. M., and McDaniel, C. N. (1999). The physical destruction of nauru: an example of weak sustainability. Land Econ. 75, 333–338. doi: 10.2307/3147015
Grafton, R. Q., and Wheeler, S. A. (2018). Economics of water recovery in the murray-darling basin, Australia. Annu. Rev. Resour. Econ. 10, 487–510. doi: 10.1146/annurev-resource-100517-023039
Grafton, R. Q. Q., William, J., Perry, C. J. J., Molle, F., Ringler, C., Steduto, P., et al. (2018). The paradox of irrigation efficiency. Science 361, 748–750. doi: 10.1126/science.aat9314
Green, P. A., Vörösmarty, C. J., Harrison, I., Farrell, T., Sáenz, L., and Fekete, B. M. (2015). Freshwater ecosystem services supporting humans: pivoting from water crisis to water solutions. Glob. Environ. Change 34, 108–118. doi: 10.1016/j.gloenvcha.2015.06.007
Groenfeldt, D. (2019). Water Ethics Forum, 2nd Edn. New York, NY: Earthscan Water Text Series. doi: 10.4324/9781351200196
Hartwick, J. M. (1978). Investing returns from depleting renewable resource stocks and intergenerational equity. Econ. Lett. 1, 85–88. doi: 10.1016/0165-1765(78)90102-7
Hazbavi, Z., and Sadeghi, S. H. R. (2017). Watershed health characterization using reliability–resilience–vulnerability conceptual framework based on hydrological responses. Land Degrad. Dev. 28, 1528–1537. doi: 10.1002/ldr.2680
Holling, C. S. (1973). Resilience and stability of ecological systems. Annu. Rev. Ecol. Syst. 4, 1–23. doi: 10.1146/annurev.es.04.110173.000245
Jägermeyr, J., Pastor, A., Biemans, H., and Gerten, D. (2017). Reconciling irrigated food production with environmental flows for sustainable development goals implementation. Nat. Commun. 8:15900. doi: 10.1038/ncomms15900
Jouvet, P. A., and de Perthuis, C. (2013). Green growth: from intention to implementation. Int. Econ. 134, 29–55. doi: 10.1016/j.inteco.2013.05.003
Juwana, I., Muttil, N., and Perera, B. J. C. (2012). Indicator-based water sustainability assessment — a review. Sci. Total Environ. 438, 357–371. doi: 10.1016/j.scitotenv.2012.08.093
Khan, S., Tariq, R., Yuanlai, C., and Blackwell, J. (2006). Can irrigation be sustainable? Agric. Water Manag. 80, 87–99. doi: 10.1016/j.agwat.2005.07.006
Konikov, E., and Likhodedova, O. (2011). Global climate change and sea-level fluctuations in the Black and Caspian Seas over the past 200 years, in: geology and geoarcheology of the black sea region: beyond the flood hyphotesis. Geol. Soc. Am. 473, 59–69. doi: 10.1130/2011.2473(05)
Meyer, W. S. (2005). The Irrigation Industry in the Murray and Murrumbidgee Basins. Technical Report. CRC for Irrigation Futures.
Nasrollahi, Z., Hashemi, M., Bameri, S., and Mohamad Taghvaee, V. (2018). Environmental pollution, economic growth, population, industrialization, and technology in weak and strong sustainability: using STIRPAT model. Environ. Dev. Sustain. 22, 1105–1122. doi: 10.1007/s10668-018-0237-5
Pahl-Wostl, C. (2002). Ecology of some waters in the forest-agricultural basin of the River Brynica near the Upper Silesian industrial region. 10. Bottom insects with special regard to Chironomidae. Aquat. Sci. 27, 547–560. doi: 10.1007/PL00012594
Papas, M. (2018). Supporting sustainablewater management: insights from Australia's reform journey and future directions for the Murray-Darling Basin. Water 10:1649. doi: 10.3390/w10111649
Park, D., and Um, M. J. (2018). Sustainability index evaluation of the rainwater harvesting system in six US urban cities. Sustainability 10:280. doi: 10.3390/su10010280
Pfeiffer, L., and Lin, C. Y. C. (2010). The effect of irrigation technology on groundwater use. Choices 25, 1–6. doi: 10.22004/ag.econ.98054
Pietrucha-Urbanik, K. (2015). Failure analysis and assessment on the exemplary water supply network. Eng. Fail. Anal. 57, 137–142. doi: 10.1016/j.engfailanal.2015.07.036
Rapauch, M. R., Trudinger, C. M., Briggs, P., and King, E. A. (2009). Final Report, Australian Water Availability Project (AWAP): CSIRO Marine and Atmospheric Research Component: Final Report for Phase 3. Technical Report. CAWCR.
Raupach, M., Briggs, P., Haverd, V., King, E., Paget, M., and Trudinger, C. (2018). Australian Water Availability Project, Data Release 26m, CSIRO Oceans and Atmosphere. Canberra, ACT. [WWW Document].
Rennings, K., and Wiggering, H. (1997). Steps towards indicators of sustainable development: linking economic and ecological concepts. Ecol. Econ. 20, 25–36. doi: 10.1016/S0921-8009(96)00108-5
Richter, B. D. (2014). Chasing Water: A Guide for Moving From Scarcity to Sustainability. Washington, DC: Island Press.
Richter, B. D., Davis, M. M., Apse, C., and Konrad, C. (2012). A presumptive standard for environmental flow protection. River Res. Appl. 28, 1312–1321. doi: 10.1002/rra.1511
Rockström, J., Falkenmark, M., Allan, T., Folke, C., Gordon, L., Jägerskog, A., et al. (2014). The unfolding water drama in the anthropocene: towards a resilience-based perspective on water for global sustainability. Ecohydrology 7, 1249–1261. doi: 10.1002/eco.1562
Rockström, J., Williams, J., Daily, G., Noble, A., Matthews, N., Gordon, L., et al. (2017). Sustainable intensification of agriculture for human prosperity and global sustainability. Ambio 46, 4–17. doi: 10.1007/s13280-016-0793-6
Rosa, L., Chiarelli, D. D., Tu, C., Rulli, M. C., and D'Odorico, P. (2019). Global unsustainable virtual water flows in agricultural trade. Environ. Res. Lett. 14:114001. doi: 10.1088/1748-9326/ab4bfc
Rosa, L., Rulli, M. C., Davis, K. F., Chiarelli, D. D., Passera, C., and D'Odorico, P. (2018). Closing the yield gap while ensuring water sustainability. Environ. Res. Lett. 13:104002. doi: 10.1088/1748-9326/aadeef
Sandoval-Solis, S., McKinney, D. C., and Loucks, D. P. (2011). Sustainability index for water resources planning and management. Water Resour. Plan. Manag. 137, 381–390. doi: 10.1061/(ASCE)WR.1943-5452.0000134
Sands, G. R., Moore, I. D., and Roberts, C. R. (1982). Supplemental irrigation of horticultural crops in the humid region. Water Resour. Bull. 18, 831–839. doi: 10.1111/j.1752-1688.1982.tb00079.x
Sands, G. R., and Podmore, T. H. (2000). A generalized environmental sustainability index for agricultural systems. Agric. Ecosyst. Environ. 79, 29–41. doi: 10.1016/S0167-8809(99)00147-4
Savenije, H. H. G., and van der Zaag, P. (2002). Water as an economic good and demand management: paradigms with pitfalls. Water Int. 27, 98–104. doi: 10.1080/02508060208686982
Siebert, S., Henrich, V., Frenken, K., and Burke, J. (2013). Update of the Digital Global Map of Irrigation Update of the Digital Global Map of Irrigation Areas to Version 5. DOCUMENTATION.
Solow, R. M. (1974). Intergenerational equity and exhaustible. Rev. Econ. Stud. 41, 29–45. doi: 10.2307/2296370
Sue Argus and Research (2015). Summary Report: Irrigated Crops of the Lower Murray-Darling 1997 to 2015. Sue Argus and Research.
Sullivan, C. (2002). Calculating a water poverty index. World Dev. 30, 1195–1210. doi: 10.1016/S0305-750X(02)00035-9
Unver, O., Bhaduri, A., and Hoogeveen, J. (2017). Water-use efficiency and productivity improvements towards a sustainable pathway for meeting future water demand. Water Secur. 1, 21–27. doi: 10.1016/j.wasec.2017.05.001
van Dijk, A. I. J. M., Beck, H. E., Crosbie, R. S., de Jeu, R. A. M., Liu, Y. Y., Podger, G. M., et al. (2013). The Millennium drought in Southeast Australia (2001–2009): natural and human causes and implications for water resources, ecosystems, economy, and society. Water Resour. Res. 49, 1040–1057. doi: 10.1002/wrcr.20123
Vanham, D., Hoekstra, A. Y., Wada, Y., Bouraoui, F., de Roo, A., Mekonnen, M. M., et al. (2018). Physical water scarcity metrics for monitoring progress towards SDG target 6.4: an evaluation of indicator 6.4.2 “Level of water stress”. Sci. Total Environ. 613–614, 218–232. doi: 10.1016/j.scitotenv.2017.09.056
Wada, Y., and Bierkens, M. F. P. (2014). Sustainability of global water use: past reconstruction and future projections. Environ. Res. Lett. 9:104003. doi: 10.1088/1748-9326/9/10/104003
Wada, Y., van Beek, L. P. H., van Kempen, C. M., Reckman, J. W. T. M., Vasak, S., and Bierkens, M. F. P. (2010). Global depletion of groundwater resources. Geophys. Res. Lett. 37, 1–5. doi: 10.1029/2010GL044571
Keywords: water scarcity, sustainable irrigation, water and food security, sustainability, Australia
Citation: Borsato E, Rosa L, Marinello F, Tarolli P and D'Odorico P (2020) Weak and Strong Sustainability of Irrigation: A Framework for Irrigation Practices Under Limited Water Availability. Front. Sustain. Food Syst. 4:17. doi: 10.3389/fsufs.2020.00017
Received: 25 November 2019; Accepted: 06 February 2020;
Published: 28 February 2020.
Edited by:
Wenfeng Liu, UMR8212 Laboratoire des Sciences du Climat et de l'Environnement (LSCE), FranceCopyright © 2020 Borsato, Rosa, Marinello, Tarolli and D'Odorico. This is an open-access article distributed under the terms of the Creative Commons Attribution License (CC BY). The use, distribution or reproduction in other forums is permitted, provided the original author(s) and the copyright owner(s) are credited and that the original publication in this journal is cited, in accordance with accepted academic practice. No use, distribution or reproduction is permitted which does not comply with these terms.
*Correspondence: Eros Borsato, ZXJvcy5ib3JzYXRvQHBoZC51bmlwZC5pdA==