 Chris J. Bardenhagen
 Philip H. Howard
 Steven A. Gray
- Department of Community Sustainability, Michigan State University, East Lansing, MI, United States
Conservation practices in agriculture—such as biological pest control, provision of pollinator habitat and cover cropping—may provide ecosystem services that are beneficial to both farmers and wildlife. Despite these benefits, however, their use is not yet widespread and the factors that may limit adoption are not well-understood. In this study we tested potential associations between farmers' beliefs about ecosystem services and their management practices using data collected from questionnaires and cognitive maps from 31 Michigan blueberry and cherry farmers describing their farming systems. We found that farmers who included key biological pest control concepts in their mental model representations reported the use of more conservation practices, and/or participation in conservation programs, than those who did not. In addition, the timing of management practices was a more central factor in the mental models of farmers who included both natural predators and beneficial insects than those omitting these factors. Finally, the farmers who included those two factors showed higher degrees of systems thinking based on mental model metric analysis. We suggest that outreach emphasizing the relationships between ecosystem services and the factors farmers view as most important may positively influence communication and potential of adoption of conservation practices and preventative pest management strategies.
Introduction
Farmers are in a unique position to foster the conservation of natural resources and cultivate ecosystem services because their decisions and behaviors have a direct impact on the environment. For example, certain agricultural practices can positively influence crop production while also providing societal or ecosystem benefits such as preservation of wildlife and improved water quality (Swinton et al., 2007; Lindell et al., 2018). Such “ecosystem services” that benefit crop production include biological management of pests, increased pollination, and soil health through development of biota (Power, 2010; Park et al., 2018). On the other hand, failing to adopt such practices or engaging in certain practices that may have negative environmental influences and can have an impact on ecosystem services such as wildlife habitat (Foley et al., 2011). In order to expand the use of conservation practices for agricultural pest management, educational outreach is needed to increase farmer awareness of the ecosystem services benefits associated with specific practices (Kross et al., 2017; Salliou and Barnaud, 2017; Penvern et al., 2019). However, research into the factors affecting farmers' adoption of ecologically-beneficial practices is also critical (Halbrendt et al., 2014). Several studies have found associations between more “complex” thinking about ecosystems and the use of conservation practices (Vuillot et al., 2016; Teixeira et al., 2018) but understanding of how ways of thinking, behavior, and environmental outcomes are interrelated remains less characterized.
Farmers' decisions on whether or not to adopt a particular practice can be based on a variety of interests, some of which may conflict with each other. Personal goals and motivations for becoming a farmer can influence decision-making, creating barriers to certain practices but conduciveness toward adoption of others; for example, people who farm as a lifestyle choice might be more motivated toward conservation practices (Pannell et al., 2006; Greiner and Gregg, 2011; Prokopy et al., 2019). Like decision-makers in other natural resource management contexts (Stier et al., 2017), farmers might depend on university and industry experts when determining whether to take on a new practice or whether to continue with behaviors that are perceived to be working or otherwise beneficial. However, a barrier to adoption could potentially exist when knowledge about ecosystem services is not incorporated into a farmer's own thinking (Wyckhuys and O'Neil, 2007). This type of barrier has the potential to be overcome using appropriate information sharing techniques (Gray et al., 2014; Wilke and Morton, 2015) and, we propose, through incorporating ecological factors into their beliefs about farming dynamics.
A “systems thinking” approach to natural resource management considers, in a holistic manner, the way that important factors within a system interact with each other (Bosch et al., 2007). Instead of reducing a system to its parts, a systems approach examines how those parts fit into the whole (Gray et al., 2019). In a farming system, these “parts” include not only plants, soil, and farm inputs, but also soil biota, wildlife, water resources and runoff, and the farmers themselves. However, the degree to which farmers are engaging in ecological systems thinking, and how this influences their decision-making and on-farm behaviors, requires more research.
Knowledge about these farming systems, how factors are defined and the relationships between them can be developed through exploration of mental models, which are frameworks for thought that people use to understand their world (Jones et al., 2011). Mental models are used for making day-to-day decisions and are constructed through the acquisition of knowledge and through experience (Carley and Palmquist, 1992; Jones et al., 2011; Moon et al., 2019). For farmers, one manner in which this knowledge can be developed over time is through social learning processes (Reed et al., 2010), where information is shared back and forth with university extension agents, scientists, and other industry partners at meetings, outreach events, and informal situations such as farmer-to-farmer communications that influence their decision-making and preferences (Li et al., 2016).
Social learning processes may be a key to sustainability for natural resource management, by enabling the sharing of multiple stakeholder perspectives over a long term (Muro and Jeffrey, 2008). An iterative process where decisions are made, systems are affected, and mental models are consciously modified to reflect the new resulting perception of reality could assist in the development of more sustainable systems (Hjorth and Bagheri, 2006). For agriculture, when farmers have knowledge of how a particular conservation practice or its sub-parts fit into a farming system, it should be reflected in their mental models. External representations of the assumptions of these models could enable them to make more informed decisions about how their farming decisions potentially influence social or environmental outcomes. While recent research has discovered variations in farmers' mental models based on their style of management (Vuillot et al., 2016), less is known about the association between the presence and absence of ecological information on mental models, and the degree to which different mental models affect management practices.
To better understand how farmers think about their farming systems, and if differences in mental models are associated with the adoption of these types of conservation practices, we focused on the following questions:
• What are the general characteristics of farmers' mental models for pest management decision-making and how do these relate to conservation practices and behaviors?
• Are conservation practices more likely to be adopted by farmers who include biological control factors in these mental models?
In order to study these questions, we researched blueberry and cherry farmers' mental models related to pest management, including how farmers perceive natural predators to work within their pest management systems. We paid special attention to the practice of installing nest boxes to attract American kestrels (Falco sparverius), a natural predator of fruit eating birds, because nest box installation is a well-known management method used by a substantial number of blueberry and cherry growers in Michigan. Bird damage is a significant problem for fruit farmers (Anderson et al., 2013), and kestrels can help manage bird damage in blueberry and cherry orchards. Kestrels have been found to be effective at keeping fruit eating birds out of orchards when they are nesting in close proximity, thereby decreasing damage to cherries (Shave et al., 2018). Nest box installation has been found to be both inexpensive and effective for encouraging nesting near cherry orchards in Michigan, and their use could help to conserve and increase area populations of kestrels, particularly where natural nesting is limited (Shave and Lindell, 2017; Shave et al., 2018). For these reasons nest boxes are an ideal focus for studying the adoption of conservation practices within pest management programs.
Materials and Methods
Working with university extension and industry partners, we used purposeful sampling methods (Patton, 2015) to identify Michigan blueberry and cherry farmers across a variety of categories, including age, generational experience, marketing strategies, and farm size. As perennial fruit crop farmers, blueberry and cherry farmers utilize similar pest management strategies. During in-person interviews averaging approximately 1 h for each farm, we worked with farmers to create maps of their mental models of interactions between factors in their farming systems. We also administered questionnaires inquiring about their farm characteristics and adoption of sustainable agricultural practices. The mental model and questionnaire data were combined in order to better understand potential relationships between ecological systems thinking and the adoption of conservation practices, and to test the hypotheses that conservation practice adoption will be associated with mental models that incorporate ecological concepts. We conducted interviews covering a total of 34 farms (usually with one individual representing the farm but in several cases there were two). This yielded 31 valid data sets (the first was not usable because of subsequent changes in the interview procedure, and two interviewees did not fill out the questionnaire). More specifics about data gathering and analysis follow below.
Fuzzy Cognitive Mapping
FCM is a semi-quantitative method used to create an illustration or representation of a person's mental model about a particular topic or phenomena (Ozesmi and Ozesmi, 2004). FCM is increasingly used to aid natural resource management efforts (Hobbs et al., 2002; Meliadou et al., 2012; Vasslides and Jensen, 2016; Van der Sluis et al., 2018) and has also been applied to farming systems management and agricultural policy development (Fairweather, 2010; Christen et al., 2015; Pacilly et al., 2016). FCM is a useful tool for understanding the potential relationships between ecological thinking and adoption of conservation practices (Vermue, 2017); the mapping process may illustrate specific factors involved in farm production, and the relationships a farmer conceptualizes between those factors (Teixeira et al., 2018). Hence, the inclusion or omission of biological control factors, and the degree to which those factors are perceived to influence other aspects of the system, may provide insight into the degree of ecological systems thinking that a farmer employs.
The FCM mapping process consists of identifying factors or variables of importance in a system and then visually representing the connections between those factors, using a chalkboard, sticky notes, or other interactive and visual methods (Devisscher et al., 2016). The connections between factors on the map are typically given a direction (does A causally influence B, B causally influence A, or both), and a number between −1 and 1 is provided to signify the strength of the relationship between factors and whether it is positive or negative (van Vliet et al., 2010). The resulting map illustrates perceptions of the important factors in the system, and their direct and indirect relationships to each other. Importantly, most studies report a rapidly diminishing number of additional factors after conducting just five to ten interviews, due to a large number of shared concepts (Ozesmi and Ozesmi, 2004).
As graphical and “fuzzy” numerical representations of people's mental models, FCM structural elements may be compared among farmers and quantitatively analyzed. Structural characteristics such as the number of factors, number of connections between them, and the density of connections can be calculated and combined with other data sets for further analysis (Ozesmi and Ozesmi, 2004; Misthos et al., 2017; Konti and Damigos, 2018). Analysis can also examine “driving” or “transmitting” concepts—those that affect other concepts or factors in the map but are not themselves affected by other factors (e.g., in the case of farming “weather” would generally be considered a driver). “Receiving” concepts are those that are affected by, but do not affect, other concepts in the map. “Ordinary” concepts are those that both affect and are affected by other factors (Christen et al., 2015; Teixeira et al., 2018). We posit that including more ordinary concepts therefore suggests a mental model that represents a higher degree of systems thinking because a systems approach considers interactions between various types of factors (human, mineral, biological) at various scales (pest level scale, farm scale, larger ecosystem scale) (Bosch et al., 2007).
For this study, pre-interviews were conducted with two cherry farmers and one blueberry farmer in order to identify the key factors associated with pest management. Factors mentioned ranged from chemical methods of management to natural methods (including natural predators and beneficial insects), mammal, insect pests, and bird pests, weather, and markets. After testing and revisions, a total of 19 factors were identified and chosen for presentation to farmers during the mapping process. The concept “natural predators” is considered broadly to include insect natural enemies, predators of fruit eating birds, and predators of mice, among other agricultural pests. Because some beneficial insects are natural predators, there is some overlap between these concepts. Including these concepts in the mapping enabled us to understand how conservation practices fit into farmers' larger pest management mental models in a broad sense, which then provides a framework for understanding how a specific practice such as nest box installation is considered.
These factors were written on squares of magnetic paper and placed on a 2′ by 3′ magnetic dry erase board. Using a technique employed by Christen et al. (2015) and Li et al. (2016), participants were invited to add any more factors that they felt were important aspects of the system. In our case, they were offered blank magnetic paper squares that they could write on and place on the map. Farmers were then asked to evaluate whether relationships existed between each of the factors, and to draw those relationships using lines (Figure 1), noting the direction and the positivity or negativity of the relationship (“If A increases, does B increase as a result [positive] or decrease as a result [negative]?”). After the interviews, the individual farmers' FCMs were entered into Mental Modeler (mentalmodeler.org), a software program that allows the maps to be visualized in digital form; the program was also used to analyze the FCM data for structural metrics (Gray et al., 2013).
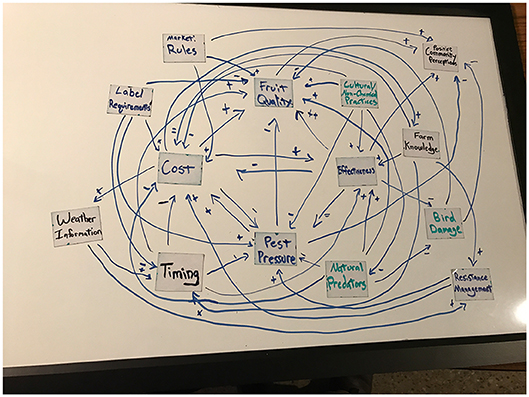
Figure 1. Example of a cherry grower's mental map on the dry erase board. Arrows represent the causal direction (does A affect B or B affect A). “+” indicates a positive relationship (when A increases, so does B) and “–” indicates an inverse relationship (when A increases, B decreases.) A “++” or “– –” indicates a very strong effect.
Questionnaire and Semi-structured Interviews
Our questionnaire was designed to elicit demographic information and farm characteristics, as well as to determine what types of conservation practices farmers have used, including installation of nest boxes to host natural predators. While this overall study was designed to better understand conservation practice adoption and ecological thinking broadly, the practice of installing nest boxes provides a well-known and promoted practice to use as an example. Therefore, we used the questionnaire to also inquire about different methods of bird damage control that farmers have used. Likert-type scale questions (Croasmun and Ostrom, 2011) assessed farmers' perceptions of the effectiveness of those methods [scale from 1 (not effective) to 5 (very effective)]. Farmers also were asked about their participation in three specific state and federal environmental and conservation programs. An early draft of the questionnaire was tested during pre-interviews, and the final version was administered during the in-person interviews to help insure completion and to allow for any clarification questions.
Three semi-structured interview questions were asked after the mapping process and questionnaire administration to capture additional relevant information from respondents (Reed et al., 2009). Two of the questions focused on the FCM process to gain feedback on the method, and to inquire if anything important pest management issues or interactions were missed due to the nature of the FCM method. The third asked whether the farm's pest management was affected by the proximity of neighboring fields or crops. The resulting in-depth data was analyzed for recurring themes and concepts in order to discover any potential data gaps. We focused on concepts/codes related to the timing of pest management actions, site issues such as the effect of woods and adjacent farmland (for example if abandoned blocks caused pest pressure increases,) items not captured by FCM and improvements that could be made to the research and mapping process.
Adoption of Sustainable Practices Index
An index variable for adoption of sustainable practices was constructed by adding the self-reported use of 14 conservation-oriented practices (Cronbach's Alpha = 0.831). Here “adoption” is considered to be the farmer reported use of a practices with an intent to have beneficial environmental, conservation, and/or ecosystem service outcomes. The practices included the following: the use of wildflower strips to increase levels of food available for pollinators, cultivation or protection of beneficial insects, the maintenance of cover crops or other habitat for beneficial insects, scouting for beneficial insects during regular field inspections for pests, mowing orchard floors to manage rodents and arthropod pests, the use of Integrated Pest Management principles, and the use of hedgerows to reduce spray drift. The index was scored by giving one point for each practice that a farmer self-reported using. The index also included any reported participation in the following programs: the Conservation Stewardship Program (CSP), the Environmental Quality Incentives Program (EQIP), and/or the Michigan Agricultural Environmental Assurance Program (MAEAP). Each of these require the use of conservation and environmental quality-oriented practices (although we simply gave one point for participating in each program; we did not characterize specific practices within these programs.) For example, CSP and EQIP provide monetary incentives for engaging in particular conservation practices such as planting of cover crops or development of contour farming to mitigate erosion, improvement of forages and grazing land, and establishment of fish and wildlife habitat1 MAEAP is a voluntary certification program focused on environmental outcomes2, and it requires practices intended to lower rates of groundwater contamination by fertilizers and agricultural chemicals. A higher score on this index means that a farmer has participated in a higher total combined number of the programs and/or adopted more of the sustainable conservation practices identified in the questionnaire.
This index and other questionnaire data were then analyzed in IBM SPSS Statistics, along with FCM data, in order to evaluate trends across farmer types and conservation attitudes using t-tests, ANOVAs, and crosstabs (Lomax and Hahs-Vaughn, 2012).
Results
As Table 1 shows, our final sample consisted of 16 cherry growers and 15 blueberry growers, all in Michigan's Lower Peninsula. Most farms were in the major fruit growing regions near the coast of Lake Michigan and had sandy soil profiles. Ten pick-your-own operations—farms that are open to the public where individuals can harvest fresh fruit themselves—were included in the sample. Five out of the 31 farmers were either certified organic or utilized organic practices for part or all of their farm. Total blueberry and cherry acres ranged from under a quarter acre to 800 acres, with a mean of 147. About half (15) of the farmers in our sample reported they were 1st or 2nd generation farmers, with the other half reporting longer farm legacies (3rd generation or more). A large majority, 81%, reported conducting some or all of the spraying for pest management on their farm, with 19% having employees exclusively do spraying. The percentage reporting current or past use of nest boxes to attract bird predators for pest management was 45%.
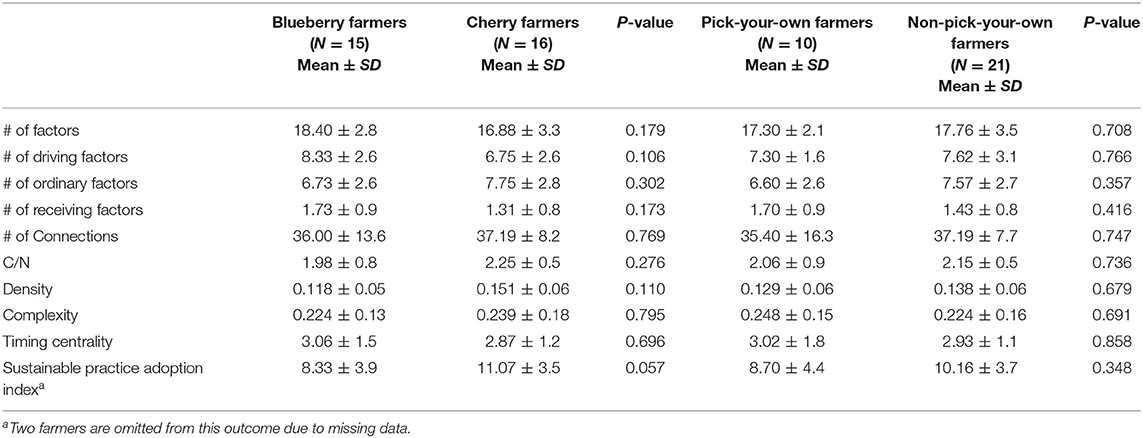
Table 1. Mean differences in mental model metrics and adoption of sustainable practices index by farm type.
We first analyzed the structural characteristics of farmer's mental models to look for differences between groups, illustrated in Table 1. We found some differences between blueberry and cherry farmers, and between pick-your-own and non-pick-your-own farmers in our samples, but most were relatively weak. Mean Sustainable Practice Adoption Index scores, however, were approximately 3 points higher for cherry farmers than for blueberry growers (P = 0.057). We also analyzed other categories, including farm size, education level of the farmer, high vs. low spenders on pest management, organic vs. not organic, and found no strong differences based on these groups—we did not compare differences by gender due to the small percentage of women interviewed.
However, when we analyzed the content of the mental models, we discovered stronger differences based on farmer's inclusion or omission of key biological control factors in their mental maps. We found both differences in the structure of mental models and in practice adoption, as shown in Table 2, and qualitative differences based on the analysis of the most central factors in mental maps (more on this in the Centrality of Factors section below).
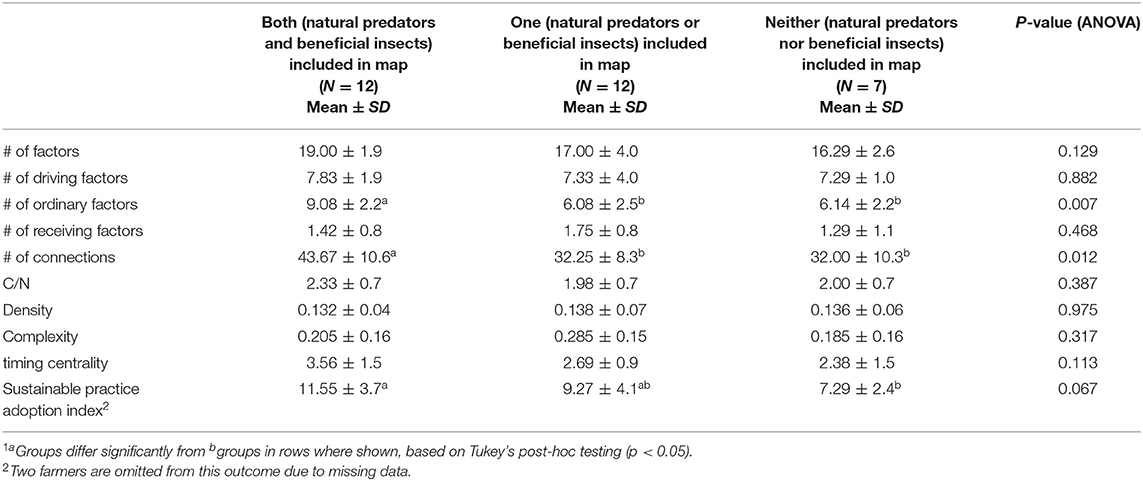
Table 2. Mean differences for mental model metrics and adoption of conservation practices index by inclusion/exclusion of biological control factors in Fuzzy Cognitive Maps1.
Table 2 shows that farmers who included both natural predators and beneficial insects had the highest mean scores for the sustainable practice adoption index (11.55). Those who included neither had the lowest mean score on this index (7.29), and those who included just one of these factors scored in between. In other words, on average, farmers in our sample who included one biological control factor in their mental model had previously utilized 2 additional conservation practices in comparison to farmers who omitted them entirely, and respondent farmers who included two biological control factors had utilized 4 additional conservation practices than the farmers who omitted them entirely. Farmers who included both natural predators and beneficial insects were also likely to include more ordinary factors and connections than those who included just one, or neither. We did not find strong differences for inclusion/omission of the other two factors that were added after pre-interviews (cultural/non-chemical practices and bird damage), as nearly all farmers included them in their models (omission of cultural/non-chemical practices, n = 0; omission of bird damage, n = 3).
Group FCMs Based on Inclusion of Biological Control Factors
Group maps were constructed for farmers who included both natural predators and beneficial insects (Figure 2), and those that included neither concept (Figure 3). The group maps illustrate only the factors that were included by multiple farmers in order to minimize idiosyncratic results (Fairweather, 2010; Vuillot et al., 2016). Most factors that farmers chose to add are therefore not represented on these group maps, with the exceptions of “yield” and “profitability.” The group map for those including the biological control factors has more connections than those that omit both, illustrating the differences reported in Table 2 (mean of 44 connections when including both factors vs. 32 when omitting both (p = 0.012). The map including both factors also had a higher complexity score, which is a measure of the ratio of receiver factors to driving factors (mean of 0.205 for farmers including both factors vs. 0.185 for those omitting biological control factors), although this difference was small. Interestingly, only farmers from the group omitting biological control factors considered “profitability” to increase fruit quality (discussed in more detail below).
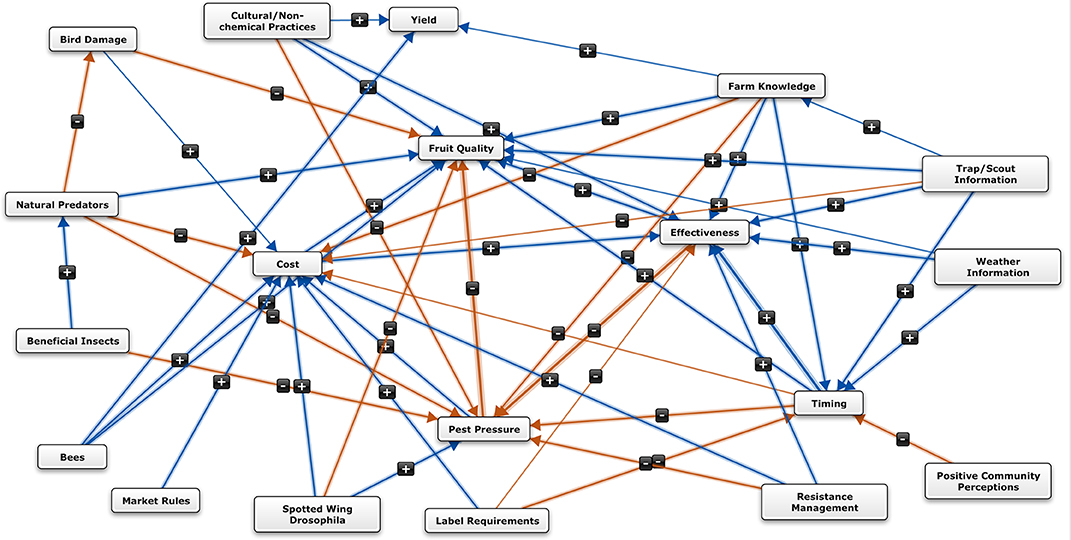
Figure 2. Group map for farmers who included both natural predators and beneficial insects in their map. The blue lines indicate a positive relationship (if A increases, so does B) and the red lines indicate a negative relationship (if A increases, B decreases). The thickness of the line indicates the average strength of the relationship for the group of farmers, with thicker lines representing stronger effects, and thin lines representing lighter effects. The arrow indicated the direction of the relationship (A affects B).
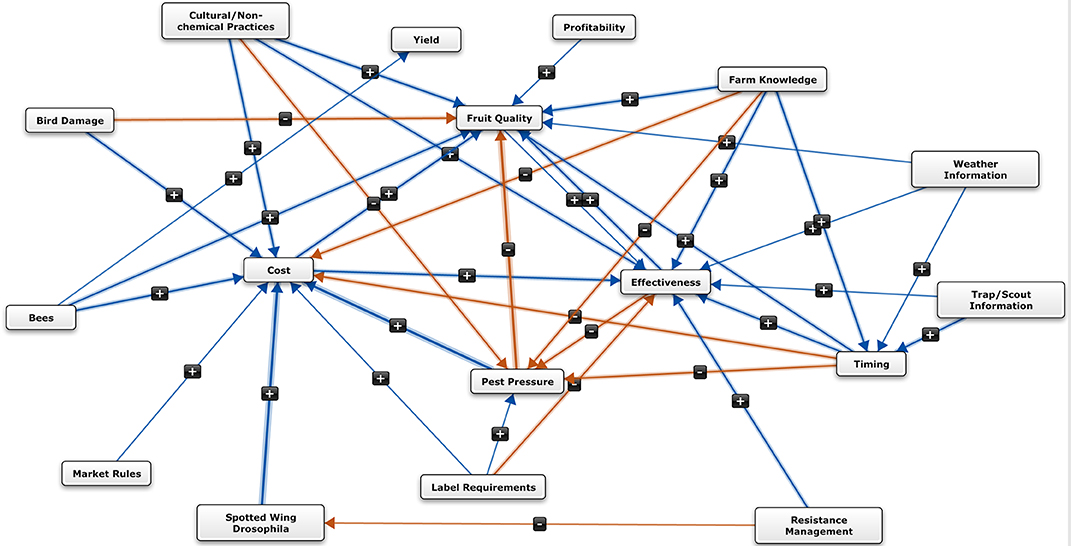
Figure 3. Group map for farmers having neither concept (natural predators, beneficial insects) in their maps. The blue lines indicate a positive relationship (if A increases, so does B) and the red lines indicate a negative relationship (if A increases, B decreases). The thickness of the line indicates the average strength of the relationship for the group of farmers, with thicker lines representing stronger effects, and thin lines representing lighter effects. The arrow indicated the direction of the relationship (A affects B).
Centrality of Factors
An individual concept or factor in an FCM can be qualitatively analyzed for the degree of centrality it has in relation to other factors (Ozesmi and Ozesmi, 2004). A factor's “indegree” is defined as the total weight of relationships that are found to affect that factor, and the “outdegree” is the total weight of effect that the factor has on other factors; the absolute values of indegree and outdegree added together makes up a factor's centrality (Nyaki et al., 2014). Generally, the more central a factor is in a map, the more connections it has to other factors in the map, and/or the higher weight given to its connections.
The factors found to be the most central for the 31 farmers were cost, fruit quality, overall effectiveness of the pest management system (“effectiveness”), pest pressure and timing, in that order. However, as Figure 4 shows, the farmers including both biological control factors in their mental models had much higher focus on “effectiveness” and “timing” and less concentration on “cost” and “fruit quality,” whereas those who included neither factor had a greater focus on “cost,” and especially on the quality of the fruit. The results for farmers including only one factor were in between the “both” and “neither” groups (except for “pest pressure,” for which they had centrality scores similar to those with “both”). As Table 2 indicates, the mean centrality of the factor “timing” was higher for farmers including both biological control factors compared to those omitting both (3.56 vs. 2.38, P = 0.113). In addition, Table 1 shows no strong differences for the centrality of timing by farm type.
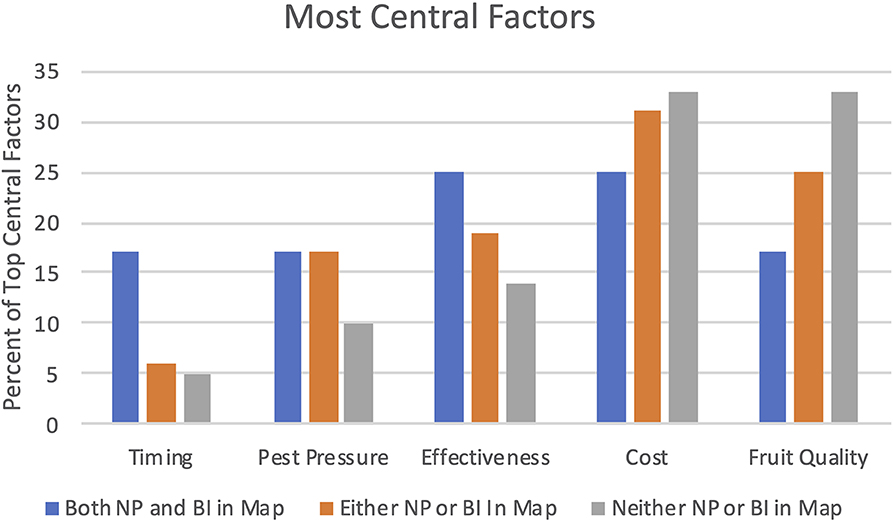
Figure 4. The five highest-scoring factors according to their centrality, based on the inclusion or omission of the factors natural predators (NP) and/or beneficial insects (BI) in their maps. Percentages shown indicate the number of times a particular factor was included in the top three centrality scores for respondents divided by the total number of top three scores (therefore the highest possible score is 33%). For example, 12 respondents included both NP and BI in their maps: 9 had “effectiveness” in their top three scores; the total number of top 3 scores is 12 × 3 =36, and 9/36 = 25%.
Discussion
The mental models of the farmers in this study were quite similar overall and did not show strong differences between blueberry or cherry growers, or whether or not they had pick-your-own sales. These commonalities may be due to the similar approaches that farmers take toward pest management as perennial fruit farmers operating in a Midwestern U.S. climate. For example, while there are differences between organic and conventional approaches, both are working to fight the same pest species in similar environments. Farming could therefore be viewed as a cultural practice, with ways of thinking that are highly convergent for larger or macro-areas of management.
Farmers who included biological control factors in their mental models, however, had higher rates of adoption of sustainable conservation practices. While all of the farmers in our sample had awareness of the factors of natural predators and beneficial insects, many did not see them as having a significant role, nor a reliable effect on, the farm system. Those farmers positing a higher level of interaction or connectivity between biological control factors and other factors in the map, however, had a higher number of factors in their model that both affect and were affected by other factors, and as a result, more connections between factors. This group of farmers also made more connections to the factor of “timing,” suggesting an awareness of the temporal dynamics of farming systems that are not easily represented by a static FCM. The results therefore suggest that a higher degree of systems thinking may be associated with a greater likelihood of adopting more preventative pest management strategies and other conservation practices.
Although most farmers likely view fruit quality as having an effect on profitability (higher quality means higher value and/or less pick-outs), only certain farmers from the group omitting biological control factors considered the reverse—that “profitability” increases fruit quality. For these farmers, such a perception could relate to situations where fruit quality can be sacrificed to save costs if the fruit is intended for a lower-priced market than fresh markets, such as processor markets, because of varietal type or crop damage issues. Considering these cases, higher profit crops result in higher fruit quality because growers will spend more time and money to keep the quality high. While many farmers face such situations periodically, this difference between group mental models could reflect that these farmers employ a more linear pest management approach, one that is more focused on profit and cost, whereas those including biological control factors focus more on overall system effectiveness.
One limitation of this study that while the sample size is appropriate for assessing group mental models, it had less statistical power for analyzing potential associations with behaviors. In addition, the sampling strategy was not random and these farmers are not expected to be fully representative of blueberry and cherry growers in Michigan, therefore the results should be interpreted conservatively. Another limitation is that it was cross-sectional, therefore we were unable to clearly assess the direction of the associations between mental models and the number of conservation practices adopted. Does the adoption of more conservation practices lead to a greater degree of ecological systems thinking, or does an increase in ecological systems thinking encourage the adoption of more conservation practices, or is there an even more complex interaction between the two? Based on feedback regarding the FCM process in our interviews we hypothesize that direction of causality flows from changes in mental models to changes in behavior in most cases, although strong economic incentives for adopting a conservation practice may also lead to changes in mental models. Additional research is needed, however, to clarify these potential pathways.
Educational efforts that focus on bringing ecosystem services concepts into farmers' mental models, including through fuzzy cognitive mapping, may be helpful in increasing adoption of conservation practices. The semi-structured interview data provides evidence that for some interviewees, the fuzzy cognitive mapping process was helpful for better understanding the interrelatedness of different factors, for example the place or significance of natural predators. While more experiments and/or evaluations of systems thinking outreach efforts are needed to confirm the efficacy of this approach and to refine pedagogical methods, our results suggest that such efforts should assess farmers' current mental models to identify the degree to which they already converge and build upon those existing factors and relationships. For example, Michigan cherry and blueberry growers most frequently associated the factor “natural predators” with the level of bird damage, pest pressure, cost, and fruit quality, whereas “beneficial insects” were most frequently associated with the level of pest pressure, cost, and cultural/non-chemical farming practices. “Cost” was a central variable for all farmers, therefore outreach that emphasizes the connections and feedbacks between this factor and ecosystem service factors may facilitate more systems thinking. In addition, “timing” was a central variable for farmers that included biological control factors in their mental models. Providing information about the timing of tasks to farmers and other resource managers could be helpful for making informed decisions about conservation practice adoption, particularly for those who are already using more preventative approaches. Sharing such practical knowledge could increase awareness and even favorable perceptions of the practice, potentially leading to higher rates of adoption (Prokopy et al., 2019).
In addition, the process we used, and the greater use of FCM generally, could help researchers to characterize potential differences in mental models for other agricultural products and for regions outside of Michigan to better inform how “ways of thinking” and behaviors or behavioral intentions and attitudes are related. This could be done individually, as in our study, but group FCM workshops could provide a venue for group knowledge sharing (Voinov and Bousquet, 2010; Van der Sluis et al., 2018), and could stimulate discussion of ecosystem services between farmers who are using more conservation practices and those who are using fewer. This has the potential to shift the highly convergent mental models of farmers toward a more preventative approach to pest management. Greater use of FCM may therefore help farmers develop a better understanding of farm ecology and cultivate more ecosystems thinking (Devisscher et al., 2016), as well as bridge knowledge gaps between farmers and academic researchers (Garbach and Morgan, 2017; García-Barrios et al., 2017).
Conclusion
This study analyzed mental models of blueberry and cherry farmers in Michigan and their associations with conservation practices and/or participation in conservation programs. Those who demonstrated more ecological systems thinking, as measured by more biological control factors in their model and more ordinary factors—those that both affect and were affected by other factors—were likely to report higher rates of adoption, as well as more connections to the dynamic factor of timing. Conversely, those who did not incorporate certain biological control factors in their model had a greater focus on cost and were likely to report lower rates of adoption of conservation practices. These results add to our understanding of the relationships between ecological systems thinking and differences in the use of preventative pest management practices. Although more research is needed to clarify the causality of these relationships, future work should emphasize connections and feedbacks involving the system factors that farmers already view as important.
Data Availability Statement
The datasets generated and analyzed for this study can be found in the openICPSR repository at http://doi.org/10.3886/E112171V2, with the exception of the semi-structured interview data which can be made available upon request.
Ethics Statement
The studies involving human participants were reviewed and approved by Michigan State University Human Research Protection Program. Written informed consent for participation was not required for this study in accordance with the national legislation and the institutional requirements.
Author Contributions
PH conceptualized the study. Data collection was carried out by CB. All authors were involved in analysis, interpretation, writing, and methodological development.
Funding
National Science Foundation provided funding for this research under Grant #1518366.
Conflict of Interest
The authors declare that the research was conducted in the absence of any commercial or financial relationships that could be construed as a potential conflict of interest.
Acknowledgments
We would like to acknowledge the National Science Foundation which provided funding for this research. We also thank Dr. Megan Shave and Dr. Catherine Lindell for their research on the effectiveness of nest boxes and natural predators for lowering bird damage in the field. Finally, we appreciate the all the aid from growers and other people involved in the blueberry and cherry industries, including MSU research and Extension personnel.
Footnotes
1. ^For more information on the CSP practices see the list at: https://www.nrcs.usda.gov/wps/portal/nrcs/main/national/programs/financial/csp/ and for EQIP see: https://www.nrcs.usda.gov/wps/portal/nrcs/main/national/programs/financial/eqip/
2. ^Information about MAEAP can be found at: http://www.maeap.org
References
Anderson, A., Lindell, C. A., Moxcey, K. M., Siemer, W. F., Linz, G. M., Curtis, P. D., et al. (2013). Bird damage to select fruit crops: the cost of damage and the benefits of control in five states. Crop Prot. 52, 103–109. doi: 10.1016/j.cropro.2013.05.019
Bosch, O., King, C., Herbohn, J. L., Russell, I., and Smith, C. (2007). Getting the big picture in natural resource management—systems thinking as ‘method’for scientists, policy makers and other stakeholders. Syst. Res. Behav. Sci. 24, 217–232. doi: 10.1002/sres.818
Carley, K., and Palmquist, M. (1992). Extracting, representing, and analyzing mental models. Soc. Forces 70, 601–636. doi: 10.2307/2579746
Christen, B., Kjeldsen, C., Dalgaard, T., and Martin-Ortega, J. (2015). Can fuzzy cognitive mapping help in agricultural policy design and communication? Land Use Policy 45, 64–75. doi: 10.1016/j.landusepol.2015.01.001
Croasmun, J. T., and Ostrom, L. (2011). Using Likert-type scales in the social sciences. J. Adult Educ. 40, 19–22. Available online at: https://files.eric.ed.gov/fulltext/EJ961998.pdf
Devisscher, T., Boyd, E., and Malhi, Y. (2016). Anticipating future risk in social-ecological systems using fuzzy cognitive mapping: the case of wildfire in the Chiquitania, Bolivia. Ecol. Soc. 21:18. doi: 10.5751/ES-08599-210418
Fairweather, J. (2010). Farmer models of socio-ecologic systems: application of causal mapping across multiple locations. Ecol. Model. 221, 555–562. doi: 10.1016/j.ecolmodel.2009.10.026
Foley, J. A., Ramankutty, N., Brauman, K. A., Cassidy, E. S., Gerber, J. S., Johnston, M., et al. (2011). Solutions for a cultivated planet. Nature 478, 337–342. doi: 10.1038/nature10452
Garbach, K., and Morgan, G. P. (2017). Grower networks support adoption of innovations in pollination management: the roles of social learning, technical learning, and personal experience. J. Environ. Manage. 204, 39–49. doi: 10.1016/j.jenvman.2017.07.077
García-Barrios, L., Cruz-Morales, J., Vandermeer, J., and Perfecto, I. (2017). The Azteca chess experience: learning how to share concepts of ecological complexity with small coffee farmers. Ecol. Soc. 22:237. doi: 10.5751/ES-09184-220237
Gray, S., Sterling, E. J., Aminpour, P., Goralnik, L., Singer, A., Wei, C., et al. (2019). Assessing (social-ecological) systems thinking by evaluating cognitive maps. Sustainability 11:5753. doi: 10.3390/su11205753
Gray, S. A., Gray, S., Cox, L. J., and Henly-Shepard, S. (2013). “Mental modeler: a fuzzy-logic cognitive mapping modeling tool for adaptive environmental management,” in Paper Presented at the System Sciences (HICSS), 2013 46th Hawaii International Conference (Wailea, HI). doi: 10.1109/HICSS.2013.399
Gray, S. R. J., Gagnon, A. S., Gray, S. A., O'Dwyer, B., O'Mahony, C., Muir, D., et al. (2014). Are coastal managers detecting the problem? Assessing stakeholder perception of climate vulnerability using Fuzzy Cognitive Mapping. Ocean Coast. Manage. 94, 74–89. doi: 10.1016/j.ocecoaman.2013.11.008
Greiner, R., and Gregg, D. (2011). Farmers' intrinsic motivations, barriers to the adoption of conservation practices and effectiveness of policy instruments: empirical evidence from northern Australia. Land Use Policy 28, 257–265. doi: 10.1016/j.landusepol.2010.06.006
Halbrendt, J., Gray, S. A., Crow, S., Radovich, T., Kimura, A. H., and Tamang, B. B. (2014). Differences in farmer and expert beliefs and the perceived impacts of conservation agriculture. Global Environ. Change 28, 50–62. doi: 10.1016/j.gloenvcha.2014.05.001
Hjorth, P., and Bagheri, A. (2006). Navigating towards sustainable development: a system dynamics approach. Futures 38, 74–92. doi: 10.1016/j.futures.2005.04.005
Hobbs, B. F., Ludsin, S. A., Knight, R. L., Ryan, P. A., Biberhofer, J., and Jan, J. H. C. (2002). Fuzzy cognitive mapping as a tool to define management objectives for complex ecosystems. Ecol. Appl. 12, 1548–1565. doi: 10.1890/1051-0761(2002)012[1548:FCMAAT]2.0.CO;2
Jones, N. A., Ross, H., Lynam, T., Perez, P., and Leitch, A. (2011). Mental models: an interdisciplinary synthesis of theory and methods. Ecol. Soc. 16:46. doi: 10.5751/ES-03802-160146
Konti, A., and Damigos, D. (2018). Exploring strengths and weaknesses of bioethanol production from bio-waste in greece using fuzzy cognitive maps. Energy Policy 112, 4–11. doi: 10.1016/j.enpol.2017.09.053
Kross, S. M., Ingram, K. P., Long, R. F., and Niles, M. T. (2017). Farmer perceptions and behaviors related to wildlife and on-farm conservation actions. Conserv. Lett. 11:e12364. doi: 10.1111/conl.12364
Li, O., Gray, S. A., and Sutton, S. G. (2016). Mapping recreational fishers' informal learning of scientific information using a fuzzy cognitive mapping approach to mental modelling. Fish. Manage. Ecol. 23, 315–329. doi: 10.1111/fme.12174
Lindell, C., Eaton, R. A., Howard, P. H., Roels, S. M., and Shave, M. (2018). Enhancing agricultural landscapes to increase crop pest reduction by vertebrates. Agric. Ecosyst. Environ. 257, 1–11. doi: 10.1016/j.agee.2018.01.028
Lomax, R. G., and Hahs-Vaughn, D. L. (2012). An Introduction to Statistical Concepts, 3rd Edn. New York, NY: Routledge.
Meliadou, A., Santoro, F., Nader, M. R., Dagher, M. A., Al Indary, S., and Salloum, B. A. (2012). Prioritising coastal zone management issues through fuzzy cognitive mapping approach. J. Environ. Manage. 97, 56–68. doi: 10.1016/j.jenvman.2011.11.006
Misthos, L.-M., Messaris, G., Damigos, D., and Menegaki, M. (2017). Exploring the perceived intrusion of mining into the landscape using the fuzzy cognitive mapping approach. Ecol. Eng. 101, 60–74. doi: 10.1016/j.ecoleng.2017.01.015
Moon, K., Guerrero, A. M., Adams, V. M., Biggs, D., Blackman, D. A., Craven, L., et al. (2019). Mental models for conservation research and practice. Conserv. Lett. 12:e12642. doi: 10.1111/conl.12642
Muro, M., and Jeffrey, P. (2008). A critical review of the theory and application of social learning in participatory natural resource management processes. J. Environ. Plann. Manage. 51, 325–344. doi: 10.1080/09640560801977190
Nyaki, A., Gray, S. A., Lepczyk, C. A., Skibins, J. C., and Rentsch, D. (2014). Local-scale dynamics and local drivers of bushmeat trade. Conserv. Biol. 28, 1403–1414. doi: 10.1111/cobi.12316
Ozesmi, U., and Ozesmi, S. L. (2004). Ecological models based on people's knowledge: a multi-step fuzzy cognitive mapping approach. Ecol. Model. 176, 43–64. doi: 10.1016/j.ecolmodel.2003.10.027
Pacilly, F. C. A., Groot, J. C. J., Hofstede, G. J., Schaap, B. F., and van Bueren, E. T. L. (2016). Analysing potato late blight control as a social-ecological system using fuzzy cognitive mapping. Agro. Sustain. Dev. 36:35. doi: 10.1007/s13593-016-0370-1
Pannell, D. J., Marshall, G. R., Barr, N., Curtis, A., Vanclay, F., and Wilkinson, R. (2006). Understanding and promoting adoption of conservation practices by rural landholders. Aust. J. Exp. Agric. 46, 1407–1424. doi: 10.1071/EA05037
Park, M. G., Joshi, N. K., Rajotte, E. G., Biddinger, D. J., Losey, J. E., and Danforth, B. N. (2018). Apple grower pollination practices and perceptions of alternative pollinators in New York and Pennsylvania. Renew. Agricu. Food Syst. 35:1–14. doi: 10.1017/S1742170518000145
Patton, M. Q. (2015). Qualitative Research and Evaluation Methods: Integrating Theory and Practice, 4th Edn. Thousand Oaks, CA: SAGE Publications, Inc.
Penvern, S., Fernique, S., Cardona, A., Herz, A., Ahrenfeldt, E., Dufils, A., et al. (2019). Farmers' management of functional biodiversity goes beyond pest management in organic European apple orchards. Agric. Ecosyst. Environ. 284:106555. doi: 10.1016/j.agee.2019.05.014
Power, A. G. (2010). Ecosystem services and agriculture: tradeoffs and synergies. Philos. Trans. R Soc. Lond. B Biol. Sci. 365, 2959–2971. doi: 10.1098/rstb.2010.0143
Prokopy, L. S., Floress, K., Arbuckle, J. G., Church, S. P., Eanes, F. R., Gao, Y., et al. (2019). Adoption of agricultural conservation practices in the United States: evidence from 35 years of quantitative literature. J. Soil Water Conser. 74, 520–534. doi: 10.2489/jswc.74.5.520
Reed, M. S., Evely, A. C., Cundill, G., Fazey, I., Glass, J., Laing, A., et al. (2010). What is social learning? Ecol. Soci. 15. doi: 10.5751/ES-03564-1504r01
Reed, M. S., Graves, A., Dandy, N., Posthumus, H., Hubacek, K., Morris, J., et al. (2009). Who's in and why? A typology of stakeholder analysis methods for natural resource management. J. Environ. Manage. 90, 1933–1949. doi: 10.1016/j.jenvman.2009.01.001
Salliou, N., and Barnaud, C. (2017). Landscape and biodiversity as new resources for agro-ecology? Insights from farmers' perspectives. Ecol. Soc. 22:16. doi: 10.5751/ES-09249-220216
Shave, M. E., and Lindell, C. A. (2017). American kestrels occupying nest boxes in Michigan cherry orchards show high reproductive rates and tolerance of monitoring. J. Raptor Res. 51, 50–60. doi: 10.3356/JRR-16-43.1
Shave, M. E., Shwiff, S. A., Elser, J. L., and Lindell, C. A. (2018). Falcons using orchard nest boxes reduce fruit-eating bird abundances and provide economic benefits for a fruit-growing region. J. Appl. Ecol. 55, 2451–2460. doi: 10.1111/1365-2664.13172
Stier, A. C., Samhouri, J. F., Gray, S., Martone, R. G., Mach, M. E., Halpern, B. S., et al. (2017). Integrating expert perceptions into food web conservation and management. Conserv. Lett. 10, 67–76. doi: 10.1111/conl.12245
Swinton, S. M., Lupi, F., Robertson, G. P., and Hamilton, S. K. (2007). Ecosystem services and agriculture: cultivating agricultural ecosystems for diverse benefits. Ecol. Econ. 64, 245–252. doi: 10.1016/j.ecolecon.2007.09.020
Teixeira, H. M., Vermue, A. J., Cardoso, I. M., Claros, M. P., and Bianchi, F. J. (2018). Farmers show complex and contrasting perceptions on ecosystem services and their management. Ecosyst. Serv. 33, 44–58. doi: 10.1016/j.ecoser.2018.08.006
Van der Sluis, T., Arts, B., Kok, K., Bogers, M., Busck, A. G., Sepp, K., et al. (2018). Drivers of European landscape change: stakeholders' perspectives through fuzzy cognitive mapping. Landsc. Res. 44, 458–476. doi: 10.1080/01426397.2018.1446074
van Vliet, M., Kok, K., and Veldkamp, T. (2010). Linking stakeholders and modellers in scenario studies: the use of fuzzy cognitive maps as a communication and learning tool. Futures 42, 1–14. doi: 10.1016/j.futures.2009.08.005
Vasslides, J. M., and Jensen, O. P. (2016). Fuzzy cognitive mapping in support of integrated ecosystem assessments: developing a shared conceptual model among stakeholders. J. Environ. Manage. 166, 348–356. doi: 10.1016/j.jenvman.2015.10.038
Vermue, A. (2017). Farmers' perceptions on ecosystem services and their management (MSc Thesis in Farming Systems Ecology). Universidade Federal De Vicosa, Wageningen, Netherlands and Brazil.
Voinov, A., and Bousquet, F. (2010). Modelling with stakeholders. Environ. Modell. Softw. 25, 1268–1281. doi: 10.1016/j.envsoft.2010.03.007
Vuillot, C., Coron, N., Calatayud, F., Sirami, C., Mathevet, R., and Gibon, A. (2016). Ways of farming and ways of thinking: do farmers' mental models of the landscape relate to their land management practices? Ecol. Soc. 21:35. doi: 10.5751/ES-08281-210135
Wilke, A. K., and Morton, L. W. (2015). Climatologists' patterns of conveying climate science to the agricultural community. Agric. Hum. Val. 32, 99–110. doi: 10.1007/s10460-014-9531-5
Keywords: conservation, ecosystem services, agriculture, ecological systems thinking, natural predators
Citation: Bardenhagen CJ, Howard PH and Gray SA (2020) Farmer Mental Models of Biological Pest Control: Associations With Adoption of Conservation Practices in Blueberry and Cherry Orchards. Front. Sustain. Food Syst. 4:54. doi: 10.3389/fsufs.2020.00054
Received: 06 February 2020; Accepted: 09 April 2020;
Published: 05 May 2020.
Edited by:
Kris A. G. Wyckhuys, Chinese Academy of Agricultural Sciences, ChinaReviewed by:
Hannah Torres, Old Dominion University, United StatesRanda Jabbour, University of Wyoming, United States
Rica Joy Flor, International Rice Research Institute, Philippines
Copyright © 2020 Bardenhagen, Howard and Gray. This is an open-access article distributed under the terms of the Creative Commons Attribution License (CC BY). The use, distribution or reproduction in other forums is permitted, provided the original author(s) and the copyright owner(s) are credited and that the original publication in this journal is cited, in accordance with accepted academic practice. No use, distribution or reproduction is permitted which does not comply with these terms.
*Correspondence: Chris J. Bardenhagen, YmFyZGVuaDFAbXN1LmVkdQ==