 Punyaporn Prangbang1,2
 Kazuyuki Yagi1,2*
 Jorrel Khalil S. Aunario3
 Bjoern Ole Sander4Reiner Wassmann3,5
 Thomas Jäkel3,6,7Chitnucha Buddaboon6Amnat Chidthaisong1,2Sirintornthep Towprayoon1,2
- 1Joint Graduate School of Energy and Environment (JGSEE), King Mongkut's University of Technology Thonburi (KMUTT), Bangkok, Thailand
- 2Center of Excellence on Energy Technology and Environment (CEE), Postgraduate Education and Research Development Office (PERDO), Ministry of Higher Education, Science, Research and Innovation, Bangkok, Thailand
- 3International Rice Research Institute (IRRI), Los Baños, Philippines
- 4International Rice Research Institute (IRRI), Hanoi, Vietnam
- 5Karlsruhe Institute of Technology (KIT), Institute of Meteorology and Climate Research (IMK-IFU), Garmisch-Partenkirchen, Germany
- 6Rice Department, Ministry of Agriculture and Cooperatives, Bangkok, Thailand
- 7Centre for International Migration and Development (CIM), Deutsche Gesellschaft für Internationale Zusammenarbeit (GIZ), Eschborn, Germany
The alternate wetting and drying (AWD) water management technique has been identified as one of the most promising options for mitigating methane (CH4) emissions from rice cultivation. By its nature, however, this option is limited only to paddy fields where farmers have sustained access to irrigation water. In addition, large amounts of rainfall often make it difficult to drain water from paddy fields. Therefore, it is necessary to understand the specific conditions and suitability of an area in which AWD is foreseen to be applied before its CH4 mitigation potential can be assessed in view of planning regional and national mitigation actions. In this study, we applied a methodology developed for assessing the climatic suitability of AWD to paddy fields in the central plain of Thailand in order to determine the potential spatial and temporal boundaries given by climatic and soil parameters that could impact on the applicability of AWD. Related to this, we also assessed the CH4 mitigation potential in the target provinces. Results showed that the entire area of the six target provinces was climatically suitable for AWD in both the major (wet) and second (dry) rice seasons. A sensitivity analysis accounting for uncertainties in soil percolation and suitability classification indicated that these settings did not affect the results of the suitability assessment, although they changed to some extent the distribution of moderate and high climatic suitability areas in the major rice season. Following the methodologies of the Intergovernmental Panel on Climate Change Guidelines, we estimated that the AWD scenario could reduce annual CH4 emissions by 32% compared with the emissions in the baseline (continuously flooded) scenario. The potential of AWD for annual CH4 emission reduction was estimated to be 57,600 t CH4 year−1, equivalent to 1.61 Mt CO2-eq year−1, in the target provinces. However, we recognize the possibility that other parameters not included in our current approach may significantly influence the suitability of AWD and thus propose areas for further improvement derived from these limitations. All in all, our results will be instrumental in guiding practitioners at all levels involved in water management for rice cultivation.
Introduction
Rice cultivation is one of the major sources of agricultural emissions of methane (CH4) at a global scale. The contribution of CH4 emissions from rice cultivation to the national budgets of greenhouse gas (GHG) emissions is significant in Southeast Asian countries, where rice cultivation is the dominant use of land. For example, in Thailand, rice cultivation occupies about 46% of the total agricultural land [OAE (Office of Agricultural Economics), 2018] and accounts for about 55% of the total GHG emissions in the agriculture sector, or 6.5% of the total national GHG emissions [ONREPP (Office of Natural Resources and Environmental Policy and Planning), 2017]. This highlights the fact that actions to reduce GHG emissions from rice cultivation in Southeast Asian countries could have a great potential in mitigating the impacts of climate change, both regionally and globally.
Considering agronomic management in practice, there exist a number of suggested technical options for mitigating CH4 emissions from paddy fields. These include specific management techniques for the water regime, rice planting methods, selection of rice cultivar, and application of organic matter, fertilizer, and other amendments (Wassmann et al., 2000; Smith et al., 2014; Romasanta et al., 2017; Yagi et al., 2020). At present, however, only a few of these options have a proven track record as promising mitigation tools. In particular, water management options have been identified as an effective approach to consistently reducing CH4 emissions (Itoh et al., 2011; Sander et al., 2015; Jiang et al., 2019). This was shown by a meta-analysis of experimental data from Southeast Asia (Yagi et al., 2020): Various water management options, including a single and multiple round(s) of draining of paddy fields (e.g., mid-season drainage and alternate wetting and drying [AWD]), significantly reduced CH4 emissions by 35% on average (95% confidence interval: 41–29%).
AWD is a water management practice that was developed and is currently promoted by the International Rice Research Institute (IRRI) and its partners in many rice-producing countries, primarily in order to reduce the consumption of irrigation water (Lampayan et al., 2015). The principle of AWD is to switch from a continuously flooded rice field to a field that encompasses several dry phases during the growing season. Starting at about 2–3 weeks after transplanting (3–4 weeks after sowing) the field is left to dry out until the water table reaches a level of about 10–15 cm below the soil surface. Once the threshold is reached, irrigation water should be applied until 3–5 cm of standing water in the field is reached. A level of “−15 cm” has been identified as “safe” so that plants do not face drought stress and thus yields are not reduced (Bouman et al., 2007). Importantly, no significant effect of AWD on rice yield was reported by a meta-analysis of field data from Southeast Asia (Yagi et al., 2020).
Policy makers and rice value-chain operators all over the world are increasingly recognizing that alternative water management practices in rice cultivation could become a visible option for CH4 reduction. Besides, the impact of climate change in the form of increased frequency of droughts already forces farmers to re-adjust their approach to water management. In view of this, all stakeholders involved may consider making low-emission rice farming as an important component of national and organizational commitments to tackle climate change and enhance the resilience and sustainability of the agriculture sector. In some of the major rice-producing countries, large-scale changes in water management are already part of the proposed actions for reducing GHG emissions in compliance with the national commitments to the Paris Agreement. For example, AWD is listed as one of the low carbon technologies with regards to the nationally determined contributions of Vietnam. The mitigation potential of using water drainage in rice fields was estimated to reduce GHG emissions by 4.1 Mt CO2 from the South Central Coast and 21.9 Mt CO2 from the Red River Delta. In addition, the Vietnamese government plans to promote the “System of Rice Intensification (SRI)” program, an innovative rice cultivation technique in which AWD is the central management option (Thakur et al., 2016), within a 500,000 ha of rice cultivation area (Ministry of Natural Resources and Environment, 2017). Similarly, the Indonesian government has included SRI in the list of national mitigation actions and reported that the program has already been applied to up to 435,999 ha of paddy fields by 2014 (Republic of Indonesia, 2017).
However, the application of alternative water drainage regimes may be limited to paddy fields in which the irrigation/drainage system has been well-developed. In particular, control of water is generally difficult or impossible in rainfed paddy fields. This poses a problem in the implementation of water management options for GHG mitigation. In addition, large amounts of rainfall often make it difficult to drain water from paddy fields. In the paddy fields of Southeast Asia, the extension of irrigated paddy fields is limited to <30% among the continental countries, while this value ranges between 60 and 70% in island countries (Dobermann and Fairhurst, 2000; Redfern et al., 2012). Even paddy fields classified as irrigated are not always capable of controlling water, in particular during the rainy wet season. Farmers need guidance regarding the appropriate timing of irrigating their fields within the rice-growing period. Hence, it would be helpful to understand in which locations water management options are best applicable or suitable in order to achieve the best GHG mitigation results.
Responding to this need, Nelson et al. (2015) presented the first attempt of a spatial and temporal assessment of the climatic suitability for AWD at the province level in the Philippines. This study was based on a simple water balance model reflecting the possibility to drain or dry a rice field for a substantial duration during the rice-growing season. Later, Sander et al. (2017) extended this methodology to the entire rice area of the Philippines and developed country-scale climatic suitability maps for AWD for the wet and dry seasons. In addition, both studies illustrated how the assessment can be used to estimate the potential GHG emission mitigation. They estimated that a maximum of 60% of the rice area of the Philippines is climatically suited for AWD, reaching more than 90% in the dry and 34% in the wet season. The potential maximum annual reduction of CH4 emissions from lowland rice in the Philippines was estimated to be about 265,000 t CH4 year−1 or around 15% of the country's annual emissions from the agriculture sector (Sander et al., 2017).
Here we apply the same methodology as described previously to the paddy fields in the central plain of Thailand. The six provinces selected for this study are located mostly in the irrigated area, which has a higher capacity of controlled irrigation compared to other areas in Thailand. Our work aimed at assessing the spatial and temporal boundaries of climatically suitable areas for application of AWD in the target provinces. At the same time, we estimated the potential for reducing CH4 emissions from rice cultivation. We hope that our results will be helpful to agricultural practitioners and can contribute to the development of national policies for climate change actions.
Materials and Methods
Study Area
This study focused on six provinces: Ang Thong, Ayuthaya, Chai Nat, Pathum Thani, Sing Buri, and Suphan Buri which are all located in the central plain of Thailand (Figure 1). The total area of all six provinces covers 13,736 km2, between 13.92 and 15.42°N and between 99.28 and 100.95°E. All six provinces share boundaries, which provides for similar weather conditions in that area. The rainy season usually starts in May and lasts until the end of October. The period from November to January represents the cool and dry season, while the months from February to April represent the hot and dry period (Thai Meteorological Department, 2020). All six provinces are located in a plain, which includes major rivers, such as the Chao Phraya, Tha Chin, Pa Sak, and Lopburi. Most of the land use for agriculture in these six provinces is under irrigation, which is under the authority of the Regional Irrigation Offices. Therefore, water for rice cultivation is usually available in sufficient quantities, even during the dry season.
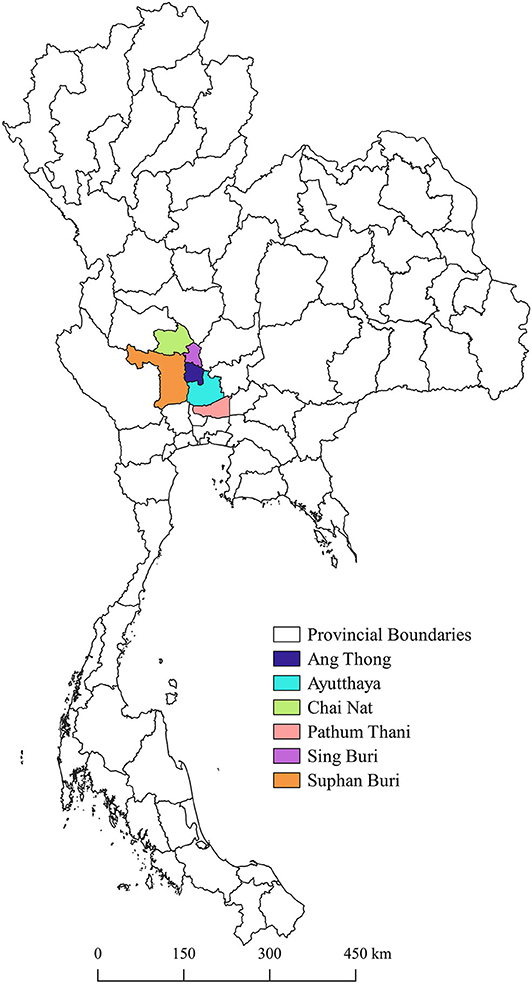
Figure 1. Location of target provinces as the study area.
The average annual rainfall is around 1,150 mm, with most rain (960 mm) occurring during the rainy season from May to October. The average minimum and maximum temperature throughout the year is 23 and 34°C, respectively. In both major (wet) and second (dry) rice seasons, rice is cultivated under rainfed (5.9 and 1.6% of the rice area, respectively) and irrigated (94.1 and 98.4%, respectively) conditions according to data from the crop year 2018 published by the Office of Agricultural Economics (OAE) (OAE (Office of Agricultural Economics), 2018). In the event of a prolonged drought, however, even irrigated land may be in short supply of water.
Outline of Suitability Assessment
We conducted the AWD suitability assessment by following the methodology described by Nelson et al. (2015). The outline of the methodology is summarized in a flow chart as shown in Figure 2. This approach for assessing climatic suitability of AWD was applied to paddy fields in the central plain of Thailand for determining the potential spatial and temporal boundaries given by climatic and soil parameters that could influence the applicability of AWD. Related to that, the potential of CH4 emission mitigation in the target provinces was estimated.

Figure 2. Flow chart of the AWD suitability assessment.
As shown in Figure 2, this study used the water balance model for climatic suitability assessment (Nelson et al., 2015). For running the model, six data sets were used as “input data,” namely data set A: rice statistics, data set B: rice calendar, data set C: rice extent, data set D: temperature, data set E: rainfall, and data set F: soil texture. The water balance model is the central idea of the assessment: it takes into account the volumes of water entering and leaving the rice fields. The total amount of water flux is related to meteorological factors (temperature and rainfall) and characteristics of the soil. The products of derived input data are termed “derived data,” including data set G: potential evapotranspiration and data set H: potential percolation. Data sets A–H were used to assess climatic suitability for AWD by following the four steps of “spatial analysis” described below.
The climatic suitability of the rice area for implementing AWD was calculated for a period of 1 year, which was divided into intervals of 10 days, called “dekad.” A total of 37 maps were scored by counting the deficit (DEF) water dekads according to the rice calendar. We accounted for potential uncertainties related to the input data or criteria of parameters by conducting sensitivity analyses for soil percolation rate data and breakpoint setting for ranking suitability were conducted. Finally, we estimated the potential of CH4 mitigation by implementing AWD in the target provinces using the methodologies recommended in the Intergovernmental Panel on Climate Change (IPCC) Guidelines [IPCC (Intergovernmental Panel on Climate Change), 2019].
Input Data
Data Set A: Rice Statistics
Rice statistics included area, production, and yield of rice, in each province of Thailand as reported annually in the Agricultural Statistics of Thailand published by OAE. The reports for the years 2010–2017 (November 2010–October 2017) were available to us. According to the latest report for 2017, the average annual area of total rice harvested in the six target provinces was 1,047,000 ha, of which 584,000 ha are planted in the major rice season and 464,000 ha in the second rice season (OAE (Office of Agricultural Economics), 2018; Table 1). According to the monthly rice harvested area reports, the major rice season started in May and ended in October; the second rice season started in November and ended in April in all the target provinces.
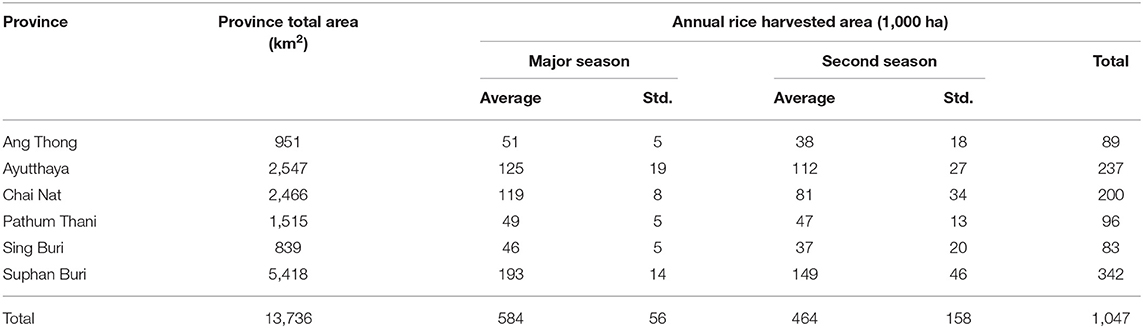
Table 1. Average size of the area of annually harvested rice in the target provinces for 7 years (2010–2017, except 2005) according to the Agricultural Statistics of Thailand [OAE (Office of Agricultural Economics), 2018].
Data Set B: Rice Calendar
The data used for feeding the “Rice calendar” were obtained from “RiceAtlas,” a spatial database of global rice calendars and production (Laborte et al., 2017). The data in “RiceAtlas” are based on various published sources, such as global and regional datasets, international and national publications, online sources, and unpublished data sources like expert knowledge. The calendar summarizes the cultivation periods and provides the peak date of cultivation, which refers to the date when the majority of the crop is being planted or harvested.
According to “RiceAtlas,” Thailand has five different rice calendars accounting for the double cropping of rice. Here, we have chosen the calendars of Supan Buri (type 1) and those of the five other provinces that share the same type (type 2). Rice calendars of both types and differentiated by season are listed in Table 2.
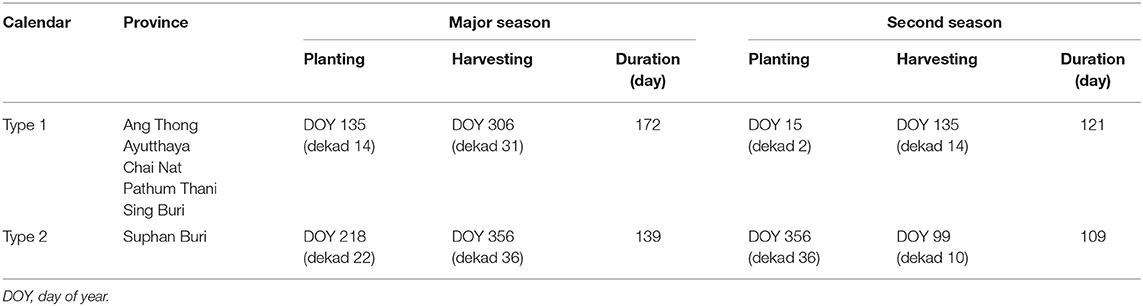
Table 2. Rice calendars in the target provinces according to RiceAtlas (Laborte et al., 2017).
Data Set C: Rice Extent
Rice extent, or the spatial distribution of rice, was based on the product from MOD09A1 8-day composite remote sensing data in 2000–2012, which was derived from rice extent maps of a 13-years time series of “Moderate Resolution Imaging Spectrometer (MODIS)” at a 500 m resolution (Xiao et al., 2006; Nelson and Gumma, 2015). The maximum rice extent data during these years were used as input data for representing rice extent in the target provinces.
Data Set D: Temperature
Temperature data in degrees Celsius (°C) were obtained from daily minimum and maximum temperature records including the “Global Surface Summary of the Day (GSOD)” database [NOAA (National Oceanic and Atmospheric Administration), 2019]. These daily minimum and maximum temperatures in raster were averaged as mean daily temperature per dekad in 2007–2017. Consecutively, dekadal temperature data were again averaged as an 11-year mean temperature per dekad. Additionally, the dekadal temperature data of each year were used to analyze inter-annual variations of the suitability for AWD.
Data Set E: Rainfall
Rainfall data in mm day−1 were taken from the rainfall estimates from rain gauge and satellite observations included in the quasi-global rainfall database termed “Climate Hazards Group InfraRed Precipitation with Station (CHIRPS)” that provides daily rainfall data in raster grid format with a 0.05-degree (~5.6 km) resolution (Funk et al., 2015). They were summed up to daily rainfall per dekad in 2007–2017 and calculated as the average of all 11 years per dekad. Figure 3 shows the spatial distribution of the 11-years mean rainfall per dekad. In addition, the dekadal rainfall data of each year were used to analyze inter-annual variations of the suitability for AWD.
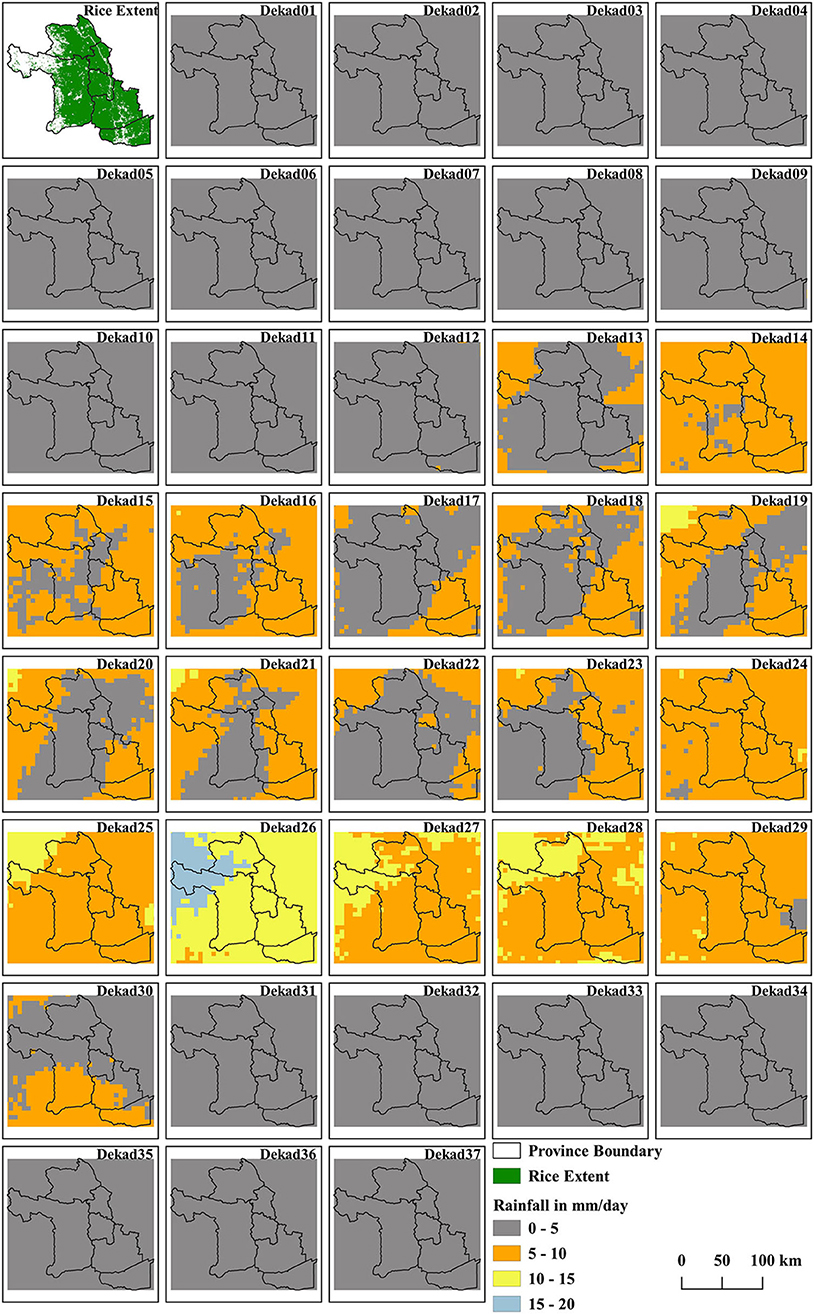
Figure 3. Eleven-years mean rainfall in the target area per dekad.
Data Set F: Soil Texture
We followed the definition of soil texture for each soil series in the soil database developed by the Land Development Department (LDD), Thailand (LDD, 2019). This database is also available as a geographic information system (GIS) shapefile that presents spatial and attribute records. The information in the database compiled various soil characteristics and properties, including soil texture, for about 300 soil series over the entire area of Thailand. With regard to our target area, soil texture data for 67 relevant soil series were used as input data.
Derived Data
For the calculation of water balance, potential evapotranspiration (Pot_ET) and potential percolation (Pot_Pc) are required as inputs. Data sets G (Pot_ET) and H (Pot_Pc) were derived from data sets D (temperature) and F (soil texture), respectively, which are termed here “derived data.”
Data Set G: Potential Evapotranspiration (Pot_ET)
One pathway of water loss from paddy fields is evapotranspiration. Here, Pot_ET was obtained by using the Hargreaves method (Hargreaves and Samani, 1985) which uses temperature and extra-terrestrial radiation for the calculation (Equation 1).
where 0.0023 is the Hargreaves coefficient, Ra is the extra-terrestrial radiation (MJ m−2 day−1), Tmean is the average temperature (°C), and TD is the daily temperature range (Tmax–Tmin in °C). Ra is computed using the approach of Allen et al. (1998) for each day of the year and for different latitudes (Equation 2).
where 0.408 is the inverse latent heat flux, Gsc is the solar constant, dr is the inverse relative distance between the sun and the earth, ωS is the sunset hour angle, ϕ is the latitude, and δ is the solar declination.
Pot_ET was measured for the period 2007–2017 and then displayed as data for spatial distribution for the 11-years mean Pot_ET per dekad as shown in Figure 4. In addition, the dekadal Pot_ET data of each year were used to analyze inter-annual variations of the suitability for AWD.
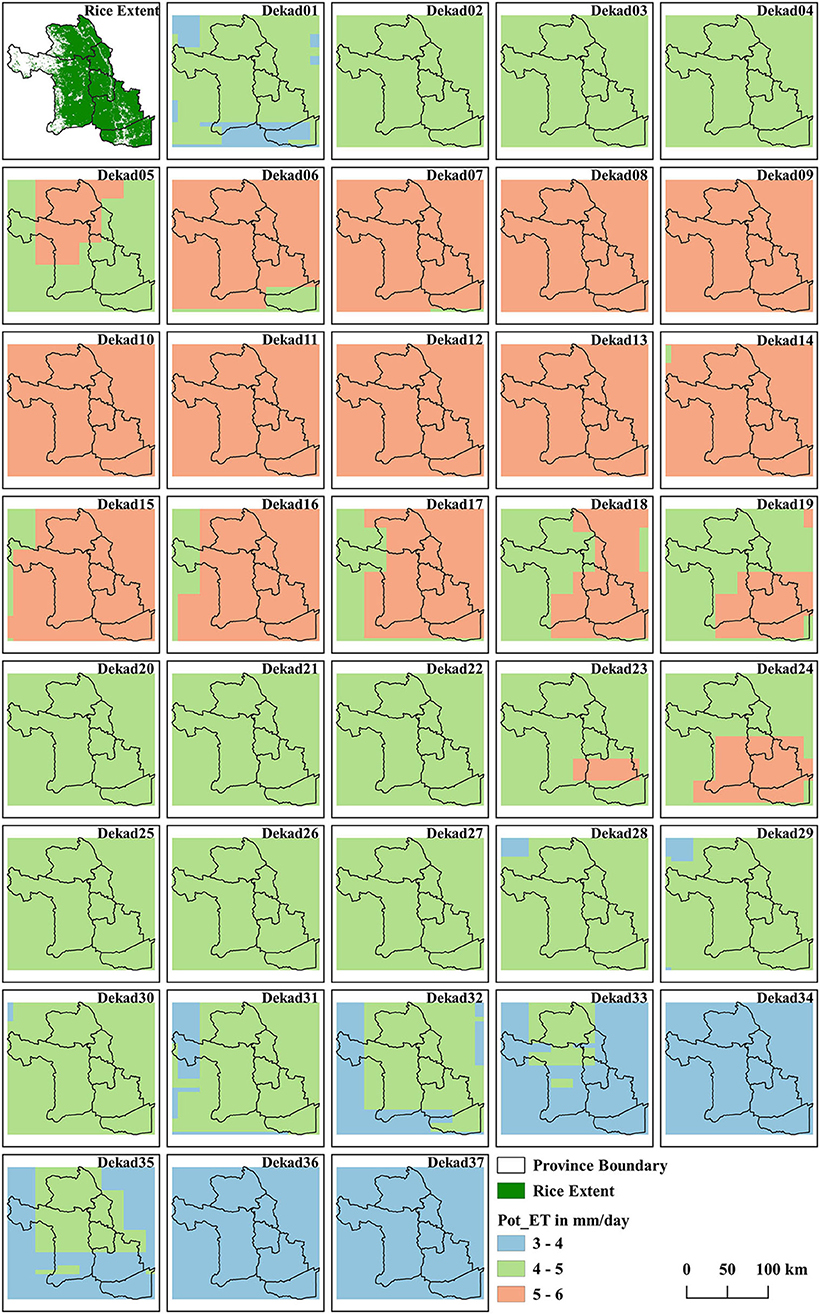
Figure 4. Eleven-years mean potential evapotranspiration (Pot_ET) in the target area per dekad.
Data Set H: Potential Percolation (Pot_Pc)
Percolation rates are influenced by the range of characteristics pertaining to the physical and hydraulic properties of the soil. Nevertheless, the impact of texture is still observable by the higher percolation rate in sandy soils than that in clay soils. The basic setting of the value of Pot_Pc rate for the individual soil series was assigned from the soil texture data (data set F) by following the method of Sander et al. (2017). In addition, for evaluating uncertainties resulting from the setting of the Pot_Pc rates, two additional rates—lower (50% smaller than the basic setting) and upper (50% larger than the basic setting) settings—were applied across all soil textures in the database, as shown in Table 3.
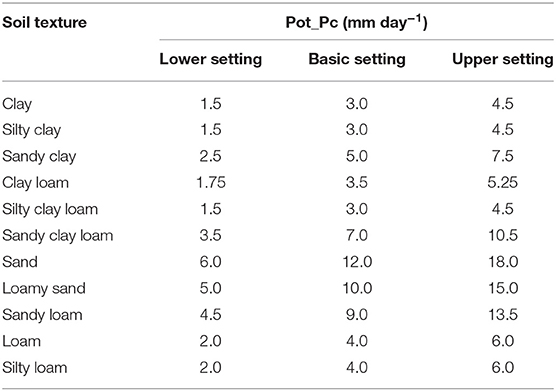
Table 3. Potential percolation rate (Pot_Pc) for rice soil related to soil texture.
The spatial data of the soil series were rasterized and interpreted with the Pot_Pc rate for each pixel in the target provinces. The Pot_Pc rate of each pixel is the weighted average of the Pot_Pc rates of its soil class composition. A total of 67 soil series were classified to 25 layers of Pot_Pc. Figure 5 shows the distribution of Pot_Pc rates at the basic setting for the six target provinces.
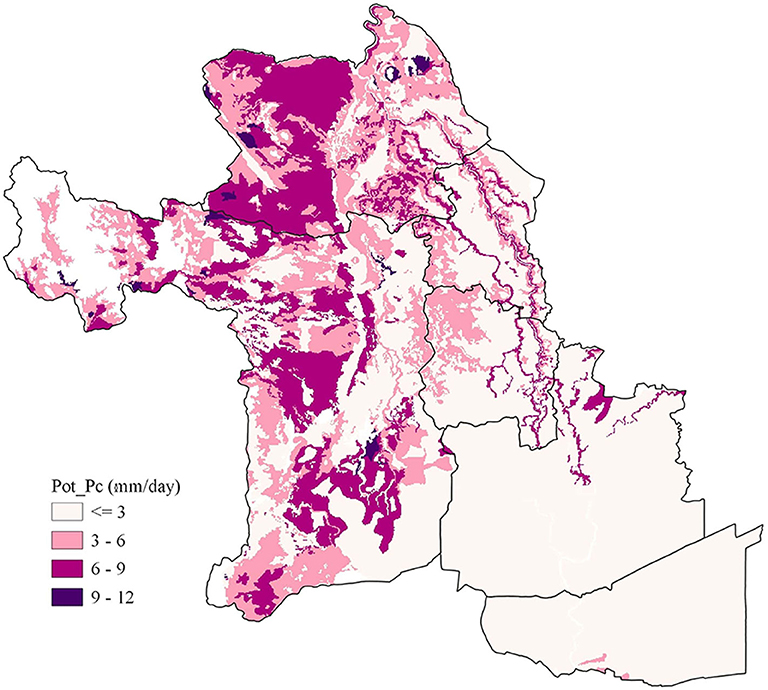
Figure 5. Spatial distribution of potential percolation rates (Pot_Pc) at basic setting in the target area.
Spatial Analysis
The four-step spatial analysis was carried out according to Nelson et al. (2015) to get the suitability maps for AWD. Since this was a spatial work, the following items were checked before evaluating procedures:
1. All layers should be in the same projection. This study used the World Geodetic System 1984 (WGS84).
2. All layers should be resampled to a uniform resolution. Resolution of the results was 0.002 degrees (224 meters).
Step 1. The provincial rice area per dekad (data sets A and B) was distributed to the physical rice extent pixels (data set C) on an equal area basis, resulting in 37 dekadal maps at 0.02 degrees (224 meters) resolution showing where rice is grown during which dekads.
Step 2. Data sets D–H were used to get the “water balance maps per dekad.” As mentioned, data sets G and H were derived from temperature and soil texture values, respectively. Pot_ET, Pot_Pc, and rainfall were displayed for analyzing in the same resolution at 0.02 degrees (224 m). This step compared the aggregate of Pot_ET and Pot_Pc with rainfall.
Step 3. Scoring maps per dekad were provided according to the results from step 2. If the pixel had more Pot_ET plus Pot_Pc than the amount of rainfall (Rf), it was recognized as the pixel of deficit (DEF) water balance. Whereas, if the pixel had less Pot_ET plus Pot_Pc than Rf, it was recognized as the pixel of excess (EXC) water balance:
Step 4. After step 3, the 37 dekadal maps were obtained. The suitability map was determined from the proportion of the DEF scored per rice season. The index for scoring from such proportions was set at 0–1, where 0 means no dekad was DEF and 1 means that it was DEF for all dekads. Classification of areas that showed low suitability, moderate suitability, and high suitability were ranked by scoring according to the index shown in Table 4. A sensitivity analysis was carried out to evaluate the uncertainty related to the setting of different “breakpoints.”
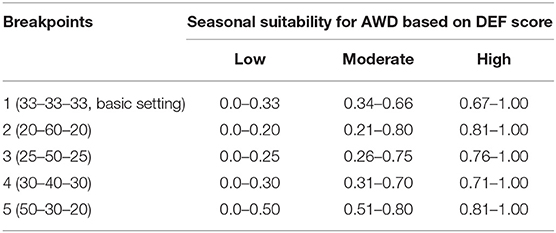
Table 4. Breakpoints for the DEF score index as used in the sensitivity analysis on low, moderate, and high suitability for AWD.
CH4 Emission Calculation
We estimated the potential of mitigating CH4 emissions by following the IPCC guidelines, using Tier 1 and Tier 2 approaches [IPCC (Intergovernmental Panel on Climate Change), 2019]. For calculating the adjusted daily emission factor for the baseline water management with continuous flooding (EFi−CF), the default baseline emission factor for Southeast Asia (EFc: 1.22 kg CH4 ha−1 day−1) was applied. For the scaling factors for organic amendment (SFo), the value of 1 was applied in the calculation of EFi-CF, according to the methodology used in the Third National Communication (TNC) of Thailand [ONREPP (Office of Natural Resources and Environmental Policy and Planning), 2018] with reference to the expert who calculated GHG emission inventories for rice cultivation in the TNC (personal communication: Prof. Patthra Pengthamkeerati, Kasetsart University). For the scaling factors for water regime before the cultivation period (SFp), the aggregated default value (SFp = 1.22) was applied. For calculating the adjusted daily emission factor for AWD water management (EFi−AWD), the scaling factors for multiple drainage water management in the wet season (SFw = 0.76) and the dry season (0.59) were applied to the major and second rice seasons, respectively, based on the result of the meta-analysis by Yagi et al. (2020), while the value of 1 was applied for the baseline water management with continuous flooding. For the cultivated period of rice, 120 and 122 days were applied for the major and second rice seasons, respectively, according to the information contained in the OAE report for the average growth period of major rice varieties planted [OAE (Office of Agricultural Economics), 2018].
Results and Discussion
Dekadal Scoring Maps for Water Balance
Using data sets A–H and processing steps 1–3, we developed dekadal scoring maps, which showed spatial and temporal patterns of water balance in the target provinces throughout the year by averaging the data of each year between 2007 and 2017 as shown in Figure 6. A total of 37 maps for each dekad depicted the pixels of water balance either as DEF or EXC criteria throughout 1 year. The results showed that most of the pixels in the target provinces had a water balance of DEF throughout the year due to a lower amount of rainfall than the sum of Pot_ET and Pot_Pc, except for periods with a higher level of rainfall. The pixels under the EXC criterium appeared at dekads 16, 21, and 23 (at the end of August to the middle of September) in Pathum Thani province where higher rainfall (more than 5 mm day−1, Figure 3) was recorded in the soil with relatively smaller Pot_Pc (<3 mm day−1, Figure 5). After that, EXC pixels extended to other provinces, in response to the increased rainfall until dekad 29 (mid of October). Then, water balance switched to DEF again in all six target provinces after dekad 30 (at the end of October). As a result, most of the pixels in the target provinces had the score of DEF for more than 30 dekads (300 days) per 1 year due to lower rainfall than the sum of Pot_ET and Pot_Pc.

Figure 6. Dekadal scoring maps for water balance.
Climatic Suitability Maps
The climatic suitability maps for AWD in the major and second rice seasons with basic settings for the suitability breakpoint are shown in Figure 7. In the major rice season (wet season, Figure 7A), a large extent of the target provinces was assessed to be highly suitable for AWD, while the rest was moderately suitable. The area of high suitability was extended to the whole of Ang Thong, Ayuthaya, Chai Nat, and Sing Buri provinces, most of Pathum Thani, and about half of Suphan Buri. In all target provinces, the areas assessed to have high and moderate suitability accounted for 470,000 ha and 113,000 ha, respectively, corresponding to 80.5 and 19.5% of the total area of rice harvested, respectively. There was no pixel assessed to have low suitability in the target provinces. The difference between the rice calendars of Suphan Buri and the other provinces increased the proportion of EXC scored dekads per rice season, resulting in the appearance of pixels assessed to have moderate suitability in Suphan Buri. In addition, the spatial distribution of soil with relatively smaller Pot_Pc (Figure 5) overlapped with pixels of moderate suitability pixels.
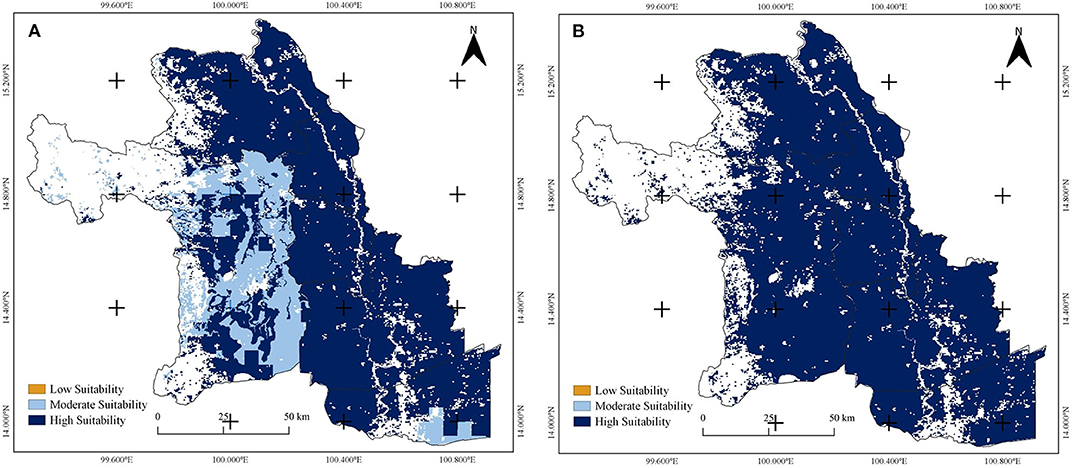
Figure 7. Suitability maps (basic setting on the suitability breakpoint) for the major (A) and second (B) rice seasons.
In contrast to the wet major rice season, the entire area of the target provinces was assessed to have high suitability for AWD in the second rice season (dry season, Figure 7B). This result was predominantly attributable to the relatively small amount of rainfall in the target areas during the season by the northeast monsoons.
According to the previous study for the Philippines (Sander et al., 2017), AWD suitability was mostly ranked as low for the wet season throughout the country; however some areas of moderate or high suitability were found on Mindanao island, the central Visayas, and in Bicol and Cagayan provinces in Luzon island. The authors explained those regional differences in suitability, particularly in the wet season, with differences in the amount of rainfall during the season. Here, in the target provinces of this study, most of the pixels had 11-years averaged dekadal rainfall of <15 mm day−1, even during the wet major rice season, except for only one dekad (dekad 26, Figure 3). This resulted in the dominance of DEF scores throughout the year and high AWD suitability for the whole target area.
Sensitivity Analysis
The results of the sensitivity analysis on soil percolation rates are shown in Figure 8, where we applied the basic setting of breakpoint for scoring AWD suitability (Table 4). Differences in the suitability appeared during the major rice season. The area assessed to have high suitability increased as Pot_Pc values increased. The sizes of areas of high suitability were 284,000, 470,000, and 582,000 ha for the lower, basic, and upper settings of Pot_Pc values, corresponding to 48.6, 80.5, and 99.7% of the total area, respectively. All or most of the areas were classified as suitable for AWD (moderate and high suitability) and only a small area (<2.4% of the total area) was classified to have low suitability in the case of the lower Pot_Pc rate setting. Hence, we conclude that a change in Pot_Pc rate settings for each soil texture (±50% from the basic setting) did not affect the results of this suitability assessment in the target provinces. However, it changed the distribution of moderate and high suitability areas to some extent. On the other hand, a change in Pot_Pc rate settings did not affect the suitability area during the second rice season since the entire area was classified as highly suitable for implementing AWD.
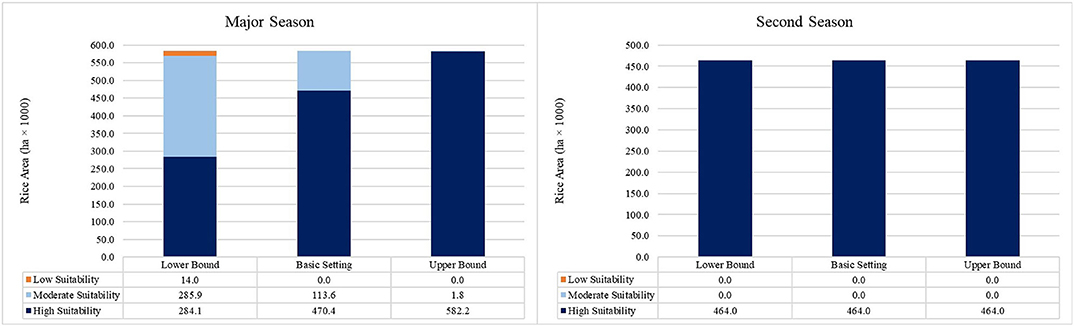
Figure 8. Sensitivity analyses on the settings of potential soil percolation rates (Pot_Pc) in the major and second rice seasons (the case for breakpoint 1).
The results of our sensitivity analysis on breakpoint settings for scoring AWD suitability are shown in Table 5. In the major rice season, the entire target area appeared to be suitable for AWD (moderate and high suitability). The area of high suitability decreased and that of moderate suitability increased once the breakpoint range of high suitability decreased and that of moderate suitability increased (breakpoints 1 4 3 2). The area of low suitability did not appear even with increasing the breakpoint range for low suitability up to 50% (breakpoint setting 5). The difference in the area of high suitability between breakpoints 1 and 2 was 306,000 ha, corresponding to 52.4% of the total rice area. Changing the breakpoint settings did not affect the suitability of the area during the second rice season since the entire area was classified to be highly suitable for implementing AWD.
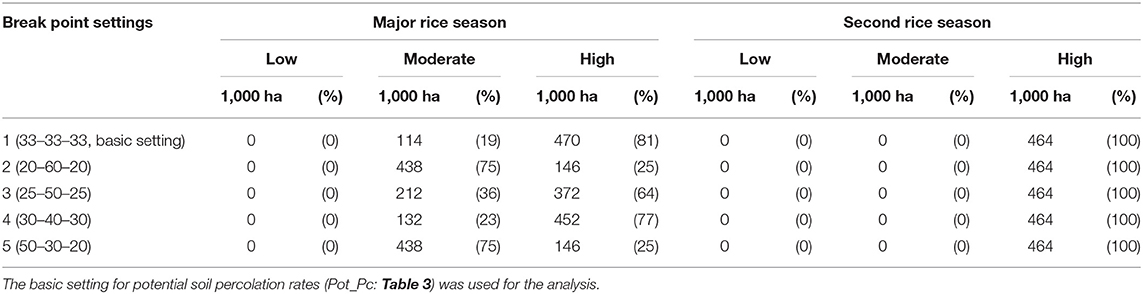
Table 5. Sensitivity analyses on the settings of breakpoints for the major and second seasons.
Inter-annual Variation of Suitability
The results of the AWD suitability assessment in the major rice season for each year between 2007 and 2017 are shown in Figure 9. Table 6 summarizes the statistics of the inter-annual variation, showing the average, standard deviation, maximum, and minimum values. The results indicated that the areas of different suitability classes varied in response to inter-annual climatic variability in the major rice season, but not in the second rice season. In the major rice season, some pixels with low suitability appeared in 2010 and 2011. Those exceptional years were characterized by high rainfall during the season, while moderate suitability areas appeared to be linked to relatively low Pot_Pc values. Larger extents of low and moderate suitability areas appeared in the years 2010 and 2017, while almost the entire target area was classified as high suitability in 2007 and 2015. The coefficients of variation (CVs) for the inter-annual variation were calculated to be 82.4% and 36.5% for the areas of moderate and high suitability, respectively.
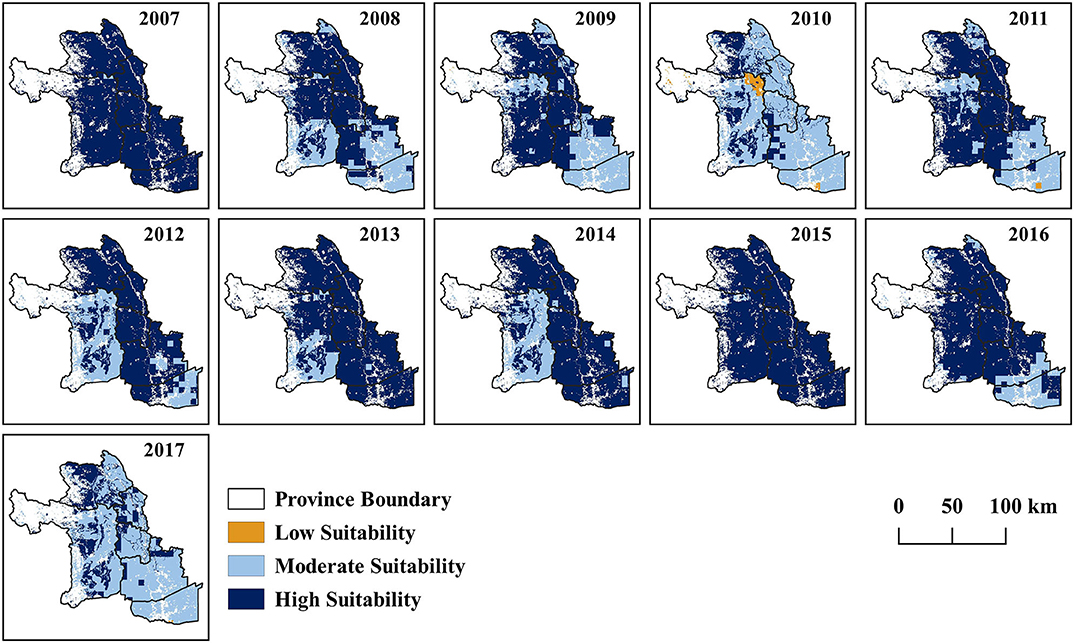
Figure 9. Inter-annual variation of AWD suitability in the major rice season. Colors for each suitability score are same as Figures 7, 8.
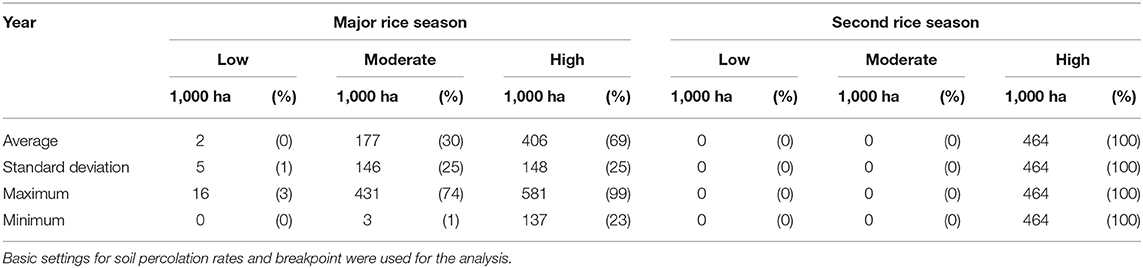
Table 6. Statistical summary of the inter-annual variation of AWD suitability assessment.
CH4 Emission Mitigation
We calculate the potential for CH4 emission mitigation by assuming that all irrigated rice areas were continuously flooded (baseline scenario) and AWD was applied to areas of high and moderate suitability (AWD adoption scenario). Estimates for emissions of CH4 are given for the basic settings of soil percolation rates and breakpoint ranges in Table 7. The results showed that higher CH4 emissions during the major rice season were due to a larger rice area and higher seasonal EF.
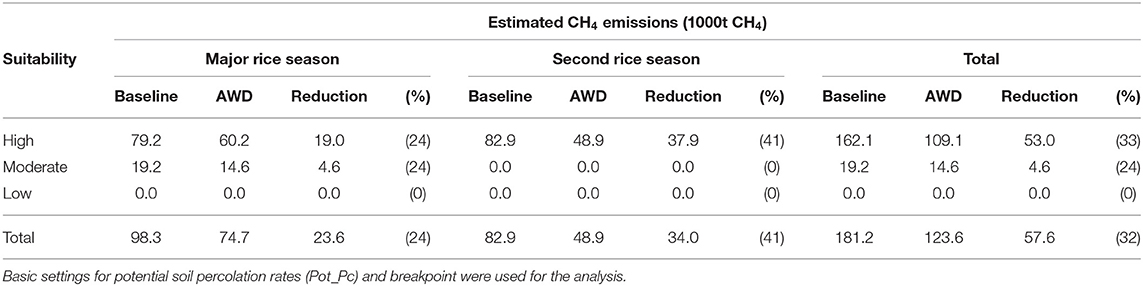
Table 7. Estimated CH4 emissions in the baseline and AWD adoption scenarios.
Under the AWD adoption scenario, CH4 emissions were reduced by 24 and 41% in the major and second rice seasons, respectively, compared with those in the baseline scenario. Totally, annual emissions were reduced by 32%. As a result, the potential of seasonal CH4 emission reduction was estimated to be 34,000 and 23,600 t CH4 for the major and second rice seasons, respectively. Hence, we estimated that the six target provinces in the central plain of Thailand have the potential for reducing annual CH4 emissions by 57,600 t CH4 year−1 if they implemented AWD water management in paddy fields. This emission reduction is equivalent to 1.61 Mt CO2-eq year−1, assuming the global warming potential (GWP) of CH4 to be 28.
As a party to the Paris Agreement for mitigating climate change, Thailand has submitted its nationally appropriate mitigation actions (NAMA) in 2014 and the nationally determined contribution (NDC) in 2015, aiming ambitiously to reduce its GHG emissions by 20–25% from the projected business as usual level by 2030 [ONREPP (Office of Natural Resources and Environmental Policy and Planning), 2018]. To ensure the continuity in the mitigation actions from NAMA to NDC, Thailand approved the NDC roadmap on mitigation (2021–2030) in May 2017. One of the on-going activities in the roadmap is the Thai Rice NAMA project that aims at supporting farmers to switch to low-emission farming systems (including the implementation of AWD in the six target provinces included in this study) and estimates the potential emission reduction of 1.664 Mt CO2-eq cumulative over the 5-years lifespan of the project (NAMA Facility, 2020). The potential of CH4 emission reduction estimated in this study supports the feasibility of the Thai Rice NAMA project.
Limitations and Outlook
In line with the objectives described above, our study applies the methodology used for the Philippines to assess the climate-based suitability for AWD in paddy fields of Thailand. Therefore, the study may have inherent limitations and possible biases in its assessment results as discussed previously (Nelson et al., 2015; Sander et al., 2017).
One critical factor is the uncertainty in the water balance model resulting from the presence of a compacted “hard-pan” in the sub-surface layer of paddy soils caused by the long-term cultivation of crops. As the sensitivity analysis on Pot_Pc values indicated, ±50 percent changes in the values influenced the distribution of moderate and high suitability areas to some extent. It is necessary for reducing this uncertainty to compile and validate the monitoring data for soil percolation rates in the target area. Possible flood events are another influencing factor, particularly to the target areas in this study. According to the Office of Natural Calamity and Agricultural Risk Prevention of the LDD, Thailand, most of the target areas in this study had repeated flood events of more than three times during the year between 2009 and 2018 [LDD (Land Development Department), 2016]. Such flood events usually occur in the wet major rice season, but big ones such as the case in 2011 may prevent drainage of paddy fields even in the following second rice season.
Another important related aspect appears to be the structure of the irrigation system itself; in particular, the elevation of rice fields relative to the main irrigation canal or within the surrounding terrain. A previous study in Vietnam highlighted that higher-lying paddy fields tend to dry up earlier than lower-lying fields, influencing the suitability for AWD (Yamaguchi et al., 2017). Recent field observations by the Thai Rice NAMA Project in the target provinces of this study appear to confirm these observations: flooding of paddy fields during the wet season of 2019 could have been well-managed and AWD could have been applied if the rice field was located well above the level of the irrigation canal (Atthawit Watcharapongchai, personal observation). Preliminary analysis of CH4 emissions of demo and control plots in all target provinces suggested that AWD shows good potential for emission reduction in the wet season (T.J., unpublished results). In view of these observations, the information obtained by the climatic suitability assessment could be especially useful for water management practitioners and irrigation authorities and for the future improvement of the water management system.
Socioeconomic factors for the adoption of water management by farmers may influence the suitability for AWD significantly, as shown by this study which made the assessment based on natural factors that influence the water balance of paddy fields. Water management options by farmers within a wider irrigation system are characterized by the physical separation of adopter and benefiter as pointed out by Sander et al. (2015). Also, the option for AWD is not attractive for farmers who pay a fixed irrigation fee for each season. On the other hand, the result of the suitability assessment in this study can be used for changing rice cultivation management systems to promote effective AWD. As indicated, the number of dekads in the DEF and EXC criteria in a rice cultivation season affected the climatic suitability for AWD. Therefore, if farmers choose the period of rice planting to avoid the DEF periods, for example, earlier major rice planting in Suphan Buri province, they would have more chances to implement AWD in their rice fields. The water balance maps can help farmers to decide whether or not to implement AWD with the support of extension services and when and where to disseminate water-saving technologies.
Regarding the potential of GHG emission reduction, this study focused only on CH4, because it is the dominant GHG that contributes to the net global warming potential (GWP) emitted from paddy fields. However, it is pointed out that the drainage of paddy fields may promote nitrous oxide (N2O) emissions. This increase, however, only offsets a small amount of the reduction in CH4 (Akiyama et al., 2005; Sander et al., 2015, 2020). Nevertheless, the change of N2O emissions by applying AWD should be additionally considered for an overall assessment of GHG emission reduction, although its contribution to net GWP is much smaller and more variable than that of CH4 (Yagi et al., 2020).
It is also noted that AWD and other water management options can be combined with other GHG mitigation options for enhancing GHG emission reduction. As indicated by Yagi et al. (2020), some other options like the application of biochar and sulfate-containing fertilizer can reduce GHG emissions while increasing yield in some rice-growing areas in Southeast Asia. These options can be applied to rice cultivation in the target provinces together with AWD. Another effective option is soil drying in the fallow season (Sander et al., 2014) which would be promising by using the dekadal scoring maps for water balance (Figure 6) for the decision of the timing of soil drying before starting rice cultivation.
Because this study focused on six adjacent provinces in the central plain, spatial differences in the climatic suitability for AWD among the provinces were not much significant. However, the climatic suitability and resulting estimates for the potential of CH4 reduction may have a larger effect in other regions of Thailand due to the differences in climate and soil properties among the regions. Therefore, it is encouraged to extend the assessment made by this study over the country to help in formulating national policies for climate change actions.
Conclusions
This is the first GIS-based study on the mitigation potential of a technology that has been assessed and quantified with regards to GHG emissions in rice cultivation in Thailand. The results of this suitability assessment may guide future research into other aspects of AWD suitability or provide useful technical information for practitioners of water management. We hope to inform the dissemination process of AWD and other forms of water-saving techniques in the region in pursuit of switching to low-emission rice farming. Finally, the methodologies presented here could be applied to other regions of Thailand to help in formulating national policies for reducing CH4 emissions and other climate change actions.
Data Availability Statement
All datasets generated for this study are included in the article/supplementary material.
Author Contributions
KY, RW, AC, and ST designed the research. PP and JA conducted GIS analysis. PP, KY, JA, BS, RW, and CB interpreted GIS analysis. PP and KY had primary responsibility for writing the paper, with significant contributions to the Results and Discussion section from BS, RW, TJ, and AC. All authors reviewed and approved the final manuscript.
Funding
This study was funded by the Petchra Pra Jom Klao Research Scholarship from the King Mongkut's University of Technology Thonburi (KMUTT). The positions of JA, RW, and BS at IRRI were supported by the Climate and Clean Air Coalition (CCAC) [contract number: DTIE14-EN040], the Thai Rice NAMA project funded by the NAMA Facility through GIZ [contract number: 81239834], and the CGIAR Research Program on Climate Change, Agriculture and Food Security which is carried out with support from CGIAR Trust Fund Donors and through bilateral funding agreements. For details please visit https://ccafs.cgiar.org/donors. The views expressed in this document cannot be taken to reflect the official opinions of these organizations.
Conflict of Interest
The authors declare that the research was conducted in the absence of any commercial or financial relationships that could be construed as a potential conflict of interest.
Acknowledgments
We thank Mr. Sanwit Iabchoon and Mr. Kanoksuk Chankon of the KMUTT Geospatial Engineering and Innovation Center (KGEO) team for supporting meteorological station data and others GIS database, and Prof. Patthra Pengthamkeerati of Kasetsart University for the advice on calculating CH4 emissions.
References
Akiyama, H., Yagi, K., and Yan., X. (2005). Direct N2O Emission from rice paddy fields: summary of available data. Global Biogeochem. Cycles 19:GB1005. doi: 10.1029/2004GB002378
Allen, R., Pereira, L. S., Raes, D., and Smith, M. (1998). Crop Evapotranspiration: Guidelines For Computing Crop Requirements. Irrigation and Drainage Paper No. 56. Rome: FAO.
Bouman, B. A., Lampayan, R. M., and Tuong, T. P. (2007). “Water management in irrigated rice: coping with water scarcity,” in International Rice Research Institute (Los Banos, Philippines).
Dobermann, A., and Fairhurst, T. H. (2000). Rice: Nutrient Disorders & Nutrient Management, Handbook Series. Potash & Phosphate Institute, Potash & Phosphate Institute of Canada, and International Rice Research Institute (Singapore: PPI), 191.
Funk, C., Peterson, P., Landsfeld, M., Pedreros, D., Verdin, J., Shukla, S., et al. (2015). The climate hazards infrared precipitation with stations—a new environmental record for monitoring extremes. Sci. Data 2:150066. doi: 10.1038/sdata.2015.66
Hargreaves, G. H., and Samani, Z. A. (1985). Reference crop evapotranspiration from temperature. Appl. Eng. Agric. 1, 96–99. doi: 10.13031/2013.26773
IPCC (Intergovernmental Panel on Climate Change) (2019). “2019 refinement to the 2006 IPCC guidelines for national greenhouse gas inventories,” eds E. Calvo Buendia, K. Tanabe, A. Kranjc, J. Baasansuren, M. Fukuda, S. Ngarize (Switerland: IPCC).
Itoh, M., Sudo, S., Mori, S., Saito, H., Yoshida, T., Shiratori, Y., et al. (2011). Mitigation of methane emissions from paddy fields by prolonging midseason drainage. Agric. Ecosyst. Environ. 141, 359–372. doi: 10.1016/j.agee.2011.03.019
Jiang, Y., Carrijo, D., Huang, S., Chen, J., Balaine, N., Zhang, W., et al. (2019). Water management to mitigate the global warming potential of rice systems: a global meta-analysis. Field Crops Res. 234, 47–54. doi: 10.1016/j.fcr.2019.02.010
Laborte, A. G., Gutierrez, M. A., Balanza, J. G., Saito, K., Zwart, S. J., Boschetti, M., et al. (2017). RiceAtlas, a spatial database of global rice calendars and production. Sci. Data 4:170074. doi: 10.1038/sdata.2017.74
Lampayan, R. M., Rejesus, R. M., Singleton, G. R., and Bouman, B. A. M. (2015). Adoption and economics of alternate wetting and drying water management for irrigated lowland rice. Field Crop Res. 170, 95–108. doi: 10.1016/j.fcr.2014.10.013
LDD (Land Development Department) (2019). Characterization of Established Soil Series of Thailand Reclassified According to Soil Taxonomy 2003 (Bangkok, Thailand: LDD).
LDD (Land Development Department) (2016). “The repeated flood areas in the central region,” in The Land Management Planning Group in Agricultural Risk Areas, Division of Land Policy and Planning. (Bangkok, Thailand: LDD).
Ministry of Natural Resources and Environment (2017). “The second biennial updated report of Viet Nam to the United Nations framework convention on climate change,” in Viet Nam Publishing House of Natural Resources, Environment and Cartography (Hanoi, Vietnam), 150.
NAMA Facility (2020). Available online at: https://www.nama-facility.org/projects/thailand-thai-rice-nama/ (accessed June 24, 2020).
Nelson, A., and Gumma, M. K. (2015). A Map of Lowland Rice Extent in the Major Rice Growing Countries of Asia. Available online at: http://irri.org/our-work/research/policy-and-markets/mapping (accessed June 24, 2020).
Nelson, A., Wassmann, R., Sander, B. O., and Palao, L. K. (2015). Climate-determined suitability of the water saving technology “alternate wetting and drying” in rice systems: a scalable methodology demonstrated for a province in the Philippines. PLoS ONE 10:e0145268. doi: 10.1371/journal.pone.0145268
NOAA (National Oceanic and Atmospheric Administration) (2019). EXPLORE. Global Surface Summary of the Day—GSOD. Available online at: https://data.nodc.noaa.gov/cgi-bin/iso?id=gov.noaa.ncdc:C00516 (accessed June 24, 2020).
OAE (Office of Agricultural Economics) (2018). “Agricultural statistics of Thailand,” in Office of Agricultural Economics, Ministry of Agriculture and Cooperatives (Bangkok, Thailand), 186.
ONREPP (Office of Natural Resources and Environmental Policy and Planning) (2017). “Second biennial update report of Thailand,” in Ministry of Natural Resources and Environment (Bangkok, Thailand), 73.
ONREPP (Office of Natural Resources and Environmental Policy and Planning) (2018). “Thailand's Third National Communication (TNC) to the United Nations framework convention on climate change,” in Ministry of Natural Resources and Environment (Bangkok, Thailand), 162.
Redfern, S. K., Azzu, N., and Binamira, J. S. (2012). “Rice in Southeast Asia: facing risks and vulnerabilities to respond to climate change,” in Building Resilience for Adaptation to Climate Change in the Agriculture Sector, eds A. Meybeck, J. Lankoski, S. Redfern, N. Azzu, and V. Gitz (Rome: FAO), 295–341.
Republic of Indonesia (2017). “Indonesia Third National communication under the United Nations framework convention on climate change,” in Directorate General of Climate Change, Ministry of Agriculture and Forestry, Republic of Indonesia (Jakarta, Indonesia), 219.
Romasanta, R., Gaihre, Y., Wassman, R., Quilty, J., Nguyen, V. H., Castalone, A. G., et al. (2017). How does burning of rice straw affect CH4 and N2O emissions? A comparative experiment of different on-field straw management practices. Agric. Ecosyst Environ. 239, 143–153. doi: 10.1016/j.agee.2016.12.042
Sander, B. O., Samson, M., and Buresh, R. J. (2014). Methane and nitrous oxide emissions from flooded rice fields as affected by water and straw management between rice crops. Geoderma 235:355–362. doi: 10.1016/j.geoderma.2014.07.020
Sander, B. O., Schneider, P., Romasanta, R. R., Samoy-Pascual, K., Sibayan, E. B., Asis, C. A., et al. (2020). Potential of alternate wetting and drying irrigation practices for the mitigation of GHG emissions from rice fields: two cases in Central Luzon (Philippines). Agriculture 10:350. doi: 10.3390/agriculture10080350
Sander, B. O., Wassmann, R., Palao, L. K., and Nelson, A. (2017). Climate-based suitability assessment for alternate wetting and drying water management in the Philippines: a novel approach for mapping methane mitigation potential in rice production. Carbon Manag. 8, 331–342. doi: 10.1080/17583004.2017.1362945
Sander, B. O., Wassmann, R., and Siopongco, J. D. L. C. (2015). “Mitigating greenhouse gas emissions from rice production through water-saving techniques: potential, adoption and empirical evidence,” in Climate Change and Agricultural Water Management in Developing Countries, ed. C. T. Hoanh, V. Smakhtin, and T. Johnston (Wallingford, CT: CABI Climate Change Series, CABI Publishing), 193–207. doi: 10.1079/9781780643663.0193
Smith, P., Bustamante, M., Ahammad, H., Clark, H., Dong, H., Elsiddig, E. A., et al. (2014). “Agriculture, Forestry and Other Land Use (AFOLU),” in Climate Change 2014: Mitigation of Climate Change. Contribution of Working Group III to the Fifth Assessment Report of the Intergovernmental Panel on Climate Change, eds O. Edenhofer, R. Pichs-Madruga, Y. Sokona, E. Farahani, S. Kadner, K. Seyboth, A. Adler, I. Baum, S. Brunner, P. Eickemeier, B. Kriemann, J. Savolainen, S. Schlömer, C. von Stechow, T. Zwickel, and J. C. Minx (Cambridge, UK; New York, NY: Cambridge University Press).
Thai Meteorological Department (2020). The Climate of Thailand. Available online at: https://www.tmd.go.th/en/archive/thailand_climate.pdf (accessed May 23, 2020).
Thakur, A. K., Uphoff, N. T., and Stoop, W. A. (2016). Scientific underpinnings of the System of Rice Intensification (SRI): what is known so far? Adv. Agron. 135, 147–179. doi: 10.1016/bs.agron.2015.09.004
Wassmann, R., Lantin, R. S., Neue, H. U., Buendia, L. V., Corton, T. M., and Lu, Y. (2000). Characterization of methane emissions from rice fields in Asia. III. mitigation options and future research needs. Nutr. Cyc. Agroecosys. 58, 23–36. doi: 10.1023/A:1009874014903
Xiao, X., Boles, S., Frolking, S., Li, C., Babu, J. Y., Salas, W., et al. (2006). Mapping paddy rice agriculture in South and Southeast Asia using multi-temporal MODIS images. Remote Sens Environ. 100, 95–113. doi: 10.1016/j.rse.2005.10.004
Yagi, K., Sriphirom, P., Cha-un, N., Fusuwankaya, K., Chidthaisong, A., Damen, B., et al. (2020). Potential and promisingness of technical options for mitigating greenhouse gas emissions from rice cultivation in Southeast Asian countries. Soil Sci. Plant Nutr. 66, 37–49. doi: 10.1080/00380768.2019.1683890
Keywords: rice, methane emissions, GIS, alternate wetting and drying, mitigation measures, low-emission farming
Citation: Prangbang P, Yagi K, Aunario JKS, Sander BO, Wassmann R, Jäkel T, Buddaboon C, Chidthaisong A and Towprayoon S (2020) Climate-Based Suitability Assessment for Methane Mitigation by Water Saving Technology in Paddy Fields of the Central Plain of Thailand. Front. Sustain. Food Syst. 4:575823. doi: 10.3389/fsufs.2020.575823
Received: 24 June 2020; Accepted: 25 August 2020;
Published: 02 November 2020.
Edited by:
Matthew Tom Harrison, University of Tasmania, AustraliaReviewed by:
Lijun Liu, Yangzhou University, ChinaSang Yoon Kim, Sunchon National University, South Korea
Copyright © 2020 Prangbang, Yagi, Aunario, Sander, Wassmann, Jäkel, Buddaboon, Chidthaisong and Towprayoon. This is an open-access article distributed under the terms of the Creative Commons Attribution License (CC BY). The use, distribution or reproduction in other forums is permitted, provided the original author(s) and the copyright owner(s) are credited and that the original publication in this journal is cited, in accordance with accepted academic practice. No use, distribution or reproduction is permitted which does not comply with these terms.
*Correspondence: Kazuyuki Yagi, eWFnaWhvbWVAbWFpbDIuYWNjc25ldC5uZS5qcA==