 Hardeep Singh
 Tanka P. Kandel
 Prasanna H. Gowda3
 Brian K. Northup
 Vijaya G. Kakani
- 1Department of Plant and Soil Sciences, Oklahoma State University, Stillwater, OK, United States
- 2Noble Research Institute, LLC, Ardmore, OK, United States
- 3United States Department of Agriculture-Agricultural Research Service Southeast Area, Stoneville, MS, United States
- 4United States Department of Agriculture-Agricultural Research Service Grazinglands Research Laboratory, El Reno, OK, United States
Grass pea (Lathyrus sphaericus) and oat (Avena sativa) are potential cover crops for spring periods of summer crop systems in the US Southern Great Plains (SGP). The main objective of this study was to compare nitrous oxide (N2O) emissions from residues of grass pea and oat grown as green nitrogen (N) crops. The comparisons included responses from plots cultivated with oat, grass pea, and control (spring-fallowed) plots. Two management options were applied to grass pea: residues retained and aboveground biomass removed for forage. Crabgrass (Digitaria sanguinalis) was cultivated as a main summer crop immediately after termination of the cover crops. Fluxes of N2O were measured by closed chamber connected to a portable gas analyzer on 23 dates during a 3 month growing period for crabgrass. At termination, oat produced more aboveground biomass than grass pea (2.17 vs. 3.56 Mg ha−1), but total N in biomass was similar (102–104 kg ha−1) due to greater N concentrations in grass pea than oat (4.80% vs. 2.86% of dry mass). Three month cumulative emissions of N2O from grass pea-incorporated plots (0.76 ± 0.11 kg N2O-N ha−1; mean ± standard error, n = 3) were significantly lower than from oat-incorporated plots (1.26 ± 0.14 kg N2O-N ha−1). Emissions from grass pea plots with harvested biomass (0.48 ± 0.04 kg N2O-N ha−1) were significantly lower than those from grass pea-incorporated plots. Cumulative N2O emissions from control plots were significantly greater than those from grass pea-harvested plots but were similar to the emissions from grass pea-incorporated plots. Yields produced by crabgrass were similar from all cover crop treatments (8.65–10.46 Mg ha−1), but yield responses to the control (18.53 Mg ha−1) were significantly larger. Nitrogen concentrations in crabgrass were greater in response to oat- and grass pea-incorporated plots (2.86–2.87%) than in grass pea-harvested (1.93%) and control (1.44%) plots. In conclusion, the results indicated that (i) post-incorporation emissions of N2O can be greater from a non-legume green N crop than a legume green N crop due to greater biomass productivity of the cereal, and (ii) emissions of N2O could be mitigated by removing biomass of the green N crop for use as forage.
Introduction
Interest in including cover crops in production systems used in the US Southern Great Plains (SGP) has been increasing. Cover crops are seen to provide a number of environmental services, including reducing soil erosion, improving soil aggregation and infiltration, suppressing weeds, increasing the pool of nitrogen (N) in soils, reducing leaching and runoff, and increasing soil organic matter (Snapp et al., 2005; Foster et al., 2017). The predominant cropping systems used by producers in the SGP are different forms of winter wheat–summer fallow rotations and are generally applied in continuous rotations (Decker et al., 2009). However, warm-season crop–winter fallow rotations are also utilized in some years to increase income (Decker et al., 2009; Aiken et al., 2013). The warm-season–winter fallow systems can be used to cultivate cool-season legumes or grasses with short growing seasons (generally spanning March–May) as cover crops or green N sources to support a summer cash crop (Biederbeck et al., 1993; Singh et al., 2019a).
A major issue with growing green N crops to support subsequent cash crops is depletion of available soil moisture by the green N crops (Nielsen et al., 2015). Precipitation in the SGP is extremely erratic in terms of timing and amounts received (Singh et al., 2019b). Further, irrigation is limited to a small amount of the total land area of the SGP. Therefore, the selected N crop should not excessively deplete soil moisture, as this water use could reduce yield of following cash crops, such as corn (Zea mays), sorghum (Sorghum bicolor), or annual forage grasses (Singh et al., 2019b). Given the limitations of available water in rainfed systems, spring-planted crops with short growing seasons have potential as cover or green N crops within summer cropping systems of the SGP. Among the candidates are grass pea (Lathyrus sphaericus), a grain legume, and oat (Avena sativa), a cereal grass. Rao et al. (2005, 2007) reported grass pea as an adaptable crop suited to the dry conditions in the SGP. Legume-based cover crops can fix atmospheric N and serve as a N sources for following summer crops. However, both legume and non-legume species can contribute to increased N in soil pools by reducing losses through leaching, runoff, and gaseous emissions (White et al., 2017).
One key aspect for the success of cover crops grown as nutrient sources for following crops is the synchronization between nutrient mineralization from decomposing residues and the demand for nutrients by the following recipient crops (Myers et al., 1994; Kandel et al., 2019a,b). Due to short growing seasons, spring-planted cover crops have low carbon (C)/N ratios at termination as compared to fall-planted cover crops with long growing seasons. These low C/N ratios may result in rapid biomass decomposition and N mineralization after termination (Kandel et al., 2019b). However, rapid decomposition and N mineralization from residues of cover crops prior to establishment of the following crop may contribute to large losses of N as emissions of nitrous oxide (N2O), a highly potent greenhouse gas (Huang et al., 2004; Basche et al., 2014; Kandel et al., 2018). Heavy or frequent rainfall events are common during the late spring in the US SGP, which is also the termination period of spring-planted cover crops. Such simultaneous increases in soil concentrations of mineral N and moisture after termination of cover crops could be conducive for denitrification, a major microbial pathway for N2O production (Kandel et al., 2018). Therefore, a better understanding of how interactions between types of cover crops and their management, combined with patterns of precipitation during spring, impact N2O emissions from decomposing biomass of cover crops is important to defining N losses to the atmosphere (Hoorman et al., 2009).
Nitrogen mineralization from decomposing biomass and resulting soil N2O emissions can be influenced by the type of the cover crop (Basche et al., 2014). Legume cover crops in general contribute greater N2O emissions compared to non-legumes due to increased pools of N from biological fixation (Baggs et al., 2000). Additionally, legume biomass generally has low C/N ratios, decompose rapidly, and deplete soil O2 concentrations during decomposition, a condition conducive to denitrification (Aulakh et al., 1991; Thilakarathna et al., 2016). However, since spring-planted cereals used as cover crops are generally terminated before flowering, and C/N ratios and lignin concentrations can be low enough for rapid decomposition, thereby resulting in high N2O emissions.
One potential strategy recommended for limiting N2O emissions from residues of cover crops is removal of aboveground biomass as forage, instead of incorporating into the soil as N sources (Li et al., 2015; Kandel et al., 2019a). Beef cattle are a major agricultural commodity in the US SGP, so harvesting biomass for forage could be profitable by lowering risks of forage shortages in dry years, which are common in the region (Holman et al., 2018). However, biomass removal will also result in the removal of the major portion of biomass (Biederbeck et al., 1993; Kandel et al., 2019b). Therefore, biomass removal of cover crops may impact the growth of following crops due to reduced N supply, if N is not supplied from external sources (Kandel et al., 2019a).
Although interest in cover crops is increasing in the US SGP, there is limited information on influences of the residues of type of cover crops on N2O fluxes after termination of the cover crops. Additionally, although large fluxes of N2O after termination of legume-based cover crops have been reported (Kandel et al., 2018), there is limited information on how to mitigate post-incorporation soil N2O emissions from residues of cover crops through management strategies. Therefore, we tested influences of type of cover crop (legume vs. cereal) and a management strategy (incorporation vs. harvest) for legume residues on post-incorporation fluxes of N2O. The objective of this study was to compare post-incorporation emissions of soil N2O from residues of spring-grown legume (grass pea) and non-legume (oat) cover crops within a summer-based system of forage production in the US SGP. We hypothesized that (i) emissions of N2O would be lower from decomposing oat residue than grass pea residue, and (ii) emissions of N2O could be mitigated by harvesting legume biomass for forage, compared to incorporating the biomass to supply N to following forage grass.
Materials and Methods
Experimental Site and Soil Properties
This field study was conducted at the USDA-ARS Grazinglands Research Laboratory near El Reno, OK, USA (35°34′21″ N, 98°02′12″ W; 411 m elevation). The study was conducted during the March–August time period of 2018 and included growth periods of both spring green N and recipient summer hay crops. The study site was situated on an upper terrace of the bottomland area of the North Canadian River drainage basin (Goodman, 1977). The soils for the site were classified as Brewer silty clay loams (fine, mixed, superactive, thermic Udertic Argiustolls). The top soils had average pH of 6.9 and bulk density of 1.35 Mg m−3. Brewer series are among the most fertile soils in the Canadian River basin. Average soil organic C and N contents of the sites were 1.31 and 0.10%, respectively (USDA-NRCS, 1999). The topsoil (0–0.15 m) had particle fractions of 18% sand, 52% silt, and 30% clay.
Experimental Design and Crop Management
The experiment consisted of 12 plots (4 m × 3 m) arranged in a completely randomized design. Grass pea was planted on six plots, and oat was planted on three plots on March 10, while three plots were left fallow during spring as a control treatment. Three oat and grass pea plots were terminated by tillage (disked once to ~10 cm depth and roto-tilled once) on May 18 to incorporate biomass of green N crops. Grass pea biomass from the remaining three plots was harvested manually on the same day. Grass pea in these plots was harvested to 1.0 cm aboveground, and only the roots were incorporated. Crabgrass was then planted on all plots at a rate of 5 kg ha−1 at 0.03-m-spaced rows on May 19.
A long dry spell (>1 month) started 7 days after crabgrass was sown. This dry period restricted the growth of crabgrass, and plants showed severe symptoms of water shortage. Therefore, the plots were irrigated with 30-mm water on days 23 and 64 after termination of cover crops. The entire area of the plots, except that covered by collars placed to measure N2O fluxes (described in the following section), was irrigated with a sprinkler system. Irrigation inside collars was subsequently applied using a watering can for application of precise amounts of water.
Measurements of Yield and Quality of Cover Crop Biomass
Total aboveground biomass of grass pea was determined by harvesting all biomass from the 12 m2 areas of plots (n = 3) assigned to harvest treatments. Biomass produced by oat was determined by harvesting biomass from 1 m2 areas of each plot (n = 3). Samples of root biomass of oat and grass pea were collected by shovel to a depth of 15 cm from the sampled areas of plots, and the soil was cleaned manually by washing samples through a 2.0 mm sieve under running water. Biomass samples (roots and shoots) from both green manures were oven-dried at 60°C to constant weight in a forced draft oven to determine the amount of dry matter. The major portion of dried biomass (except small subsamples retained for chemical analysis) was returned to the same 1 m2 sampled areas after determination of biomass productivity. The 1 m2 areas where biomass was sampled for productivity and quality were not used for measurement of gas fluxes, soil properties, or biomass productivity of the following summer crop. Samples used in chemical analysis were ground through a 1-mm screen by Wiley mill for analyses.
Biomass samples were analyzed for total C, N, and cell wall components (cellulose, hemicellulose, and lignin). Concentrations of C and N were assayed by flash combustion (900°C for 10 min) method (Model VarioMacro, Elementar Americas, Inc., Mt. Laurel, NJ, USA). Neutral detergent fiber (NDF), acid detergent fiber (ADF), and acid detergent lignin (ADL) were determined by the Van Soest and Wine (1967) method. Concentrations of cellulose were calculated as the difference between ADF and ADL and hemicellulose as the difference between NDF and ADF. The ADL fraction was presented as lignin concentration.
Gas Flux Measurements
N2O and carbon dioxide (CO2) fluxes were measured on 23 dates at irregular intervals using a closed chamber system during May 19 to August 16, 2018. Fluxes were measured frequently (often daily) after rainfall (>5 mm) and irrigation events to capture N2O emission peaks observed after moisture inputs but less frequently during dry periods (longest interval 15 days) when conditions conducive to N2O emissions were not present, and emissions remained close to zero. In each plot (total n = 12), a white painted steel collar (0.65 m × 0.65 m = 0.42 m2) was inserted to a 0.10 m depth immediately after tillage operations and planting of crabgrass. These collars had a 0.04 m-wide outer flange to support the top chamber used for flux measurements. During flux measurements, a white-colored PVC chamber (0.70 m × 0.70 m × 0.21 m) was placed on the permanently installed collars.
During chamber enclosure, air in the chamber headspace was mixed using two small battery-driven fans. Air in the chamber headspace was circulated through 3.0 mm inlet and outlet tubing to a portable Fourier transform infrared-based gas analyzer (DX4040; Gasmet Technology Oy, Helsinki, Finland). The concentrations of N2O and CO2 were recorded at 20-s intervals, resulting in 18–24 data points during 6–8 min enclosures for each measurement period. All fluxes were measured between 10:00 and 12:00 on days of measurement (Kandel et al., 2018).
Fluxes were calculated by linear regression using the routine developed by Kutzbach et al. (2007). Based on visual inspection of the CO2 flux curve, the first few records after chamber enclosure were discarded as dead-band. Total cumulative emissions of N2O during the measurement period were calculated using linear interpolation of measured fluxes between the measurement dates.
Measurements of Environmental Variables
Soil temperatures were recorded continuously at 1-h intervals in one of the control plots using TMC-6 soil sensors (Onset Computer Corporation, Bourne, USA). Three soil sensors were placed at 0.05-, 0.10, and 0.15 m soil depths, and the average temperature of the three depths is presented. Air temperature and precipitation data for the study period were obtained from a weather station (Oklahoma Mesonet, Oklahoma Climatological Survey) located roughly 1.0 km from the study site.
Volumetric water content (VWC) was continuously recorded at hourly intervals in the same control plot where soil temperature was recorded using soil moisture sensors (model EC-10; Meter Environment, Pullman, WA). Three sensors were inserted at soil depths of 0–0.05, 0.05–0.10, and 0.10–0.15 m, and an average of three sensors is presented. The VWC was presented as water-filled pore space (WFPS) calculated as relative VWC at saturation. Although some influence of applied treatments on the magnitude of soil moisture and temperature was expected, the dynamics of these variables were mostly expected to be similar. Therefore, temperature and moisture measurements at the control plot were presented to show the dynamics of these variables at the study site.
Analyses of Soil Samples
To determine the concentrations of nitrate () and ammonium () in soils, samples were collected from all plots at the 0–0.15 m depth on all 23 dates of flux measurements. Two soil cores (diameter, 0.02 m) were taken within 0.10-m distance from opposite sides of the collars and pooled to form a composite sample for analyses. Aliquots of samples were extracted in 1.0 M KCl, and the flow injection method (Timberline Instruments, Boulder, CO, USA) was used to determine the concentrations of and .
Measurements of Plant Growth, Yield, and Quality of Crabgrass
Canopy reflectance was measured periodically inside the collars using a portable spectro-radiometer (PSR-3500; Spectral Evolution, Lawrence, USA) to monitor the growth of crabgrass non-destructively. Ratio vegetation index (RVI) was calculated as a ratio of canopy reflectance at red and near-infrared (656 and 779 nm, respectively) wavelengths.
All biomass of crabgrass inside the collars was harvested manually on August 16, 2018. The biomass was oven-dried at 60°C to constant weight, and the dried biomass was milled to pass through a 1-mm sieve. Concentration of N in biomass of crabgrass was determined by flash combustion (900°C for 10 min) method. The amount of N uptake per hectare in crabgrass biomass was calculated as a product of biomass yield and N concentration.
Statistical Analysis
The data are presented as averages and standard errors of three plots from a treatment. The differences of measured fluxes among the treatments were determined using a mixed model in SAS 9.4 (SAS Inc., Cary, NC, USA). The normality of data was tested using Shapiro–Wilk test, and homogeneity of variances was tested using Levene's test. The effect of sampling dates was included in the model and treated as repeated measurements for the measured dynamic variables. Effects of applied treatments on dynamics of measured N2O were analyzed by the model:
where Ytdb is the dependent variable for treatment t, day d, and block b; μ is the overall mean response; αt, βd, and (αβ)td are the fixed effect of treatment, measurement date, and interaction between day and treatment. The terms Cb and Etdb are the random effects of block and residuals, respectively. For the variables without measured dynamics (cumulative emissions of N2O and biomass yield, N concentrations, and N uptake by crabgrass), the effects of applied treatments were analyzed using a similar model without measurement date. Contrasts were used for pairwise comparisons at the 5% level.
Pearson correlation coefficients (R) were applied to test for relationships between accumulated CO2 and N2O emissions 7 days (prior to emergence of crabgrass) after cover crop incorporation and to test for correlations of N2O emissions and soil variables (soil moisture, concentrations of and ). Averages of the soil variables and N2O emissions across treatments at 23 measurement dates were used for the test.
Results
Cover Crop Yield and Biomass Properties
Grass pea produced 2.17 Mg ha−1 aboveground biomass with N concentrations of 4.81%, resulting in 104.37 kg N ha−1 (Table 1). Additionally, grass pea produced 0.30 Mg ha−1 root biomass containing 7.86 kg N ha−1. Oat produced 1.6 times greater (P < 0.05) amounts of aboveground biomass (3.56 Mg ha−1) than grass pea but had 1.6 times lower N concentration (2.86%), which resulted in similar (P > 0.05) amounts of N in aboveground biomass (101.81 kg N ha−1). Yield of root biomass (0.40 Mg ha−1) and its N content (1.81%) in oat were similar to amounts noted for grass pea. The amount of N in root biomass represented <7% of N in total biomass for both species. Cellulose concentrations were similar (P > 0.05) in both crops, but hemicellulose concentrations were significantly greater (P < 0.05) in oat biomass, and lignin concentrations were significantly (P < 0.05) greater in grass pea.
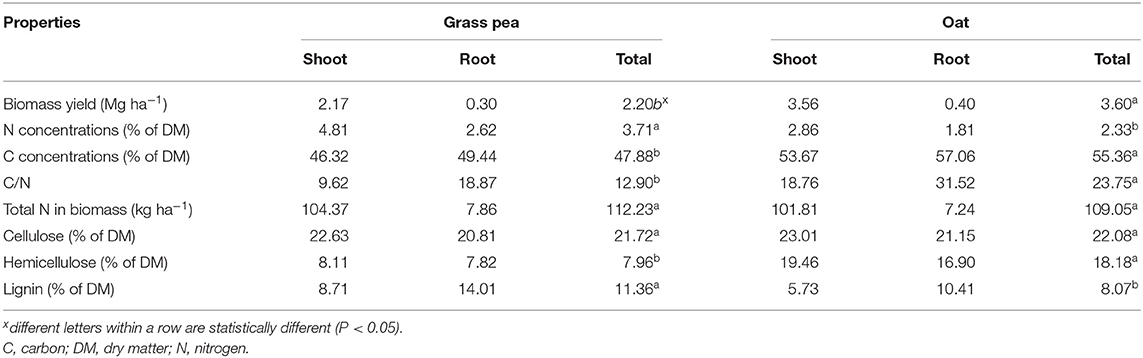
Table 1. Average (n = 3) yield and chemical composition of grass pea and oat grown as green N crops.
Environmental Conditions
Average daily air temperatures during the 90 day period of flux measurement ranged between 18 and 33°C, while average daily soil temperatures ranged between 21 and 35°C (Figure 1A). The average air temperatures for the months of May and June at the study site were 23.2 and 26.2°C, respectively, which was 2.8 and 1.1°C, respectively, higher than long-term (1977–2019) averages for both months (Supplementary Figure 1a). In contrast, the average air temperatures of July (27.4°C) and August (25.9°C) were 0.7 and 1.7°C lower than the long-term averages for those months.
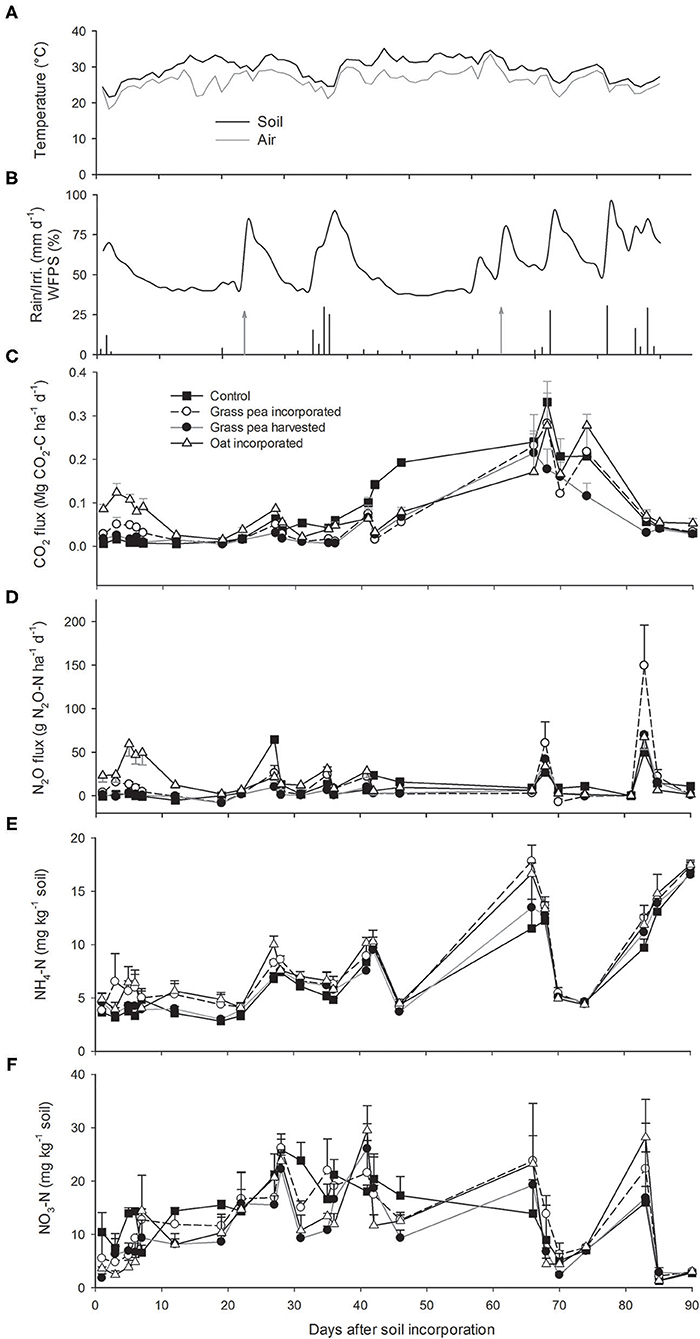
Figure 1. (A) Average soil and air temperatures during flux measurements. (B) Dynamics of daily precipitation (black bars), irrigation amount (gray bars with arrows), and water-filled pore space (WFPS) measured at 0–0.15 m soil depth (black line) during flux measurement. Dynamics of (C) carbon dioxide (CO2), (D) nitrous oxide (N2O) emissions, (D) ammonium (), and (E) nitrate () N in the 0–0.15 m soil depth. Unidirectional error bars are shown for clarity. Error bars (C–F) represent standard error (n = 3).
A 15-mm rainfall was recorded within the first 2 days after soil incorporation of cover crops, followed by a prolonged period without precipitation (Figure 1B). Thereafter, ~87 mm of rainfall was recorded in mid-June, while a long dry period occurred during the month of July, with ~33 mm of rainfall received toward the end of the month. The remaining precipitation events were recorded toward the end of the study period in mid-August.
Due to the heavy rainfall event that occurred at the beginning of the study, WFPS was higher for the first few days but decreased thereafter due to a long drought. Amounts of soil moisture increased significantly after all major rainfall or irrigation events.
Total precipitation during the months of May, June, and July was 50, 93, and 33 mm, respectively, which was 93, 27, and 34 mm lower than the long-term (1977–2019) average precipitation for those months [143 (± 88), 120 (± 63), and 67 (± 45) mm for May, June, and July, respectively] (Supplementary Figure 1b). However, total precipitation in August (109 mm) was 30 mm greater than long-term average [79 (±149) mm]. In total, ~230 mm of rainfall was recorded at the study sites when flux measurements were recorded during May through August compared to 409 (±63) mm for the long-term average. Therefore, this study was undertaken during a drought-affected summer (56% of long-term precipitation). However, the 60 mm of supplemental irrigation reduced some of this rainfall deficit.
Dynamics of N2O and CO2 Emissions
CO2 emissions were greater from the oat- and grass pea-incorporated plots than the control or grass pea-harvested plots during the first week after incorporation (Figure 1C). The emission rates declined subsequently with declining WFPS but increased slightly after the first irrigation event. Greater CO2 fluxes were recorded from control plots than the plots cultivated with cover crops during days 35–72 after biomass incorporation, as crabgrass grew better in response to the control treatment during the drought period.
Amounts of N2O emissions were greater from plots with residue incorporated compared to emissions from the control and grass pea-harvested plots, indicating that the decomposing residues of green N crops contributed to N2O emissions (Figure 1D). The N2O emissions from control and grass pea-harvested plots approximated zero until 22 days after soil incorporation, but few rainfall-induced peaks were recorded thereafter. Emissions of N2O were observed after rainfall or irrigation events until 85 days after soil incorporation, but emissions did not increase during the last measurement date, which occurred after two successive rainfall events that provided >25-mm moisture. Average emissions from oat-incorporated plots (14.02 g N2O-N ha−1 d−1) were significantly greater (P < 0.05) than average emissions from the grass pea-incorporated plots (8.52 g N2O-N ha−1 d−1). Likewise, average N2O emissions across measurement dates from grass pea-incorporated plots were significantly greater than the average emissions from grass pea-harvested plots (5.36 g N2O-N ha−1 d−1).
Dynamics of Soil Mineral N
Soil concentrations remained low and stable in response to all treatments during the first 20 days of the study but increased after the first irrigation event on day 23 (Figure 1E). Effects of sampling dates on soil concentrations were significant, while there were no significant differences between applied treatments except three sampling dates (days 12, 19, and 27). Soil concentrations were significantly greater in oat- and grass pea-incorporated plots compared to concentrations in control and grass pea-harvested plots on days 12 and 19 after soil incorporation. On day 27 after soil incorporation, soil concentrations were significantly greater in oat-incorporated plots than that in response to the other treatments.
There were decreases in soil concentrations on days 66 and 84 after soil incorporation (Figure 1F). Average soil concentrations across sampling dates remained statistically similar among the treatments, ranging between 10.84 and 13.38 mg kg−1 soil. Additionally, the average of weekly and concentrations and amount of soil moisture were significantly (P < 0.05) correlated with average weekly N2O emissions, with Pearson's correlation coefficient (R) of 0.28, 0.24, and 0.33, respectively (Supplementary Figure 2).
Cumulative N2O Emissions
The cumulative N2O emissions from the oat-incorporated plots were significantly greater (P < 0.05) than emissions from other treatments (Figure 2). Additionally, cumulative N2O emissions from grass pea-incorporated and control plots were 58–66% greater (P < 0.05) than cumulative emissions from grass pea-harvested plots (Figure 2). There was no significant difference between cumulative N2O emissions from grass pea-incorporated and control plots. The recorded CO2 emissions during the first 7 days of the study primarily represented heterotrophic respiration due to the absence of green plants. Cumulative emissions of CO2 and N2O from individual collars at this time correlated (R = 0.97; P < 0.0001) strongly with each other, indicating rapid contribution of decomposing biomass of cover crops to N2O fluxes (Figure 3).
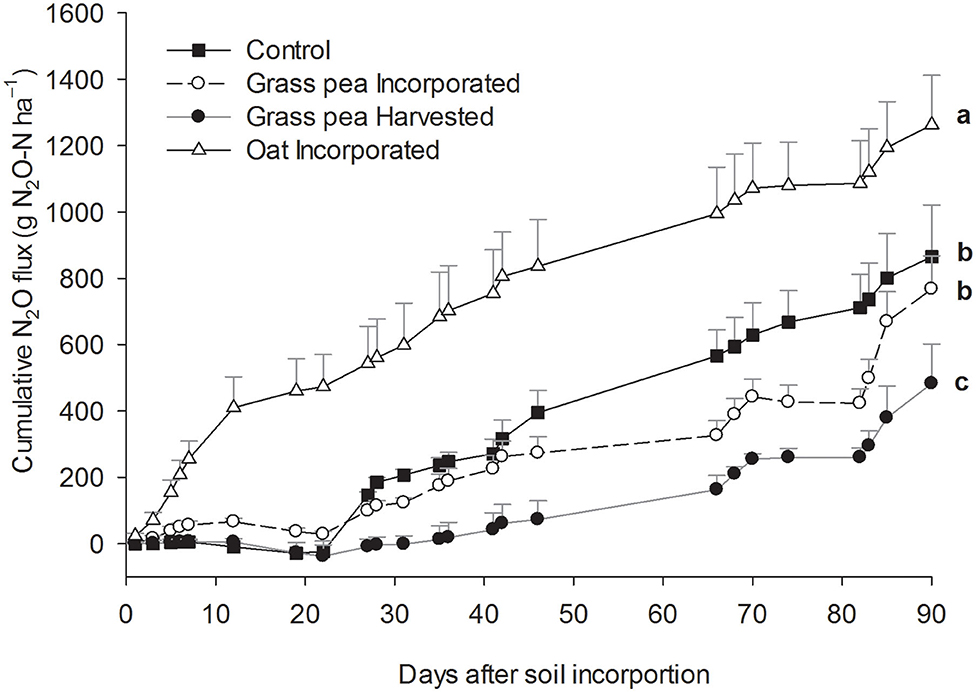
Figure 2. Cumulative estimates of nitrous oxide (N2O) emissions during the 90 day study period. Error bars represent standard error (n = 3).
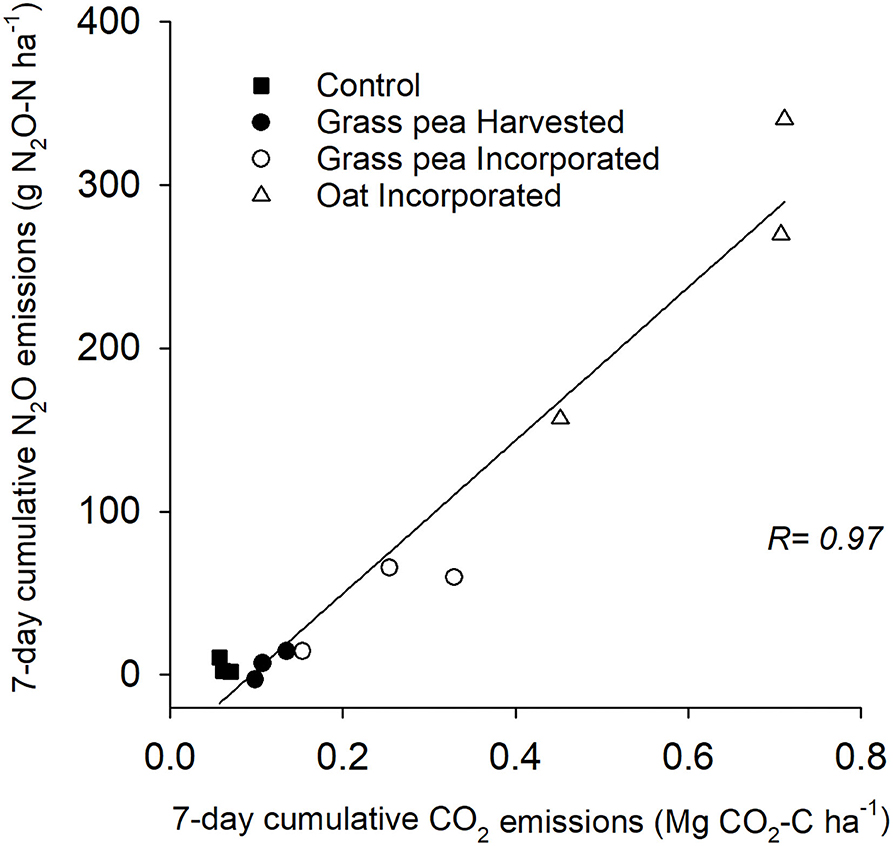
Figure 3. Correlation of cumulative carbon dioxide (CO2) and nitrous oxide (N2O) emissions from individual collars across the treatments during the first 7 days of soil incorporation of cover crop biomass. Pearson's correlation coefficient (R) between the cumulative emissions is shown.
Biomass Growth, Yield, and N Concentrations and Uptake of Crabgrass
Biomass growth of crabgrass measured as RVI was significantly greater (P < 0.05) from the control plots on days 41 and 46 after incorporation of cover crops compared to the other treatments and remained nominally greater thereafter (Figure 4). Crabgrass germination occurred in all plots 7 days after planting, but growth by crabgrass on plots assigned to spring cover crops was severely affected by drought. Crabgrass expressed classic symptoms of drought stress, including dark bluish-green rolled leaves and small plant size. A rapid increase in RVI was observed on control plots after irrigation on day 23, while such increases were observed in response to the other treatments after a rainfall on day 45.
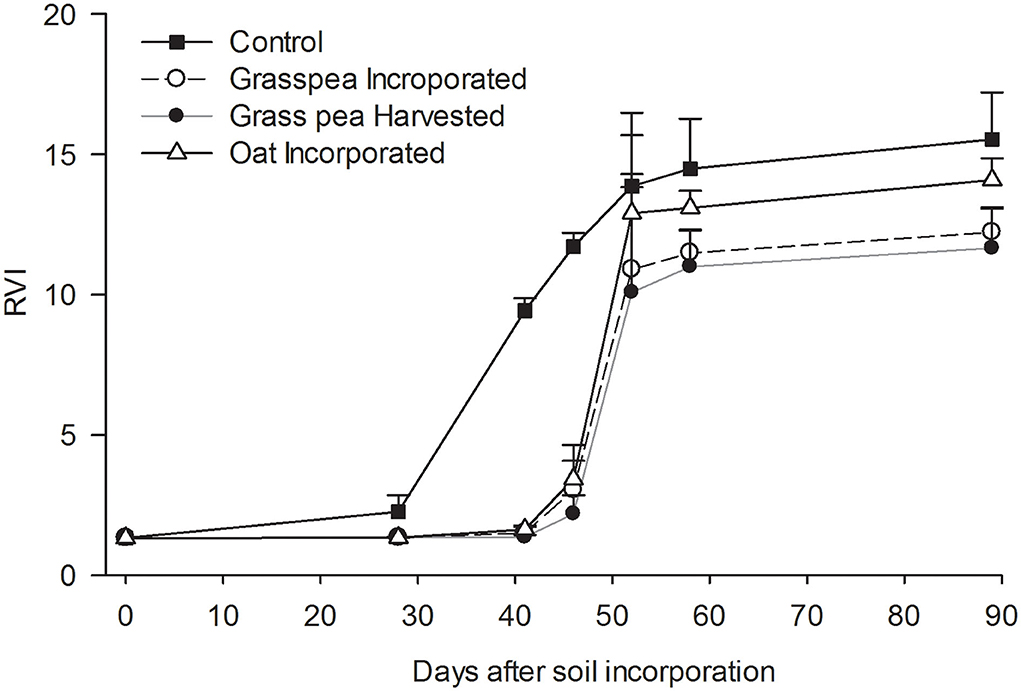
Figure 4. Dynamics of ratio vegetation index (RVI) measured as a proxy for green biomass of crabgrass. Error bars represent standard error (n = 3). Unidirectional error bars are shown for clarity.
The biomass yield of crabgrass in response to the control was roughly twice (P < 0.05) the yields generated by crabgrass in response to cover crops (Figure 5A). The N concentrations of crabgrass biomass produced on grass pea- and oat-incorporated plots were significantly greater than concentrations in crabgrass biomass produced by the control and grass pea-harvest treatments (Figure 5B). However, there were no significant differences among treatments for total N accumulated in crabgrass biomass (Figure 5C).
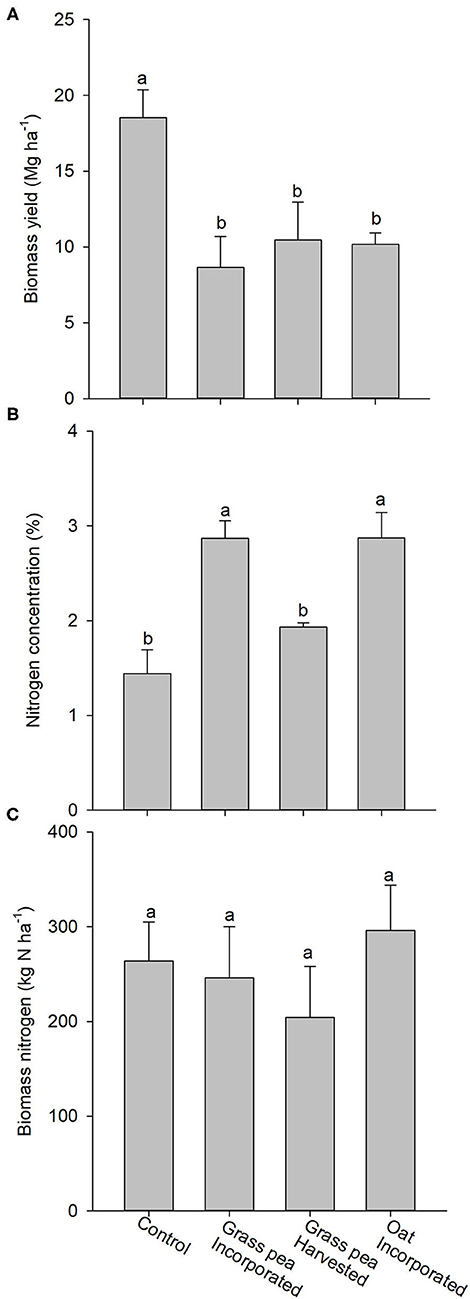
Figure 5. (A) Mean aboveground biomass produced by crabgrass after 90 days of growth. (B) Nitrogen (N) concentrations of the harvested biomass of crabgrass. (C) Total amount of N in the harvested crabgrass biomass. Error bars represent standard error (n = 3). Different letters on the top of bars indicate statistical difference (P < 0.05).
Discussion
Our hypothesis of lower N2O emissions from decomposing oat residue than the grass pea residue was rejected, as results showed the opposite. In particular, emissions from oat-cultivated plots were greater than from grass pea-cultivated plots during the first 2 weeks after soil incorporation. Generally, greater amounts of N2O emissions are expected from decomposing legume residues, as N in low C/N ratio legume residues mineralizes rapidly after soil incorporation, increasing amounts of in soil pools, which serves as a substrate for denitrification (Baggs et al., 2000; Huang et al., 2004; Gomes et al., 2009; Basche et al., 2014). However, this response was not observed in the current study.
A possible reason for the greater level of N2O emissions from the oat treatment could be the greater amounts of C provided by oat biomass at termination, which increased the amounts of mineralizable C for denitrification as indicated by greater CO2 fluxes (Cameron et al., 2013). Additionally, since the amount of N in oat biomass was comparable to that in biomass of grass pea, oats scavenged available soil N that was released by denitrification after termination. Therefore, greater denitrification rates due to greater availability of mineralizable C, combined with the large amounts of N noted in oat biomass, may have contributed to the greater N2O emissions from oat-incorporated plots.
This study noted that the cumulative N2O emissions from control plots were not significantly different from the N2O emissions generated by the grass pea-incorporated plots. A possible explanation for this similarity might be greater accumulation of N by grass pea (through N fixation and scavenging N from soil) during growth than was actively mineralized from biomass after soil incorporation. This assumption was supported by generally greater nitrate availability in control plots during the initial stages of the experiments.
Previous studies have reported that residues of cover crops could enhance N2O emissions from agricultural soils after incorporation, though mitigation is possible by management of the residues of cover crops (Sanz-Cobena et al., 2014; Kim et al., 2017; Kandel et al., 2019a; Singh et al., 2020). Residues of cover crops that are incorporated into soil generally increase mineralizable C and contents in soils, which are conducive for N2O emissions (Mitchell et al., 2013). In the current study, the increase in mineralizable C in residues within the incorporation treatments was evidenced by greater CO2 emissions compared to control and grass pea-harvested treatments during the first 7 days of the study (before germination of crabgrass), though average concentrations of soil remained similar among the treatments. Thereby, it can be deduced in the current study that increased soil-mineralizable C provided by residues of incorporated cover crops had possibly stronger influences on N2O emissions than N mineralized from soil-incorporated residues.
Poor responses of growth and yield of crabgrass in response to biomass removal of grass pea might be due to low fertilizer values for the remaining residues, since soil in this study is considered highly fertile. In a nearby site with less fertile soil, biomass removal of hairy vetch (Vicia villosa) grown as a green N crop resulted in poor growth and yield of crabgrass in the same season as the current study (Kandel et al., 2019a). These results from two contrasting sites within the same year indicate management applied to green N crops, such as biomass removal, should be based on soil types and their fertility status.
Yields generated by crabgrass in response to the control treatment were significantly greater than yields generated by treatments that included cover crops. This response was likely due to depletion of available soil moisture by the cover crops. The total precipitation received during the growing period of the cover crops, and the following summer crop, was lower than the long-term average precipitation, although supplemental irrigation was applied to help alleviate some of the deficit. This response indicated that replacing a period of spring fallow with a spring-grown cover crop can negatively affect yields by the following summer crop, particularly during dry years. Such depletion of the limited pools of available soil moisture is a common phenomenon in double-cropped systems throughout the drought-prone US Great Plains (Nielsen et al., 2002; Rao and Northup, 2009; Aiken et al., 2013).
Crabgrass biomass produced on grass pea-incorporated plots contained ~40 kg ha−1 more N than crabgrass produced on grass pea-harvested plots, though these responses were not significantly different. This response indicated that ~39% of N in aboveground biomass of grass pea was transferred to crabgrass. These transfers indicate some degree of function for soil-incorporated residues of cover crops to serve as organic forms of N fertilizer. However, these levels of transfer are well below levels reported for applied inorganic N. Northup and Rao (2016) reported wheat biomass grown in rotation with summer legume-based green N crops contained 32% (±6%) of the amount of N in hay crops than was recorded in response to the recommended amount of N fertilizer (80 kg N ha−1). Similar differences were recorded in N accumulated in wheat grain in response to green and inorganic N sources (Kandel et al., 2019b).
The effectiveness of the cover crops as source of N to following crops mainly depends on the amount of N in their biomass (Kaye et al., 2019; Singh et al., 2020). Additionally, the chemical properties of biomass, particularly cell wall fractions that govern decomposition and mineralization, are also important for the transfer of nutrients from residues of cover crops to recipient crops since the amounts of such properties in biomass govern the speed of decomposition by soil microbes (White et al., 2014; Singh et al., 2020). Although we expected better N fertilizer value from grass pea due to biological N fixation and higher N content in biomass, crabgrass performed at similar levels under both grass pea and oat cover crops. This might be due to a greater amount of uptake of soil N and recycling of N to soil by oat than grass pea since the total amount of N in both crops was similar. Also, oat biomass was terminated at an earlier growth stage (~60 days after emergence) than full maturity, so the less-mature biomass would decompose rapidly, as noted in the larger CO2 fluxes compared to responses to grass pea.
Conclusions
This study showed that the use of short-duration spring crops that are grown as sources of green N is not a straightforward process, with responses driven by interactions among the chosen crop and its productivity, growing conditions, and availability of soil moisture. We observed that post-incorporation N2O emissions were greater from oat crops that were incorporated compared to an incorporated legume-based crop grown for green N. Although greater amounts of N2O emissions were expected from grass pea, the higher amounts of oat biomass, which provided similar amounts of N per unit area, resulted in greater amounts of mineralizable C that contributed to greater levels of N2O production.
We also noted that the form of management applied to the biomass produced by crops has the potential to mitigate the production of greenhouse gases for decomposing residues, though some forms will limit the availability of N for following crops. The 90 day cumulative emissions of N2O from the grass pea plots that were harvested generated half the emissions noted from plots where grass pea biomass was incorporated. This response showed that incorporated aboveground biomass of green N crops have the capacity to act as major sources of N2O emissions and the potential to mitigate these emissions by harvesting biomass for forage.
Results also recorded that yields of crabgrass in response to spring-grown green N crops or as hay, can be negatively affected during years where drought periods occur during spring through summer. Plots receiving spring-planted crops generated half the production of the control plots, which included spring fallowing. This response indicated that replacing spring periods of fallow with short-duration crops grown for green N or hay can severely affect the yield of following summer forages during dry years.
Data Availability Statement
The raw data supporting the conclusions of this article will be made available by the authors, without undue reservation.
Author Contributions
HS and TK contributed to the conceptualization, methodology, and investigation. HS contributed to the formal analysis and writing of the original draft preparation. PG and BN contributed to the resources. TK, PG, BN, and VK contributed to the writing, review, and editing. TK contributed to the supervision. BN and PG contributed to the project administration. PG contributed to the funding acquisition. All authors have read and agreed to the published version of the manuscript.
Funding
This research was partially supported by funds from the USDA National Institute of Food and Agriculture project 2019-68012-29888.
Disclaimer
Mention of trademarks, proprietary products, or vendors does not constitute guarantee or warranty of products by USDA and does not imply its approval to the exclusion of other products that may be suitable. All programs and services of the USDA are offered on a nondiscriminatory basis, without regard to race, color, national origin, religion, sex, age, marital status, or handicap.
Conflict of Interest
The authors declare that the research was conducted in the absence of any commercial or financial relationships that could be construed as a potential conflict of interest.
Acknowledgments
Authors would like to recognize ARS technicians Kory Bollinger, Jeff Weik, and Cindy Coy for their assistance in managing experimental sites and collecting, processing, and analyzing samples.
Supplementary Material
The Supplementary Material for this article can be found online at: https://www.frontiersin.org/articles/10.3389/fsufs.2020.604934/full#supplementary-material
Supplementary Figure 1. (a) Average long-term and study year air temperature for the months of May, June, July, and August. (b) Average long-term and study year precipitation for the months of May, June, July, and August.
Supplementary Figure 2. Correlation matrices with Pearson's correlation coefficients (R) of nitrous oxide (N2O) emissions and soil variables on 25 measurement dates during the study period. EC, electrical conductivity.
References
Aiken, R. M., O'Brien, D. M., Olson, B. L., and Murray, L. (2013). Replacing fallow with continuous cropping reduced crop water productivity of semiarid wheat. Agron. J. 105, 199–207. doi: 10.2134/agronj2012.0165
Aulakh, M. S., Doran, J. W., Walters, D. T., and Power, J. F. (1991). Legume residue and soil water effects on denitrification in soils of different textures. Soil Biol. Biochem. 23, 1161–1167. doi: 10.1016/0038-0717(91)90029-J
Baggs, E. M., Rees, R. M., Smith, K. A., and Vinten, A. J. A. (2000). Nitrous oxide emission from soils after incorporating crop residues. Soil Use Manage. 16, 82–87. doi: 10.1111/j.1475-2743.2000.tb00179.x
Basche, A. D., Miguez, F. E., Kaspar, T. C., and Castellano, M. J. (2014). Do cover crops increase or decrease nitrous oxide emissions? A meta-analysis. J. Soil Water Conserv. 69, 471–482. doi: 10.2489/jswc.69.6.471
Biederbeck, V. O., Bouman, O. T., Looman, J., Slinkard, A. E., Bailey, L. D., Rice, W. A., et al. (1993). Productivity of four annual legumes as green manure in dryland cropping systems. Agron. J. 85, 1035–1043. doi: 10.2134/agronj1993.00021962008500050015x
Cameron, K. C., Di, H. J., and Moir, J. L. (2013). Nitrogen losses from the soil/plant system: a review. Ann. Appl. Biol. 162, 145–173. doi: 10.1111/aab.12014
Decker, J. E., Epplin, F. M., Morley, D. L., and Peeper, T. F. (2009). Economics of five wheat production systems with no-till and conventional tillage. Agron. J. 101, 364–372. doi: 10.2134/agronj2008.0159
Foster, J. L., Muir, J. P., Bow, J. R., and Valencia, E. (2017). Biomass and nitrogen content of fifteen annual warm-season legumes grown in a semi-arid environment. Biomass Bioenergy 106, 38–42. doi: 10.1016/j.biombioe.2017.08.016
Gomes, J., Bayer, C., de Souza Costa, F., de Cássia Piccolo, M., Zanatta, J. A., Vieira, F. C. B., et al. (2009). Soil nitrous oxide emissions in long-term cover crops-based rotations under subtropical climate. Soil Tillage Res. 106, 36–44. doi: 10.1016/j.still.2009.10.001
Goodman, J. M. (1977). “Physical environments of Oklahoma,” in Geography of Oklahoma, ed J. W. Morris (Oklahoma City, OK: Oklahoma Historical Society), 9–25.
Holman, J. D., Arnet, K., Dille, J., Maxwell, S., Obour, A., Roberts, T., et al. (2018). Can cover or forage crops replace fallow in the semiarid Central Great Plains? Crop Sci. 58, 932–944. doi: 10.2135/cropsci2017.05.0324
Hoorman, J. J., Islam, R., Sundermeier, A., and Reeder, R. (2009). Using cover crops to convert to no-till. Crops Soils 42, 9–13. Available online at: https://ohioline.osu.edu/factsheet/SAG-11
Huang, Y., Zou, J., Zheng, X., Wang, Y., and Xu, X. (2004). Nitrous oxide emissions as influenced by amendment of plant residues with different C: N ratios. Soil Biol. Biochem. 36, 973–981. doi: 10.1016/j.soilbio.2004.02.009
Kandel, T. P., Gowda, P. H., Northup, B. K., and Rocateli, A. C. (2019a). Incorporation and harvest management of hairy vetch-based green manure influence nitrous oxide emissions. Renew. Agric. Food Syst. 35, 1–10. doi: 10.1017/S174217051900019X
Kandel, T. P., Gowda, P. H., Northup, B. K., and Rocateli, A. C. (2019b). Winter wheat yield and nitrous oxide emissions in response to cowpea-based green manure and nitrogen fertilization. Exp. Agric. 56, 239–254. doi: 10.1017/S0014479719000334
Kandel, T. P., Gowda, P. H., Somenahally, A., Northup, B. K., DuPont, J., and Rocateli, A. C. (2018). Nitrous oxide emissions as influenced by legume cover crops and nitrogen fertilization. Nutr. Cycl. Agroecosyst. 112, 119–131. doi: 10.1007/s10705-018-9936-4
Kaye, J., Finney, D., White, C., Bradley, B., Schipanski, M., Alonso-Ayuso, M., et al. (2019). Managing nitrogen through cover crop species selection in the US mid-Atlantic. PloS ONE 14:e0215448. doi: 10.1371/journal.pone.0215448
Kim, G. W., Das, S., Hwang, H. Y., and Kim, P. J. (2017). Nitrous oxide emissions from soils amended by cover-crops and under plastic film mulching: fluxes, emission factors and yield-scaled emissions. Atmos. Environ. 152, 377–388. doi: 10.1016/j.atmosenv.2017.01.007
Kutzbach, L., Schneider, J., Sachs, T., Giebels, M., Nykänen, H., Shurpali, N. J., et al. (2007). CO2 flux determination by closed-chamber methods can be seriously biased by inappropriate application of linear regression. Biogeosci. Discuss 4, 2279–2328. doi: 10.5194/bgd-4-2279-2007
Li, X., Petersen, S. O., Sørensen, P., and Olesen, J. E. (2015). Effects of contrasting catch crops on nitrogen availability and nitrous oxide emissions in an organic cropping system. Agric. Ecosyst. Environ. 199, 382–393. doi: 10.1016/j.agee.2014.10.016
Mitchell, D. C., Castellano, M. J., Sawyer, J. E., and Pantoja, J. (2013). Cover crop effects on nitrous oxide emissions: role of mineralizable carbon. Soil Sci. Soc. Am. J. 77, 1765–1773. doi: 10.2136/sssaj2013.02.0074
Myers, R. J. K., Palm, C. A., Cuevas, E., Gunatilleke, I. U. N., and Brossard, M. (1994). “The synchronisation of nutrient mineralisation and plant nutrient demand,” in The Biological Management of Tropical Soil Fertility, eds P. L. Woomer and M. J. Swift (Chichester: John Wiley), 81–116.
Nielsen, D. C., Lyon, D. J., Hergert, G. W., Higgins, R. K., and Holman, J. D. (2015). Cover crop biomass production and water use in the Central Great Plains. Agron. J. 107, 2047–2058. doi: 10.2134/agronj15.0186
Nielsen, D. C., Vigil, M. F., Anderson, R. L., Bowman, R. A., Benjamin, J. G., and Halverson, A. D. (2002). Cropping systems influence on planting water content and yield of winter wheat. Agron. J. 94, 962–967. doi: 10.2134/agronj2002.0962
Northup, B. K., and Rao, S. C. (2016). Effects of legume green manures on forage produced in continuous wheat systems. Agron. J. 108, 101–108. doi: 10.2134/agronj15.0031
Rao, S. C., and Northup, B. K. (2009). Water use by five warm-season legumes in the southern Great Plains. Crop Sci. 49, 2317–2324. doi: 10.2135/cropsci2009.03.0134
Rao, S. C., Northup, B. K., and Mayeux, H. S. (2005). Candidate cool-season legumes for filling forage deficit periods in the southern Great Plains. Crop Sci. 45, 2068–2074. doi: 10.2135/cropsci2005.0019
Rao, S. C., Northup, B. K., Phillips, W. A., and Mayeux, H. S. (2007). Interseeding novel cool-season annual legumes to improve bermudagrass paddocks. Crop Sci. 47, 168–173. doi: 10.2135/cropsci2006.02.0088
Sanz-Cobena, A., García-Marco, S., Quemada, M., Gabriel, J. L., Almendros, P., and Vallejo, A. (2014). Do cover crops enhance N2O, CO2 or CH4 emissions from soil in Mediterranean arable systems? Sci. Total Environ. 466, 164–174. doi: 10.1016/j.scitotenv.2013.07.023
Singh, H., Kandel, T. P., Gowda, P. H., Northup, B. K., Kakani, V. G., and Baath, G. S. (2020). Soil N2O emissions following termination of grass pea and oat cover crop residues with different maturity levels. J. Plant Nutr. Soil Sci. 183, 734–744. doi: 10.1002/jpln.202000239
Singh, H., Kandel, T. P., Gowda, P. H., Somenahally, A., Northup, B. K., and Kakani, V. G. (2019b). Influence of contrasting soil moisture conditions on carbon dioxide and nitrous oxide emissions from terminated green manures. Agrosyst. Geosci. Environ. 2, 1–8. doi: 10.2134/age2019.03.0012
Singh, H., Northup, B. K., Baath, G. S., Gowda, P. P., and Kakani, V. G. (2019a). Greenhouse gas mitigation strategies for agronomic and grazing lands of the US Southern Great Plains. Mitig. Adapt. Strat. Glob. Change 25, 819–853. doi: 10.1007/s11027-019-09902-4
Snapp, S. S., Swinton, S. M., Labarta, R., Mutch, D., Black, J. R., Leep, R., et al. (2005). Evaluating cover crops for benefits, costs and performance within cropping system niches. Agron. J. 97, 322–332. doi: 10.2134/agronj2005.0322a
Thilakarathna, M. S., McElroy, M. S., Chapagain, T., Papadopoulos, Y. A., and Raizada, M. N. (2016). Belowground nitrogen transfer from legumes to non-legumes under managed herbaceous cropping systems. A review. Agron. Sustain. Dev. 36:58. doi: 10.1007/s13593-016-0396-4
USDA-NRCS (1999). Soil Survey of Canadian County, Oklahoma; Supplement Manuscript; USDA-NRCS and Oklahoma Agric. Stillwater, MT: Exp. Stn.
Van Soest, P., and Wine, R. (1967). Use of detergents in the analysis of fibrous feeds. J. Anim. Sci. 26, 119–128.
White, C. M., DuPont, S. T., Hautau, M., Hartman, D., Finney, D. M., Bradley, B., et al. (2017). Managing the trade-off between nitrogen supply and retention with cover crop mixtures. Agric. Ecosyst. Environ. 237, 121–133. doi: 10.1016/j.agee.2016.12.016
Keywords: nitrogen mineralization, crabgrass, biomass decomposition, forage, cover crop, residue
Citation: Singh H, Kandel TP, Gowda PH, Northup BK and Kakani VG (2021) N2O Emissions From Residues of Oat and Grass Pea Cover Crops Cultivated in the US Southern Great Plains. Front. Sustain. Food Syst. 4:604934. doi: 10.3389/fsufs.2020.604934
Received: 10 September 2020; Accepted: 31 December 2020;
Published: 10 February 2021.
Edited by:
Dietmar Schwarz, Leibniz Institute of Vegetable and Ornamental Crops, GermanyReviewed by:
Jacobo Arango, International Center for Tropical Agriculture (CIAT), ColombiaPauline Chivenge, International Rice Research Institute (IRRI), Philippines
Copyright © 2021 Singh, Kandel, Gowda, Northup and Kakani. This is an open-access article distributed under the terms of the Creative Commons Attribution License (CC BY). The use, distribution or reproduction in other forums is permitted, provided the original author(s) and the copyright owner(s) are credited and that the original publication in this journal is cited, in accordance with accepted academic practice. No use, distribution or reproduction is permitted which does not comply with these terms.
*Correspondence: Hardeep Singh, aGFyZGVlcC5zaW5naEBva3N0YXRlLmVkdQ==