 Kevin Prawiranto
 Jan Carmeliet2
 Thijs Defraeye
- 1Empa, Swiss Federal Laboratories for Materials Science and Technology, Laboratory for Biomimetic Membranes and Textiles, St. Gallen, Switzerland
- 2Chair of Building Physics, Swiss Federal Institute of Technology Zurich (ETHZ), Zurich, Switzerland
Solar drying is regarded as a less reliable process compared to continuous hot-air drying due to the intermittency of solar radiation. This problem is mitigated by equipping solar dryers with thermal storage, dehumidifier units, or auxiliary heating that enhances drying continuity during night time. In this study, we combine a mechanistic fruit drying model, quality models (vitamin C decay and browning reaction) and weather data to evaluate the drying characteristics and quality evolution of apple fruit with and without the aforementioned improvement strategies. By coupling to measured weather conditions, a digital twin of the drying fruit is established. The twin outputs drying times and final product quality for a specific fruit type and size, a particular dryer configuration, and specific weather conditions. The trade-offs between drying time, final product quality and energy use for the different improvement strategies of solar drying are documented. We found that solar drying may benefit from the slower drying due to the improvement of product quality. Compared to the other improvement strategies, dehumidification of the drying air is shown to be superior in retaining the vitamin C content and prohibiting the browning reaction. However, in general, drying with auxiliary heating is found to balance the trade-offs between drying time, final product quality and energy use since the weather-dependency of the process is mitigated. Additionally, we quantified the impact of a pre-treatment process that modifies the permeability of the fruit tissue by breaking the cell membrane. We found that inducing such lysis is more effective in decreasing the drying time when drying is conducted at low (room) temperature. This study shows that using the developed digital twin, future drying process and control strategies could be optimized in real-time for every single drying run.
Introduction
Solar drying offers a sustainable way for food preservation. However, solar drying usually needs longer drying times compared to conventional convective drying methods, e.g., forced-convective hot-air drying. The process relies on the amount of solar radiation availability and the daily variations of air temperature and humidity (Dina et al., 2015). Weather condition variations thereby cause differences in drying time and final product quality for each drying run (e.g., vitamin content; Ratti and Mujumdar, 2004). Such differences challenge dryer operators to identify when a product is sufficiently dry and also require frequent checking to avoid over-drying. The research on solar drying strives to achieve a fast drying process, with the highest possible quality and least potential variability in quality between individual drying runs. Improvements in solar drying technologies mainly focused on trying to maintain an elevated supply air temperature and/or low humidity level during nighttime. Three main strategies are commonly applied: integration of thermal energy storage systems, air dehumidification or auxiliary heating in the drying system. Thermal storage implies that a part of the solar energy is stored during day time and is released to the system during nighttime (Aboul-Enein et al., 2000; Bal et al., 2010; Arun et al., 2020). The solar energy can be stored in the form of sensible heat (Ayyappan et al., 2016) or latent heat (Jain and Tewari, 2015; Ayyappan et al., 2016; Reyes et al., 2019; Salih et al., 2019; Babar et al., 2020). Another strategy is to decrease the humidity level of the incoming air by employing passive dehumidification. Solid desiccants, such as silica gel and activated alumina are preferred to liquid desiccant, due to their lower cost and simplicity (Hodali and Bougard, 2001; Kabeel, 2009). External auxiliary heating of the air is also applied to dry during the off-sun period. This system requires electricity (Ouaabou et al., 2020) or heat provided by the combustion of fossil fuels (Smitabhindu et al., 2008; Murali et al., 2020) or biomass (Ait Hammou and Lacroix, 2006; Madhlopa and Ngwalo, 2007; Kiburi et al., 2020; Manrique et al., 2020). The analysis and control of the solar drying process are mainly based on the evaluation of drying kinetics, i.e., the mass loss over time and the remaining water activity of the product (Mustapha et al., 2014; Li et al., 2017). Limited information is found on how the drying strategies are controlled based on the current weather conditions. This is surprising since the weather conditions have a key influence on the drying kinetics, the dehydration-rehydration cycles, and the quality evolution of the product. Here, the drying time should be sufficient to reach a water activity, which enables safe, long-term storage of the dried product. On the other hand, over-drying should be avoided, particularly concerning the final product quality. An optimized drying time and temperature could help to retain micronutrients and bioactive compounds (Stamenković et al., 2020), which improves the quality of the diet.
To better control the solar drying for every drying run, we need to know or predict the drying kinetics and product quality in real-time. For this purpose, numerical modeling and simulation can be used. Most modeling works have been focused on the optimization of drying operational conditions, dryer design and drying time (Tarigan, 2018; Purusothaman and Valarmathi, 2019; Román-Roldán et al., 2019). Comprehensive solar drying modeling that also includes weather factors, such as in Simo-Tagne and Bennamoun (2018) and product quality factor is scarce. In the context of quality modeling, kinetic of nutritional degradation and browning reactions due to the temperature-driven biochemical reactions (Link et al., 2017) have been investigated to predict the evolution of these quality attributes as a function of drying time, product temperature and moisture content (Van Boekel, 2008; Devahastin and Niamnuy, 2010). These quality models ideally receive input on product temperatures and moisture contents from reliable drying simulations to accurately assess the quality during the drying process at given conditions. Drying of soft cellular material, like fruits or vegetables, is however a complex process, involving heat and mass transfer as well as large deformation of the cellular structure. These microstructural changes, in turn, affect the water transport in the tissue. Accurately simulating these coupled processes is therefore challenging, involving precise material properties (effective permeability or diffusivity), but is essential to simulate the resulting dehydration process and quality evolution reliably. Often, however, solar drying simulations use simplified empirical thin-layer drying models (Togrul and Pehlivan, 2004; Atalay et al., 2017; Rodríguez-Ramos et al., 2020). Such model output lacks a spatial and temporal resolution of the governing variables, i.e., moisture content and temperature, and only capture gradients in the lateral direction of the product. There are advanced mechanistic models available that are based on the fundamental physical processes that occur during drying, including heat and mass transport and structural deformation (Datta et al., 2012; Gulati et al., 2016; Defraeye and Radu, 2018). Recently, a multiscale model was presented, where fruit drying was modeled from the cellular scale up to the entire product by upscaling method (Prawiranto et al., 2020). This physics-based model can capture the complex drying kinetics during a solar drying process as well, including the impact of dehydration-rehydration cycles, but has not been applied in the modeling of solar drying to our best knowledge.
This paper presents an upscaling-based mechanistic drying model that is combined with quality decay models and measured weather data. By such a coupling of the virtual representation of fresh horticultural produce with the real-world process, a digital twin of the drying fruit is established. This twin is linked to the real-world product by sensors supplying data of the environmental conditions near the target fruit or vegetable. In this study, it is used to assess how different improvement strategies of solar drying and variations in weather conditions change the material drying kinetics, such as the dehydration-rehydration cycles, and the quality evolution. Additionally, the need for an additional pre-treatment process that promotes changes in material moisture permeability is analyzed. In the subsequent section, solar dryer configurations without and with improvement strategies (heat storage, dehumidification, and auxiliary heating) are built up. Next, different weather conditions are taken for running solar drying simulations. The summer weather conditions in Henan Province of China, a major apple-producing region, are selected as testing drying conditions. China is the biggest producer of apple fruit in the world (Damos et al., 2015) and is rich in solar energy resources with total annual radiation of 5,000 MJ/m2 (Zhang et al., 2011). Therefore, that region is interesting for solar dryer development.
Materials and Methods
A basic solar dryer consists of a solar collector and a drying chamber. The conditions of the inlet drying air in the drying chamber depend on the weather and are determined by solving the heat and mass balance in the solar collector. Given these calculated drying conditions, the fruit drying process and quality evolution (vitamin C and browning) are simulated based on the validated drying model of Defraeye and Verboven (2017). The water transport properties of the drying model are taken from Prawiranto et al. (2020), in which they are calculated from microscale drying modeling and agree well to the values from experimental studies.
Solar Dryer Configuration
The basic solar dryer that is used for modeling is presented in Figure 1A. It is based on the solar dryer developed by Reyes et al. (2013) and Vásquez et al. (2019). The solar dryer has a single-pass flat plate collector, which is 1.2 m wide and 2.9 m long. The detailed configuration can be found in Supplementary Material. The collector consists of a glass cover, an air channel, an absorber plate, and an insulator. The absorber plate is made of black-painted zinc, which is often used as an absorber material since it has high solar radiation absorption and thermal conductivity (Mujumdar, 2014). For model simplification, the zinc plate is assumed flat without fins. The glass cover and the zinc plate have a thickness of 0.007 m, while the air channel has a height of 0.07 m. To minimize the heat loss from the absorber, an insulator made of mineral wool is placed under the absorber. The insulator has a thickness of 0.05 m. The food drying chamber is 1.9 m wide, 0.55 m long, and 0.46 m high. The airflow is induced by a fan. Different modes of heat transfer take place in the solar collector (Reyes et al., 2013; Vásquez et al., 2019): (1) convective heat transfer between the glass cover and inside air, glass cover and ambient air and between the absorber and inside air, (2) radiative heat transfer between the glass cover surface and absorber plate surface, (3) radiative heat absorption by the glass and absorber plate, (4) conductive heat transfer between the absorber and insulator, and (5) convective heat transfer between the insulator and the ambient air.
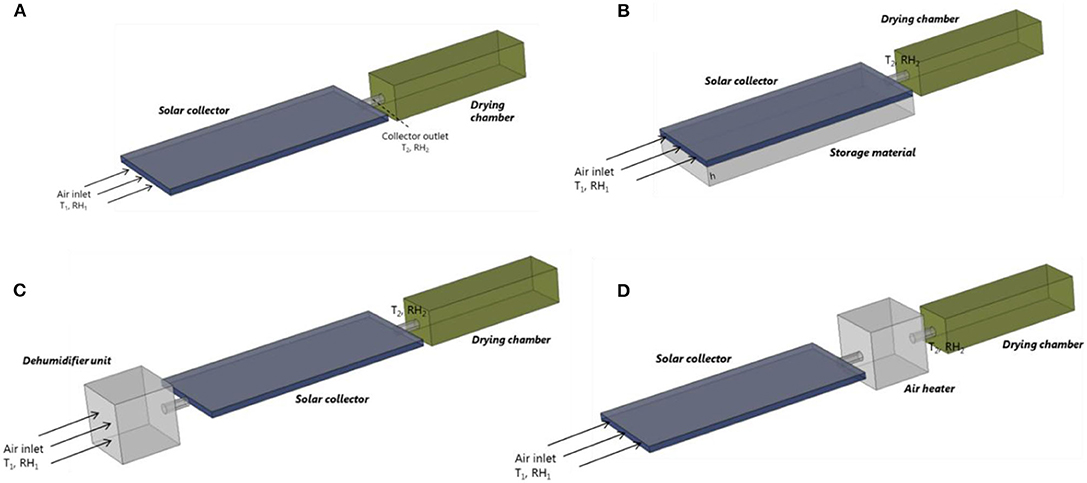
Figure 1. Solar dryer configuration used in the modeling: (A) the basic configuration, (B) solar collector with thermal storage made of sand bed, (C) solar dryer equipped with a dehumidifier unit consisting of silica gel, and (D) solar dryer equipped with an auxiliary heating unit (air heater). The basic configuration is based on the solar dryer developed by Reyes et al. (2013) and Vásquez et al. (2019).
Based on the base case, improved drying strategies for the solar dryer are proposed. The first improvement is a solar dryer that is equipped with thermal storage that is installed under the absorber plate (Figure 1B). This configuration is based on the study of Aboul-Enein et al. (2000). The storage is made of a sand bed and utilizes the sensible heat transport into the sand to store partially the energy received from the sun. The stored energy is then automatically released during the nighttime to increase the drying air temperature. This release is driven by convection since the air temperature in the solar collector falls below that of the thermal storage, which induces convective heating of the air. The thermal storage is 1.2 m wide and 2.9 m long. The effect of sand bed thickness on the dryer performance is explored further in section Geometry and Boundary Conditions. This drying strategy only affects the temperature and does not affect the absolute humidity of the drying air. The second drying strategy adds a dehumidifier unit to the dryer, by placing it in front of the solar collector to reduce the humidity of the intake air (Figure 1C). This configuration is based on the work of Hodali and Bougard (2001) and Kabeel (2009). The humidifier is filled with silica gel as the desiccant. The third drying strategy employs an auxiliary heating unit that is placed downstream of the solar collector and is used to supply additional heat during nighttime (Figure 1D). The system mimics a fuel or biomass burner that can generate a constant heat flux (Madhlopa and Ngwalo, 2007). This configuration does not affect the absolute humidity of the drying air, but only the supply air temperature.
Given the inlet temperature, inlet humidity, and incoming solar radiation, the temperature and humidity of the air leaving the solar collector and entering in the drying chamber (T2 and RH2) are computed by solving the energy and mass balance in the solar collector for the basic and improved drying strategies. The detailed modeling approaches are presented in the Supplementary Material.
Modeling of Fruit Dehydration
Drying Modeling
The drying model is adopted on the macroscale drying model of Prawiranto et al. (2020). The drying model gives 7% differences (on average) in the mass loss for water content between 5.5 until 1 (dry base) when it is validated with experimental data. The model is used to calculate the heat and moisture transfer in fruit tissue during drying. The following conservation equations for moisture and energy are solved simultaneously:
The water capacity and effective permeability are linked with effective diffusivity and dry matter density as:
In contrast to most drying research, which uses an empirically determined Keff or Deff (Castro et al., 2019; Onwude et al., 2019), Keff and CΨ (Figure 2) are taken from the microscale simulation Prawiranto et al. (2020). By doing so, the drying model in this study also incorporates the information about the dependency of water transport properties on the dehydration state and shrinkage of the cellular structure. Here, Keff decreases at lower water activity and increases at a higher temperature. The water potential is related to water activity by:
The airflow field around the fruit is not modeled explicitly, but it is modeled by convective transfer coefficients: the convective mass transfer coefficient, CTMC, and the convective heat transfer coefficient, CHTC. With regard to the geometry set-up in section Geometry and Boundary Conditions, the CHTC was calculated based on the assumption of a cylinder placed in a turbulent flow parallel to the length of the cylinder (Wiberg and Lior, 2005):
l(t) is the difference between the outer and inner radius of the ring as a function of time t [m]. Reynolds number is a dimensionless number that indicates the ratio of inertial forces to viscous forces and describes the types of flow, e.g., laminar or turbulent flow. It is calculated as:
The CMTC was calculated from CHTC using the heat and mass transfer analogy (Chilton and Colburn, 1934; Defraeye et al., 2012). The following boundary conditions are specified at the air-tissue interface, implying the continuity of moisture and heat fluxes:
The enthalpies of water vapor and liquid water are calculated as:
The specific latent heat, Lv is set constant at 2,260 kJ/kg, reflecting evaporation at a standard pressure of 1 atm.
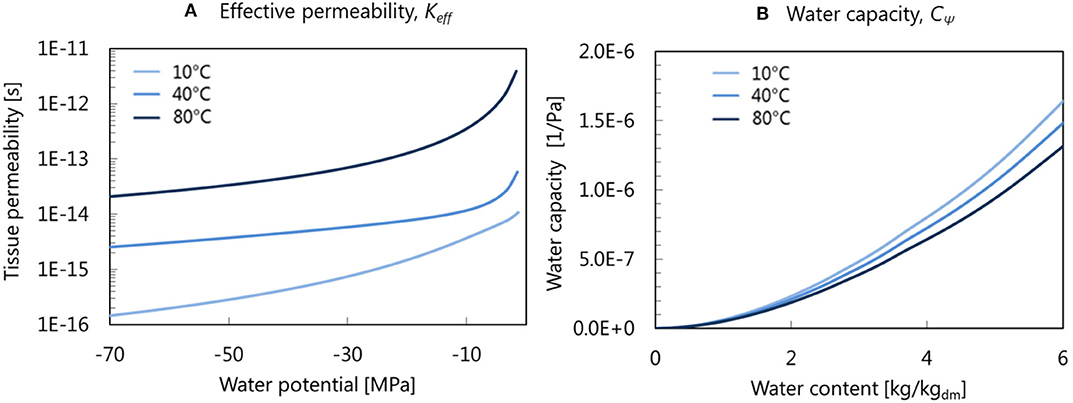
Figure 2. (A) Effective permeability and (B) water capacity used in the drying simulations taking into account the effect of microstructural changes (free shrinkage) on the tissue water transport properties (Prawiranto et al., 2020)—Reproduced by permission of The Royal Society of Chemistry.
Dehydration-Driven Deformation Modeling
For the deformation simulation, the linear momentum balance for the material is solved (Bonet and Wood, 2008):
The second Piola Kirchhoff stress tensor is defined as a function of the strain energy density:
The elastic Green-Lagrange strain tensor is described as:
The neo-Hookean constitutive model is chosen to account for the large material deformation occurring due to moisture loss (Gulati and Datta, 2015), and the deformation is assumed to be isotropic. Here, the strain energy density function is:
K and G are determined from the elastic Young modulus and the Poisson's ratio:
The elastic Jacobian is obtained as the ratio of total Jacobian and volume changes due to moisture effects:
During drying, Vt is assumed to be equal to the volume of the water removed from the tissue. It is formulated as follow:
The shrinkage coefficient is then can be calculated as:
The material properties of the fruit tissue are presented in Table 1.
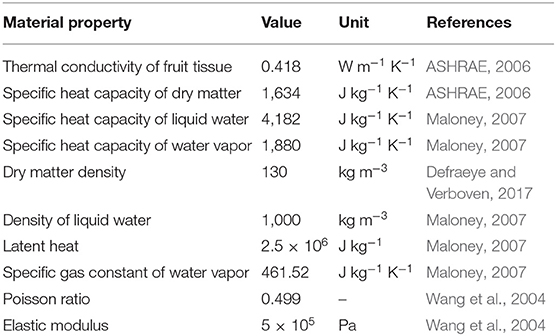
Table 1. Material properties of fruit tissue for the drying simulation.
Quality Evolution Model
In this study, the fruit color and vitamin C content are used to represent the quality degradation of apple fruit during drying. The color degradation during drying affects visual appearance, which is important for consumer acceptability. Although the actual chemical reactions that induce a color change are rather complex to model, the color degradation due to non-enzymatic browning (Maillard) reaction can be simply modeled with sufficient accuracy using a zero-order kinetic rate law (Van Boekel, 2008). The formation of brown pigment in the product can be measured based on the product's absorbance at a wavelength of 420 nm, in which the extent of the browning can be modeled as Vaikousi et al. (2008):
kb is a function of temperature and evaluated by using a modified Arrhenius equation:
The Arrhenius model gives 5% error relative to the observed experimental data (Vaikousi et al., 2008). The retention of vitamin C is used as an indicator of the preservation of the nutritional content, as it is the least stable compound and is rapidly destroyed during drying at elevated temperatures (Maeda and Salunkhe, 1981). The vitamin C decay is assumed to follow a monomolecular degradation reaction (Timoumi et al., 2007) in which the kinetic is modeled using first-order rate law (Villota and Hawkes, 2018):
where Cc is the ascorbic acid concentration at time t, and kc is the reaction rate constant of ascorbic acid decay. The relationship between the reaction rate and the temperature is described by the Arrhenius relationship:
The values of the model parameters are obtained from Timoumi et al. (2007) and valid for a temperature range of 30–60°C. The model parameters for quality modeling are presented in Table 2.
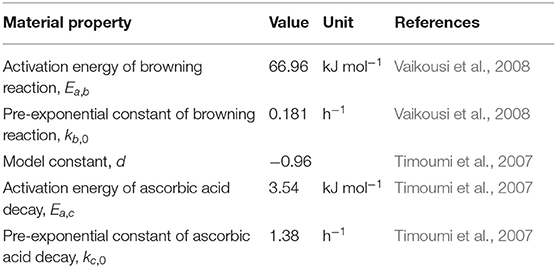
Table 2. Model parameters for the quality model.
Geometry and Boundary Conditions
An apple ring is used as the geometry representative for the apple fruit inside the dryer. The geometry is chosen as it is often used for commercial dried apple chips. In industrial drying ovens, the apple rings are usually placed on meshes that allow convective moisture and heat transport from all sides of the ring. To mimic this setting, a ring with an outer radius of 5 cm, an inner radius of 0.75 cm, and a height of 0.5 cm is used (Figure 3A). Due to symmetry, only one-eighth of the geometry is modeled (Figure 3B). Zero-flux boundary conditions and zero normal displacements are imposed on the symmetry planes. The boundary and initial conditions for the drying simulation are detailed in Table 3.
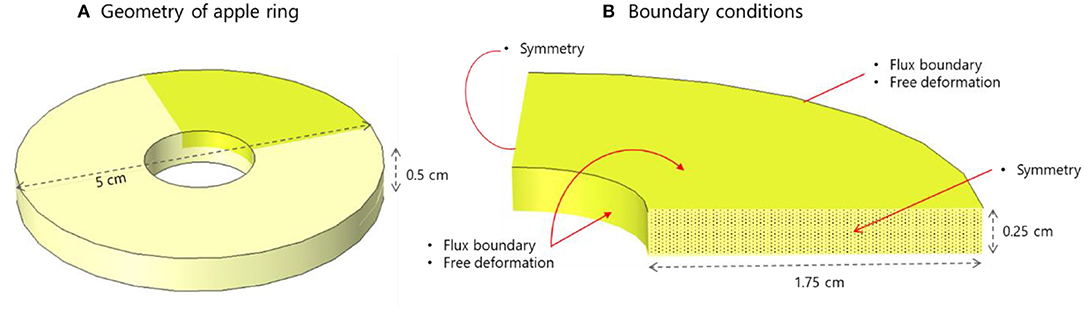
Figure 3. (A) Apple ring used for drying simulation. Due to symmetry, only one-eighth of the ring is modeled (highlighted in green). (B) The boundary conditions imposed on the computational domain.
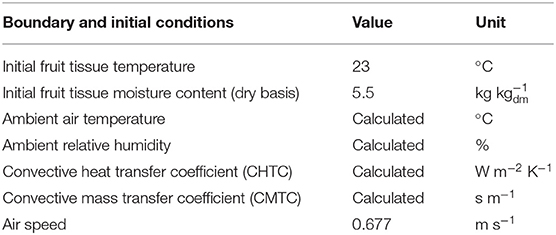
Table 3. Boundary and initial conditions.
Model Configurations
Several model variations are simulated to evaluate and compare the drying characteristics and final product quality of apple tissue for the different solar drying strategies and weather conditions.
• Comparison of hot-air and solar drying
Solar drying using the dryer configuration in Figure 1 is taken as the base case. Here, typical summer weather conditions in Henan Province of China, a major apple-producing region, are selected as drying conditions. The weather data of June 4th 2019 is used. The drying day is cloud-clear and has an average temperature around 27°C during the day and night, which likely provides ideal drying conditions during summertime. The data are obtained from www.meteoblue.com (Meteoblue AG, Switzerland). The inlet temperature, relative humidity, and solar radiation are shown in Figures 4A,B. The outlet temperature and relative humidity of the air leaving the solar collector are given in Figures 4C,D (black lines), respectively. The drying process is assumed to start at 08.00 a.m. and runs for 72 h (3 days) by repeatedly simulating with the obtained outlet temperature and relative humidity. The base case simulation is compared with a drying simulation of hot-air drying at a constant temperature of 60°C. The latter mimics the common drying conditions in an industrial dryer. In this case, it is assumed that the temperature is regulated at 60°C (Figure 4C). The inlet absolute humidity, i.e., the total mass of water vapor present in a given volume of air, follows the fluctuation of the ambient humidity specified in the base case. The resulting relative humidity of the drying air is plotted in Figure 4D (red line).
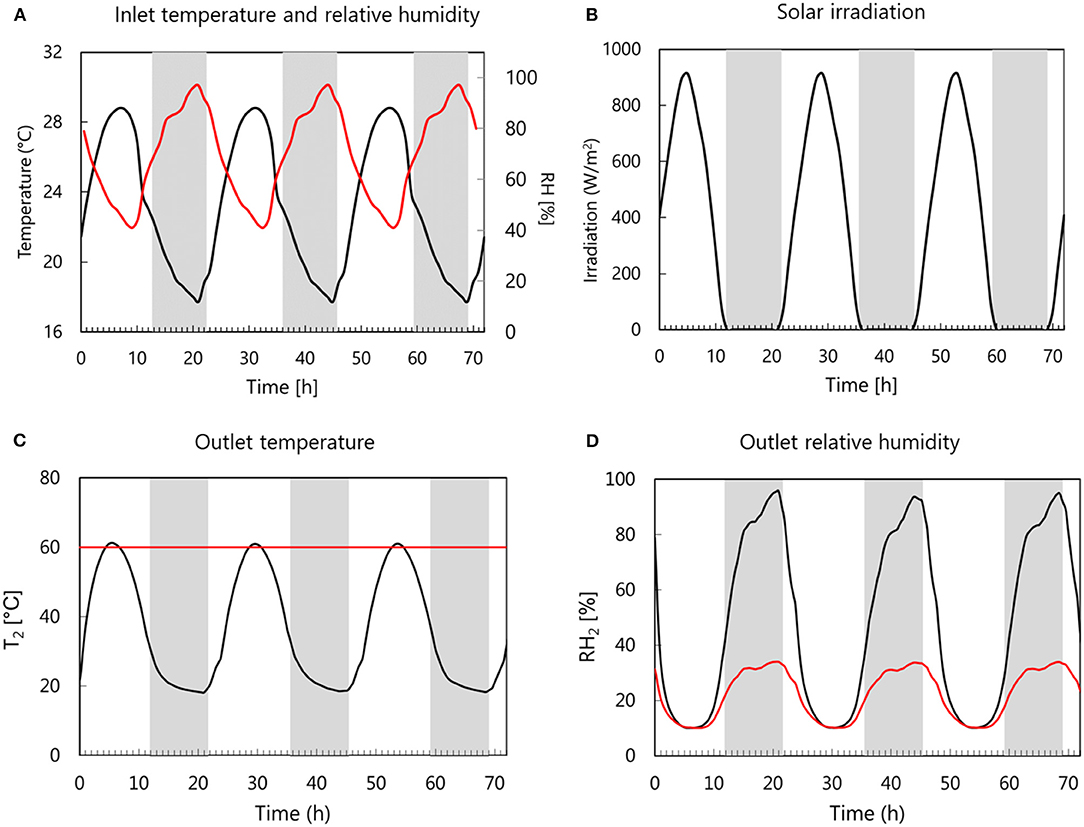
Figure 4. (A) Inlet temperature (black line) and relative humidity (red line) and (B) solar irradiation obtained from the weather data. (C) Temperature and (D) relative humidity of the drying air at the outlet of the solar collector (black lines) compared to the temperature and relative humidity (red lines) for the modeling of constant hot-air temperature drying.
• Comparison of improved solar drying strategies
The different improved solar drying strategies are simulated, and their performance is compared to the base case. Different dryer configurations, as explained in section Solar Dryer Configuration, are simulated. For a solar dryer with thermal storage, two sand bed heights of 5 cm and 10 cm are simulated. For a solar dryer with a dehumidifier unit, desiccant volumes of 0.5 and 1 m3 are simulated. In a solar dryer with auxiliary heating, two-burner systems with a power of 50 W and 100 W are modeled. The resulting outlet air temperature and relative humidity at the collector outlet (T2, RH2), i.e., at the inlet of the drying chamber, for each drying strategy are presented in Figure 5. Figure 5A shows that thermal storage dampens the fluctuations in temperature and RH during the day and nighttime. The temperature and RH fluctuation is milder when the storage height is increased, due to a larger heat capacity. In a solar dryer with a dehumidifier unit (Figure 5B), the temperature remains similar to the temperature in the base case as the solar collector has the same design. It is assumed that there is no latent heat effect. A larger volume of desiccant results in more effective moisture removal from the inlet air, thus lower air humidity levels. Note that the desiccant regeneration process is not considered in the modeling of the dehumidifier unit, and the desiccant can become less effective after some time due to saturation. However, it is found that in the two dehumidification cases with 0.5 m3 and 1 m3, a saturation of the desiccant is not attained within the simulated drying period. In a solar dryer with auxiliary heating (Figure 5C), a larger heating power will obviously yield a higher drying air temperature as the air volumetric rate that is passed through the heating system is kept the same in both cases. As a consequence, also lower values in relative humidity are attained (Figure 5C).
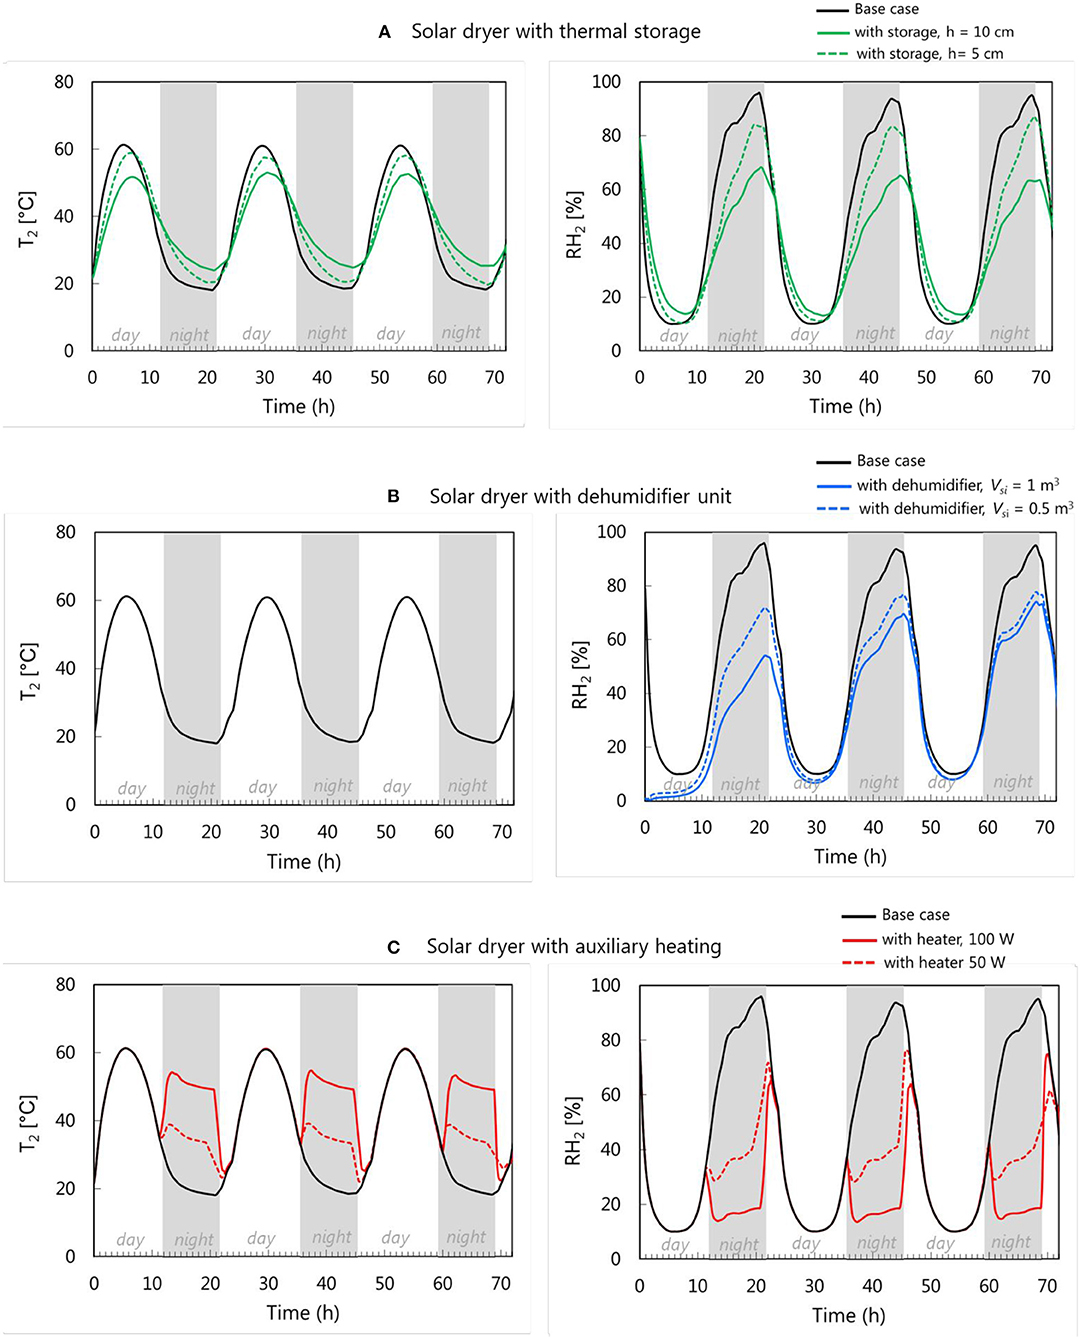
Figure 5. Solar collector air outlet temperature T2 and relative humidity RH2 for solar drying equipped with (A) thermal storage, (B) dehumidifier unit, and (C) auxiliary heating.
• Comparison of solar drying under various weather conditions and cellular dehydration mechanisms
Solar drying under different cellular dehydration conditions is simulated to investigate its impact on the drying time and final quality in a solar drying process. Here, four cases are considered:
- Solar drying using the base case configuration where the free shrinkage cellular dehydration mechanism is assumed (BC). Free shrinkage means that the fruit cells only shrink when they are being dehydrated.
- Solar drying using the base case configuration with a pretreatment process that induces lysis (LY). Lysis means that the fruit cells shrink and their membrane breaks when they are being dehydrated. The membrane breakage implies an easy path of water transport due to the removal of membrane resistance.
- Solar drying using an auxiliary heater with free shrinkage assumption (AX).
- Solar drying using an auxiliary heater with a pretreatment process that induces lysis (AXLY).
Solar drying under different weather conditions is simulated to investigate the variability of the drying time and final quality attributes between different drying runs. For all of the drying cases, three 3-day periods in June 2019 are selected and categorized as:
- Cloudy, which is the 3-day period when the total cloud cover is the highest (June 24th−26th, 2019).
- Sunny, which is the period when the total cloud cover is the least (June 1st−3rd, 2019)
- Rainy, which is the period when the total precipitation is the highest (June 6th−8th, 2019).
The weather conditions for these periods (inlet temperature, inlet RH and absolute humidity, incoming solar radiation) are plotted in Figure 6. The sunny period is characterized by high temperature, high solar irradiation, and mild (absolute) humidity. In the rainy period, the temperature is observed to be high, which is combined with low solar radiation and high humidity. During the cloudy period, all three variables are lower. The drying processes are simulated for 3 days (72 h). The outlet drying temperature (T2) and relative humidity (RH2) for each drying period, both for drying with base case configuration and auxiliary heating, are detailed in the Supplementary Material.
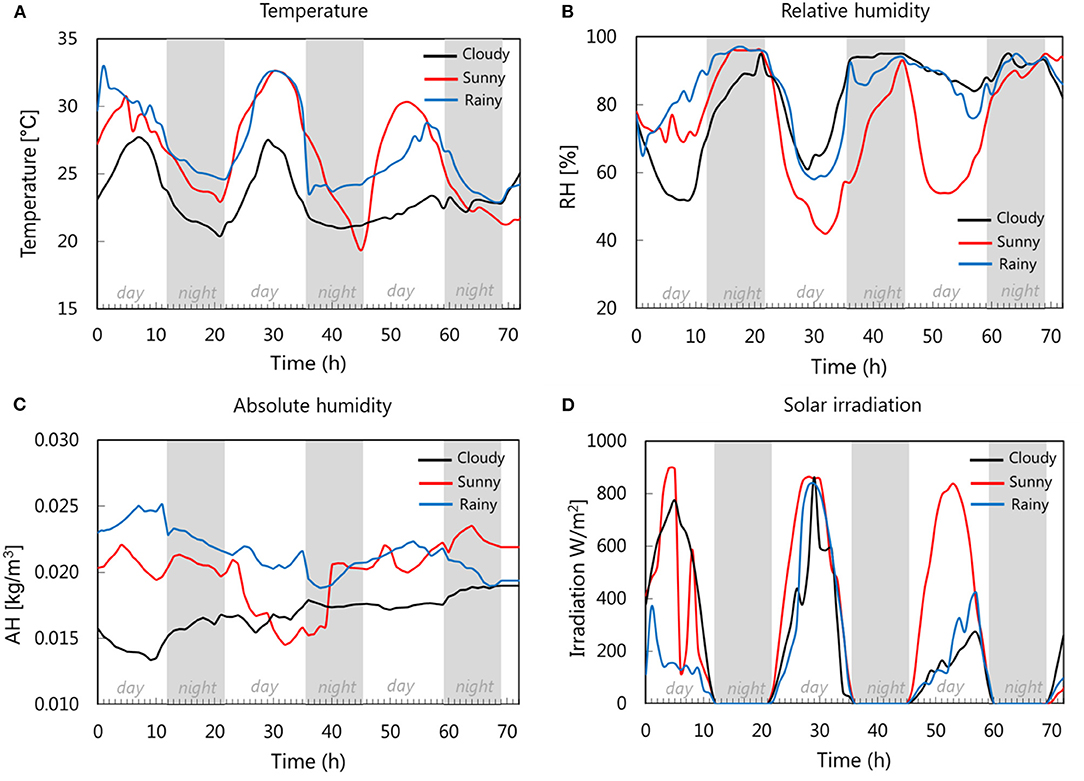
Figure 6. (A) Temperature, (B) relative humidity, (C) absolute humidity, and (D) solar irradiation for different periods of drying: cloudy, sunny, and rainy period.
Performance Metrics
The drying process is evaluated based on four metrics:
• Minimum drying time, which indicates the earliest time that the drying process can be stopped. It is defined as the time required to decrease the average tissue water activity to a value of 0.6. This is the maximum water activity that a product can have to be safely stored after drying (Perera, 2005; Labuza and Altunakar, 2008; Bonazzi and Dumoulin, 2014). Below this value, the risk of growth of molds and pathogenic microorganisms is strongly reduced. While the water distribution may not be uniform at the time the drying is stopped, the moisture will eventually redistribute and equilibrate during storage or within the packaging, where the relative humidity is typically below 60% (Miranda et al., 2019).
• Preserved vitamin C, as an indicator of final quality, at the minimum drying time indicated in point (a).
• Color changes due to the browning reaction, which is reflected by the absorbance value at the minimum drying time indicated in point (a).
• Energy consumption, which is the energy used during the drying process (in kWh), if any. It is calculated from the start of the drying process until the minimum drying time for each case is attained. Here, the calculated energy consumption is the net energy required to heat the drying air, without taking into account the efficiency of the heating system.
Numerical Simulations
The simulations are performed using the finite element method in COMSOL Multiphysics version 5.4. Based on a mesh sensitivity analysis, the fruit tissue domain is meshed into 8,600 hexahedral elements. The governing equations of moisture and heat transport were implemented in the coefficient form PDE interface. The Structural Mechanics and Non-linear Structural Materials modules of COMSOL are used to model the structural deformation. A direct MUMPS solver was adopted to solve the resulting systems of equations. The dependent variables are solved by using a segregated solver, in which the heat and water transport are solved first after which the deformation is solved. Based on sensitivity analysis, the relative tolerances for convergence are set at 104 for all solved variables. Based on a temporal sensitivity analysis, a maximal time step of 300 s is set using adaptive time stepping. The 3-day drying simulation, for each case, takes approximately 20 h on a 2.50 GHz 8-core Intel Core i7 processor with 32 GB RAM.
Results
Drying Characteristics During Solar Drying
The effectiveness of a solar drying process is assessed by comparing the drying curve with the one from a forced convective, hot-air drying process at a constant elevated temperature, namely 60°C in this study. The latter is common practice in large-scale industrial drying processes. The comparison of the water content and drying rate of solar drying (base case) and constant-temperature drying are presented in Figure 7. For drying at 60°C, the water content in the fruit is steadily decreasing. During solar drying, however, several distinguishable drying periods are observed from the water content, drying rate, and Kircher's curve shown in Figure 7. The corresponding water content and permeability profile within the fruit are presented in Figure 8. From point A to B, during the first 6 h of the drying process, the drying rate is increasing as the water content decrease (Figures 7A–C, 8a, point A to B). Drying starts at 8.00 a.m., in which the outlet temperature increases and the absolute humidity decreases progressively until noon (see Figures 4C,D). Both result in an increase in vapor pressure deficit leading to an increase in drying rate. The drying rate is also high due to the higher water permeability of the fruit at the high water content of the fruit tissue (Figure 8b, point A to B). Such high permeability allows faster moisture migration from the inner tissue to the surface. The high drying rate results in a high gradient of water content inside the tissue (Figure 8a, point B). In this period, water is removed at an almost equal rate from all surfaces. From point B to C, the drying rate is decreasing during the afternoon because of the decreasing temperature. An additional reason is that the effective permeability of the fruit tissue decreases, which implies a lower flux for a similar driving gradient. Water removal occurs preferentially from the upper (and lower) part of the apple ring. The reason is that dried tissue with a lower permeability is formed close to the lateral surface of the inner radius, with a permeability that is almost half of that of the upper surface (Figure 8b). From point C to D, the drying rate becomes very low (almost zero). This period occurs during the first night because the vapor pressure in the drying air and at the tissue surface have values that are very close to one another. This period allows the water to redistribute within the tissue (Figure 8a, point C to D), which makes the water content profile more uniform. From point E to F, the drying rate becomes negative, which implies that rehydration takes place. During this period, the vapor pressure at the tissue surface is lower than the vapor pressure of the drying air, driving moisture from the air to the sample. The tissue thereby absorbs water vapor from the air and partially rehydrates (Figures 7B,C). Rehydration only occurs during the second night because the tissue has been already severely dehydrated. Drying with a constant temperature of 60°C shows no rehydration, with a water content that is constantly decreasing from point A to D. From the Kircher's curve in Figure 7C, it can be seen that there is a quasi-constant drying period when the water content is around 5 until 2 kg/kgdm, before the drying rate falls afterward.
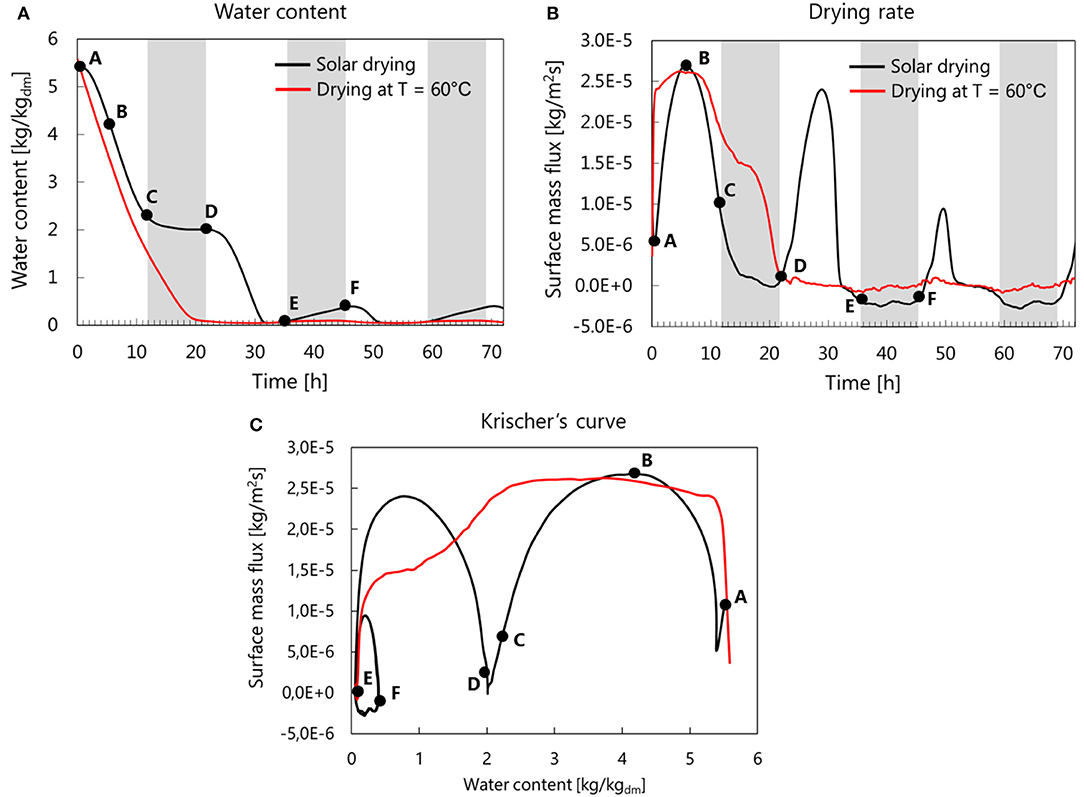
Figure 7. Comparison of (A) water content, (B) drying rate, and (C) Kircher's curve during solar drying and drying at a constant temperature of 60°C. Point A represents the initial condition. The gray zones indicate the night periods.
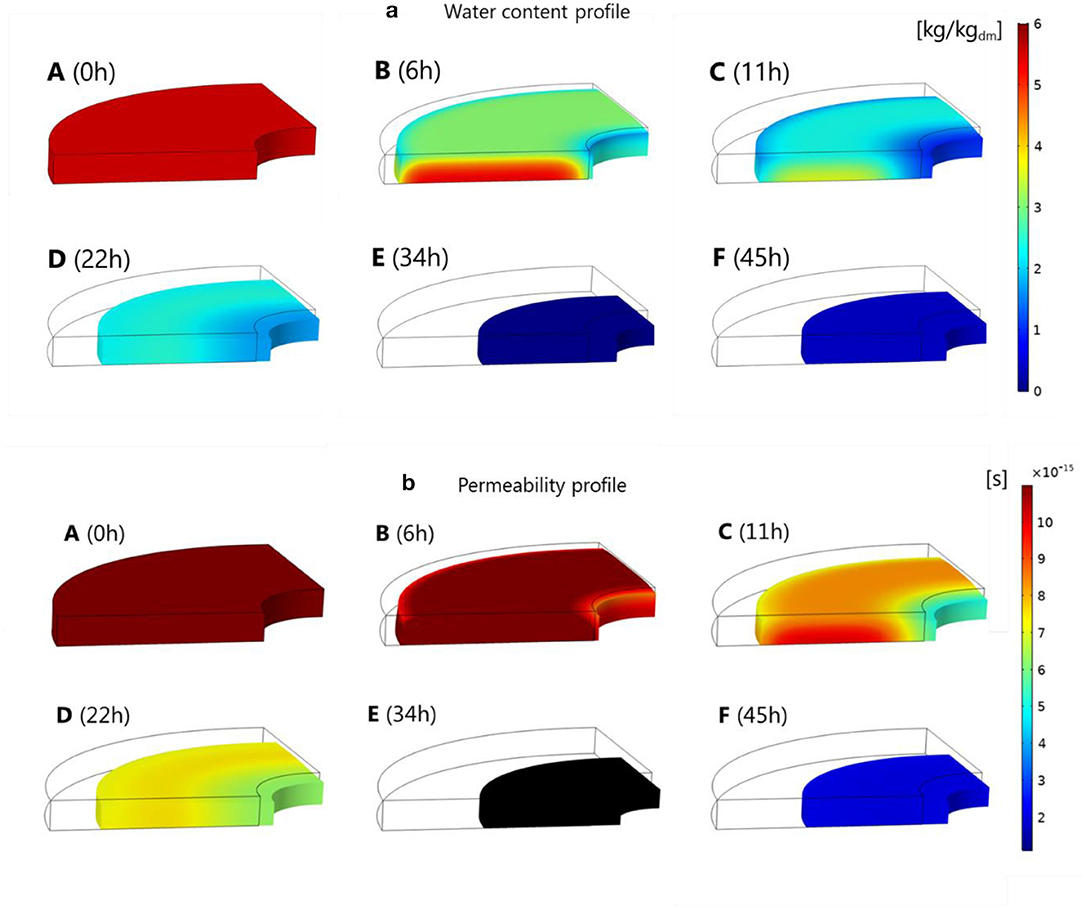
Figure 8. (a) Base case water content and (b) permeability profiles in the deformed apple slice at different point of drying time. Every drying point (A–F) corresponds to the point in Figure 7.
Changes in Fruit Quality During the Solar Drying Process
Figure 9 shows the time evolution of the volume-averaged water activity and temperature as well as the vitamin C decay and browning formation for both solar drying and drying at 60°C. The drying process is stopped at a water activity (aw) threshold value of 0.6 (end of the solid line in Figure 9). The square dots show the final value of each parameter at the end of the drying process. The drying time for solar drying is 10 h longer than for drying at 60°C (Figure 9A). Figure 9B shows that at the beginning of the drying process, the product temperature decreases for hot-air drying for about the first 7 h due to the evaporative cooling effect, after an initial transition period where the sample heats up (Figure 9B). Afterward, the temperature increases again since the mass flux from the sample reduced significantly (Figure 7B), so also the evaporative cooling effect.
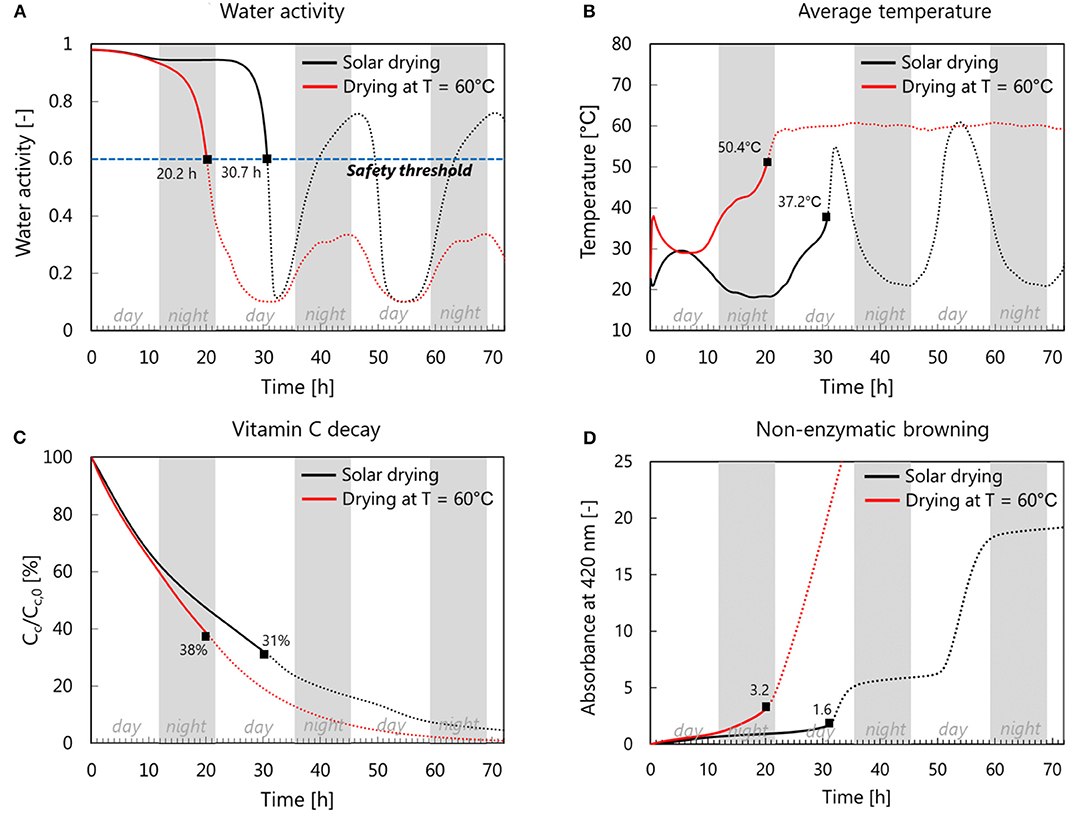
Figure 9. Comparison of volume-averaged (A) water activity and (B) temperature between solar drying and constant-temperature drying at 60°. Water activity and temperature are used to predict (C) the vitamin C decay and (D) the enzymatic browning absorbance of the apple tissue. Solid lines depict the progression of each parameter before the critical drying time is reached, at a water activity value of 0.6. The square dots show the final value of each parameter at the end of drying processes.
In general, we expect that a longer drying time has a negative impact on both quality attributes. Due to the lower drying temperature in solar drying, however, the vitamin C decay is slower during solar drying than during hot-air drying. The vitamin C retention of the final dried product is slightly worse for solar drying (30%) compared to constant-temperature drying (38%) due to the significantly longer drying time (Figure 9C). On the other hand, solar drying performs better in limiting color change, so the browning reaction. Solar drying shows half of the absorbance predicted in the constant-temperature drying (Figure 9D). Here, we can see that during the night, the progression of the browning reaction is lower due to the decreased tissue temperature, as indicated by Equation (21).
Impact of Improvement Strategies on the Drying Characteristic and Product Quality
In this section, we evaluate the performance of improved solar drying strategies in terms of enhanced drying rates and final product quality. Figure 10 compares the water loss and drying rate between the solar drying (base case configuration) and solar dryers equipped with thermal storage, a dehumidifier unit or auxiliary heating. To better assess the performance of each of these drying strategies, a radar chart in Figure 11 is used to compare different performance metrics. There are four performance metrics to quantitatively assess the ability of each strategy to (1) conserve energy, (2) shorten the drying time, (3) preserve the vitamin C, and (4) prevent the browning reaction.
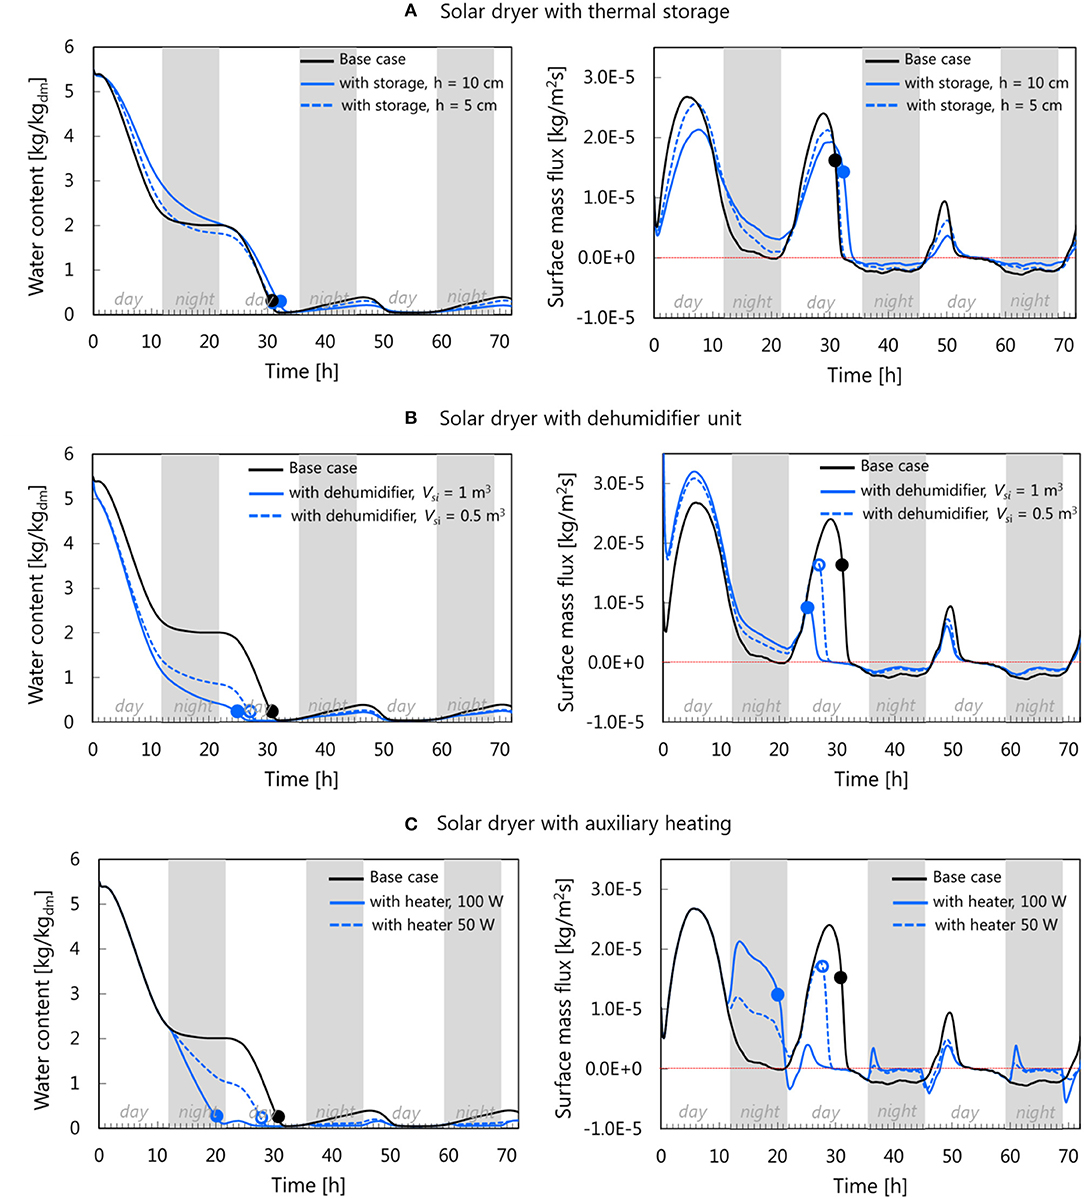
Figure 10. Comparison of water loss and drying rate between the solar drying in base case configuration and solar dryer equipped with (A) thermal storage, (B) dehumidifier unit, and (C) auxiliary heating. The dots represent the water content and surface mass flux at the end of the drying time.
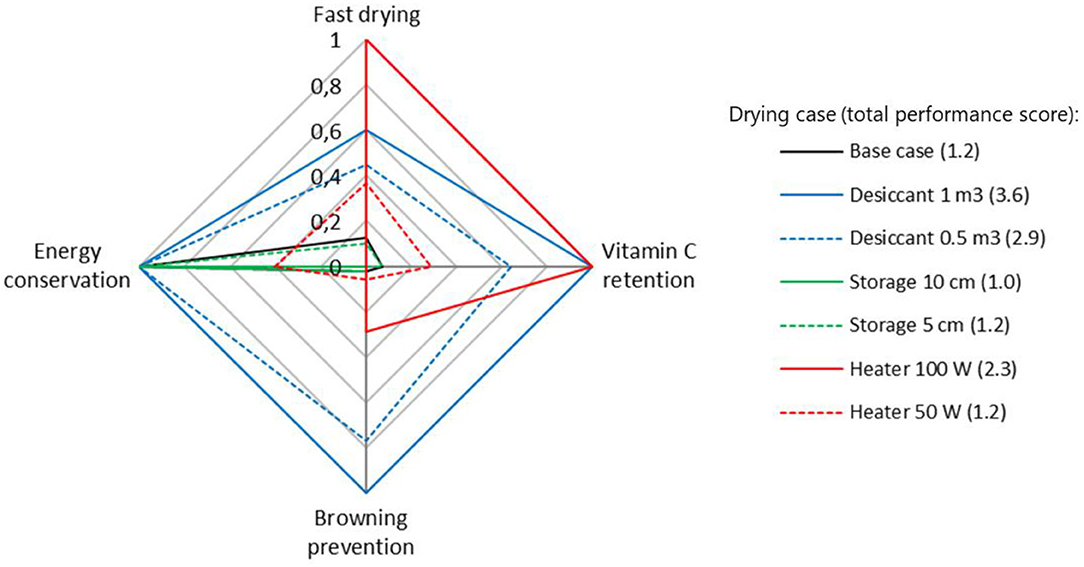
Figure 11. Comparison of the performance of different solar drying strategies assessed by their abilities to conserve energy, shorten the drying time, preserve the vitamin C, and prevent the browning reaction. The value in each category is obtained by normalizing it against the worst (0) and best (1) performance. The number in the bracket is the total score in each drying case. Drying with 1 m3 desiccant has the highest total score of 3.6. These data are only valid for the weather conditions specified in Figure 4.
The scoring of performance metrics is done by normalizing the result against the best and worst-performing case in each metric.
where pmb and pmw are the best and the worst results in each performance metric, respectively. To evaluate the effectiveness of improvement strategies, the total performance score of each drying case is compared to the one of the base case (1.2).
Drying With Thermal Storage
The addition of heat storage aims to make the drying system more independent of the weather conditions. As explained in section Geometry and Boundary Conditions, thermal storage dampens the drying-air temperature and RH fluctuations between the day and night. Compared to the base case, the drying rate is reduced during the daytime, as heat is also used for thermal storage and not only to heat up the air. The drying rate is higher during the nighttime as the stored heat is released again. The product can, therefore, still effectively dry during nighttime (Figure 10A). In this case, drying proceeds more continuously until the product is sufficiently dried to a water activity aw of 0.6. Regarding the drying time, drying with thermal storage shows to prolong the drying by 1 and 2 h for the 5 and 10 cm of the storage height, respectively. The higher drying rate during the night does not compensate for the lower drying rate during the daytime. The reason is that too much heat is used to load the storage unit during the daytime for the case that was considered in this study. One way to mitigate this problem in part is to load the thermal storage unit already with heat the day before starting the drying process. The fruit quality prediction suggests that there is no significant difference in the vitamin C decay and the progress of browning reaction between the thermal storage and the base case (Figure 11). Drying with heat storage gives the total performance scores of 1.2 and 1.0 for the 10 cm case and 5 cm case, respectively. No improvement or even a lower score is found compared to the base case. Note that this conclusion is based on sand as thermal storage. Other material might give different results due to their thermo-physical characteristics. Water can be considered as practical storage material due to its availability, low cost, and good heat capacity (Bennamoun, 2013).
Drying With Dehumidifier
The reduction of drying air humidity using a dehumidifier is found to effectively increase the drying rate during the day and allows also to dry more effectively during the night, compared to the base case (Figure 10B). Drying with a 0.5 and 1 m3 volume of desiccant dry both faster than the base case, up to a difference of 17% with the base case drying time. Another benefit of drying with a desiccant is that the drying temperature can be kept lower, similar to the base case. The combination of short drying time and low-temperature drying makes this drying strategy superior to the others in three categories: the best energy conservation, the best vitamin C retention (43% better than the base case) and reduced browning (50% lower absorbance than the base case) (Figure 10). Consequently, the total performance scores (3.6 for 1 m3 case and 2.9 for 0.5 m3) are superior compared to the base case's.
It should be noted that the performance of solar drying using a dehumidifier depends on the amount of desiccant. Dehumidification has been associated with a high cost and leading to a complicated system especially when desiccant regeneration is required. In this study, the desiccant is only used for one 3-day drying run, thus without regeneration. It justifies the assumption of no-energy consumption for solar drying using the humidifier unit (Figure 11). However, if the desiccant needs to be reused in the subsequent drying process, the regeneration must be done and energy is required to dry the desiccant. A study by Chramsa-ard et al. (2013) shows that by the integration of regeneration system in the dryer, as such that the desiccant is regenerated by using only solar energy, the solar collector efficiency is decreased by 3% because part of the collected heat from solar radiation is used for desiccant regeneration.
Drying With Auxiliary Heating
The usage of auxiliary heating during the nighttime ensures the continuity of the drying process by increasing the air temperature up to 20°C (Figure 5C), inducing a short drying time (Figure 10C). Drying with an additional power of 100 W decreased the drying time by 33%, the fastest compared to other improvement strategies. It even gives a comparable drying time as drying at a constant temperature of 60°C, although the drying temperature never reaches 60°C during nighttime. In fact, the drying rate during the first night is higher in the 100 W case (compare Figure 7B and Figure 10C). The preceding low drying rate period at the late daytime (in this drying case, from 6 to 11 h, where 0 h refers to the start of the drying at 8 am) results in a smaller gradient of water content between the core and surface of the tissue. As a consequence, the surface water activity in the 100 W case is higher compared to the drying at 60°C, thus higher drying rate. While a short drying time is preferable for vitamin C retention, an increase in temperature at nighttime accelerates the browning reaction. Yet, in the 100 W case, the final browning is 19% less than in the base case (Figure 11) due to the shorter drying time. The 100 W case is the worst performer for energy conservation with 0 score, as it consumes the most energy at the end of the drying (0.92 kWh). The 50 W case consumes 0.55 kWh of energy and gets a score of 0.37 for energy conservation. The total score for the 100 W case is 2.3, which is better than the base case. The total score for the 50 W case (1.2) is similar to the base case.
The simulated case of drying with 100 W auxiliary heating is found to be the best option when it comes in reducing the drying time, compared to the other simulated cases. However, care has to be taken that the additional heat does not result in a drastic temperature increase, which can result in an acceleration of quality degradation. In this case, temperature control must be added to limit the maximum temperature of the drying air. Moreover, the additional energy needed for the heating comes at an additional cost. An innovative method is, e.g., photovoltaic- integrated solar drying, where the energy in the form of electricity is obtained in a cheap, clean and sustainable way (Kumar et al., 2016).
Toward a Physics-Based Digital Twin to Control the Solar Drying Process
Solar drying is a strongly weather-dependent process. Therefore, every drying run is different thus unique. In comparison to conventional hot-air convective drying at a constant temperature, it is much more challenging to determine when a solar drying process is finished, so when the water activity drops below the safety threshold. The physics-based model presented in this paper can be used to predict when the drying process is completed to avoid over- or under drying of the produce for every single drying run. Information on the dehydration state of the product would help operators to decide when to stop drying. To do so, the physics-based modeling needs to be coupled in real-time to the real-world drying process. Note that the modeling should be fast enough to be able to do it in real-time.
By coupling a physics-based model with the real world, a digital twin of the dried product is created. A digital twin is defined as a virtual representation of the product to be dried. The advantage of a digital twin is that it can predict real-time when drying can be stopped, based on the prediction of reaching the threshold for water activity of the tissue. This information will complement the direct water activity measurement of the product during drying. A digital twin contains all essential elements to capture the relevant kinetics of the heat and mass transfer processes inside and around the product and the associated food quality degradation processes. The twin is linked to the real fruit that is dried by relying on sensor data of the measured environmental conditions in its proximity as an input, for example, the weather data. This way, an over-dried product, as well as the rehydration of a dried product leading to a prolongation of the drying process, can be avoided.
In this study, the first step toward such a digital twin is built, by feeding the physics-based model with different weather data. This digital twin is used to identify the variations in drying time and the final quality of the solar drying process due to weather variations. The drying process using the normal solar dryer (basic configuration) and with auxiliary heating is simulated for three different weather conditions, namely 3-day periods of cloudy, sunny, and rainy days. The drying time, vitamin C retention and color change are tabulated in Table 4. The shortest drying time using the normal solar dryer (30 h) is achieved during sunny weather conditions. This period also gives the maximum vitamin C retention (34%) and the least browning (1.7 Au). In the rainy period, the drying was not finished in 3 days as the average water activity of the tissue was still above the critical value of 0.6. The vitamin C retention is at 5% and still decreased further when continuing the drying process. The same applies to the browning reaction that still increased after 3 days of drying. Drying with auxiliary heating results in a drying time from 22 h (sunny days) to 32 h (rainy days). More importantly, the variation in quality attributes due to weather conditions can be reduced, when compared to the base case. The vitamin C retention varies between 26% (rainy days) to 34% (cloudy days), while browning absorbance lies between 1.8 (cloudy days) and 2.8 (rainy days).
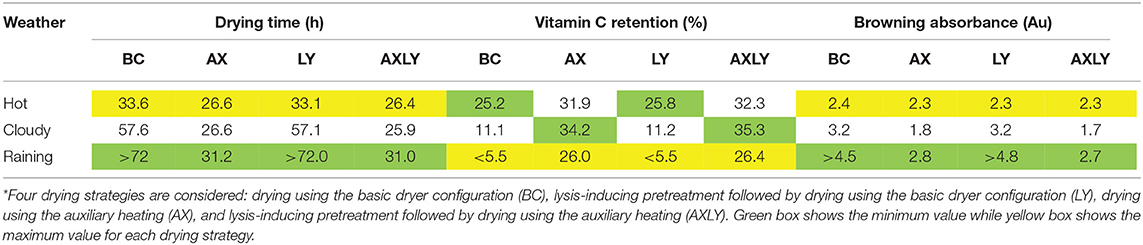
Table 4. Drying time, vitamin C, and browning reaction for different solar drying improvement strategies* and weather conditions.
The coupling of the physics-based model with weather data, so building a digital twin, enabled to indicate differences in drying time and final product quality between different drying runs. In the future, such a digital twin can be used in real-time to control a solar dryer for every drying run, if the physics-based model is fed by real-time weather data. In addition, weather forecast data can also be used by the digital twin to make predictions of the future progression of the drying process. For example, in a solar dryer with auxiliary heating, the digital twin will determine when it is the right time to turn on the heater and how much power the system needs. The aim is to achieve an optimum trade-off between drying time and product quality based on the simulated moisture content and temperature. The solar drying models can be refined to accurately model the solar dryer. The dryer model (Supplementary Material) can be further improved to account for the inclination factor of the solar collector. The inclination factor depends on the time and geographical coordinate where the dryer is located. In case a solar tracker is used to find the optimum inclination angle, its energy consumption should also be considered in energy assessment of the whole system. Future study for validation of the proposed physics-based model is also suggested.
Conclusion
This study shows a mechanistic drying model that is coupled with fruit quality decay models and weather data to create a digital twin of an apple fruit undergoing a solar drying process. The model predicts the drying time and quality attributes during various drying conditions, and provides spatial and temporal details of the governing drying variables such as moisture content and temperature distribution within the fruit. The modeling complements the information obtained from the direct measurement in the dryer, such as drying air conditions and water activity of the product. It is demonstrated that although solar drying is known to have a longer drying time than conventional hot-air drying due to the intermittency of solar radiation, it may result in drying conditions that are more beneficial for quality improvement (vitamin C retention or product browning). This is because generally, the product is exposed to lower temperatures compared to hot-air drying that is normally used in the drying industry. In the specified dryer configuration, additional thermal storage is not effective in reducing the drying time and improving product quality. In this case, dehumidification of drying air gives a significantly higher total performance score among the other improvement strategies. Dehumidification is superior in retaining the vitamin C content and prohibiting the browning reaction. The drying time is also reduced by 17%, compared to the drying without improvement strategy. On the other hand, the use of auxiliary heating is the best strategy to decrease the drying time (up to 33%). Drying with auxiliary heating is also found to be effective in narrowing down the variation of drying time, vitamin C retention, and browning reaction when the weather conditions vary, thus can be perceived as an all-round solution to improve the solar drying process. This study also shows that inducing cell membrane breakage (lysis) before drying via pretreatment is less effective in decreasing the drying time when drying is conducted at high temperatures. As such, it is not that effective for the solar drying process, where the normal daytime air temperature is in the range of 40–60°C.
Data Availability Statement
The original contributions generated for the study are included in the article/Supplementary Material, further inquiries can be directed to the corresponding author/s.
Author Contributions
TD conceptualized the study, wrote the project proposal to secure funding (with input from JC), did project administration, and was the Principal Investigator (PI) in the project. KP, TD, and JC developed the methodology. KP performed the multi-physics simulations. KP performed data analysis, interpretation, and visualization of the results. TD and JC supervised KP. KP wrote the original draft with key inputs from TD. TD and JC critically reviewed and edited the manuscript. KP revised the manuscript on the basis of these suggestions. All authors contributed to the article and approved the submitted version.
Conflict of Interest
The authors declare that the research was conducted in the absence of any commercial or financial relationships that could be construed as a potential conflict of interest.
Acknowledgments
We acknowledged the support of the Swiss National Science Foundation for funding the project (project number 200021_160047) and their open access publication fund (20AC-1_202173).
Supplementary Material
The Supplementary Material for this article can be found online at: https://www.frontiersin.org/articles/10.3389/fsufs.2020.606845/full#supplementary-material
References
Aboul-Enein, S., El-Sebaii, A. A., Ramadan, M. R. I., and El-Gohary, H. G. (2000). Parametric study of a solar air heater with and without thermal storage for solar drying applications. Renew. Energy 21, 505–522. doi: 10.1016/S0960-1481(00)00092-6
Ait Hammou, Z., and Lacroix, M. (2006). A hybrid thermal energy storage system for managing simultaneously solar and electric energy. Energy Conv. Manag. 47, 273–288. doi: 10.1016/j.enconman.2005.01.003
Arun, K. R., Kunal, G., Srinivas, M., Kumar, C. S. S., Mohanraj, M., and Jayaraj, S. (2020). Drying of untreated musa nendra and momordica charantia in a forced convection solar cabinet dryer with thermal storage. Energy 192:116697. doi: 10.1016/j.energy.2019.116697
ASHRAE (2006). “Chapter 9 - Thermal properties of food,” in 2006 ASHRAE Handbook – Refrigeration (Atlanta, GA: ASHRAE).
Atalay, H., Turhan Çoban, M., and Kincay, O. (2017). Modeling of the drying process of apple slices: application with a solar dryer and the thermal energy storage system. Energy 134, 382–391. doi: 10.1016/j.energy.2017.06.030
Ayyappan, S., Mayilsamy, K., and Sreenarayanan, V. V. (2016). Performance improvement studies in a solar greenhouse drier using sensible heat storage materials. Heat Mass Transfer 52, 459–467. doi: 10.1007/s00231-015-1568-5
Babar, O. A., Tarafdar, A., Malakar, S., Arora, V. K., and Nema, P. K. (2020). Design and performance evaluation of a passive flat plate collector solar dryer for agricultural products. J Food Process Eng. 43:e13484. doi: 10.1111/jfpe.13484
Bal, L. M., Satya, S., and Naik, S. N. (2010). Solar dryer with thermal energy storage systems for drying agricultural food products: a review. Renew. Sustain. Energy Rev. 14, 2298–2314. doi: 10.1016/j.rser.2010.04.014
Bennamoun, L. (2013). Improving solar dryers' performances using design and thermal heat storage. Food Eng. Rev. 5, 230–248. doi: 10.1007/s12393-013-9073-4
Bonazzi, C., and Dumoulin, E. (2014). “Quality changes in food materials as influenced by drying processes,” in Modern Drying Technology, eds E. Tsotsas, and A. Mujumdar (Weinheim: Wiley-VCH Verlag GmbH & Co. KGaA), 1–20. doi: 10.1002/9783527631728
Bonet, J., and Wood, R. D. (2008). Nonlinear Continuum Mechanics for Finite Element Analysis, 2nd Edn. Cambridge: Cambridge University Press. doi: 10.1017/CBO9780511755446
Castro, A. M., Mayorga, E. Y., and Moreno, F. L. (2019). Mathematical modelling of convective drying of feijoa (Acca sellowiana Berg) slices. J Food Eng. 252, 44–52. doi: 10.1016/j.jfoodeng.2019.02.007
Chilton, T. H., and Colburn, A. P. (1934). Mass transfer (absorption) coefficients prediction from data on heat transfer and fluid friction. Ind. Eng. Chem. 26, 1183–1187. doi: 10.1021/ie50299a012
Chramsa-ard, W., Jindaruksa, S., Sirisumpunwong, C., and Sonsaree, S. (2013). Performance evaluation of the desiccant bed solar dryer. Energy Proced. 34, 189–197. doi: 10.1016/j.egypro.2013.06.747
Damos, P., Colomar, L.-A. E., and Ioriatti, C. (2015). Integrated fruit production and pest management in europe: the apple case study and how far we are from the original concept? Insects 6, 626–657. doi: 10.3390/insects6030626
Datta, A. K., van der Sman, R., Gulati, T., and Warning, A. (2012). Soft matter approaches as enablers for food macroscale simulation. Faraday Discuss. 158:435. doi: 10.1039/c2fd20042b
Defraeye, T., Blocken, B., and Carmeliet, J. (2012). Analysis of convective heat and mass transfer coefficients for convective drying of a porous flat plate by conjugate modelling. Int. J. Heat Mass Transfer 55, 112–124. doi: 10.1016/j.ijheatmasstransfer.2011.08.047
Defraeye, T., and Radu, A. (2018). Insights in convective drying of fruit by coupled modeling of fruit drying, deformation, quality evolution and convective exchange with the airflow. Appl. Ther. Eng. 129, 1026–1038. doi: 10.1016/j.applthermaleng.2017.10.082
Defraeye, T., and Verboven, P. (2017). Convective drying of fruit: role and impact of moisture transport properties in modelling. J Food Eng. 193, 95–107. doi: 10.1016/j.jfoodeng.2016.08.013
Devahastin, S., and Niamnuy, C. (2010). Modelling quality changes of fruits and vegetables during drying. Int. J. Food Sci. Technol. 45, 1755–1767. doi: 10.1111/j.1365-2621.2010.02352.x
Dina, S. F., Ambarita, H., Napitupulu, F. H., and Kawai, H. (2015). Study on effectiveness of continuous solar dryer integrated with desiccant thermal storage for drying cocoa beans. Case Stud. Ther. Eng. 5, 32–40. doi: 10.1016/j.csite.2014.11.003
Gulati, T., and Datta, A. K. (2015). Mechanistic understanding of case-hardening and texture development during drying of food materials. J. Food Eng. 166, 119–138. doi: 10.1016/j.jfoodeng.2015.05.031
Gulati, T., Zhu, H., and Datta, A. K. (2016). Coupled electromagnetics, multiphase transport and large deformation model for microwave drying. Chem. Eng. Sci. 156, 206–228. doi: 10.1016/j.ces.2016.09.004
Hodali, R., and Bougard, J. (2001). Integration of a desiccant unit in crops solar drying installation: optimization by numerical simulation. Energy Conv. Manag. 42, 1543–1558. doi: 10.1016/S0196-8904(00)00159-X
Jain, D., and Tewari, P. (2015). Performance of indirect through pass natural convective solar crop dryer with phase change thermal energy storage. Renew. Energy 80, 244–250. doi: 10.1016/j.renene.2015.02.012
Kabeel, A. E. (2009). Adsorption-desorption operations of multilayer desiccant packed bed for dehumidification applications. Renew. Energy 34, 255–265. doi: 10.1016/j.renene.2008.04.011
Kiburi, F. G., Kanali, C. L., Kituu, G. M., Ajwang, P. O., and Ronoh, E. K. (2020). Performance evaluation and economic feasibility of a solar-biomass hybrid greenhouse dryer for drying Banana slices. Renew. Energy Focus 34, 60–68. doi: 10.1016/j.ref.2020.06.009
Kumar, M., Sansaniwal, S. K., and Khatak, P. (2016). Progress in solar dryers for drying various commodities. Renew. Sustain. Energy Rev. 55, 346–360. doi: 10.1016/j.rser.2015.10.158
Labuza, T. P., and Altunakar, B. (2008). “Water activity prediction and moisture sorption isotherms,” in Water Activity in Foods: Fundamentals and Applications (Oxford: Blackwell Publishing Ltd.). 109–154. doi: 10.1002/9780470376454.ch5
Li, Q., Tehrani, S. S. M., and Taylor, R. A. (2017). Techno-economic analysis of a concentrating solar collector with built-in shell and tube latent heat thermal energy storage. Energy 121, 220–237. doi: 10.1016/j.energy.2017.01.023
Link, J. V., Tribuzi, G., and Laurindo, J. B. (2017). Improving quality of dried fruits: a comparison between conductive multi-flash and traditional drying methods. LWT - Food Sci Technol. 84, 717–725. doi: 10.1016/j.lwt.2017.06.045
Madhlopa, A., and Ngwalo, G. (2007). Solar dryer with thermal storage and biomass-backup heater. Solar Energy 81, 449–462. doi: 10.1016/j.solener.2006.08.008
Maeda, E. E., and Salunkhe, D. K. (1981). Retention of ascorbic acid and total carotene in solar dried vegetables. J. Food Sci. 46, 1288–1290. doi: 10.1111/j.1365-2621.1981.tb03047.x
Maloney, J. O. (2007). Perrys' Chemical Engineering Handbook. New York, NY: McGraw-Hill Professional.
Manrique, R., Vásquez, D., Chejne, F., and Pinzón, A. (2020). Energy analysis of a proposed hybrid solar-biomass coffee bean drying system. Energy 202:117720. doi: 10.1016/j.energy.2020.117720
Miranda, G., Berna, A., and Mulet, A. (2019). Dried-fruit storage: an analysis of package headspace atmosphere changes. Foods 8:56. doi: 10.3390/foods8020056
Mujumdar, A. S. (2014). Handbook of Industrial Drying, 4th Edn. Boca Raton, FL: CRC Press. doi: 10.1201/b17208
Murali, S., Amulya, P. R., Alfiya, P. V., Delfiya, D. S. A., and Samuel, M. P. (2020). Design and performance evaluation of solar - LPG hybrid dryer for drying of shrimps. Renew. Energy 147, 2417–2428. doi: 10.1016/j.renene.2019.10.002
Mustapha, M. K., Salako, A. F., Ademola, S. K., and Adefila, I. A. (2014). Qualitative performance and economic analysis of low cost solar fish driers in Sub-Saharan Africa. J. Fisheries 2:64. doi: 10.17017/jfish.v2i1.2014.23
Onwude, D. I., Hashim, N., Abdan, K., Janius, R., and Chen, G. (2019). Experimental studies and mathematical simulation of intermittent infrared and convective drying of sweet potato (Ipomoea batatas L.). Food Bioprod. Process. 114, 163–174. doi: 10.1016/j.fbp.2018.12.006
Ouaabou, R., Nabil, B., Ouhammou, M., Idlimam, A., Lamharrar, A., Ennahli, S., et al. (2020). Impact of solar drying process on drying kinetics, and on bioactive profile of Moroccan sweet cherry. Renew. Energy 151, 908–918. doi: 10.1016/j.renene.2019.11.078
Perera, C. O. (2005). Selected quality attributes of dried foods. Drying Technol. 23, 717–730. doi: 10.1081/DRT-200054180
Prawiranto, K., Carmeliet, J., and Defraeye, T. (2020). Identifying in silico how microstructural changes in cellular fruit affect the drying kinetics. Soft Matter. 16, 9929–9945. doi: 10.1039/D0SM00749H
Purusothaman, M., and Valarmathi, T. N. (2019). Computational fluid dynamics analysis of greenhouse solar dryer. Int. J. Ambient Energy 40, 894–900. doi: 10.1080/01430750.2018.1437567
Ratti, C., and Mujumdar, A. (2004). “Drying of fruits,” in Processing Fruits, eds D. M. Barrett, L. Somogyi, H. S. Ramaswamy (Boca Raton, FL: CRC Press), 127–160. doi: 10.1201/9781420040074.ch7
Reyes, A., Mahn, A., Cubillos, F., and Huenulaf, P. (2013). Mushroom dehydration in a hybrid-solar dryer. Energy Conv. Manag. 70, 31–39. doi: 10.1016/j.enconman.2013.01.032
Reyes, A., Vásquez, J., Pailahueque, N., and Mahn, A. (2019). Effect of drying using solar energy and phase change material on kiwifruit properties. Drying Technol. 37, 232–244. doi: 10.1080/07373937.2018.1450268
Rodríguez-Ramos, F., Leiva-Portilla, D., Rodríguez-Núñez, K., Pacheco, P., and Briones-Labarca, V. (2020). Mathematical modeling and quality parameters of Salicornia fruticosa dried by convective drying. J. Food Sci. Technol. doi: 10.1007/s13197-020-04556-6
Román-Roldán, N., López-Ortiz, A., Ituna-Yudonago, J., García-Valladares, O., and Pilatowsky-Figueroa, I. (2019). Computational fluid dynamics analysis of heat transfer in a greenhouse solar dryer “chapel-type” coupled to an air solar heating system. Energy Sci. Eng. 7, 1123–1139. doi: 10.1002/ese3.333
Salih, S. M., Jalil, J. M., and Najim, S. E. (2019). Experimental and numerical analysis of double-pass solar air heater utilizing multiple capsules PCM. Renew. Energy 143, 1053–1066. doi: 10.1016/j.renene.2019.05.050
Simo-Tagne, M., and Bennamoun, L. (2018). Numerical study of timber solar drying with application to different geographical and climatic conditions in Central Africa. Solar Energy 170, 454–469. doi: 10.1016/j.solener.2018.05.070
Smitabhindu, R., Janjai, S., and Chankong, V. (2008). Optimization of a solar-assisted drying system for drying bananas. Renew. Energy 33, 1523–1531. doi: 10.1016/j.renene.2007.09.021
Stamenković, Z., Radojčin, M., Pavkov, I., Bikić, S., Ponjičan, O., Bugarin, R., et al. (2020). Ranking and multicriteria decision making in optimization of raspberry convective drying processes. J. Chemometr. 34:3224. doi: 10.1002/cem.3224
Tarigan, E. (2018). Mathematical modeling and simulation of a solar agricultural dryer with back-up biomass burner and thermal storage. Case Stud. Therm. Eng. 12, 149–165. doi: 10.1016/j.csite.2018.04.012
Timoumi, S., Mihoubi, D., and Zagrouba, F. (2007). Shrinkage, vitamin C degradation and aroma losses during infra-red drying of apple slices. LWT Food Sci. Technol. 40, 1648–1654. doi: 10.1016/j.lwt.2006.11.008
Togrul, I. T., and Pehlivan, D. (2004). Modelling of thin layer drying kinetics of some fruits under open-air sun drying process. J. Food Eng. 65, 413–425. doi: 10.1016/j.jfoodeng.2004.02.001
Vaikousi, H., Koutsoumanis, K., and Biliaderis, C. G. (2008). Kinetic modelling of non-enzymatic browning of apple juice concentrates differing in water activity under isothermal and dynamic heating conditions. Food Chem. 107, 785–796. doi: 10.1016/j.foodchem.2007.08.078
Van Boekel, M. A. J. S. (2008). Kinetic modeling of food quality: a critical review. Compr. Rev. Food Sci. Food Safety 7, 144–158. doi: 10.1111/j.1541-4337.2007.00036.x
Vásquez, J., Reyes, A., and Pailahueque, N. (2019). Modeling, simulation and experimental validation of a solar dryer for agro-products with thermal energy storage system. Renew. Energy 139, 1375–1390. doi: 10.1016/j.renene.2019.02.085
Villota, R., and Hawkes, J. G. (2018). “Reaction kinetics in food systems,” in Handbook of Food Engineering, eds D. R. Heldman, D. B. Lund, and C. Sabliov (Boca Raton, FL: CRC Press), 225–484. doi: 10.1201/9780429449734-3
Wang, C. X., Wang, L., and Thomas, C. R. (2004). Modelling the mechanical properties of single suspension-cultured tomato cells. Ann. Botany 93, 443–453. doi: 10.1093/aob/mch062
Wiberg, R., and Lior, N. (2005). Heat transfer from a cylinder in axial turbulent flows. Int. J. Heat Mass Transfer 48, 1505–1517. doi: 10.1016/j.ijheatmasstransfer.2004.10.015
Zhang, Y., Zhang, M., Zhang, H., and Yang, Z. (2011). “Solar drying for agricultural products in China,” 2011 International Conference on New Technology of Agricultural (Zibo), 715–719. doi: 10.1109/ICAE.2011.5943895
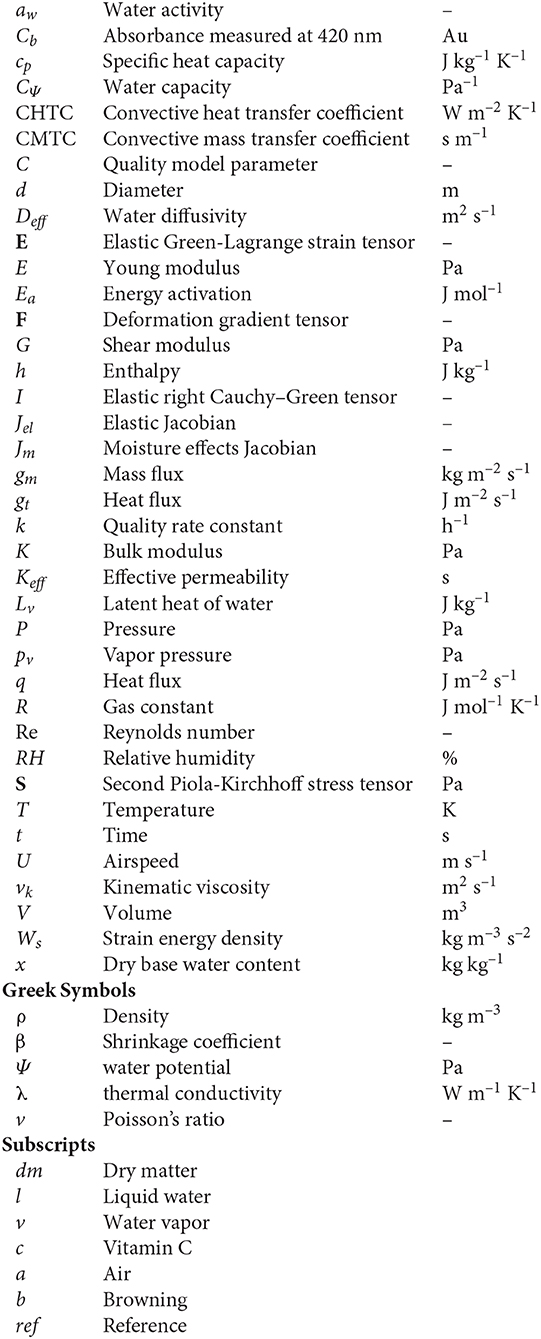
Nomenclature
Keywords: solar drying, multiphysics modeling and simulation, weather data, fruit quality, energy consumption
Citation: Prawiranto K, Carmeliet J and Defraeye T (2021) Physics-Based Digital Twin Identifies Trade-Offs Between Drying Time, Fruit Quality, and Energy Use for Solar Drying. Front. Sustain. Food Syst. 4:606845. doi: 10.3389/fsufs.2020.606845
Received: 15 September 2020; Accepted: 07 December 2020;
Published: 28 January 2021.
Edited by:
Miriam Dupas Hubinger, Campinas State University, BrazilReviewed by:
João Borges Laurindo, Federal University of Santa Catarina, BrazilAndrea Charbel, Universidade Federal de São João del-Rei, Brazil
Copyright © 2021 Prawiranto, Carmeliet and Defraeye. This is an open-access article distributed under the terms of the Creative Commons Attribution License (CC BY). The use, distribution or reproduction in other forums is permitted, provided the original author(s) and the copyright owner(s) are credited and that the original publication in this journal is cited, in accordance with accepted academic practice. No use, distribution or reproduction is permitted which does not comply with these terms.
*Correspondence: Thijs Defraeye, dGhpanMuZGVmcmFleWVAZW1wYS5jaA==