 Annalyse Kehs1*
 Peter McCloskey1
 John Chelal2
 Derek Morr3Stellah Amakove2Bismark Plimo2
 John Mayieka2
 Gladys Ntango2Kelvin Nyongesa2
 Lawrence Pamba2Melodine Jeptoo2James Mugo2Mercyline Tsuma2Wincate Mukami2
 Winnie Onyango2
 David Hughes1,4*
- 1Department of Entomology and Biology, Pennsylvania State University, University Park, PA, United States
- 2Department of Agriculture and Biotechnology, Moi University, Eldoret, Kenya
- 3Office of the Associate CIO for Research, Pennsylvania State University, University Park, PA, United States
- 4Plant Production and Protection Division, United Nations Food and Agriculture Organization, Rome, Italy
A major bottleneck to the application of machine learning tools to satellite data of African farms is the lack of high-quality ground truth data. Here we describe a high throughput method using youth in Kenya that results in a cost-effective method for high-quality data in near real-time. This data is presented to the global community, as a public good and is linked to other data sources that will inform our understanding of crop stress, particularly in the context of climate change.
Introduction
A major goal of the global community interested in leveraging Earth Observations for smallholder farmers is to identify the composition of crops in farmers' fields. A near real-time database of the location and type of crops that are grown would be very helpful for multiple stakeholders. These range from governments and markets wishing to predict yield to epidemiologists and Earth scientists interested in crop-specific predictions of pests and climate change effects at the field level (Mcnally, 2019). The importance of Earth Observations (EO) in achieving the United Nations Sustainable Development Goals was recently emphasized (Whitcraft et al., 2019).
Researchers have successfully leveraged Earth Observations to identify crop composition in the United States (US) and the European Union (EU) farms (Mcnally, 2019). In those settings, fields tend to be monocropped and the boundaries are regular with uniform planting dates throughout a region. This is not the case for smallholder farms in African countries. Intercropping and an abundance of weeds are very common. In addition, trees are often present inside the fields which proves a challenge for accurate satellite detection of crops. Further, the field boundaries are highly irregular and the low availability of seed and necessary farm inputs means fields might be only partially sown or sown with several different varieties.
While the remote observation of African farms with satellites would appear challenging with respect to farms elsewhere in the world, the need is certainly great (Whitcraft et al., 2019). Hunger is on the rise in almost all subregions of Africa, where the prevalence of undernourishment has reached levels of 22.8% in sub-Saharan Africa (FAO, 2019). Invasive pests like the Fall Armyworm (Day et al., 2017) and severe changes in weather (Giordano and Bassini, 2019) associated with climate change are making a bad situation worse (Global Report on Food Crises, 2019).
It is possible that high-resolution satellite data such as the 3-m resolution Dove satellites (Planet Team, 2017) from Planet or the 0.46-m resolution satellites from Maxar would help identify the crops within fields1. However, Maxar's high cost and low flyover rate preclude their utility for a cross-continental dynamic map which is updated each season as crops change. Therefore, the pragmatic approach likely requires the use of free, open-access satellite data such as the European Space Agency's (ESA) Copernicus system or the US National Aeronautics and Space Administration's (NASA) Landsat data.
If the medium resolution satellites like Sentinel and Landsat are to be effectively used in the African smallholder farms context then it is very clear that accurate ground truth data, vital to validating predictive models, is the rate-limiting step. Moreover, the ground truth data must be open access to allow the global community to identify where the successes and shortcomings lie. Here we describe a high throughput method of accurate ground truth data collection from a smallholder farm setting in Kenya that not only results in high-quality data but the availability of the data for the global community. Further, we demonstrate how our data can be combined with other relevant data streams such as the United Nations Food and Agricultural Organization's (UN FAO) Water productivity through open-access of remotely sensed derived data tool2 (WaPOR) and the African Soil Health Initiative. Our approach has the added value of directly employing young African scientists and building capacity in African science.
Methods
Mapping Agents
We conducted in-field surveys in Busia County, Kenya throughout May 2019. We will refer to this time period throughout the rest of the paper as season one due to our collection being in the middle of Kenya's first growing season of the calendar year (Place, 2006). Busia County is one of the 47 counties of Kenya. The county has a land area of 1,694.5 km2 and has an estimated population of 743,946 persons from the 2009 census (Busia County County Integrated Development Plan 2018-2022, 2018). According to the Busia County 2018 Integrated Development Plan:
The County is situated at the extreme Western region of Kenya and borders Bungoma to the North, Kakamega to the East and Siaya to the South East, Lake Victoria to the South West and the Republic of Uganda to the West. It lies between latitude 0 and 0° 45 North and longitude 34° 25 East. (p. 2)
We developed a digital survey application using the Open Data Kit3 Build platform. Field surveys were first performed by a team of two researchers who traveled from the USA to Busia, Kenya in season one. In August 2019 we implemented an alternative method which engaged Kenyan youth. We will refer to this time period throughout the rest of the paper as season two due to the data collection being in Kenya's second growing season of the calendar year (Place, 2006). We targeted youth because of the recognized high unemployment in Kenya and other African countries (FAO, 2018). We were interested in determining whether collecting ground truth data and conducting in-field surveys could be a viable job option for Kenyan youth. We identified and hired 10 recent graduates (this later became 11 when one of the field members moved to a different project) in Agriculture from Moi University in Eldoret, Kenya (authors #5-15 of this paper). The graduates were selected and interviewed by Dr. John Chelal (author #3 of this paper). Members of the Kenyan survey team were paired together based on three main criteria; gender, background/experience and personality, with respective order of importance. Each pair comprised of one male and female because of the recognized cultural and tribal gender inequality. Both persons within the pair studied in a different program at Moi University (Agricultural Extension Education or Agricultural Biotechnology) to encourage collaboration between the two and complement the strengths/weaknesses of the other. One week of training was conducted to educate the 10 graduates on how to use the ODK Collect application with our digital survey to map fields and conduct in-field surveys. The pairs stayed locally within the communities of the regions they were assigned. Each member of the Kenyan survey team was paid a daily allowance of $14/day for salary, $4/day for transport, $2.5/week for call data, and $20/month for 15GB of internet data. The salary includes accommodation costs and is within the rates of internship allowance offered by local companies and institutions. The transport allowance covers the cost to move with each pair on one motorbike with appropriate safety equipment each day. Once arrived at their destination, field to field movements were done on foot. The airtime data was used for communication to the lead farmers (LF), following farmers (FF) and seed entrepreneurs (SE). The mobile data was used to upload images and surveys to a shared Google Drive account and for daily communication with the team in the United States via WhatsApp.
We had pre-existing connections in the community through an Irish charity called Self Help Africa (SHA) which had set up the Lead Farmer and Following Farmer model with each Lead Farmer having between 20 and 35 following farmers. Based on this existing network, the Kenyan survey team were distributed evenly across Busia county such that each pair of the Kenyan survey team was based near a different cluster of SHA Lead Farmers. The Kenyan survey team worked with the Lead Farmers in their region, who would then introduce them to additional community members with fields. The Kenyan survey team worked with the Lead Farmers and Following Farmers in their community to conduct field surveys. They had two objectives when they traveled to the field that addressed both research and operations of PlantVillage. The research objective was to collect field data to use as ground-truth training and validation data for satellite imagery-based computer vision models. The operations objective included engaging with farmers and co-learning about the challenges and solutions farmers experience every day. The Kenyan survey team learned the traditional and local knowledge in the area and applied it to their agricultural background knowledge to work with the farmers and come up with new solutions to farmer challenges, whether reoccurring or new. Due to this dual objective framework, there was no pre-selection process for which fields to survey or sample. The protocol was to meet with the Lead Farmer in that region and walk through their farms and then their neighbor's farms, mapping, educating, and learning. There was no specific field selection process. The Kenyan survey team collected data from all fields within the region and with farmers' consent. We understood the need for a representative sample of data, so we focused on extending our reach longitudinally, capturing fields from North to South Busia County. It is a long county and covers multiple ecological zones from North to South, we sought to collect data from each region to be representative of Busia.
ODK Application and Data Collection Protocol
The ODK survey form was built using ODK Build5. The form was then downloaded to each of the surveyors smartphones to be used with the ODK Collect application. The ODK Collect application is available on the Google Playstore and the specific form used by the Kenyan survey Team is available upon request. The user of the form collects the following information from the farmer for each field to be mapped: GPS location of the field, field boundaries, crop type and the ratio of different crops, the time and date of when the survey was conducted, planting date, harvest date, density of crop, disease prevalence for cassava mosaic virus, brown streak virus, and green mites, and maize fall armyworm, five pictures of the field including at least one landscape overview picture of the field, and any comments. Comments can describe any relevant information with regards to the field. For example, if the field had to be replanted due to lack of rain or low germination rates, or if they used any control methods for diseases or pests. The data was automatically assigned a meta-instance ID, set by ODK Collect and a PlantVillage internal ID, used to differentiate between lead farmers and following farmers fields.
When the survey pair arrive at the field, the protocol was to open the ODK Collect application and begin to fill out a blank survey form. To fill out a blank survey, the farmer is required to be present to answer questions such as when the crop was planted, when it will be harvested, crop variety, if the field was fertilized, etc. Next, a GPS point and shape of the field are collected. There are three options to map the shape of the field. The first input method, which was used in season one, is “Placement by tapping.” This method requires a fair/good cellular data connection to stream satellite imagery sourced from Google Maps. This method also assumes a familiarity with interpreting satellite maps and relating to physical objects on the ground. The second method, “Manual location recording,” requires the user to walk to each vertex of the field and capture a GPS coordinate manually. The third method, “Automatic location recording,” requires that the user walks around the boundary of the field while the application automatically collects location coordinates. The location coordinates are recorded every 20 seconds with an accuracy of ±3 m. The time duration and accuracy requirement are pre-set by the users on the ODK app before starting the collection. Methods two and three do not require a data connection or any previous experience in mapping fields. The Kenyan survey team began mapping the shape of fields using methods two and three until they became experienced at reading satellite images, which occurred within two months of beginning their work. Method three was continually used when the data connection was not strong or roaming due to proximity to Uganda. After collecting the shape of the field, the point location information and the farmer has answered the rest of the survey questions, the form is finalized and saved to be submitted when they arrive back at their home with reliable network to submit.
Local Storage of ODK Survey Forms
During season one, the finalized survey forms were submitted by pulling the forms manually off the phone with ODK Briefcase and aggregated into a comma-separated values file (CSV). The CSV's were then uploaded to Google Drive to store and subsequently shared with others. We also stored the CSV on an external hard drive as a backup. Season 1 data is available as a dataset in the ScholarSphere repository (doi: 10.26207/k40m-1393). In season two, we developed a new method for form submission. This method also uses Google Drive as the submission platform and for storage, however, the finalized forms are uploaded directly to a shared Google Sheet using a data connection. The images captured within the ODK Collect application were stored in Google Drive. Google Drive has limits on the amount of data that can be stored within Google Sheets. As such, it was a temporary step. The long-term storage of the data is in the PlantVillage database, which is an S3 Bucket4 in Amazon Web Services (AWS) and with ScholarSphere, a repository owned and maintained by Pennsylvania State University. The global community can access this data (doi: 10.26207/3swt-8078) through ScholarSphere.
Privacy
We ask the farmers for permission to collect the data from their farms and permission to use that data to improve our understanding of negative effects like pests and climate change. When we visit farms the only privileged data is the name of the farmer and the images collected. The farmer names are not shared with the dataset. The images are hosted as separate works to the field attribute dataset and is under different licensing. The field attribute data (CSV format) is available through ScholarSphere (doi: 10.26207/k40m-1393) with a public domain mark as there is no copyrightable data contained. We did not encounter obstacles to sharing data. The farmers we engaged with clearly understood the twin threats of pests and climate change and understood how their data would be used to help others. We provide farmers with advice both when we collected data on their fields and continuing throughout the seasons to share the application of their data results with associated agronomic advice via SMS.
Water Productivity via WaPOR
The UN FAO has developed a database called the Water Productivities Open-access portal4. This tool provides a series of measurements on water use by crops for Africa and the Middle East (FAO and, 2019). We retrieve the WaPOR data for the locations which have been mapped using the open source WaPOR API. This provides added value to the community as the data on water productivity are presented alongside the crop composition data to give a crop stress measurement. This can be determined from the value of the Actual Evapotranspiration calculation (Allen et al., 1998). This is an evolving product that is intended to be built as a climate change adaptation tool through collective action of the scientific community.
Ethics Statement
This paper does not contain any studies involving animals performed by any of the authors. This paper does not contain any studies involving human participants performed by any of the authors. Ethical approval was not required for the recruitment of the ten graduate students as they are scientific collaborators (authors #5-15 on this paper).
Results
Collection Rate
In season one, 474 fields were surveyed over the course of the month (6th May to 3rd June). The field collection rate was 26 fields/day. The median fields collected per day was 26.5 with a mode of 32 (Figure 1). In season one, the cost of collection per field was $4.02. This data is available to the public under a public domain mark (doi: 10.26207/3swt-8078) with the understanding that the data collected is not copyrightable (excluding the images).
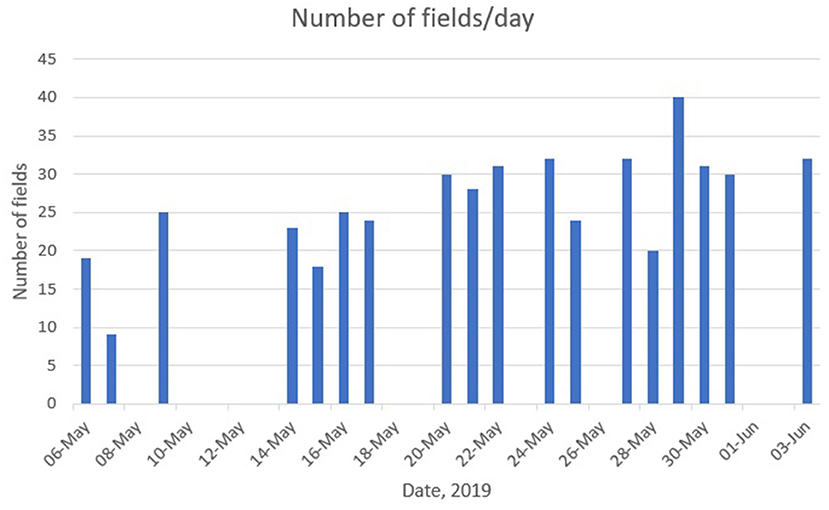
Figure 1. Number of fields surveyed each day between May 6th and June 3rd, 2019 in Busia, Kenya.
In season two we began field collections with the Kenyan survey team. The total number of fields collected between August 13th and December 11th was 10,213. The collection rate was 109 fields/day which equates to 22 fields per pair. The median fields collected per day was 125 with a mode of 137 fields per day (Figure 2). In season two, the cost of collection per field was $1.41.
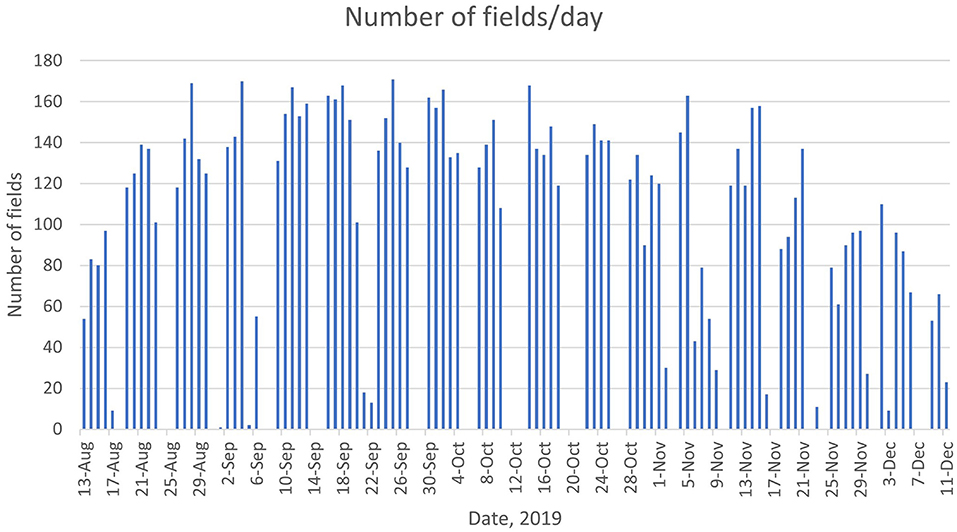
Figure 2. Number of fields surveyed each day between August 13th and December 12th, 2019 in Busia, Kenya.
There was no qualitative or quantitative analysis done on the three different methods of collecting the field boundaries because the remotely sensed data that was combined with the ODK surveys was at 5 km resolution per pixel. Highly accurate coordinates were not required for the work we intended to do.
Composition of Fields
For both the season one and season two collections, our surveys showed that fields were a combination of intercrop and monocrop settings. Intercropped fields were divided into two categories: intercropped with one other crop and intercropped with greater than one other crop. The breakdown of the fields collected from August 13th to December 12th, 2019 by the Kenyan survey team is 67% monocrop and 33% intercrop (Figure 3). Of the intercropped fields collected, 85% are intercropped with one other crop and 15% are intercropped with greater than one other crop (Figure 3). The crop category labeled “Not Listed” includes any crops that were not included in the 10 crops that were determined to be the majority of crops planted in Kenya. Some of the crops that fall into the “Not Listed” category include sweet potato, cotton, cowpea, sesame, kale, tomato, Napier grass, banana, and others.
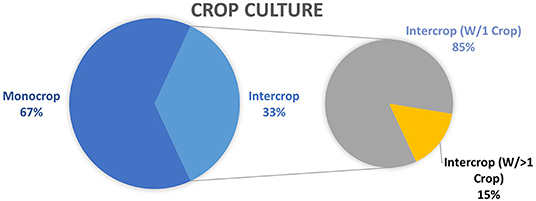
Figure 3. Composition of 10,213 fields surveyed in Busia, Kenya between August 13th and December 12th, 2019.
The distinction between intercropped with one other crop versus intercropped with two or more other crops was made due to the low population of intercropped fields with two or more other crops (15%) out of intercrop field composition.
The analysis of monocrop fields and intercropped fields can be found in Table 1. The “Percentage of Fields” column describes the proportion of all monocrop fields that are made up of each specific crop. Table 2 shows the analysis of intercrop fields with one other crop. The “+” dictates the crop listed plus any other crop. The “Percentage of Fields” column under intercropped fields describes the percentage of the crop plus any other crop out of all of the fields intercropped with one other crop. The combinations of intercropped fields with two or more other crops are broken down further in Table 3.
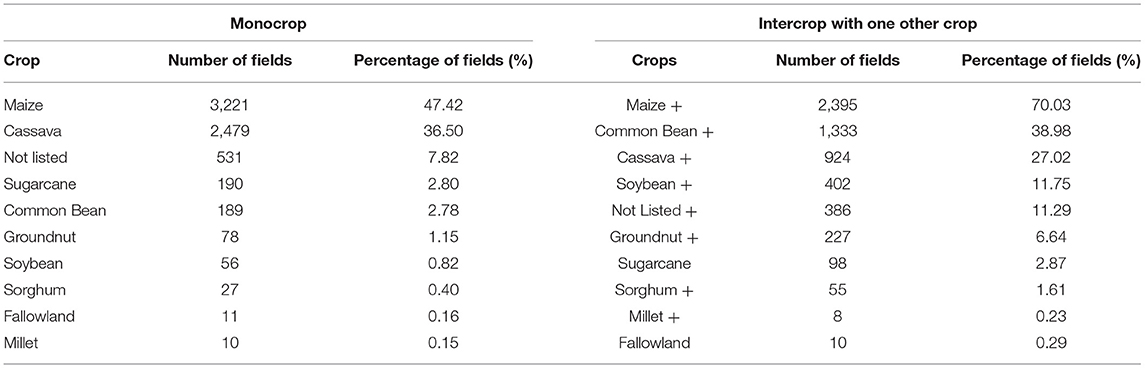
Table 1. Detailed composition of the fields surveyed between August 13th and December 12th, 2019 in Busia, Kenya.
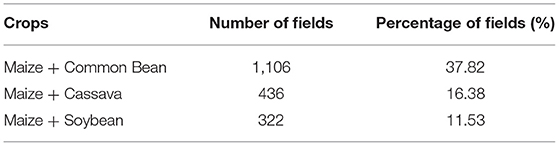
Table 2. Top three field compositions of intercropped fields with one crop in season 2.
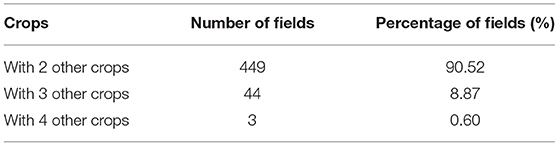
Table 3. Number of fields intercropped with two or more other crops in season 2.
Discussion and Conclusion
Data Collection Rates and Limitations
The average collections rate for the Kenyan survey team is 109 fields per day. The team captured field composition data for 10,213 fields during August 13th and December 12th, 2019. If the team were to maintain this rate, they could survey approximately 36,000 fields in one year. The frequency at which this data can be collected compared to the cost of collection (approximately $1.41 USD per field) is extremely favorable. The cost of collection was reduced mainly due to the positive effects of employing local talent. By providing motivated University students and recent graduates with the means to earn a steady income, help their community, and support a movement for climate change adaptation, the status of Kenya's agriculture can be dramatically enhanced a low cost.
A limitation we currently face is not knowing the number of fields needed to sufficiently represent a region. Each region can have differing spectral profiles for the same crop on remotely sensed images due to factors like weather (Foerster et al., 2012). If the number of fields required to represent a region can be determined, the field data collection model can be optimized across all counties in Kenya and ultimately scaled across Africa.
The PlantVillage team did not perform a data quality comparison across the two different collection periods. The PlantVillage team overlapped the data collection period between the two teams to ensure quality collection and understanding of the data. The incoming data was checked daily and deemed high quality for the operational work. The data is available and includes the information for external scientists to conduct the data quality analysis on their own terms.
Field Data Collection and Challenges
The field compositions for season one was mainly monocropped maize (39%) and monocropped cassava (14%). We found the main reason farmers planted maize instead of cassava in season one was due to the diseases that affect cassava and its cuttings. Another reason for planting maize is that cassava cuttings are more expensive than maize seeds and the farmer is not guaranteed to get the variety they think they are purchasing. We found that a large number of maize fields in season one were replanted two to three separate times due to delay in the onset of seasonal rains (GEOGLAM, 2019) which in March/April and was associated with the twin cyclones in Mozambique (Idai and Kenneth) which removed moisture from the Horn of Africa (GEOGLAM, 2019).
The survey team found that maize (47.42%) and cassava (36.50%) were the majority of monocrop fields in season two. However, there was an increase in fields intercropped with common bean from 21.8% in season one to 38.98% in season two. This is due to the shorter rains during the second season, which reduces the risk of fungal diseases in beans according to the farmers.
The Kenyan survey team faced several challenges while surveying fields. One such challenge was the variability in data connection while in the field. If the data connection was poor, the satellite image will not load in the ODK app making it impracticable to determine the boundaries of the field from the satellite imagery. When this was the case, the Kenyan survey team walked the boundaries of the field for every field. This was physically taxing and took time so when this approach was required, the total number of fields surveyed for the day decreased but the quality of the mapping increased as more field boundary data points were collected with this method.
Another challenge the survey team faced and overcame was reaching farmers and fields outside of the SHA network. The team exhausted the farmers and fields within the SHA network in Busia after just a few weeks. They overcame this challenge by meeting with community groups that meet regularly to engage new farmers and reach previously existing networks that are not part of SHA. The added value of this was an ability to share more details on pests and diseases as well as adaptive approaches to coping with changes in weather associated with climate change.
The fields data collected is available through Pennsylvania State University ScholarSphere repository. We understand the importance of this data and how applicable it is to various fields and therefore provide it under a public domain mark to encourage others to download and interpret this data using their expertise.
Crop Stress as a Function of Field Composition Data and WaPOR
The development of a crop stress map for Busia county is an example of the kind of analysis enabled by the collection of this data in combination with WaPOR evapotranspiration. This is a work in progress and is being released as an alpha stage product to encourage the global community of agronomists to work collaboratively on developing machine learning approaches to provide near real-time advice to smallholder farmers on climate stress.
The seasonal rains that were expected in March did not arrive until early April, which was due in large part to the twin Cyclones in Mozambique (GEOGLAM, 2019). This caused a large shift in either later planting dates or low-germination rates. The effect of climate change is likely to result in a greater shift in planting dates. This implies that a dynamic tool that provides a more accurate index of when to plant would offer significant value. As part of our efforts at PlantVillage, we are developing a climate-smart artificial intelligence (AI) Assistant which integrates the ground-truthed data presented with evapotranspiration data from WaPOR to help farmers adapt to the significant challenges ahead.
Conclusion
The capability of young, motivated University graduates created a high-throughput system for accurate data collection in agriculture. This pilot study demonstrates it is economically viable to expand and sustain youth-led teams to improve the agricultural system in Kenya and other countries in Africa.
Data Availability Statement
The datasets generated for this study are available on Scholarsphere at Penn State University and can be found at doi: 10.26207/3swt-8078; doi: 10.26207/k40m-1393.
Author Contributions
AK, DH, and JC conceived the project. AK designed the initial field survey protocol. AK, PM, JC, SA, BP, JM, GN, KN, LP, MJ, JM, MT, WM, and WO collected the data. AK analyzed the data collected. DM analyzed WaPOR data. JC hired and managed Kenyan survey team. AK, DH, and JC contributed to writing. AK, PM, JC, and DH contributed to editing.
Funding
This work has benefited from funding from the Bill and Melinda Gates Foundation, UN FAO, and the Pennsylvania State University. There were two direct grants that funded this project. The Erickson Discovery Grant from Pennsylvania State University was awarded to AK. A Systems Level Approach to crop health was awarded to DPH by the Bill & Melinda Gates Foundation.
Conflict of Interest
The authors declare that the research was conducted in the absence of any commercial or financial relationships that could be construed as a potential conflict of interest.
Acknowledgments
We are very grateful to the many farmers who welcomed us onto their land and allowed us to collect this data for the common good. We are grateful to Fabio Lana for technical input and Hidden Brains for development work on Plant Village. We thank Self Help Africa for local support and Inbal Becker-Reshef for inviting this contribution.
Footnotes
1. ^“Leader in Satellite Imagery.” DigitalGlobe, www.digitalglobe.com/company/about-us.
2. ^WaPOR – FAO, https://wapor.apps.fao.org/home/WAPOR_2/1.
3. ^Open Data Kit – Build – build.opendatakit.org.
4. ^Amazon S3 - https://aws.amazon.com/s3/.
References
Allen, R. G., Pereira, L. S., Raes, D., and Smith, M. (1998). Crop Evapotranspiration-Guidelines for Computing Crop Water Requirements-FAO Irrigation and Drainage Paper 56. Rome, FAO, 300, D05109.
Busia County County Integrated Development Plan 2018-2022 (2018). Retrieved from: https://busiacounty.go.ke/wp-content/uploads/2019/05/Busia-CIDP-2018-2022-Cabinet-Approved.pdf
Day, R., Abrahams, P., Bateman, M., Beale, T., Clottey, V., Cock, M., et al. (2017). Fall armyworm: impacts and implications for Africa. Ingenta Connect 28, 196–201. doi: 10.1564/v28_oct_02
FAO (2018). Rural Youth Migration, Social Protection and Sustainable Value Chains in Kenya. Retrieved from http://www.fao.org/3/i9615en/I9615EN.pdf
FAO and IHE, Delft. (2019). WaPOR Quality Assessment. Technical Report on the Data Quality of the WaPOR FAO Database Version 1.0. Rome. 134 pp.
FAO IFAD, UNICEF, WFP, and, WHO. (2019). The State of Food Security and Nutrition in the World 2019. Safeguarding Against Economic Slowdowns and Downturns. Rome. FAO.
Foerster, S., Kaden, K., Foerster, M., and Itzerott, S. (2012). Crop type mapping using spectral-temporal profiles and phenological information. ScienceDirect 89, 30–40. doi: 10.1016/j.compag.2012.07.015
GEOGLAM (2019). Special Report: Kenya Long Rains Rapid Crop Assessment. GEOGLAM. Retrieved from https://cropmonitor.org/index.php/2019/09/24/special-update-kenya/
Giordano, M., and Bassini, E. (2019). Climate Change and Africa's Future. Governance In An Emerging New World, (119). Retrieved from https://www.hoover.org/research/climate-change-and-africas-future
Global Report on Food Crises (2019). Food Security Information Network. Retrieved from http://www.fsinplatform.org/sites/default/files/resources/files/GRFC_2019-Full_Report.pdf
Mcnally, A. (2019). Hydrologic and agricultural earth observations and modeling for the water-food nexus. Front. Environ. Sci. 7:2019. doi: 10.3389/fenvs.2019.00023
Planet Team (2017). Planet Application Program Interface: In Space for Life on Earth. San Francisco, CA. Available online at https://api.planet.com (accessed May-December 2019).
Whitcraft, A. K., Becker-Reshef, I., Justice, C. O., Gifford, L., Kavvada, A., and Jarvis, I. (2019). No pixel left behind: toward integrating earth observations for agriculture into the United Nations sustainable development goals framework. Remote Sens. Environ. 235:111470. doi: 10.1016/j.rse.2019.111470
Keywords: sentinel, ground-truthed, polyculture, crowdsourcing, earth observations, smallholder agriculture, mapping
Citation: Kehs A, McCloskey P, Chelal J, Morr D, Amakove S, Plimo B, Mayieka J, Ntango G, Nyongesa K, Pamba L, Jeptoo M, Mugo J, Tsuma M, Mukami W, Onyango W and Hughes D (2021) From Village to Globe: A Dynamic Real-Time Map of African Fields Through PlantVillage. Front. Sustain. Food Syst. 5:514785. doi: 10.3389/fsufs.2021.514785
Received: 25 November 2019; Accepted: 26 March 2021;
Published: 10 May 2021.
Edited by:
Inbal Becker-Reshef, University of Maryland, United StatesReviewed by:
Hamed Alemohammad, Radiant Earth Foundation, United StatesHannah Kerner, University of Maryland, United States
Copyright © 2021 Kehs, McCloskey, Chelal, Morr, Amakove, Plimo, Mayieka, Ntango, Nyongesa, Pamba, Jeptoo, Mugo, Tsuma, Mukami, Onyango and Hughes. This is an open-access article distributed under the terms of the Creative Commons Attribution License (CC BY). The use, distribution or reproduction in other forums is permitted, provided the original author(s) and the copyright owner(s) are credited and that the original publication in this journal is cited, in accordance with accepted academic practice. No use, distribution or reproduction is permitted which does not comply with these terms.
*Correspondence: Annalyse Kehs, YW5uYWx5c2VrZWhzQHBzdS5lZHU=; David Hughes, ZGh1Z2hlc0Bwc3UuZWR1