 Vivian M. Wauters
 Julie M. Grossman
 Anne Pfeiffer3
- 1Department of Plant Sciences, University of California, Davis, Davis, CA, United States
- 2Department of Horticultural Science, University of Minnesota, Saint Paul, MN, United States
- 3Department of Plant Pathology, University of Wisconsin - Madison, Madison, WI, United States
- 4Cala Farms, LLC, Turtle Lake, WI, United States
Intensive production practices characterizing vegetable farming contribute to high productivity, but often at the expense of supporting and regulating ecosystem services. Diversification with cover crops may support increased resilience through soil organic matter (SOM) contributions and physical soil protection. Vegetable farming often includes spring and fall production, limiting establishment and productive potential of over-wintered cover crops that are more widely used in the USA. In northern climate vegetable systems, warm-season cover crops planted during short summer fallows could be a tool to build resilience via ecosystem service enhancement. This project evaluated summer cover crops in the northern USA (MN and WI) for biomass accumulation, weed suppression, and contribution to fall cash crop yield. Our study included four site years, during which we investigated the effects of four cover crop species treatments, grown for 30 (short duration, SD) or 50 days (long duration, LD) alongside bare fertilized and unfertilized control treatments: buckwheat (Fagopyrum esculentum) and sunn hemp (Crotalaria juncea) monocultures, and biculture of chickling vetch (Lathyrus sativus) or cowpea (Vigna unguiculata) with sorghum-sudangrass (sudex) (Sorghum bicolor x S. bicolor var. Sudanese). To quantify cover crop quantity, quality, and weed suppression capacity, we measured cover crop and weed biomass, and biomass C:N. To quantify effects on cash crops, we measured fall broccoli yield and biomass. Mean total biomass (cover crop + weeds) by site year ranged from 1,890 kg ha−1 in MN Y1 to 5,793 kg ha−1 in WI Y2 and varied among species in Y1 for both the SD and LD treatments. Most cover crops did not outcompete weeds, but treatments with less weeds produced more overall biomass. Data from Y1 show that cover crops were unable to replace fertilizer for fall broccoli yield, and led to reduced fall crop yield. Broccoli in Y2 did not reach maturity due to fall freeze. Summer cover crops, because of their biomass accumulation potential, may be used by farmers in northern climates to fit into cropping system niches that have historically been left as bare soil, but care with timing is necessary to optimize weed suppression and mitigate tradeoffs for cash crop production.
Introduction
Intensive production practices characterizing typical vegetable farming focus on maximal cash crop yield (provisioning services) to the detriment of supporting or regulating ecosystem services (Smuckler et al., 2012). Cover crop integration into vegetable rotations can perform supporting and regulating services such as contributing to soil carbon, nitrogen contribution, and pest suppression (Ding et al., 2006; Bulan et al., 2015; Blesh, 2018). Because cover crops increase rotational diversity, they may also provide important contributions to farming system resilience (Bowles et al., 2020). Cover crop effectiveness is typically measured by the degree of contribution to supporting or regulating services, or indirect effects of maintained cash crop yield (Kaspar and Singer, 2011; Schipanski et al., 2014). Recent surveys indicate increased farmer interest in and adoption of cover crops, with the majority of respondents reporting that cover crops have improved soil health on their farms (SARE CTIC, 2017). This interest is particularly high among organic growers, who are mandated to follow practices that combine soil fertility and pest management with biological processes (Bellows, 2005).
Vegetable farmers often grow multiple cash crops during the growing season, leaving few periods of bare ground and thus limiting opportunities for cover crop use. Across the US Midwest agricultural region, cereal rye (Secale cereale L.) and other cool-season grasses remain the most common cover crops (Singer, 2008). Cool-season cover crops in northern regions require relatively long periods of growth in fall and spring to produce significant biomass, which may not be feasible for vegetable systems in which cash crops, such as greens or broccoli, occupy the spring and fall cropping period. To maximize cover crop benefits within the rotational schedule of vegetable growers, cover crops sown in the main summer season between cool-season cash crops may be an opportunity to enhance diversification and benefit from the ecosystem services that cover crops can provide. Regular summer precipitation during the summer growth period makes the opportunity of summer cover crops particularly attractive, though cover crop water uptake during growth could result in tradeoffs. For example, severely reduced soil moisture has been shown to limit microbial processing of residue (Herron et al., 2009), and water stress is well-known to limit cash crop growth.
Summer cover crops have the potential to significantly enhance regulatory and supporting ecosystem services through biomass production. Cover crop biomass residue can replenish SOM, thus preventing or reversing soil organic matter (SOM) loss over time in agricultural soil (Reicosky and Forcella, 1998; Dabney et al., 2001; Steenwerth and Belina, 2008; Boyhan et al., 2016). Biomass accumulation is usually highest from grass cover crop species, reaching up to 14 Mg ha−1 for sorghum-sudangrass (Sorghum bicolor x S. bicolor var. Sudanese; sudex), grown continuously over the summer (Stute and Shekinah, 2019), or when cut for hay or foraged repeatedly during a single season (Finney et al., 2009). When grown for a short period without cutting, sorghum-sudangrass can still accumulate considerable biomass, ranging from 10 Mg ha−1 biomass within 66–90 days after planting (DAP) and 7.2 Mg ha−1 (O'Connell et al., 2015) to almost 9 Mg ha−1 36–75 DAP (Creamer and Baldwin, 2000; Brainard et al., 2011). The biomass accumulation of cover crops can suppress weed growth and seed set through competitive effects (Masilionyte et al., 2017). Buckwheat (Fagopyrum esculentum) is a particularly effective and often-used summer cover crop because of its quick growth (Kruse and Nair, 2016). Use of summer cover crops for weed suppression may have particular benefits because they can be used to outcompete weeds at the time of year when many weeds would otherwise reach maturity and set seed in fewer than 60 days (Miyanishi and Cavers, 1980; Brainard et al., 2011). Though there is farmer interest in using weedy fallows to gain some of the soil benefits that cover crops provide, cover crop species are more desirable because of their consistent growth and maturation. Use of cover crops instead of weedy fallows limits accidental contribution to the weed seed bank and future crop-weed interference (Wortman, 2016).
Cover crops can contribute to net N immobilization or N fertility, dependent in decomposition dynamics and cover crop quality. When cover crops contribute to N fertility to following cash crops, they do so through biomass decomposition and release of nutrients. Decomposition of grass cover crop species returns nitrogen taken up during plant growth, while legume cover crops confer an additional benefit of adding fertility through biological nitrogen fixation. Multiple legume cover crop species are well-suited as summer cover crops because of their potential for biomass accumulation and provision of fertility to subsequent crops (Creamer and Baldwin, 2000; O'Connell et al., 2015). Warm-season legume cover crops have demonstrated potential to contribute more than 100 kg ha−1 fixed N to following cash crop production, measured by nitrogen derived from the atmosphere (Ndfa) (Büchi et al., 2015), while total shoot N contribution from a cowpea (Vigna unguiculata) cover crop monoculture and biculture grown for 67 days ranged from 75 to 80 kg ha−1 (O'Connell et al., 2015). Summer legume cover crops such as sunn hemp (Crotolaria juncea) have demonstrated potential to produce high levels of biomass while providing fixed nitrogen to the soil and suppressing weeds (Price et al., 2012). Fertility benefits from cover crops, whether through nutrient recycling from biomass or fixed nitrogen from legumes, may be an important tool for organic farmers to supplement organic fertilizers while providing the aforementioned ecosystem benefits. However, high cover crop biomass does not necessarily lead to high fertility benefits; the balance of nutrient immobilization and mineralization during cover crop decomposition is affected by existing SOM, microbial activity, and biomass quality, and can therefore result in systemic tradeoffs rather than simple benefits.
Combining cover crop species as mixtures can realize multiple benefits based on the complementary characteristics of individual species (Finney and Kaye, 2017). Cover crop mixtures can be particularly effective at weed suppression (Brainard et al., 2011). However, cover crop mixtures often produce less total biomass than their component species planted as monocultures (Finney et al., 2016). A key reason to use cover crop mixes is to balance biomass productivity with N fertility, by pairing high C:N grass species with nitrogen-fixing legumes (Finney and Kaye, 2017; Finney et al., 2017).
Limited research suggests that the benefits of summer cover crops, including high biomass, weed suppression, and fertility are achievable even in northern climates (USDA plant hardiness zones 1–4) (Kruse and Nair, 2016; Stute and Shekinah, 2019), though establishment of cover crops and cash crops within the same short season remains challenging. High biomass accumulation of warm-season cover crops during a short period in summer would offer farmers a diversification tool to protect or improve soil structure and fertility. However, insufficient growing time could result in cover crops having a negative effect on fall cash crop growth by immobilizing nutrients without building SOM. Our aim was to increase understanding of promising summer cover crop species and mixtures grown in northern vegetable systems within the time constraints of spring and fall vegetable crops. We quantified the degree to which short-season summer cover crops grown in soils with contrasting OM content accumulated biomass and N, contributed to weed suppression, and served as a fertilizer replacement for fall cash crops. We hypothesized that the chosen quick-growing summer cover crops species would provide ecosystem services via biomass accumulation, weed suppression, and contributions to soil fertility, but that duration of cover crop growth would affect provision of the benefits.
Materials and Methods
The experiment was conducted in the summers of 2017 (Y1) and 2018 (Y2) on two certified organic working vegetable farms in MN and WI, both in Zone 4A. The MN soil is a Braham loamy fine sand, measured SOM 11 g kg−1. The WI soil is a Crystal Lake silt loam, measured SOM 23 g kg−1. Cumulative GDD (with baseline 10 C) during the 50 days of cover crop growth for the MN site were 416.9 and 545.9 in Y1 and Y2, respectively, and for the WI site, 450.6 and 549.1 in Y1 and Y2 (Table 1).
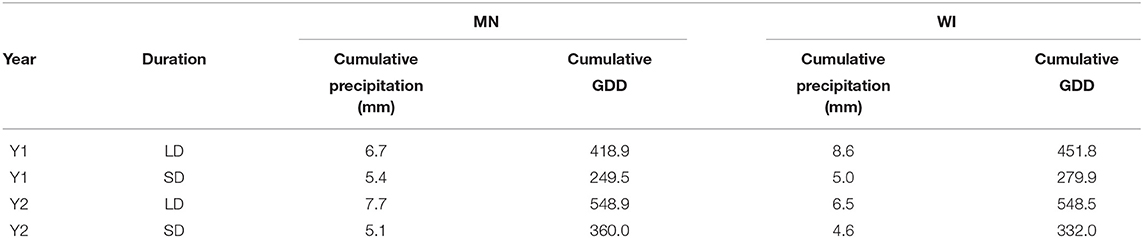
Table 1. Cumulative precipitation (mm) and GDD (baseline 10C) for each site year divided by duration treatment.
Between-site management was kept as consistent as possible given the options provided by farmer equipment and normal practice, with a key difference of lack of irrigation capacity at the WI site and differences in fertilization. In Y1, all cover crops were terminated using a tractor-mounted rotary mower, while in Y2, all cover crops were terminated using a walk-behind flail mower (Table 2).
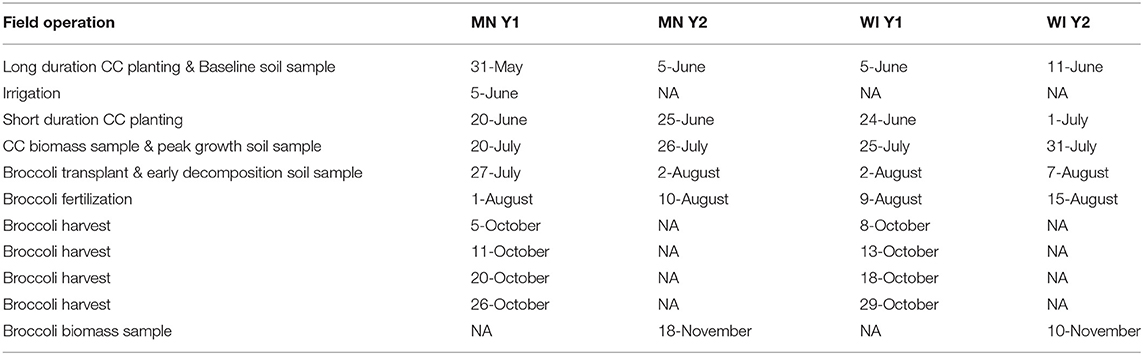
Table 2. Field management schedule for Y1 and Y2 field operations.
Experimental Design and Treatments
Each site (MN and WI) used a 5 × 2 factorial randomized complete block experimental design with four replicates. The first treatment factor consisted of four cover crops species and two bare fallow controls (with and without added fertilizer). The second treatment factor was duration: each of four cover crop treatment levels was planted on two dates, representing long and short cover crop growing durations, and two bare control treatments. Cover crop species treatments included two monocultures and two bicultures. Monocultures included buckwheat (Fagopyrum esculentum) (75 kg ha−1) and sunn hemp (Crotalaria juncea) (38 kg ha−1) and bicultures included chickling vetch (Lathyrus sativus) (75 kg ha−1) and sudex (Sorghum bicolor x S. bicolor var. Sudanese) 42.6 kg ha−1), and cowpea (Vigna unguiculata) (44.8 kg ha−1) and sudex (42.6 kg ha−1). Seeding rates were calculated based on bulk seed weight. Buckwheat, vetch, and sunn hemp all had 90% germination rate, sudex 85%, and cowpea 80%. All cover crops were VNS apart from the chickling vetch, which was AC Greenfix. Cover crop species were chosen for demonstrated ability to accumulate large amounts of biomass in short duration, and suitability for growth in the warm-weather climate of the Upper Midwest. Each experimental unit, a unique combination of species and duration, consisted of a plot 3 m wide and 4.5 m long in MN, and 3.6 m wide and 4.5 m long in WI. Species treatments were planted on two dates, 3 weeks apart, to create duration treatments representing realistic available planting windows on typical organic vegetable farms in northern climates. The long duration (LD) planting was seeded in early June following spring arugula harvest. The short duration (SD) planting was seeded 2 weeks after LD planting. Cover crops were seeded at a depth of 0.5–1 inches in five passes using a six-row Jang drill seeder (two ft wide) with variable plates to control seeding rate. Cover crops were irrigated in MN to aid establishment in both years. No irrigation was used in WI. No cover crops were fertilized. All cover crop plots were left unweeded throughout growth. Weeds were removed weekly from bare plots. All cover crop plots were terminated on the same date within a site year, 50 DAP for the LD plots and 30 DAP for the SD plots. Termination in Y1 was accomplished via a tractor-driven flail mower at both sites, while in Y2 a termination used a walk-behind flail mower. In both years, termination was followed by incorporation into the soil 2 days later with a tractor-driven disk. Soil samples were collected at peak cover crop growth, immediately before termination, and at broccoli transplant, and analyzed for labile C and N via a suite of indicators including inorganic and organic N (Wauters, 2020). Soil moisture was measured as volumetric water content (VWC) in three of four site years (MN Y1 and Y2, and WI Y2), and varied from 14 to 30%. Due to inconsistent data collection and resulting lack of replication, statistical comparison between treatments was not possible, though the bare control tended to be on the higher end of the range in Y2 at both sites (data not shown).
Cover Crop Biomass
Immediately prior to cover crop termination, two 0.1 m2 quadrats of biomass were collected from each plot avoiding the edges, and divided by cover crop species (one or two for each treatment) and weeds (all species combined). Biomass was transferred to a 60°C oven for at least 48 h to achieve constant weight before being weighed for dry biomass yield and then ground and analyzed for C and N content using a dry combustion analyzer (Elementar VarioMax CN analyzer, Elementar Americas). Total biomass N was calculated for each cover crop species via the percentage of N in the biomass. Predominant weed species were noted but not collected separately.
Cash Crop Yield
Broccoli (Gypsy) was planted at 18-inch spacing between plants in four rows per plot (two paired rows on a 5-6 ft bed center), for a total of 80–88 plants per plot. Only the fertilized bare control received fertilizer, which was applied 2 weeks after transplant. Fertilizer was applied as pelletized organic chicken manure. The rate was established based on grower normal side dress fertilization, which was 67 kg ha−1 N in MN and 107 kg ha−1 N in WI. Due to field error, Y1 MN received 5-2-4 fertilizer in Y1, while MN Y2 and both years in WI received 8-4-4. Weeds were removed via tractor cultivation 2 and 5 weeks after transplant. In Y1, the broccoli was harvested four times between early October and early November from 16 plants from the center of each plot. Broccoli was graded according to USDA market standards 1 & 2, with all other harvestable heads treated as unmarketable yield. Persistent cold after the first frost prevented broccoli harvest in Y2; instead, two immature plants were collected from each plot, dried following the same protocols as for the cover crop biomass, and weighed for aboveground dry biomass.
Statistical Analysis
Total biomass, total biomass N, weed biomass, cover crop C:N, and broccoli yield were all modeled using estimated marginal means (EMMs), on a mixed model in which block was a random effect, and species and duration treatment were fixed effects. Due to interactions, each of the four site years was modeled separately except where noted. EMMs were used to account for imbalances in the data caused by missing samples (one sudex sample from Cala in Y2, and 25 samples across all site years for which there was insufficient biomass to measure CN). Biomass, biomass N, and C:N mean separation were calculated using Tukey's HSD on the mixed model, comparing the four cover crop species within a duration treatment. No bare control was included in these models because the bare treatments were kept biomass free. Pairwise comparison was used to assess differences between LD and SD within a single species, as well as to compare the legume biomass between the two legume-sudex mixtures. Weed biomass as a percentage of total biomass was calculated as a linear, quadratic, and break-point linear regression, with the most significant model chosen for display and discussion. Broccoli total marketable yield from Y1 and broccoli biomass from Y2 were modeled across durations, but separated by location due to different fertilization rates and interactions. Mean separation was calculated using Tukey's HSD on the mixed model with all treatments including the fertilized and unfertilized bare control, as well as on all of the unfertilized treatments compared without the fertilized control. Statistical analysis was carried out using R version 4.0.2, using the lme4, multcomp, and segmented packages for analysis, and ggplot2 for visuals (Hothorn et al., 2008; R Core Team, 2013; Bates et al., 2015; Wickham, 2016).
Results
Mean total biomass (cover crop + weeds) averaged across duration by site year ranged from 1,890 kg ha−1 in MN Y1 to 5,790 kg ha−1 in WI Y2. When divided by duration, total biomass varied among species in Y1 for both the SD and LD treatments (Table 3). Specifically, buckwheat in Y1 produced between 37 and 47% more biomass than the next highest treatments in MN, while in WI, buckwheat outproduced the other species by 6%. In Y2, total biomass did not differ among species for either duration, although total biomass was generally higher in Y2 than in Y1. Total biomass in WI was roughly double that of MN for both years. Total biomass production for LD was higher than SD for all species in all site years (Figure 1A). Total biomass N contribution followed similar patterns as total biomass among species (Table 3). Mean biomass N averaged across duration ranged from 40.6 kg ha−1 in MN Y1 to 153 kg ha−1 in WI in Y2. Despite large total biomass differences between LD and SD, biomass N was similar across duration, due to higher C:N proportion in LD biomass. Biomass N contribution for SD treatments was equivalent across species in three of four site years (Table 3). Total plot biomass C:N varied across species in only one site year (MN Y1) for LD, in which buckwheat had a higher C:N than sunn hemp (Table 3).
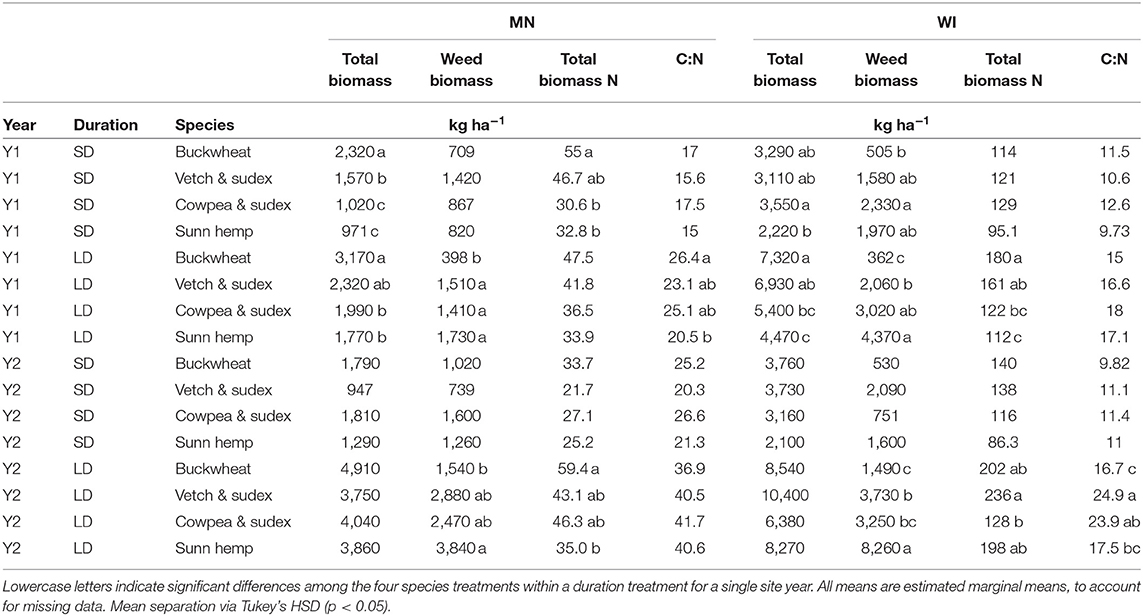
Table 3. Total cover + weed biomass, weed biomass, total biomass N, and total biomass C:N for all four sites years, separated by duration and species treatment.
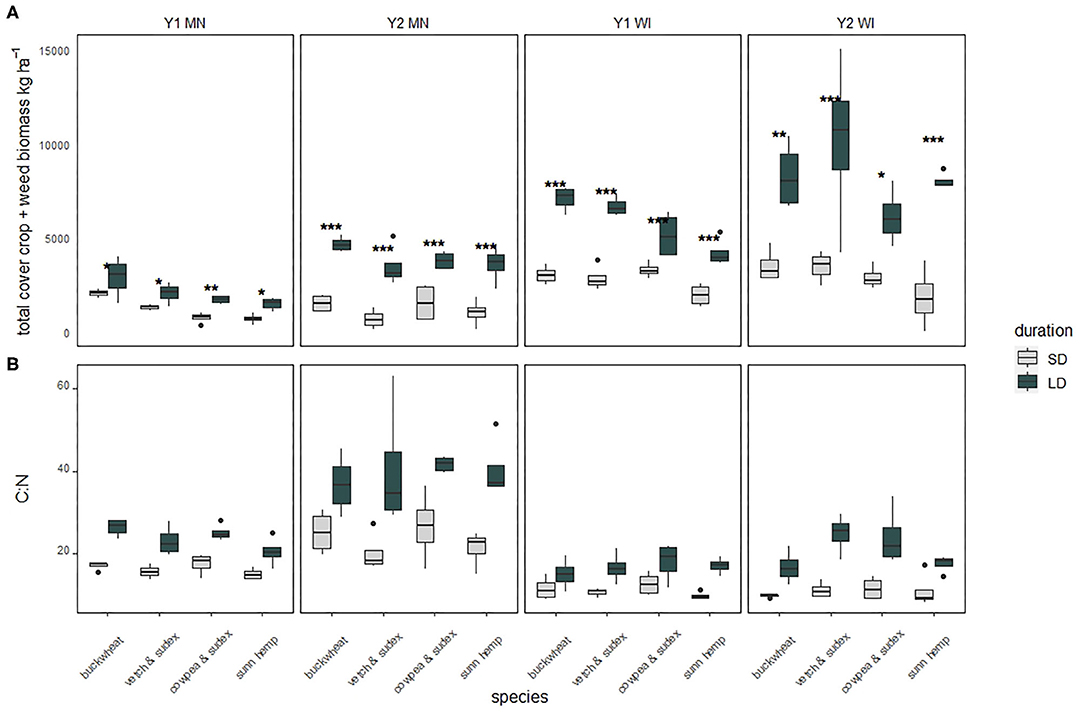
Figure 1. Total biomass (A) and biomass C:N (B) from each site year divided by species, compared between durations. Short duration (SD) appear on the left of each pair (lighter shading), long duration (LD) on the right (darker shading). Significant differences between duration for a species are indicated by stars above the pair. *p < 0.05, **p < 0.01, ***p < 0.001.
Total legume biomass was low across most treatments with a mean proportion of legumes:non-legume biomass of 0.07. Comparison of the vetch & sudex and cowpea & sudex mixtures, found that the cowpeas outproduced vetch in MN in Y2 across LD and SD treatments (337 kg ha−1 = cowpea, 51.4 kg ha−1 = vetch, p = 0.01).
Overall biomass C:N for all species in all four site years was higher in LD than SD treatments (p < 0.05) (Figure 1B). Averaged across treatments, MN cover crop biomass C:N was 20.0 in Y1 and 31.6 in Y2, both of which were higher than the respective C:N in WI, which were 13.9 in Y1 and 15.8 in Y2 (p < 0.001).
Buckwheat suppressed weeds most effectively in LD treatments for all four site years, as well as WI Y2 in the SD treatment (Table 3). Buckwheat as a proportion of total biomass ranged from 48% in MN Y2 SD to 95% in WI Y1 LD. The sunn hemp LD treatment resulted in less weed suppression than at least one other treatment in all four site years. Sunn hemp biomass as a proportion of total biomass ranged from complete species loss (mean of 0%) in WI Y2 LD to 16% in MN Y1 SD. Across species, weed biomass as a proportion of total biomass decreased as total biomass increased to 2,169 kg ha−1 (adjusted r2 = 0.64, p < 0.001), at which point weed biomass was approximately 25% of total biomass (Figure 2). There was no significant relationship between total biomass and weed proportion of biomass beyond 2,169 kg ha−1 (adjusted r2 = 0.019, p = 0.192).
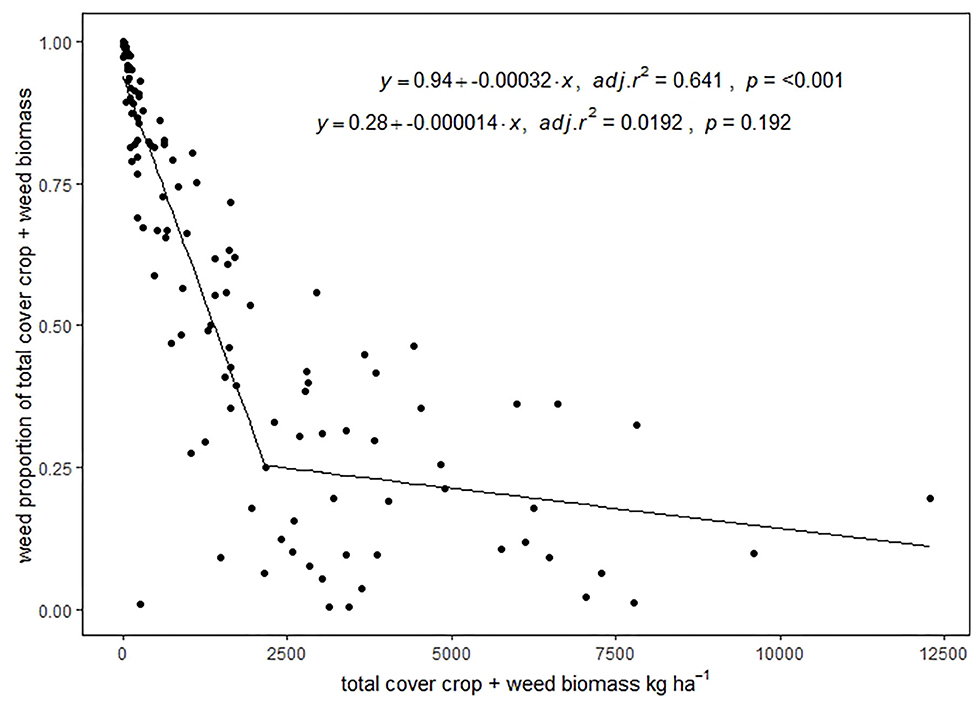
Figure 2. Relationship between total biomass and percentage of biomass from weeds. Best fit model chosen from linear, quadratic, and linear plus plateau, with equations for each of the two lines. The top equation represents the line from 0 to 2,169 kg ha−1, and the bottom equation represents the line >2,169 kg ha−1.
No cover cropped treatment produced a vegetable yield equivalent to that of the fertilized control treatment in Y1 (Table 4). When the fertilized treatment was removed from the model for comparison of the four species and unfertilized bare treatments, yield in the bare control was 30% higher than any cover cropped treatments in MN (p = 0.062), and 26% in WI (p = 0.096). Mean vegetable yield across all cover crop species treatments (without the bare control) in MN was 2,230 and 8,380 kg ha−1 in WI. Duration was marginally significant (p = 0.061), with a mean yield of 3,660 kg ha−1 in the SD treatment and 2,850 kg ha−1, in the LD treatment.
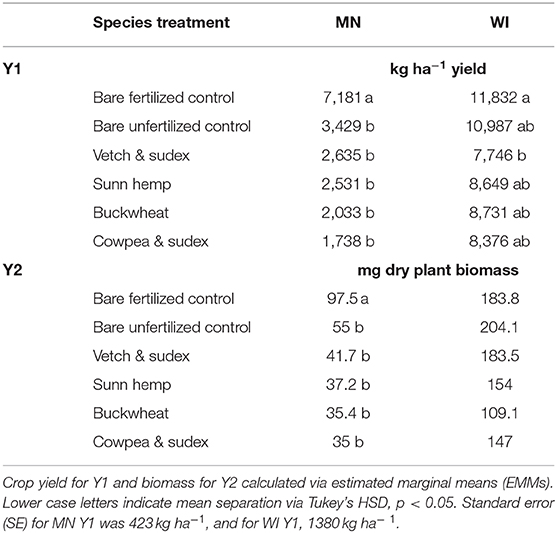
Table 4. Fall cash crop yield in Y1 and plant biomass in Y2 by location for each species, averaged over duration in the absence of interaction effects.
Marketable yield as a percentage of total yield in Y1 differed among treatments within locations. In MN, cover crop duration did not affect marketable yield. Among species, broccoli plants in cowpea & sudex treatments produced a lower percentage of marketable yield than the unfertilized bare control treatment, 10 and 43% of total yield, respectively (p < 0.001). Marketable broccoli yield in MN from all unfertilized treatments did not match the percentage of marketable yield from the fertilized treatments (89%). In WI, SD treatment had overall higher percentages of marketable yield than LD, 72 and 83%, respectively (p = 0.04). The percentage of marketable yield from all cover cropped treatments was below that of the fertilized control (fertilized control = 94%), though the difference was only significant for sunn hemp (67%, p = 0.03). When comparing cover crop treatments without the bare treatments, MN had lower marketable yield than WI, and the SD treatment had higher marketable yield than LD.
Broccoli yield data for Y2 is not included in Table 4 due to persistent cold after the first frost, which prevented broccoli plants from reaching full maturity. Dry biomass of plants in MN was higher in the fertilized treatment than in the unfertilized treatments (fertilized = 97.5 g, mean unfertilized = 40.86 g, SE = 8.4), but equivalent across all treatments and controls in WI (Table 4).
Discussion
In this study we demonstrated that cover crops grown for short periods in the summer could provide supporting and regulating ecosystem services though high biomass accumulation, but they may do so at the expense of fall cash crop yield. Ecosystem service tradeoffs have been well-established for cool-season cover crops in field cropping systems, with greater N retention associated with decreased ability to provide fertility to the system (Finney et al., 2017). In vegetable systems, summer cover crops are often grown for >2–3 months (Boyhan et al., 2016; Stute and Shekinah, 2019), which can assure high biomass productivity but is longer than many growers can afford to take away from spring and fall cash crop production. In this study, we focused on 30 and 50 growing days, to fit the cover crops into realistic cool-season vegetable rotations of northern climates (USDA plant hardiness zones 1-4). Despite the brief growing period, buckwheat and sudex in both mixes accumulated biomass commensurate with that of more temperate climates (Creamer and Baldwin, 2000; O'Connell et al., 2015). The biomass potential of cover crops after a short period of growth makes them a viable option to enhance the supporting ecosystem services by replacing bare fallows and adding organic matter (Smuckler et al., 2012).
Biomass differences between the two sites were higher than expected and are best explained by variation in soil type, fertility, and water availability. The MN and WI sites were chosen to test the effects of summer cover crops on distinct soil quality circumstances; the Braham loamy sand soil of MN had 11 g kg−1 SOM and requires summer irrigation despite regular summer precipitation. The WI site was a Crystal silt loam with 23 g kg−1 SOM on which the farmer had never used irrigation. While cover crop performance was predicted to differ between sites, the contrast in cover crop performance was beyond expectation. Low biomass accumulation in MN persisted despite irrigation at germination to offset lower water holding capacity in the sandy soil. The added irrigation resulted in similar VWC across the two sites, indicating that low soil moisture was not the main determinant of biomass accumulation (data not shown). Low biomass suggests that, in some instances, cover crops may not be able to provide desired ecosystem services. Benefit may be more likely with fertilization. Pairing cover crops with fertility sources is not uncommon. Over-wintered cover crops are often planted in synchrony with fall manure application, such that the cover crop can prevent nutrient leaching from manure (Cambardella et al., 2010; Thilakarathna et al., 2015). Applying fertilizer specifically for cover crop success is mentioned in farmer-focused publications (Clark, 2013), but is lacking in academic literature. While cover crops are touted as a tool for improving poor soil, our results suggest that there may be thresholds of soil OM, available N, or water content below which cover crops cannot produce sufficient biomass to provide SOM-building benefits unless coupled with synchronous fertilizer or irrigation.
Circumstances in which cover crops may require fertilization highlights one of the potential limitations for their use. This has been observed for conservation agriculture practice in the highly eroded soils of sub-Saharan Africa, where higher input costs are often a necessary pre-condition to implement conservation practices. This requirement excludes cover crops as an option for the poorest farmers, even though these farmers might be farming soils that need the conservation strategy most (Giller et al., 2009). The relationship between cover crop growth and fertility requirements suggests a need for targeted cover crop experimentation in water-limited, highly eroded, and sandy soils to determine the conditions in which diversification via cover crops can deliver ecosystem services such as weed suppression and SOM contribution and when they may result in untenable tradeoffs.
The duration for which cover crops were grown drove differences in biomass accumulation in three of four site years. This may have been the result of insufficient GDD accumulation for the short duration treatments. Studies of summer and winter cover crops point to the importance of GDD in determining plant growth (Brennan and Boyd, 2012; Baraibar et al., 2018; Stute and Shekinah, 2019), where lower GDD DAP−1(cumulative GDD divided by DAP) is correlated with lower overall growth (Brennan and Boyd, 2012). The 30-year average GDD DAP−1 in MN between June and October is 16.9 (baseline 10C) (UMN, 2019). However, the short summer season in northern regions (USDA Plant Hardiness Zones 1-4) may not provide sufficient GDD for cover crops planted between vegetable crops. Our results for GDD DAP−1 remained below the full season average, ranging from 8.3 to 10.9, such that SD treatments did not have sufficient GDD to reach their accumulation potential. Summer cover crops grown for any duration may be more successful when planted later in the season, after a long spring crop, to take more advantage of GDD during the late summer.
Biomass productivity was also heavily dependent on species treatment, indicating the importance of appropriate species selection for specific services. Legumes were included in the study for their potential to fix nitrogen and contribute fertility. However, legume biomass was notably low, limiting the potential for N fixation and associated fertility benefits. The proportion of legume in the total harvested biomass for each of the three legume species treatments (cowpea & sudex, vetch & sudex, and sunn hemp) ranged from 0 to 0.5, and the mean proportion of legumes as part of total cover crop biomass was only 0.07. Seeding rates in the sudex bicultures may have contributed to low legume biomass. Others have found that a legume-sudex mix planted 50–50% by seed weight resulted in biomass that was 85% grass and 15% legume (Stute and Shekinah, 2019). Our seeding rates were roughly 50–50% for the cowpea-sudex mix (44.8 and 42.6 kg ha−1), and due to large seed size, the vetch-sudex mix was 63–36% (75 and 42.6 kg ha−1), suggesting that higher seeding rates are necessary to encourage legume productivity, both in absolute terms and as a proportion of the mixture. Future studies should examine chickling vetch and sunn hemp under more optimal conditions. Chickling vetch has demonstrated high potential as a cover crop in drought and high salinity areas (Lambein et al., 2019), and a high potential for N fixation (Büchi et al., 2015). Sunn hemp also has demonstrated high potential for biomass production that was not achieved in this study; this may have resulted from low soil temperatures at planting, although sunn hemp can be planted any time after the final spring frost (Schonbeck and Morse, 2006).
Because of notable biomass differences, cover crop species differed in the ecosystem services provided. Negative cover crop effects on following cash crops as observed here have been established as a possible disservice from sorghum-sudangrass (Kruse and Nair, 2016). The current study did not provide evidence for species-specific detrimental effects, and thus suggests that the cover crop presence, perhaps because of nutrient and water use during growth, or slow decomposition, led to the yield penalty. Lower nutrient availability was confirmed via soil nitrate measurements, which exhibited values 10–13 times higher in bare soil than in cover crop treatments in WI, and 120–180% higher in the bare control than in cover crop treatments in MN (Wauters, 2020). Given sorghum-sudangrass' high rate of biomass accumulation, it may not be suitable as an immediate precursor to fall vegetables, despite its potential to contribute to ecosystem benefits such as building SOM and physically protecting soil from erosion (Finney et al., 2016). Of all species, buckwheat, which is already a common summer cover crop (Bulan et al., 2015), provided the most consistent combination of weed suppression and growth. Because of its added potential benefit to pollinators (Clark, 2013), the success of buckwheat also indicates that it may also be useful to focus on non-fertility benefits of cover crops during short periods in the summer.
Weed suppression services of cover crops are important insofar as they prevent weed seed maturation and subsequent replenishment of the weed seed bank, or as their allelopathic effects inhibit weed growth following cover crop termination. The low weed suppression capability of most cover crops in this study is of concern because some of the most common weeds observed in these systems, including Portulaca oleracea, Amaranthus retroflexus, and Chenopodium album have the potential to produce viable seed in as little as 6–8 weeks (Bassett and Crompton, 1978; Miyanishi and Cavers, 1980; Weaver and McWilliams, 1980). While it is probable that most of the weeds in this study were unable to set seed, hard seed from Chenopodium album was observed at the MN site, which had higher overall cover crop C:N, suggesting that plants matured more quickly in the sandy, low OM soil, perhaps due to water stress (Turner, 1986). The risk of even a single weed going to seed can be significant. For example, weed seed production from Amaranthus species in the presence of poor-competing cover crops can top 100,000 seeds m−1 (Brainard et al., 2011). While use of weeds as a cover crop may provide some of the same benefits as a planted cover crop (Wortman, 2016), the inverse relationship between total treatment biomass and weed biomass found in this study indicates that the benefits from biomass accumulation are better achieved via a planted cover crop. However, the lack of a weedy control in this study limits our ability to make predictions on how the cover crops would have compared to an unmanaged weedy fallow. Given that the biomass accumulation in the most and least weedy cover crop plots had similar effects on fall broccoli that differed from the bare control, we would expect that a true weedy control would have led to decreased broccoli yield. Future research comparing the effects of varied levels of weed management, such as a bare control, limited cultivation, and no cultivation, could help clarify the impacts of weedy summer growth on fall cash crop yield.
Cover crop maturity stage has important effects on biomass N mineralization and immobilization rates after termination. In our study, broccoli yield decreased in all cover crop treatments, suggesting that nutrients may have been immobilized by the cover crops and thus became unavailable for cash crop uptake. Cover crop C:N at termination determines the availability of cover crop nutrients to microbes, and thus affect the ecosystem services related to N retention and fertility (Finney et al., 2016). While some evidence suggests that C:N of 24:1 is ideal for microbial processing and nutrient release without immobilization (O'Connell et al., 2015), comparisons of legume residue with C:N < 20 found differences in the rate of N release, indicating that immobilization can occur at lower C:N (Wagger et al., 1998). Modeling N release from biomass residue in soil found that C:N was positively correlated with N release until 11:1, and then decreased, indicating that immobilization may be a significant factor in nutrient availability well-below the 24:1 threshold (Clivot et al., 2017). In the current study, C:N was reliably below 24:1 in WI, but mineral N remained significantly lower in cover cropped treatments compared to bare control at broccoli transplant, which occurred 1 week after cover crop termination and incorporation (Wauters, 2020). The decreased N levels indicate nutrient immobilization, which may have contributed to decreased broccoli yield. Furthermore, vegetable yield was generally lower in LD treatment, especially at MN. In Y2, C:N in the LD treatment reached over 40, well-above an ideal range for microbial mineralization. Mineral and organic N in soil at peak growth and early decomposition time points were lower in the cover crop treatment than in the bare treatments (Wauters, 2020), indicating that the living and decomposing biomass both led to decreased N availability for the broccoli. Despite high soil moisture and temperature, decomposition processes did not release nutrients for the fall cash crop in time to avoid a yield penalty. The suggested window between cover crop termination and cash crop planting varies from 2 to 3 weeks (Clark, 2013), though others have found that N release can take place over multiple weeks and even months (Parr et al., 2014). In this study, the time between cover crop termination and cash crop planting was only 1 week, to improve the probability that the broccoli would mature before first frost and thus be able to withstand some freezing temperatures. Given the reduction in yield, 1 week appears to be insufficient. Additionally, the broccoli only reached maturity and was able to form heads in 1 of 2 years before persistent low temperatures arrested growth, indicating that both a spring and fall cash crop on either side of the cover crop is not feasible.
Summer cover crop use in northern climates could be a useful tool for vegetable growers seeking to protect and improve soil within complex rotations, especially in the northern climates experiencing an increase of extreme summer rain events that could erode bare soil. However, weed pressure and cash crop yield decreases remain significant barriers to adoption. In the MN soil, which had very low OM and less soil water holding capacity, the yield decrease between cover cropped and bare unfertilized treatments indicates that fall cash crop planting carried particularly high risk of reducing cash crop yield. In the higher OM soils in WI, the broccoli yield decrease was less dramatic, despite the bare control receiving more fertilizer than in MN; it would be worthwhile to quantify the cost of the tradeoffs between yield and the ecosystem services provided by the cover crop. Weed pressure can be reduced by summer cover crops, but not eliminated. These cover crops show potential for farmers, but care must be taken to integrate them into the system with enough time to reach maturity and decompose without impinging on cash crop growth. Demonstrating the benefits and limitations of cover crops as a diversification tool to enhance ecosystem services and resilience provides farmers with a clearer picture of how summer cover crops could be used in their operation, to respond to the multi-layered demands of food production and environmental stewardship to which farmers must continuously adapt.
Data Availability Statement
The raw data supporting the conclusions of this article will be made available by the authors, without undue reservation.
Author Contributions
VW, JG, AP, and RC contributed to conception, design of the study, conducted field work, and data collection. VW and JG performed the statistical analysis. VW wrote the first draft of the manuscript. All authors contributed to manuscript revision, read, and approved the submitted version.
Funding
Funding for this project was provided by the Minnesota Department of Agriculture Specialty Crop Block Grant Program for Summer cover-cropping strategies and organic vegetable production for beginning, immigrant farmers 2016–2019 (grant number: FF2016-117355).
Conflict of Interest
RC was employed by company Cala Farms, LLC.
The remaining authors declare that the research was conducted in the absence of any commercial or financial relationships that could be construed as a potential conflict of interest.
Acknowledgments
The authors acknowledge Sarah Woutat of Uproot Farm for providing a study site for this project. Additionally, we gratefully recognize the Grossman Lab for their efforts in the field and lab helping make this project possible, including: Sharon Perrone, Marie Schaedel, Charlotte Thurston, Liz Perkus, Peyton Ginakes, Loren Weber, Sarah Becknell, Bonsa Mohamed, Gabriella Walker, Natalie Duncan, Abigail Sveen, Mar Horns, Heidi Schlinsog, Harywilliam Gonzalez Vidal, Justin Panka, Emily Swanson, and Kathleen Hobert.
References
Baraibar, B., Mortensen, D. A., Hunter, M. C., Barbercheck, M. E., Kaye, J. P., Finney, D. M., et al. (2018). Growing degree days and cover crop type explain weed biomass in winter cover crops. Agron. Sustain. Dev. 38:65. doi: 10.1007/s13593-018-0543-1
Bassett, I. J., and Crompton, C. W. (1978). The biology of Canadian weeds. 32. Chenopodium album L. Can. J. Plant Sci. 58, 1061–1072. doi: 10.4141/cjps78-161
Bates, D., Mächler, M., Bolker, B. M., and Walker, S. C. (2015). Fitting linear mixed-effects models using lme4. J. Stat. Softw. 67:1–48. doi: 10.18637/jss.v067.i01
Bellows, B. (2005). Soil Management: National Organic Program Regulations. ATTRA. Available online at: https://attra.ncat.org/product/soil-management-national-organic-program-regulations/
Blesh, J. (2018). Functional traits in cover crop mixtures: biological nitrogen fixation and multifunctionality. J. Appl. Ecol. 55, 38–48. doi: 10.1111/1365-2664.13011
Bowles, T. M., Mooshammer, M., Socolar, Y., Schmer, M. R., Strock, J., and Grandy, A. S. (2020). Long-term evidence shows that crop-rotation diversification increases agricultural resilience to adverse growing conditions in North America. One Earth 2, 284–293. doi: 10.1016/j.oneear.2020.02.007
Boyhan, G. E., Gaskin, J. W., Little, E. L., Fonsah, E. G., and Stone, S. P. (2016). Evaluation of cool-season vegetable rotations in organic production. Horttechnology 26, 637–646. doi: 10.21273/HORTTECH03443-16
Brainard, D. C., Bellinder, R. R., and Kumar, V. (2011). Grass – legume mixtures and soil fertility affect cover crop performance and weed seed production. Weed Technol. 25, 473–479. doi: 10.1614/WT-D-10-00134.1
Brennan, E. B., and Boyd, N. S. (2012). Winter cover crop seeding rate and variety affects during eight years of organic vegetables: I. cover crop biomass production. Agron. J. 104, 684–698. doi: 10.2134/agronj2011.0330
Büchi, L., Gebhard, C. A., Liebisch, F., Sinaj, S., Ramseier, H., and Charles, R. (2015). Accumulation of biologically fixed nitrogen by legumes cultivated as cover crops in Switzerland. Plant Soil 393, 163–175. doi: 10.1007/s11104-015-2476-7
Bulan, M. T. S., Stoltenberg, D. E., and Posner, J. L. (2015). Buckwheat species as summer cover crops for weed suppression in no-tillage vegetable cropping systems. Weed Sci. 63, 690–702. doi: 10.1614/WS-D-14-00088.1
Cambardella, C. A., Moorman, T. B., and Singer, J. W. (2010). Soil nitrogen response to coupling cover crops with manure injection. Nutr. Cycl. Agroecosystems 87, 383–393. doi: 10.1007/s10705-010-9345-9
Clark, A. (Ed). (2013). Managing Cover Crops Profitably. 3rd ed. College Park, MD: Sustainable Agriculture Research; Education (SARE) program.
Clivot, H., Mary, B., Valé, M., Cohan, J. P., Champolivier, L., Piraux, F., et al. (2017). Quantifying in situ and modeling net nitrogen mineralization from soil organic matter in arable cropping systems. Soil Biol. Biochem. 111, 44–59. doi: 10.1016/j.soilbio.2017.03.010
Creamer, N. G., and Baldwin, K. R. (2000). An evaluation of summer cover crops for use in vegetable production systems in North Carolina. HortScience 35, 600–603. doi: 10.21273/HORTSCI.35.4.600
Dabney, S. M., Delgado, J. A., and Reeves, D. W. (2001). Using winter cover crops to improve soil and water quality. Commun. Soil Sci. Plant Anal. 32, 1221–1250. doi: 10.1081/CSS-100104110
Ding, G., Liu, X., Herbert, S., Novak, J., Amarasiriwardena, D., and Xing, B. (2006). Effect of cover crop management on soil organic matter. Geoderma 130, 229–239. doi: 10.1016/j.geoderma.2005.01.019
Finney, D. M., Creamer, N. G., Schultheis, J. R., Wagger, M. G., and Brownie, C. (2009). Sorghum sudangrass as a summer cover and hay crop for organic fall cabbage production. Renew. Agric. Food Syst. 24:225. doi: 10.1017/S174217050999007X
Finney, D. M., and Kaye, J. P. (2017). Functional diversity in cover crop polycultures increases multifunctionality of an agricultural system. J. Appl. Ecol. 54, 509–517. doi: 10.1111/1365-2664.12765
Finney, D. M., White, C. M., and Kaye, J. P. (2016). Biomass production and carbon/nitrogen ratio influence ecosystem services from cover crop mixtures. Agron. J. 108, 39–52. doi: 10.2134/agronj15.0182
Finney, D. M., Murrell, E. G., White, C. M., Baraibar, B., Barbercheck, M. E., Bradley, B. A., et al. (2017). Ecosystem services and disservices are bundled in simple and diverse cover cropping systems. Agric. Environ. Letters 2:170033. doi: 10.2134/ael2017.09.0033
Giller, K. E., Witter, E., Corbeels, M., and Tittonell, P. (2009). Conservation agriculture and smallholder farming in Africa: the heretics' view. Field Crops Res. 114, 23–34. doi: 10.1016/j.fcr.2009.06.017
Herron, P. M., Stark, J. M., Holt, C., Hooker, T., and Cardon, Z. G. (2009). Microbial growth efficiencies across a soil moisture gradient assessed using 13C-acetic acid vapor and 15N-ammonia gas. Soil Biol. Biochem. 41, 1262–1269. doi: 10.1016/j.soilbio.2009.03.010
Hothorn, T., Bretz, F., and Westfall, P. (2008). Simultaneous inference in general parametric models. Biomed. J. 50, 346–363. doi: 10.1002/bimj.200810425
Kaspar, T. C., and Singer, J. W. (2011). “The use of cover crops to manage soil,” in Soil Management: Building a Stable Base for Agriculture, eds J. L. Hatfield and T. J. Sauer (Madison, WI: American Society of Agronomy and Soil Science Society of America), 321–337.
Kruse, R., and Nair, A. (2016). Summer cover crops and lettuce planting time influence weed population, soil nitrogen concentration, and lettuce yields. Horttechnology 26, 409–416. doi: 10.21273/HORTTECH.26.4.409
Lambein, F., Travella, S., Kuo, Y. H., Montagu, M. V., and Heijde, M. (2019). Grass pea (Lathyrus sativus L.): orphan crop, nutraceutical or just plain food? Planta 250, 821–838. doi: 10.1007/s00425-018-03084-0
Masilionyte, L., Maiksteniene, S., Kriauciuniene, Z., Jablonskyte-rasce, D., Zou, L., and Sarauskis, E. (2017). Effect of cover crops in smothering weeds and volunteer plants in alternative farming systems. Crop Protection 91, 74–81. doi: 10.1016/j.cropro.2016.09.016
Miyanishi, K., and Cavers, P. B. (1980). The biology of Canadian weeds. 40. Portulaca oleracea L. Canad. J. Plant Sci. 60, 953–963. doi: 10.4141/cjps80-139
O'Connell, S., Shi, W., Grossman, J. M., Hoyt, G. D., Fager, K. L., and Creamer, N. G. (2015). Short-term nitrogen mineralization from warm-season cover crops in organic farming systems. Plant Soil 396, 353–367. doi: 10.1007/s11104-015-2594-2
Parr, M., Grossman, J. M., Reberg-Horton, S. C., Brinton, C., and Crozier, C. (2014). Roller-crimper termination for legume cover crops in north carolina: impacts on nutrient availability to a succeeding corn crop. Commun. Soil Sci. Plant Anal. 45, 1106–1119. doi: 10.1080/00103624.2013.867061
Price, A. J., Kelton, J., and Mosjidis, J. (2012). Utilization of Sunn Hemp for Cover Crops and Weed Control in Temperate Climates, ed A. Price (InTech), 101–114. Available online at: http://www.intechopen.com/books/weed-control/utilization-of-sunn-hemp-for-cover-crops-and-weed-control-in-temperate-climates
Reicosky, D. C., and Forcella, F. (1998). Cover crop and soil quality interactions in agroecosystems. J. Soil Water Conserv. 53, 224–229.
SARE CTIC (2017). Annual Report 2016-2017 Cover Crop Survey. Joint publication of the Conservation Technology Information Center, the North Central Region Sustainable Agriculture Research and Education Program, and the American Seed Trade Association.
Schipanski, M. E., Barbercheck, M., Douglas, M. R., Finney, D. M., Haider, K., Kaye, J. P., et al. (2014). A framework for evaluating ecosystem services provided by cover crops in agroecosystems. Agric. Syst. 125, 12–22. doi: 10.1016/j.agsy.2013.11.004
Schonbeck, M., and Morse, R. (2006). Cover Crops for All Seasons: Expanding the cover crop tool box for organic vegetable producers. Virginia Association for Biological Farming 3, 1–6. Available online at: http://www.vabf.org/pubs.php
Singer, J. W. (2008). Corn belt assessment of cover crop management and preferences. Agron. J. 100, 1670–1672. doi: 10.2134/agronj2008.0151
Smuckler, S. M., Philpott, Stacy, M., Jackson, L. E., Klein, A.-m., DeClerck, F., Winowiecki, L., et al. (2012). “Ecosystem Services in Agricultural Landscapes,” in Integrating Ecology and Poverty Reduction: Ecological Dimensions, eds. J. C. Ingram, F. DeClerck, and C. R. del Rio (New York, NY: Springer), 17–51. doi: 10.1007/978-1-4419-0633-5_3
Steenwerth, K., and Belina, K. M. (2008). Cover crops enhance soil organic matter, carbon dynamics and microbiological function in a vineyard agroecosystem. Appl. Soil Ecol. 40, 359–369. doi: 10.1016/j.apsoil.2008.06.006
Stute, J. K., and Shekinah, D. E. (2019). Planting Date and Biculture Affect Sunn Hemp Productivity in the Midwest. Sustain. Agric. Res. 8, 26–35. doi: 10.5539/sar.v8n2p26
Thilakarathna, M. S., Serran, S., Lauzon, J., Janovicek, K., and Deen, B. (2015). Management of manure nitrogen using cover crops. Agron. J. 107, 1595–1607. doi: 10.2134/agronj14.0634
Turner, N. C. (1986). Adaptation to water deficits: a changing perspective. Aust. J. Plant Physiol. 13, 175–190. doi: 10.1071/PP9860175
UMN (2019). Growing Degree Days Graphs. Available online at: https://swroc.cfans.umn.edu/weather/gdd-graphs (accessed April 21, 2020).
Wagger, M. G., Cabrera, M. L., and Ranells, N. N. (1998). Nitrogen and carbon cycling in relation to cover crop residue quality. J. Soil Water Conserv. 53, 214–218.
Wauters, V. (2020). Agroecological Approaches to Summer Cover Crop Research in Northern Vegetable Rotations. PhD Thesis, University of Minnesota, Twin Cities.
Weaver, S. E., and McWilliams, E. L. (1980). The biology of Canadian weeds. 44. Amaranthus retroflexus L. A. powellii S. Wats. and A. hybridus L. Canad. J. Plant Sci. 60, 1215–1234. doi: 10.4141/cjps80-175
Wickham, H. (2016). ggplot2: Elegant Graphics for Data Analysis. New York, NY: Springer-Verlag. Available online at: https://ggplot2.tidyverse.org
Keywords: summer cover crop, vegetable rotation, organic agriculture, ecosystem service, sorghum-sudangrass, cowpea, sunn hemp, buckwheat
Citation: Wauters VM, Grossman JM, Pfeiffer A and Cala R (2021) Ecosystem Services and Cash Crop Tradeoffs of Summer Cover Crops in Northern Region Organic Vegetable Rotations. Front. Sustain. Food Syst. 5:635955. doi: 10.3389/fsufs.2021.635955
Received: 30 November 2020; Accepted: 26 January 2021;
Published: 19 February 2021.
Edited by:
Timothy Bowles, University of California, Berkeley, United StatesReviewed by:
Zachary Hayden, Michigan State University, United StatesIlias Travlos, Agricultural University of Athens, Greece
Copyright © 2021 Wauters, Grossman, Pfeiffer and Cala. This is an open-access article distributed under the terms of the Creative Commons Attribution License (CC BY). The use, distribution or reproduction in other forums is permitted, provided the original author(s) and the copyright owner(s) are credited and that the original publication in this journal is cited, in accordance with accepted academic practice. No use, distribution or reproduction is permitted which does not comply with these terms.
*Correspondence: Julie M. Grossman, amdyb3NzQHVtbi5lZHU=