 Susana Raffalli
 Carlos Villalobos
- 1Cáritas de Venezuela, Caracas, Venezuela
- 2Escuela de Ingeniería Comercial, Facultad de Economía y Negocios, Universidad de Talca, Talca, Chile
This study aims to assess the patterns of wasting and stunting and their concurrence among vulnerable Venezuelan children. We performed an analysis of 46,462 anthropometric records captured by Caritas Venezuela between 2017 and 2019 and relating to children under 5 years old in the poorest parishes. Based on the WHO 2006 child growth standards, we identify 31.7% and 11.5% of the records from 2019 as stunted and wasted, respectively. Our unconditional analysis shows that stunting was more frequent among boys and shows an inverted U-shape association with age. The prevalence of stunting increases from 0.28 in 2017 to 0.32 in 2019. By contrast, the wasting prevalence decreases from 0.15 in 2017 to 0.11 in 2019. The concurrence of stunting and wasting slightly decreases over the same period from 0.045 to 0.039, all three trends being statistically significant. Using multilevel regression models, our conditional analysis shows that the odds of wasted children being stunted are 1.079 times greater than for non-wasted children. Similarly, the odds of stunted children being wasted are 1.085 times greater than for non-stunted children. While age is not statistically associated with stunting, it reduces the likelihood of being wasted. Furthermore, each additional month of age reduces by 1.16% the odds of facing the simultaneous concurrence of stunting and wasting instead of not facing it. The children's sex is also found to have a significant association with the probability of stunting and wasting. The odds of stunting and wasting amongst boys are found to be 1.19 and 1.084 times greater than for girls, respectively. We also found a significant and sizeable association between food insecurity and both stunting and wasting. Although lack of access to clean water is not associated with stunting, it is associated with higher levels of wasting. Protracted humanitarian crisis in Venezuela has brought considerable damage to child growth. Findings have policy and programming implications: stunting should be targeted as a humanitarian priority in protracted crisis, not only to mitigate the growth failure in children facing multiple nutritional deficiencies, but also as an approach for preventing persistent acute malnutrition.
Introduction
Malnutrition and crises go hand in hand: malnutrition both impacts on and is impacted upon by crises. Acute malnutrition (wasting) has been used as a marker in several food crisis classification frameworks and is the common criterion for child enrollment in humanitarian programs.
Over time in protracted crises, the problem of persistent acute malnutrition becomes increasingly evident and humanitarian programs are caught in a bind. Unfortunately, programs that tend to treat acute malnutrition have limited impact on the underlying causes that contribute to its persistence and on mitigating chronic malnutrition. These issues stimulate both the debate on the performance and efficacy of humanitarian programs and also the debate on the challenges for exit strategies and transition from short term humanitarian responses (Young and Marshak, 2017).
A further area of debate that finds relevance here is the urgent need to consider stunting itself as a target in protracted crisis. Childhood stunting in protracted crises is a double burden. On the one hand, stunting has a multiplying effect on wasting and mortality risks (ENN, 2020), and on the other hand, due to its well-documented association with impaired physical, cognitive, and socioeconomic development of affected populations, stunting undermines programmatic approaches toward resilience (Galasso and Wagstaff, 2016; WFP ECLAC, 2017).
Stunting results from a complex interaction of household, environmental, socioeconomic, and cultural influences that are described in the World Health Organization Conceptual Framework on Childhood Stunting (Stewart et al., 2013). Poor patterns of breastfeeding and complementary feeding practices, combined with high rates of diarrhea, set the stage for short stature. Underlying this are food insecurity, inadequate maternal and child healthcare, insufficient access to safe water and sanitation services, as well as a lack of dietary quality and diversity (Martorell, 2012).
Although usually described separately, stunting, underweight, and wasting frequently co-exist (concurrence) and children with multiple measures of anthropometric failure have a compounded risk of morbidity and mortality. Thus, although stunting and wasting have tended to be viewed separately, there is a growing impetus to consider both conditions together (Prendergast and Humphrey, 2014).
A limited number of studies suggest that wasting may be a direct cause of stunting: studies suggest that growth in height takes place only when the body has a certain minimum of energy reserves (Schoenbuchner et al., 2016). Evidence for the role of stunting as a direct cause of wasting, or alternatively as a protective factor of wasting, was not available in first literature reviews, however recent studies have observed that, at the population level, the periods of lowest linear growth follow the periods of lowest weight acquisition. Some analysis indicates that most children admitted into programs for treatment of acute malnutrition are also stunted (Khara and Dolan, 2014).
Prevalences of wasting and stunting were found to be positively associated in children 12–23 months of age in Asia and Eastern Mediterranean countries, but not in Latin America or Africa. Moreover, the prevalence of stunting at 18–24 months of age was correlated with a history of periods of wasting (Khara and Dolan, 2014).
The divide between wasting and stunting at program, policy, and financing level ultimately has profound implications for how children receive nutritional support and services and may well contribute to the lack of nutritional impact seen in programs that only address acute malnutrition (Khara and Dolan, 2014; Wasting-Stunting Technical Interest Group, 2018).
Several factors have been outlined as problematic when addressing stunting in complex contexts during protracted crisis (Khara et al., 2015). Nutritional needs, and not just food insecurity and acute malnutrition recovery, might need to be integrated into humanitarian responses in order to build the nexus between short-term crisis management and longer-term development, and to make management of wasting more effective (FAO, 2016). This is not an easy challenge: weight-for-height tends to reflect more short-term inadequacy of dietary intake or utilization, and the effectiveness of therapeutic feeding for wasted children is well-established. However, the mechanisms underlying linear growth failure and interventions to prevent or mitigate stunting are less clearly defined.
By ignoring stunting not just as an indicator of the chronicity and severity of food and nutrition crises, but also as a target, we are failing to tackle the increased mortality risk that arises from the multiplicative effects of concurrent wasting and stunting (ENN, 2020). Gaining a clearer and common understanding of the relationship between wasting and stunting has the potential to support organizations to better justify, design, and evaluate humanitarian programs in improving childhood nutrition in protracted crisis (Khara and Dolan, 2014).
This paper reviews the pattern of stunting and wasting among children under 5 years old screened in Caritas Venezuela's Points of Care over a 3-year period (2017–2019). Its aims are also to contribute to the evidence that supports the understanding of the relation between wasting and stunting and the necessity of bridging the division between the two, and to furthermore identify drivers of malnutrition in order to improve nutrition programming and outcomes in protracted crisis.
The Context
Venezuela has been submerged in a complex humanitarian emergency over the last 5 years. This was belatedly included as an emergency for the first time in the “Global Humanitarian Overview (GHO) 2020” (UN OCHA, 2020).
The Assessment Capacities Project (ACAPS) estimates the number of people facing humanitarian needs at almost 14 million (more than half of the population), those affected by the crisis at 27.36 million (100% of population), and the number of people displaced at more than 5 million. This is now increasing the pressure of food insecurity, health, and sanitary risks all over Latin America (ACAPS, 2020).
According to the Humanitarian Response Plan and Humanitarian Needs Overview 2020 (UN OCHA Venezuela, 2020), the humanitarian situation has reduced people's access to food and nutrition. The preventive measures implemented in the country to deal with the COVID-19 pandemic impacted the income and livelihoods of the most vulnerable people.
According to the State of Food Security and Nutrition in the World 2019, Venezuela has seen an increase in the undernourishment rate since 2012. Recently, the “Latin America Food Security and Nutrition Outlook 2020” by the UN interagency group reported that the undernourishment rate escalated from 21.2% (6.8 million people) in 2016–2018 to 31.4% (9.1 million people) in 2017–2019 (FAO, 2020).
Additionally, the “Global Report on Food Crises” stated that Venezuela presents the fourth-largest food crisis in the world (FSIN, 2020), and the World Food Program reported in its national food security assessment 2019 that one out of three Venezuelans (32.3%) is food insecure and in need of assistance (WFP, 2019).
The “Humanitarian Response Plan 2020” also reported that limitations on access to food, safe water, hygiene items, and basic information on good feeding practices in the most vulnerable households have affected the nutritional status of children under age 5, with repercussions for their physical and cognitive health and development. According to data from the National Institute of Nutrition (INN), 4% of this population group were affected by severe acute malnutrition in 2019 before the Covid-19 pandemic (UN OCHA Venezuela, 2020).
In October 2020 UNICEF Venezuela registered a global acute malnutrition (GAM) rate of 15.3% based on data collected by implementation partners and using anthropometric screenings in children under 5. Severe acute malnutrition was 3.9%. In December 2019, the data show a stunting rate of 26.5% among children under 5 and that 30.6% of all children are at risk of stunting. While this information is not statistically representative at the national level it provides guidance for decision-making and prioritization of interventions (UNICEF Venezuela, 2019, 2020).
In the view of the Academies of Sciences on Challenges and Opportunities for Food and Nutrition Security in The Americas (IANS), Venezuela's crisis affected the entire food system in Venezuela. With an unstable and deficient food supply and galloping hyperinflation, the population depends highly on social protection programs and remittances from displaced Venezuelans. Venezuela's economic crisis is also affecting researchers, with science under siege, however the scientific community continues to investigate and report (IANAS, 2017).
Methods and Data
Data Collection
This study is informed by a pattern analysis of anthropometric records for children under 5 years old and in the poorest parishes in Venezuela, captured over 3 years of operations (2017, 2018, 2019) at Caritas Venezuela's Points of Care1. Children's parents signed their informed consent allowing the program to perform the anthropometric children's measurement as well as consenting to the anonymized use of the collected data for humanitarian and academic purposes.
Weekly nutritional screening procedures for children under 5 are conducted in each Caritas at district and community level in the poorest parishes of Venezuela. These include nutrition fairs, individual assessments of children brought to Caritas spontaneously by their caregivers, and screening of children that attend weekly community kitchens. Therefore, the data has been collected via a self-selection process that necessarily includes some of the most vulnerable children in the poorest parishes, rather than a nationwide survey based on probability sampling procedures.
Our data is not strictly representative of all Venezuelan children but rather of those attending the Caritas program. However, the assumed negative self-selection of children, or in other words the assumption that those attending Caritas Venezuela's Points of Care are likely to be on average the worst-off children, could be challenged. At least four factors suggest to us that many other children are dealing with extremely precarious conditions without access to any care: (i) The coverage of Caritas' humanitarian response is still small in comparison with the demands of a nationwide crisis, especially in remote areas and in neighborhoods away from Caritas' Points of Care. (ii) Families that are aware of Caritas' program nonetheless face transportation costs and scarcity of cash, public transportation, and fuel. Therefore, the worst-off families may not be able to send their children to the Caritas Points of Care. (iii) Adaptation and mental conditioning. As pointed out by Sen (1999): “The deprived people tend to come to terms with their deprivation because of the sheer necessity of survival […] and may even adjust their desires and expectations to what they unambitiously see as feasible.” In this context, the adaptation of caregivers in poor families feeds into the “normalization” of wasting and stunting. There is not enough awareness of the nutritional risks, and small and wasted children are not necessarily seen as unhealthy. (iv) Many poor families see the government and third-party food programs as substitutes for rather than complements of one another. Thus, recipients of government support may exclude themselves from the possibility of enrolling in Caritas' humanitarian response program on the assumption that being a Caritas beneficiary could result in exclusion from the official schemes of social protection. The above four conditions could challenge the assumption that our dataset consists mostly of the worst-off children. In that sense, although our data can only represent those groups of children included in the dataset, it is also possible that our analysis may reflect the nutritional hardship of a substantially higher number of children in the country.
For the screening procedures, weight and height of all children aged 0–59 months were measured following WHO and UNICEF guidelines (WHO, 2019). Caritas' staff had been trained and standardized twice a year in the proper management of anthropometric measurements. Birth dates were obtained directly from caregivers and/or from birth certificates.
We used the 2006 Child Growth Standards of the World Health Organization (WHO) to calculate the following anthropometric indices: length-for-age z-score in children under 2 years old, height-for-age z-score in children under 5 years old (referred to hereafter as “HAZ”), and weight-for-height z-score in children under 5 years old (referred to hereafter as “WHZ”).
Children were classified as “wasted” if they had a WHZ < -2 standard deviations from the median of the 2006 WHO Child Growth Standards. Following the same standards, children were “stunted” if they had a HAZ < -2 standard deviations from the median. Children were defined as “severe wasted” if they had a WHZ < -3 standard deviations from the median, and “severe stunted” if they had a HAZ < -3 standard deviations from the median.
The information collected from Caritas' beneficiaries during the reported period does not include information on the socio-economic profile of children's households. However, we complemented the children-level anthropometric data captured at Caritas' Points of Care, merging it to a district-level dataset on food insecurity in households and access to running water from the World Food Program Food Security Assessment, Venezuela (WFP, 2019). Descriptive statistics of the merged dataset are presented in Table 1 in the section FINDINGS. It contains children's anthropometric information alongside the percentages of households facing moderate food insecurity, severe food insecurity, and no access to running water.
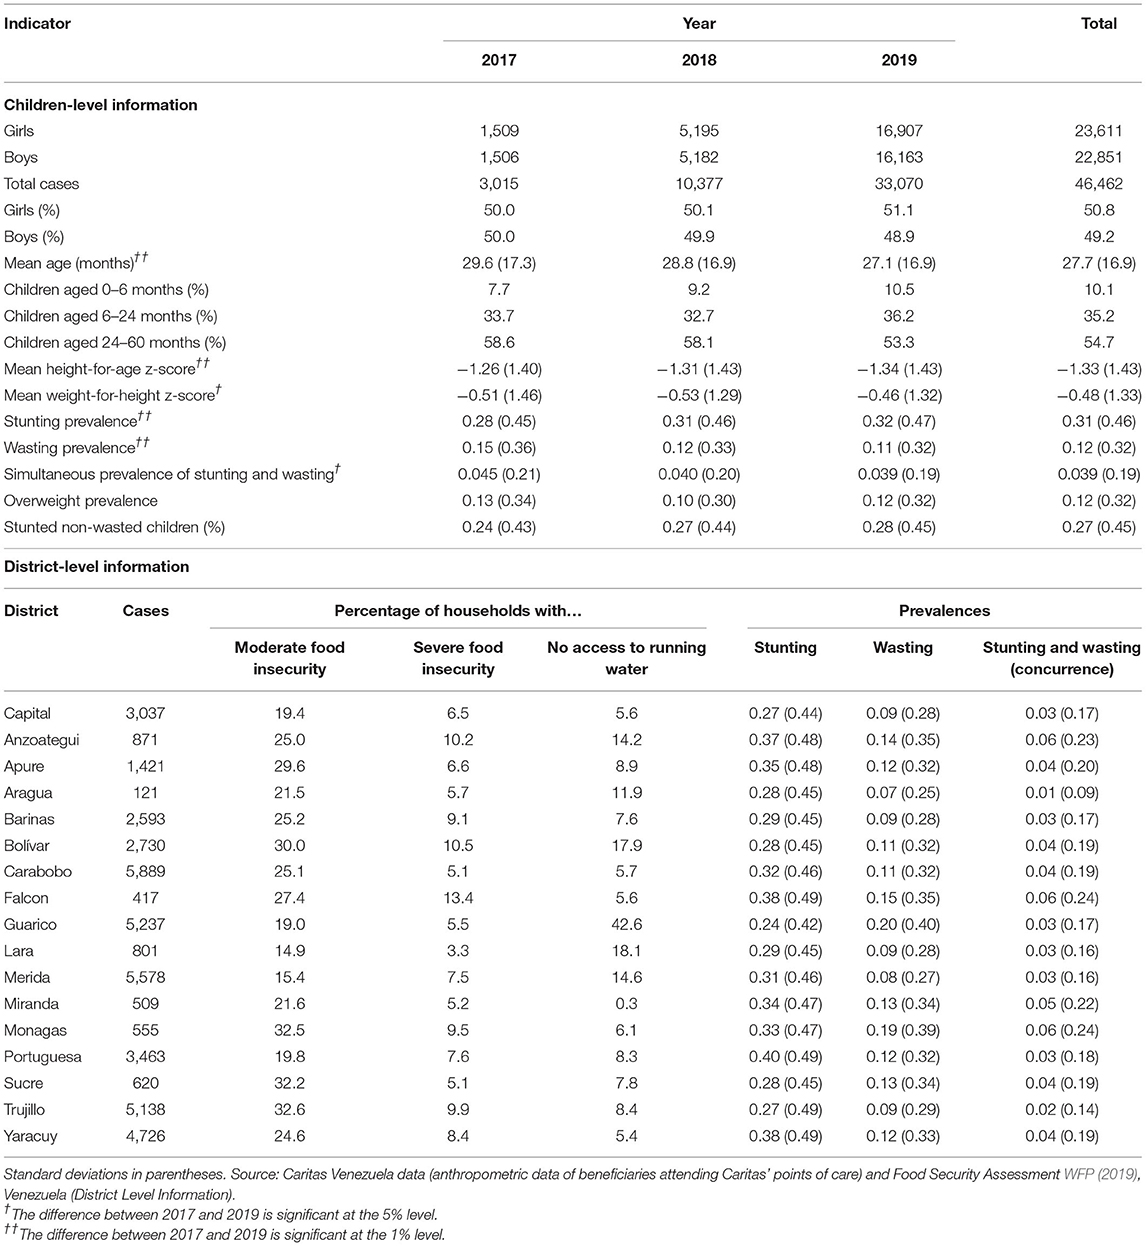
Table 1. Descriptive statistics.
WFP defined food insecurity by exploring food consumption patterns, food and livelihood coping strategies, and economic vulnerability. Based on the combination of these indicators, moderately food-insecure households are identified as those showing significant food consumption gaps or being marginally able to meet minimum food needs only with the use of irreversible coping strategies. Severely food-insecure households are those that show an extreme food consumption gap or have experienced extreme loss of livelihood assets that will lead to food consumption gaps (WFP, 2019).
Anthropometric Analysis
Anthropometric data were analyzed using height-for-age and weight-for-height z-scores and prevalence of stunting, wasting, and their concurrence, comprising 46,462 observations. This analysis takes into account the literature in terms of scale, severity, age, and seasonality from other protracted crises.
Regression Analysis
The focus of the empirical analysis is to achieve a conditional descriptive outlook for programming decisions rather than to investigate the causes of malnutrition. With this aim, we perform two types of conditional analyses. First, we identify the conditional association between wasting, stunting, and the concurrence of the two using the set of available individual predictors (demographic and anthropometric information) as well as the drivers of malnutrition at district level (food security and access to water). The aim is to explore how different explanatory variables at individual and district level affect the probability of being stunted, wasted, and of being wasted and stunted simultaneously (concurrence). Second, we assess association of the same vector of predictors with the height-for-age z-score, and the weight-for-height z-score as dependent variables. The objective of this second analysis is to assess the factors that are associated with the level of the z-scores.
In our first type of analysis, we rely on two alternative estimation methods: a logistic regression model and a multilevel logistic model. In the logistic model, the nested structure of the dataset is neglected and consequently the linear model assumption of independence of the residuals is violated; in other words, children nested in the same districts are more likely to function more similarly than children nested in other districts (Bressoux, 2010). In order to overcome this structural limitation, we move forward by using a multilevel logistic model in which the 46,462 children are nested in 19 districts (see Table 1).
The dependent dichotomous variables are stunting, wasting, and concurrence. These dependent variables take the value of 1 if a child is stunted, wasted, or is stunted and wasted simultaneously, and 0 otherwise. The explanatory variables consist of dummy variable (wastingi) for the stunting equation, and (stuntingi) for the wasting equation. These dummies take the value of 1 if a child is wasted or stunted and 0 otherwise. The list of explanatory variables continues with the continuous variable (agei) in months. The sex of a child is captured by the variable (sexi). To be born during the rainy season of a given year is captured by (rainyi), and dummy variables for the year in which the anthropometric information was collected (yeart), with screening in 2017 as the reference category. The explanatory variables at the district level include the percentage of households facing moderate food insecurity in the correspondent district (mfij), the percentage of households with severe food insecurity (sfij), and the percentage of households with no access to running water (nowaterj).
In the logistic regression model for the underlying probability πij of being stunted, wasted, or both is a linear function of the predictors. Then, Equation (1) displays the saturated model for the log-odds of being stunted instead of being non-stunted:
Similarly, Equation (2) shows the saturated model for the log-odds of being wasted instead of being non-wasted:
As for the multilevel logistic model, we estimated four model specifications for each dichotomous dependent variable indicating if a child is stunted, wasted, or faces stunting and wasting simultaneously.
Firstly, as shown in Equation (3), we estimate the empty multilevel logistic regression model, with associated district-level probabilities πij, and (1− πij).
The chance that a child i from district j is stunted or wasted instead of not being either is explained by the fixed intercept β0 and a deviation of the 19 district-specific intercepts U0_j from the fixed intercept, assuming that the mean of such deviations is zero. These parameters provide information about the extent of the variation of the intercepts. Here, the higher the variance of the random intercept σU0_j, the larger the variation of the log-odds of being stunted or wasted from one district to another. In other words, it is a measure of the degree to which children are more likely to be stunted or wasted in some districts than in others.
Second, we estimate multilevel logistic regression models using the vector of predictors allowing only for random intercepts. The associated probabilities are πij, and (1 − πij). The equations for stunting and wasting are shown in Equations (4) and (5), respectively.
Third, Equations (6) and (7) show the multilevel logistic regression models for the associated probabilities πij, and (1 − πij) for stunting and wasting, respectively. They use the vector of predictors allowing for random intercepts and for a distinct random slope for the continuous variable age.
Four, following the Barr et al. (2013) approach, we estimate the maximal multilevel logistic regression model that includes all random slope variance parameters. Equations (8) and (9) show the models for stunting and wasting, respectively.
The models for stunting showed in Equations (1), (4), (6), and (8), were also estimated excluding the explanatory variable (wastingi). Similarly, the models for wasting in Equations (2), (5), (7), and (9), were also estimated excluding the explanatory variable (stuntingi).
The inclusion of the endogenous explanatory variables (wastingi) and (stuntingi) aims to test the endogeneity of both conditions. That is, the fact that the probability of stunting can be affected by wasting conditions in children, and vice versa. Moreover, there are good reasons to believe that although they are not identic, the drivers of stunting and wasting are correlated. If so, the implications for programming are that neither condition should be treated as though it were independent of the other. To investigate this issue, we create a new dependent variable that takes the value of 1 if a child faces wasting and stunting simultaneously (so-called concurrence) and 0 otherwise. The probabilistic model for concurrence is described in Equation (10):
The empty multilevel logistic regression model, with associated district-level concurrence probabilities πij, and (1 − πij) is similar to the one presented in Equation (3).
Finally, the Equations (11) and (12) show the multilevel logistic regression models for the associated concurrence probabilities πij, and (1 − πij) allowing for random intercepts and for the random slope in the variable (age), and also including the random slopes for (sex), and (rainy), respectively.
Although not strictly necessary, and given the fact that we are interested in the effect of the district-level explanatory variables and also in the absolute (between-children) impact of the individual predictors, we decided to grand-mean center the predictor variables (Sommet and Morselli, 2017). Consequently, the fixed intercept β0 corresponds to the log-odds that the dependent variable equals 1 when all predicted variables are set to their mean values. On the other hand, the associated slope coefficients correspond to the average general effect. For instance, in Equations (11) and (12) a one-unit increase in the grand-mean centered individual-level variable ageij translates into an average change of β1 in the log-odds that the dependent variable equals 1 for the whole sample. In other words, the fixed slope of the grand-mean centered ageij indicates the general between-children effect of ageij, regardless of the district in which children were screened.
All multilevel logit models report the Interclass Correlation Coefficient defined as . The ICC is used as a measure of the between-district variation in the total variation. An ICC = 0 indicates perfect independence of the residuals, that is, the observations do not depend on the children's district. By contrast, ICC = 1 indicates that the observations only vary between districts.
In all probabilistic models, the vector of slopes βk captures the change in the logit of the probability associated with the one-unit change in the k-th predictor. Additionally, exp{βk} represents an odds ratio: that is, the ratio of the probability to its complement or the ratio of stunted, wasted, and concurrence cases to non-stunted, non-wasted, and non-concurrence cases associated with the k-th predictor.
In our second type of analysis, we estimate linear regression equations having as dependent variables the continuous height-for-age and weight-for-height z-scores. The vector of explanatory variables is the same as the one used in the logit and multilevel logit models for stunting and wasting. In this empirical exercise, beside the impact of the mentioned predictors, it is of crucial interest to assess the impact that the stunting condition has on the weight-for-height z-score, and the impact that the wasting condition has on the height-for-age z-score. These models are estimated using robust standard errors allowing for intragroup (district) correlation.
It is important to note that all empirical analyses deal with the following limitations: (i) The lack of information on the broad socio-economic situation in the households of the children screened at Caritas' Points of Care. In consequence, the omitted variable is an issue. In particular, the possibility that unobserved socio-economic characteristics could be correlated with some of the predictors. (ii) The self-selection of vulnerable children into the program (Caritas' Points of Care are located in the poorest parishes of the country). We are positive that these limitations, in particular the lack of representativeness of the data at the national level, do not prevent the possibility of identifying conditional correlations with malnutrition drivers that affect vulnerable children and guide us to relevant programming conclusions. Thus, we advocate the view by Amartya Sen and Martha Nussbaum: it is preferable to be vaguely right than precisely wrong.
Findings
Anthropometric Analysis
Table 1 summarizes descriptive statistics and provides a summary of the anthropometric information. Records used for the analysis were 46,462. The total number of children screened increased dramatically between 2017 and 2019 following the expansion of Caritas' humanitarian response.
The observed difference in the height-for-age and weight-for-height z-scores between 2017 and 2019 are statistically significant at the 1% and 5% level, respectively. Prevalence of stunting is above the “very high” threshold for the severity of malnutrition, according to WHO classification (WHO, 2000; de Onis et al., 2019).
Pattern of Stunting
Unconditionally, stunting prevalence shows an inverted U-shape when plotted against the age of children in months. Both total and severe stunting increased with increasing age up to 20 months.
In 2019, the pattern of stunting (shown in Figure 1) in the first 1,000 days of life is consistent with the pattern demonstrated in many countries facing chronic poverty. Stunting prevalence after year 2 (24th month) declines slightly. At the age of 20th month, the stunting prevalence reaches the highest level (41% for total stunting and 16% for severe stunting). Severe stunting shows a similar pattern but with a less sharp trend. Stunting prevalence reaches near 25% for total stunting and 7% for severe stunting in children aged 50–60 months.
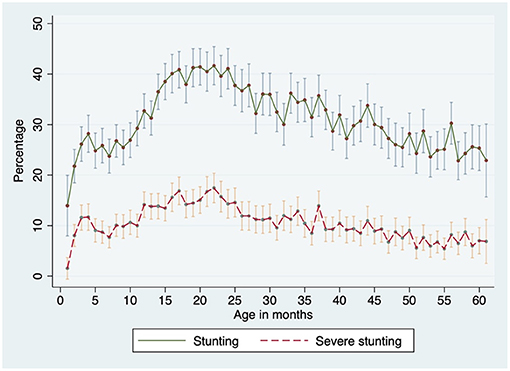
Figure 1. Prevalence of stunting over children's age in 2019. Source: Own elaboration based on Caritas Venezuela data. 95% confidence intervals. Stunting was defined according to the 2006 WHO growth standards.
Table 2 shows that the stunting prevalence is statistically higher (4.2 percentage points) among boys than among girls in 2019. The gap bias against boys is still significant in severe stunting, reaching 2.9 percentage points in the same year. Prevalence of stunting and severe stunting is statistically higher in 2018 and 2019 when compared with 2017. The prevalence of stunting increased from 28.7% in 2017 to almost 32% in 2019.
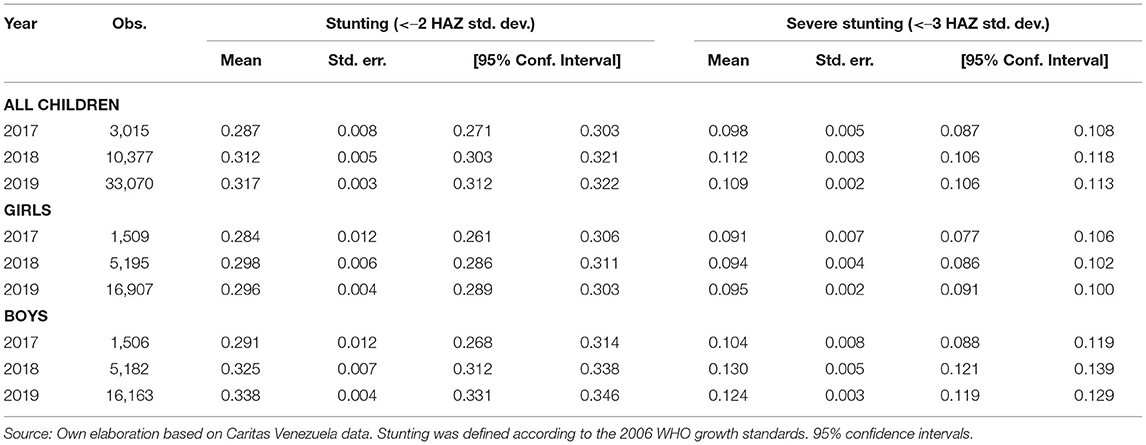
Table 2. Prevalence of stunting and severe stunting in program's children.
In children under 6 months of age (not shown in the table), stunting prevalence reaches 25% in 2019. In that year, stunting figures at this age reveal themselves to be statistically significantly higher among boys (27.5%) when compared to girls (22.6%). Similarly, in 2019, the prevalence of severe stunting at 9.5% is statistically significantly higher among boys (10.7%) than among girls (8.3%).
To better understand the stunting pattern, Figure 2 shows that the entire length-for-age/height-for-age z-score distribution is shifted to the left as compared with the WHO Child Growth Standards in each of the analyzed years.
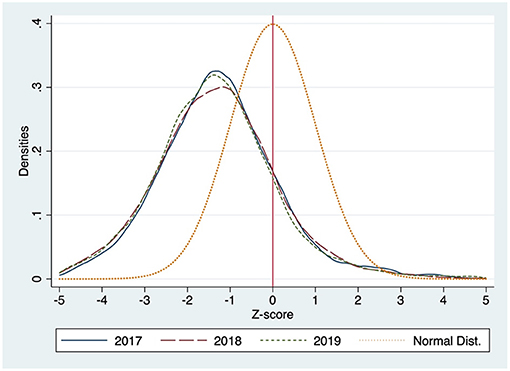
Figure 2. HAZ-Score densities 2017–2019. Source: Own elaboration based on Caritas Venezuela data.
According to the 2019 z-scores analyzed for HAZ shown in Figure 3 (based on 33,070 valid observations), 95% confidence intervals allow us to state that the HAZ-scores decrease from childbirth up to the 23rd month of age among boys, and up to the 37th month of age among girls. Then, the trend remains stable before it starts to slightly improve in both sexes after the 45th month of age. This trend shows a strong correspondence with the trend of stunting prevalence shown in Figure 1. Moreover, the data shows a statistically significant bias against boys until the 30th month of age. Thereafter, the gender gap dissipates.
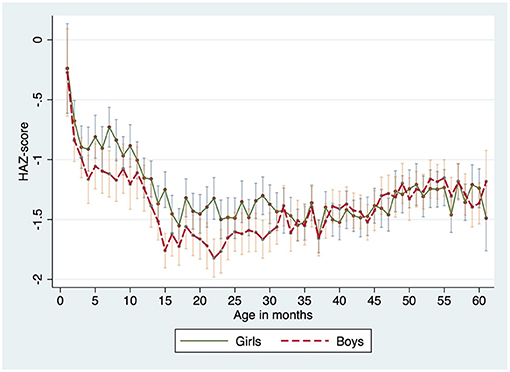
Figure 3. Height-for-age z-score by sex in 2019. Source: Own elaboration based on Caritas Venezuela data. 95% confidence intervals.
When assessing the stunting in absolute terms as the total deficit of the linear growth faltering, 95% confidence intervals confirm a mean deficit in 2019 of around 5 cm by the age of 24 months and around 6 cm by the age of 60 months. Moreover, boys tend to be statistically slightly worse-off than girls during the first 24 months of age (see Figure 4 and Victoria et al., 2014).
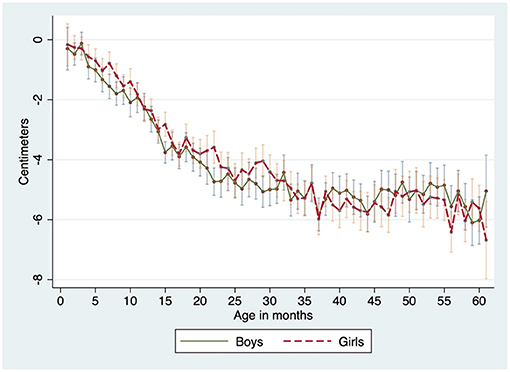
Figure 4. Linear growth faltering over children's age by sex in 2019. Source: Own elaboration based on Caritas Venezuela data. 95% confidence intervals.
Figure 5 shows seasonality patterns of linear growth faltering and HAZ-scores by age in 2019. Infants born in the first semester of the year (January to June) showed greater linear growth faltering until the 30th month of age. Thereafter, the gap closes. Similarly, those children born during the first 6 months of each year tend to present statistically significantly lower HAZ-scores than their counterparts born during the second 6 months of each year.
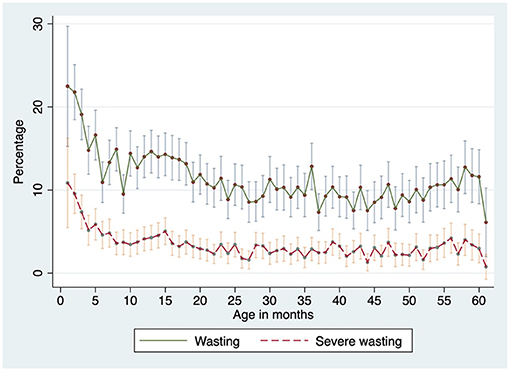
Figure 5. Prevalence of wasting over children's age in 2019. Source: Own elaboration based on Caritas Venezuela data. 95% confidence intervals. Wasting was defined according to the 2006 WHO growth standards.
Pattern of Wasting
In 2019, wasting prevalence peaks at the first month of age and then it decreases with increasing age up to 24 months of age (shown in Figure 6). At the age of 24 months the wasting prevalence stabilizes around 10%. Severe wasting prevalence shows a similar pattern but with a less sharp trend.
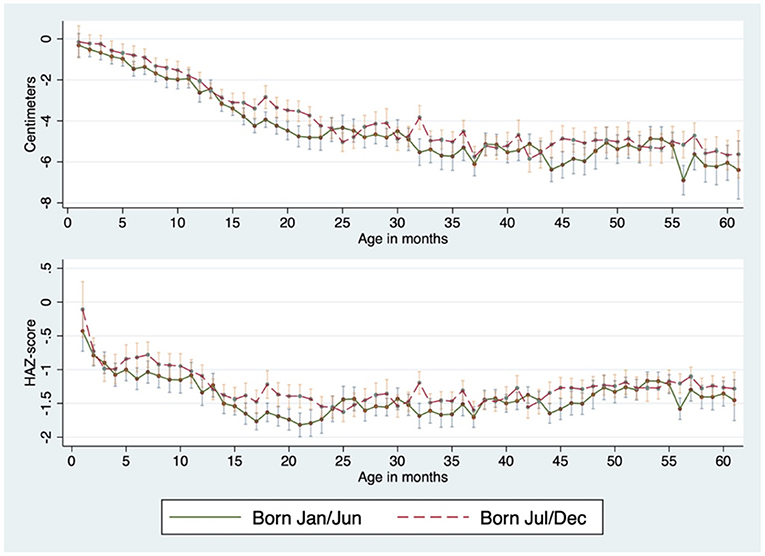
Figure 6. Linear growth faltering in centimeters and height-for-age z-score by birth season in 2019. Source: Own elaboration based on Caritas Venezuela data. 95% confidence intervals.
Table 3 shows the wasting information. Ninety-five percent confidence intervals (95% CI) show that the wasting prevalence among boys is not statistically higher than their female counterparts. Wasting prevalence decreased significantly over the period of analysis (2017–2019), from about 15% in 2017 to 11.5% in 2019.
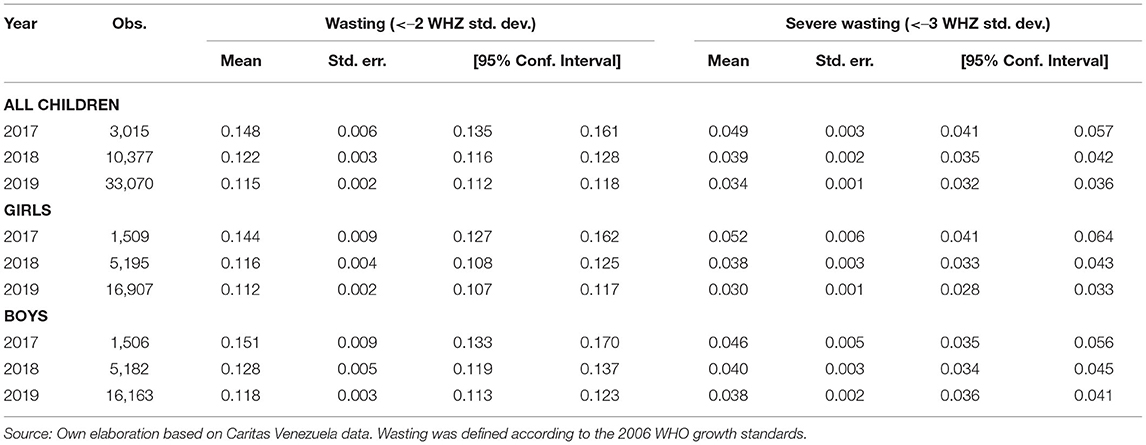
Table 3. Prevalence of wasting and severe wasting in program's children.
Regarding the distribution of the WHZ score over age in 2019 (shown in Figure 7), children exhibit the lowest z-score, on average, during the first months of age. Then, it increasingly levels off up to the age of 5 months. Thereafter, the score remains somewhat constant. Confidence intervals of 95% don't allow us to detect a fundamental difference between the trends experienced by children according to their birth season and according to their sex. On average these children have a WHZ score of −0.96, and 22.5% of them are wasted. Thus, our data confirms that low birth weight is a substantial problem among vulnerable children in Venezuela.
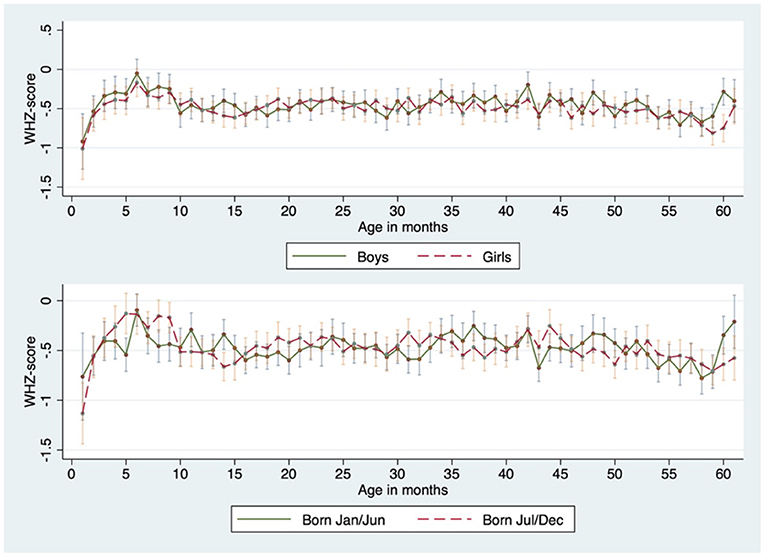
Figure 7. Weight-for-height z-score by sex and by birth season in 2019. Source: Own elaboration based on Caritas Venezuela data. 95% confidence intervals.
Worryingly, the mean z-score for WHZ and prevalence of wasting are above the “CRITICAL” threshold for the severity of malnutrition according to WHO classification over the entire period2.
Wasting and Stunting Concurrence
Table 4 shows that from the 46,462 valid entries in our dataset, 1,823 children (3.92%) are simultaneously stunted and wasted, and of them (not shown in the table) 11.5% are severely wasted and severely stunted. We found that 12.51% of all stunted children are simultaneously wasted. Meanwhile, 33.05% of all wasted children are at the same time stunted. It is worth noting that the prevalence of stunting among wasted children is, on average, above 2.6 times higher than the prevalence of wasting among stunted children. The prevalence of stunting conditional to wasting is higher among boys at the 1% confidence level. Similarly, the prevalence of wasting conditional to stunting is higher among boys at the 5% confidence level.
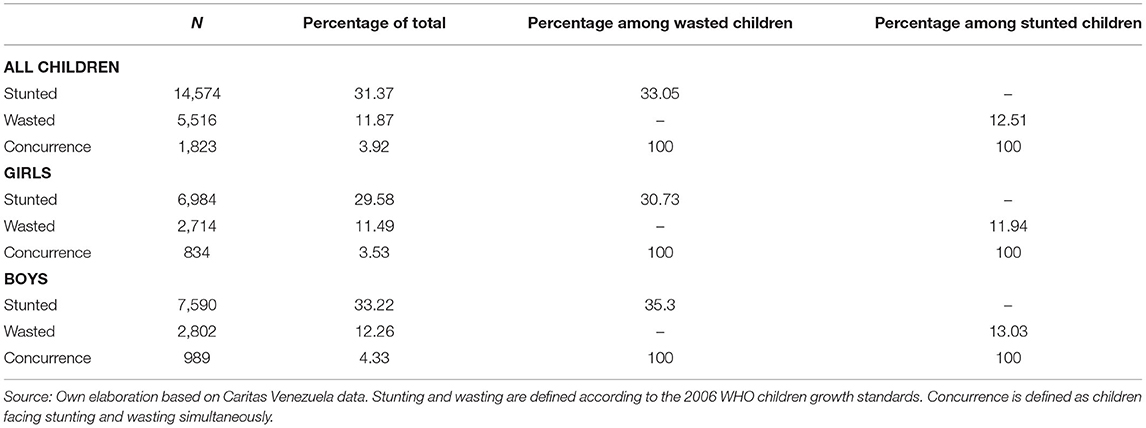
Table 4. Contingency table: stunting, wasting, and concurrence (whole sample).
Figure 8 shows the concurrence of stunting and wasting over age for all children in 2019. Confidence intervals of 95% show that it is statistically higher between the 10th and 20th month of age (within the 1,000 days).
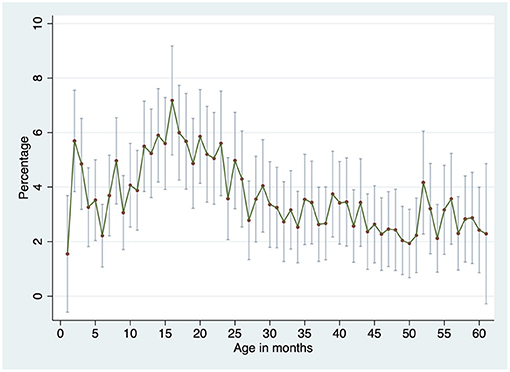
Figure 8. Prevalence of wasting and stunting concurrence over children's age in 2019. Source: Own elaboration based on Caritas Venezuela data. 95% confidence intervals. Stunitng and wasting were defined according to the 2006 WHO growth standards.
Regression Analysis: Drivers of Wasting and Stunting
Drivers of Stunting
The findings of the logit and multilevel logit models for stunting are displayed in Table 5. Our preferred model (the saturated one) in column (9) shows that age is not significantly associated with stunting.
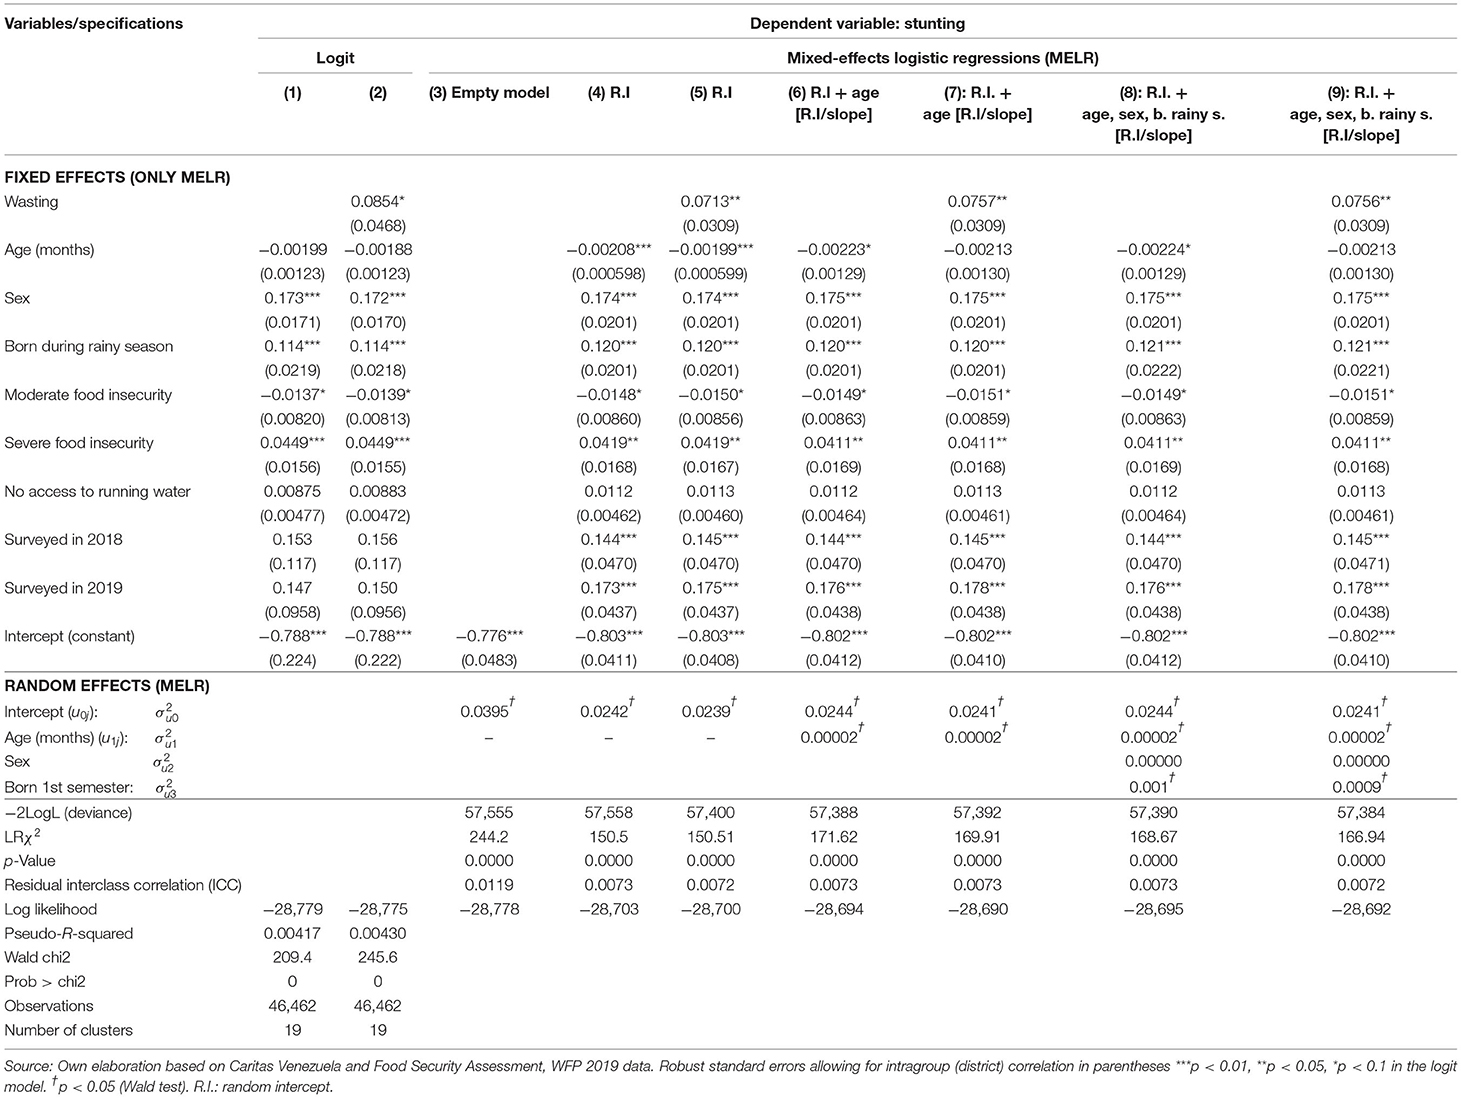
Table 5. Logit and multilevel logistic regression specifications for the probability of being stunted.
The children's sex is also found to have a significant association with the probability of stunting. The odds of boys being stunted are about 1.19 times greater than for girls.
Interestingly, we found that the period of the year in which a child is born can predict their likelihood of being stunted. The odds of children born between January and July (rainy season) being stunted are 1.13 times greater than the odds of their counterparts born between August and December being stunted.
We find that an increased share of households with food insecurity in the district increases the probability of stunting. Given the positive Pearson's correlation of 0.4178 between moderate and severe food insecurity, the coefficient results should be interpreted not in isolation but together. Our results show that if an increase in severe food insecurity goes hand in hand with an increase in moderate food insecurity, then the probability of stunting increases at a decreasing rate. Just for reference, when there is a 1 percentage point increase in the share of households with severe food insecurity, we expect to see about a 4.2% increase in the odds of being stunted.
Although not statistically significant, in districts where there is a 1 percentage point increase in the share of households with lack of access to running water, the odds of being stunted increases by 1.1%. Note that the lack of significance of this result should be interpreted with caution as this association only uses between-district variation. If children-level data were available, one might well find a significant association between clean water and stunting.
Finally, the year dummies tell us about the relationship between the year in which the child was screened and the probability of being stunted or not being stunted. When compared with 2017, the odds of children screened in 2018 and 2019 being stunted are about 1.156 and 1.195 times greater, respectively. The self-selection into the screening program does not allow us to dismiss the possibility that the stunting has become more prevalent among all children in Venezuela since 2017. However, our data shows that among the group of screened children, stunting has become more prevalent, and thus our conditional analysis confirms the unconditional information presented in Table 1.
Drivers of Wasting
The findings of the logit and multilevel logit models for wasting are displayed in Table 6. According to our preferred model (the saturated one) in column (9), we find that age is significantly associated with wasting. Each additional month of age reduces by 1.44% the odds of being wasted. This finding also holds in all other specifications.
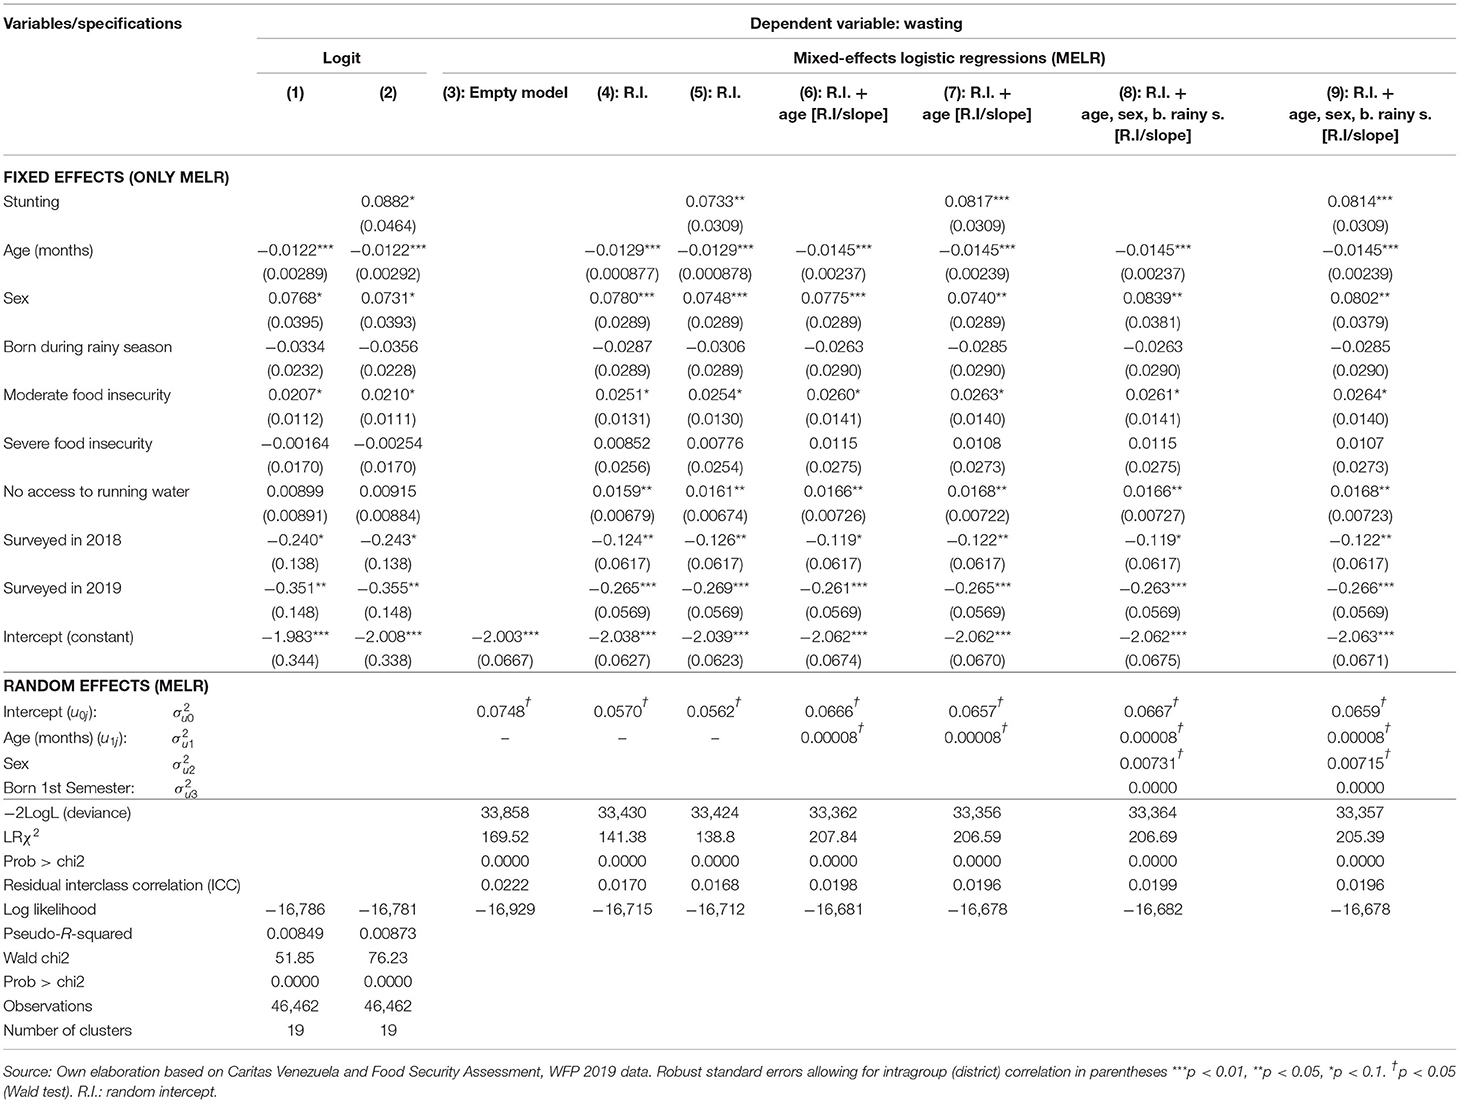
Table 6. Logit and multilevel logistic regression specifications for the probability of being wasted.
The children's sex is also found to have a significant association with the probability of wasting across all models. The odds of boys being wasted are about 8.4% higher than for girls.
We also found that the season of the year in which a child is born is not a predictor of the probability of being wasted.
On the determinants related to food insecurity, we find that the district shares of households with severe food insecurity is not associated with the probability of wasting. By contrast, moderate food insecurity increases the probability. A 1 percentage point increase in the district share of households with moderate food insecurity increases the odds of being wasted by 2.7%. Similarly, the lack of access to running water is statistically associated to the probability of children being wasted. In districts where there is a 1 percentage point increase in the share of households with lack of access to running water, the odds of being wasted increase by 1.7%.
When compared with 2017, the odds of children screened in 2018 and 2019 being wasted are about 11.5% and 23.3% higher, respectively. This result confirms the unconditional analysis presented in Table 1.
Integrating our results for stunting and wasting, we find clear evidence that there is reverse causality between the condition of stunting and wasting. That is, the wasting condition increases the probability of a child of being stunted and vice versa. However, the predictors of stunting and wasting differ significantly. For instance, boys relative to girls are more likely to be stunted than wasted. We also find that food insecurity explains to a greater extent stunting than wasting. Moreover, although the lack of access to running water does not show up as a stunting predictor, it predicts the probability of a child facing wasting.
Drivers of Wasting and Stunting Concurrence
First, we find that a wasted child is more likely to be stunted. Using the odds ratios to interpret the results, we find that the odds of wasted children being stunted are 1.079 times greater than for non-wasted children (see Table 5). Similarly, the odds of stunted children being wasted are 1.085 times greater than for non-stunted children (see Table 6).
Table 7 shows our results regarding the drivers of the concurrence of stunting and wasting. We find that age, sex, the season of birth, and severe food insecurity have statistically significant impacts on the simultaneous occurrence of stunting and wasting. These impacts are robust to the different model specifications.
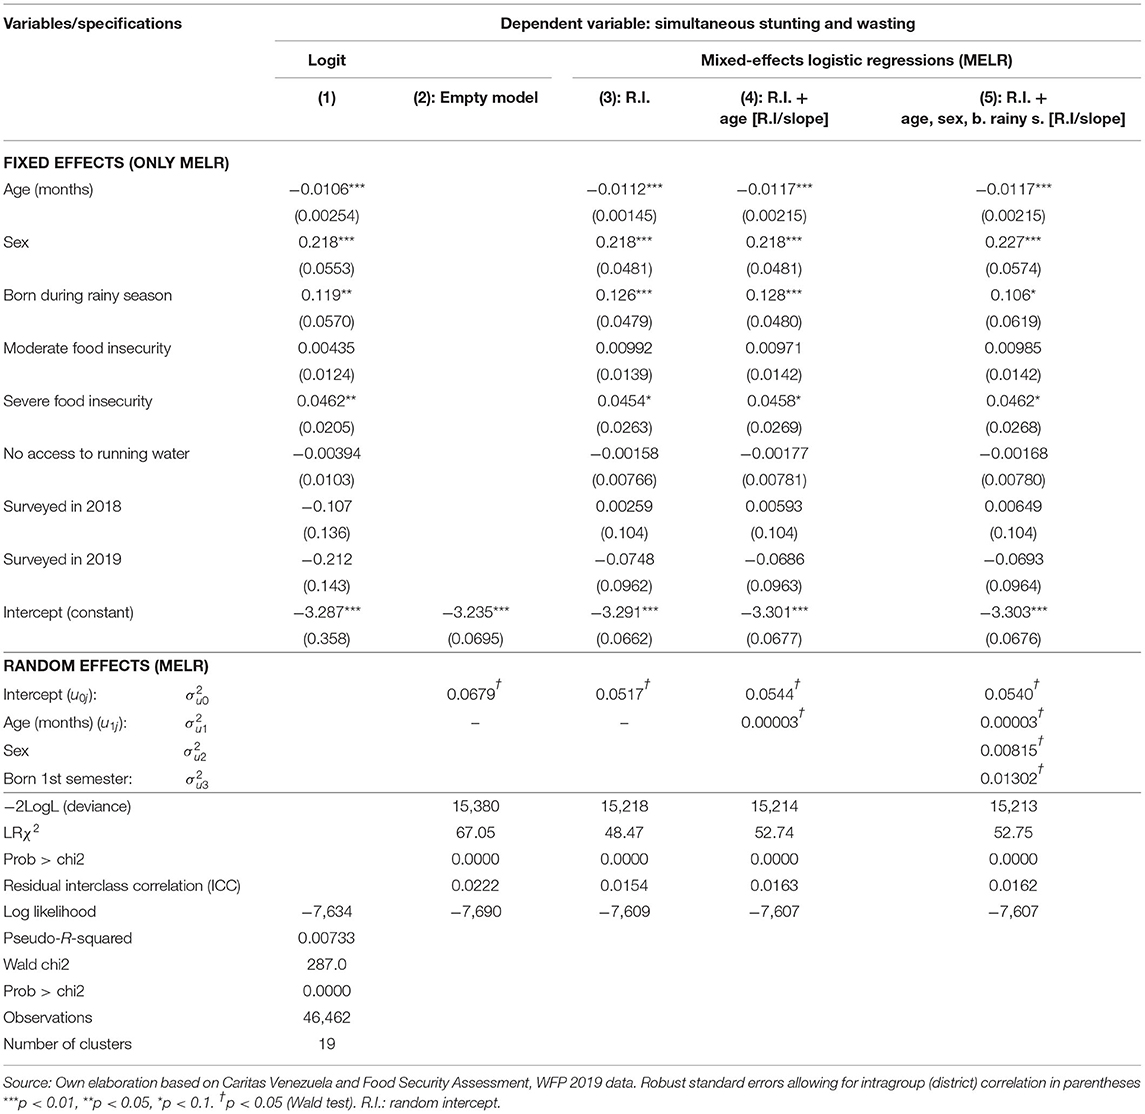
Table 7. Logit and multilevel logistic regression specifications for the probability of being simultaneously stunted and wasted (concurrence).
Our preferred specification in column (5) in Table 7 shows that each additional month of age reduces by 1.2% the odds of facing the simultaneous occurrence of both wasting and stunting.
The children's sex is also found to have a significant association with the probability of concurrence. The odds of boys facing concurrence are 25.5% higher than for girls.
We find that the season of the year in which a child is born is a predictor of the probability of concurrence. In fact, the odds of children born between January and July (rainy season) facing concurrence are 1.11 times higher than the odds of their counterparts born during the rest of the year facing concurrence.
Finally, severe food insecurity at the district level is strongly associated with the simultaneous concurrence of stunting and wasting. For instance, a 1 percentage point increase in the district share of households with severe food insecurity increases by 4.7% the odds of facing concurrence of stunting and wasting.
The Determinants of the HAZ and WHZ-Scores
The results of our multiple linear regression models in Tables 8, 9 show that being wasted reduced the HAZ-score by 0.064, while being stunted reduces the WHZ-score by 0.054. This evidence supports the correlation between both conditions.
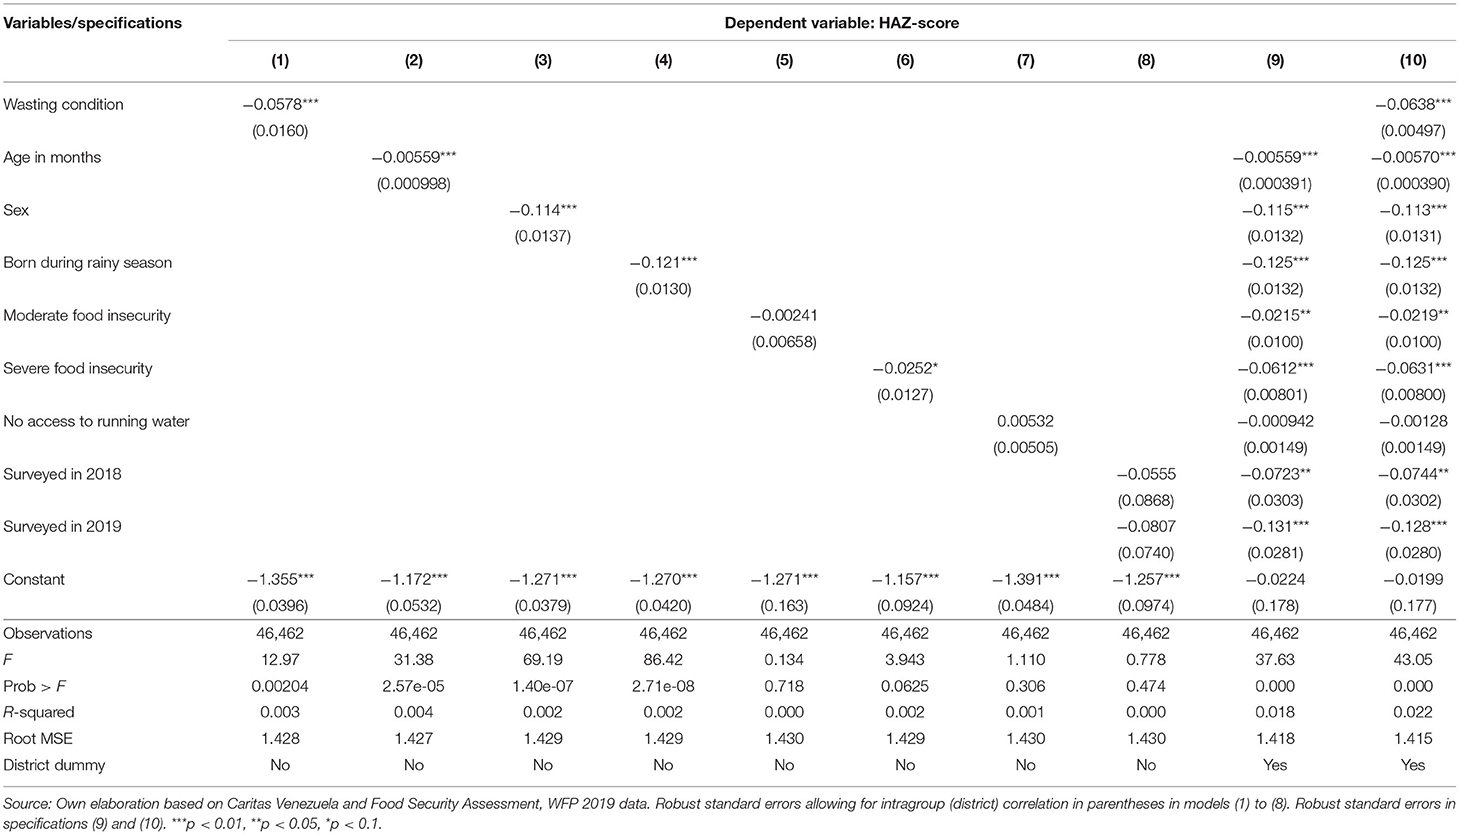
Table 8. Linear regression models for the height-for-age z-score.
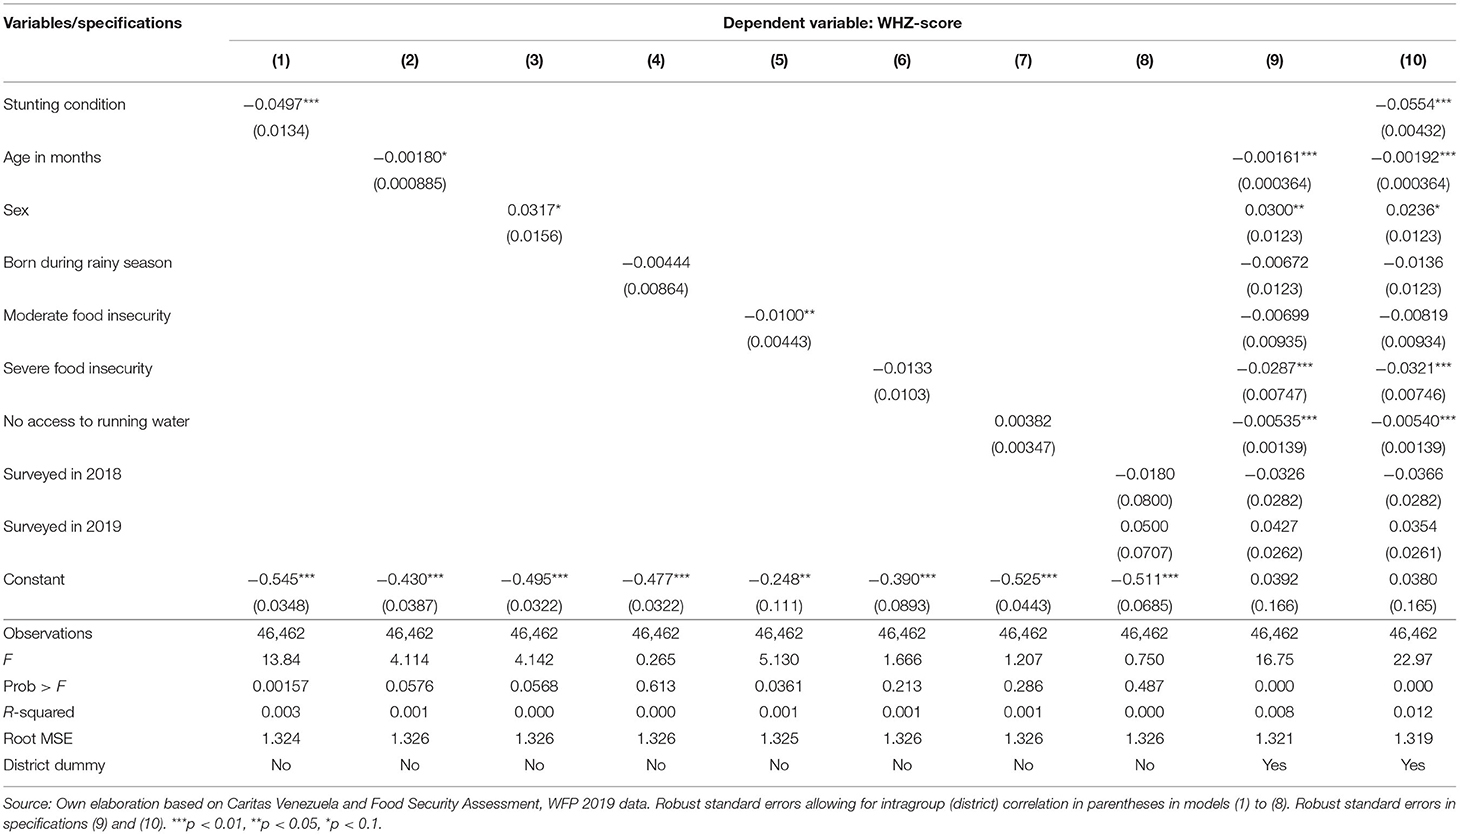
Table 9. Linear regression models for the weight-for-height z-score.
In contrast to what we found with the prevalence, age tends to reduce the HAZ- and WHZ-scores. Each month of age reduces the HAZ- and WHZ-scores in 0.0057 and 0.0019 standard deviations, respectively.
Conditional to the other covariates, on average boys have a 0.113 point lower HAZ-score than girls. They also have, on average, a 0.0236 higher WHZ-score. Season of birth is also relevant for explaining the HAZ-score. On average, those born during the first half of the year have a HAZ-score 0.13 points lower. When it comes to district-level food insecurity, this explains some variation in the z-scores. A 10 percentage point higher district prevalence of moderate and severe food insecurity reduces the average HAZ-score by 0.22 and 0.63 points. A 10 percentage point higher district prevalence of moderate food insecurity reduces the average WHZ-score by 0.13 points. At the district level, access to running water is not statistically associated to a lower HAZ-score.
Finally, on average, those children born during the first half of the year have a WHZ-score 0.14 points lower than children born during the rest of the year. Only severe food insecurity can explain the WHZ-score. A 10 percentage point higher district prevalence of severe food insecurity reduces the average WHZ-score by 0.32 points. Finally, a 10 percentage point higher district prevalence of households lacking clean water reduces the average WHZ-score by 0.05 points.
Discussion
Our findings reveal that both wasting and stunting have been prevalent over the last several years of the protracted crisis in Venezuela, reaching alarming thresholds all over the analyzed period, following an evident pattern of concurrence and responding to strong predictors related not only to food security, but also to age, sex, birth seasonality, and access to water.
The wasting and stunting prevalence we found over the entire period are labeled as “high” and “very high”, respectively, in line with the prevalence categories that describe public health crisis according to the WHO criteria (WHO, 2000; de Onis et al., 2019).
The shift we found of the distribution curve of height-for-age z-score to the left is an indication that all children in the dataset are facing some degree of linear growth faltering, even if they do not qualify as stunted. They might be discharged from the program with a healthy weight-for-height, but their growth faltering persists. These findings are consistent with the results documented by de Onis and Branca (2016) in countries with a chronic poverty history. As Leroy and Ruel state, the risk of being stunted and suffering from its devastating consequences does not change dramatically simply by crossing a threshold line; significant deterioration within the ‘normal’ range may also occur (Leroy and Ruel, 2014).
Confirming the concurrence of wasting and stunting in our dataset is an indication of the protracted duration of the crisis, evidence that the onset of the population's nutritional hardship dates back at least to 2014, and a warning regarding the urgency of adapting programming frameworks toward targets beyond the recovery of acute malnutrition and beyond the “food-first” focus.
The concurrence of wasting and stunting we found suggests that the two should not be treated as independent conditions. We assume that the overall failure of feeding patterns and care patterns in households of children facing stunting underlies the concurrence of both conditions. It is likely that poor energy intake in a wasted child goes hand in hand with poor dietary diversity impairing a child's growth, but also that growth faltering is happening in children who have not been hungry but rather exposed to a nutritionally poor diet.
Descriptive findings on wasting prevalence by age are consistent with findings of the analysis from cross-sectional national surveys in 54 countries, which demonstrate that height-for-age decreases throughout the first 2–3 years of life, whereas weight-for-height tends to falter during a more limited age window in the first year of life, after which it stabilizes. That the greatest prevalence of wasting occurs over this first month supports the idea that this is a key moment on which to focus protection interventions.
Differences according to sex are surprising. To the best of our knowledge there is no evidence of this gender gap in South America. Greater prevalence and severity of wasting and stunting among boys, as compared to girls, might reflect a situation in which boys are likely to face greater nutritional risks. This gender gap could be an indication that households prioritize girls for health-seeking behaviors. However, no other factors were analyzed that explain these differences. Further research should investigate this important issue.
The seasonality we found for stunting (higher severity during the first half of the year) is consistent with previous studies showing that malnutrition levels vary with seasonal variations, perhaps reflecting variations in pattern of diseases, food availability, and even time for childcare. Months of higher prevalence match with the rainy season in Venezuela (May–June), a period of high incidence of infectious diseases, especially respiratory infection, diarrhea, and malaria, that contribute to the depletion of nutritional status of both children and their caregivers. These findings are consistent with the pattern described by Schoembechler's retrospective cohort analysis of longitudinal data in Gambian children from 1976 to 2016 studying the relationship between wasting and stunting.
We support the assumption of Schoembechler regarding the seasonality we found; infants born during the wet season did not catch up in weight during the first 3 months of life to the same extent as their peers born in other months. These infants might be facing more wasting during childhood and an increased risk of becoming stunted before 2 years of age. No other factors behind this were analyzed, but may include seasonal increments of infectious diseases, effects on maternal nutritional status and on infant feeding and care practices. The months of poorest linear growth after periods of high wasting might indicate that children do not grow in height if their weight-for-height declines (Schoenbuchner et al., 2016).
In the case of the regression analysis of wasting and stunting, we confirm considerable differences that explain wasting and stunting variations among districts. High prevalence of severe food insecurity and lack of access to water at district level reduce the average WHZ- and HAZ-scores and might be reflecting inequalities in living conditions as confirmed by other authors in Latin America (Flores-Quispe et al., 2019).
Although the “food-first” focus still tends to over-bias practice in preventing malnutrition in emergencies, we found in our observations that food security really determined the anthropometrics we found. Severe food insecurity is a main driver of persistent acute malnutrition, a driver also of stunting, and a driver of the concurrence of both, but with a stronger effect on wasting.
Although we don't find any considerable effect in terms of access to water being a central driver of stunting, the fact that our empirical exercise only uses between-district variation means we cannot reject access to water as an essential factor in nutritional protection in early childhood. It is highly probable that a more disaggregated dataset would yield results consistent with programs and campaigns that promote improved access to water, as well as with recent analysis of multiple Demographic Health Surveys by Headey and Palloni exploring water and sanitation as a predictor of child morbidity, mortality, and nutrition (Headey and Palloni, 2019).
At the time of the research, child anthropometric data including a comprehensive set of covariates was not available. This prevents researchers from implementing methodologically clean approaches to studying causes of malnutrition. Given this difficulty we believe that limited data is better than no data, and, furthermore, we believe that using limited data is better than rejecting empirical research that has programming implications because of data weaknesses. We propose that our observations be considered for programming improvements, rather than neglecting the reality of thousands of children at risk of malnutrition. Although our estimates are not statistically representative of the entire children's population, they are strongly consistent and allow us to be deeply concerned about the future of thousands of children. In any case, we strongly believe that improvements in data collection, as well as our empirical findings, open further research possibilities for strengthening the evidence for programs and policies.
We see research priorities relating to the influence of other household predictors, mainly the household structure in the face of the huge outmigration process, the access to remittances, and the enrollment to social protection programs. An important area for future research is further investigation on factors that best suit the mitigation of stunting in this protracted setting.
Implications for Programming
Our findings suggest the need for a stronger way of working in our humanitarian programs that includes more long-term approaches, more networks, and expanded support for addressing the challenge of the persistency of acute malnutrition and the increasing rates of stunting, based on strategies with explicit nutritional goals.
Children are admitted to and discharged from Caritas' Points of Care and from other programs already stunted. Even if the stunting is more difficult to reverse over the usual timeframe of humanitarian response, it is hoped that within the areas of targeting criteria, enrollment and discharge protocols, and preventive interventions there will be new possibilities for programming aimed at protecting children identified as moderately stunted against further deterioration. Both wasting and stunting should be managed as a priority issue, especially for a preventive/protective approach.
The programming targets in such a fragile and protracted crisis as Venezuela should focus not only on livelihoods and food resilience, but especially on nutritional resilience to prevent further growth decline, including the management of stunting drivers within the policy and programming scope.
The findings on the pattern of wasting and stunting by age indicate the necessity of focusing on both preventive and therapeutic intervention in children under 2 years of age as well as in pregnant and lactating women.
Predictability should be integrated into humanitarian programming. Humanitarian inputs, logistics, and personnel should be anticipated and located well before the period of highest wasting prevalence (first half of the year), especially in the face of upcoming mobility restrictions due to further outbreaks of Covid-19 and/or further crisis in the access to gasoline and public transportation.
A sound humanitarian response directed toward nutritional protection is relevant for both girls and boys, but it is crucial to have a broader understanding of cultural drivers that explain the negative bias toward boys.
The severity of the damage and the protracted character of the Venezuelan crisis demand a humanitarian response on preventive and therapeutic lines, articulating interventions that target not only the drivers of food insecurity, but also nutritional demands. The mitigation of the risks to health and care capacities for maternal and child nutrition is also central. The management of acute malnutrition is important but not enough.
The priorities should be supporting women in effective breastfeeding; protecting maternal nutrition and health; social protection measures for improving household food security and livelihoods, as well as dietary diversity; early detection and management of acute malnutrition; protecting the micronutrient status while food insecurity is severe; and strengthening access to safe water.
In order to address these priorities, humanitarian teams should overcome obstacles such as the usual reliance on short-term funding, funding biased toward food aid, stunting being seen as anything but a development issue tackled by livelihood interventions, extremely challenging operating contexts, and the lack of an evidence base for stunting prevention in these contexts.
It is not only the severity of the crisis, but also the velocity of Venezuela's nutritional deterioration which is a true catastrophe. This is an indication that the situation in Venezuela should be rigorously monitored and broadcasted. Venezuela's deterioration is not isolated. If this rapid trend of decline continues without a strong national and regional response, the regressive impact will be on the food security and nutrition goals of the entire Latin-American region.
The opportunity is for the academies, the scientific community, international cooperation, donors, UN agencies, and for the state to support, compel, and guarantee the protection of the ultimate right to food and nutrition of Venezuela's children.
Data Availability Statement
The data analyzed in this study is subject to the following licenses/restrictions: Dataset property of Caritas Venezuela. Requests to access these datasets should be directed to amFuZXRobWFyMDEwN0BnbWFpbC5jb20=.
Author Contributions
All authors listed have made a substantial, direct and intellectual contribution to the work, and approved it for publication.
Conflict of Interest
The authors declare that the research was conducted in the absence of any commercial or financial relationships that could be construed as a potential conflict of interest.
Footnotes
1. ^Data analysis was performed using STATA 15.1.
2. ^According to the WHO (2000), the classification of severity of malnutrition for children under 5 years of age consists of the following categories: Mean weight for height Z-score: >−0.40 (acceptable); −0.40 to −0.69 (poor); −0.70 to −0.99 (serious); ≤ −1 (critical).
References
ACAPS (2020). Available online at: https://www.acaps.org/country/venezuela/crisis/complex-crisis (accessed April 3, 2020).
Barr, D. J., Levy, R., Scheepers, C., and Tily, H. J. (2013). Random effects structure for confirmatory hypothesis testing: keep it maximal. J. Mem. Lang. 68, 255–278. doi: 10.1016/j.jml.2012.11.001
Bressoux, P. (2010). Modélisation Statistique Appliquée aux Sciences Sociales [Statistical Modelling Applied to Social Sciences]. Bruxelles: De Boeck. doi: 10.3917/dbu.bress.2010.01
de Onis, M., Borghi, E., Arimond, M., Webb, P., Croft, T., Saha, K., et al. (2019). Prevalence thresholds for wasting, overweight and stunting in children under 5 years. Public Health Nutr. 22, 175–179. doi: 10.1017/S1368980018002434
de Onis, M., and Branca, F. (2016). Childhood stunting: a global perspective. Matern. Child Nutr. 12(Suppl 1), 12–26. doi: 10.1111/mcn.12231
ENN (2020). Time for a Change. Can We Prevent More Children From Becoming Stunted in Countries Affected by Crisis? A Briefing Note for Policymakers and Program Implementers. Emergency Nutrition Network – Irish Aid Policy and Advocacy Brief.
FAO (2016). Nutrition in Protracted Crises. Breaking the Vicious Circle of Malnutrition. Guidance Note.
FAO, FIDA, OPS, WFP, and UNICEF (2020). Panorama de la Seguridad Alimentaria y Nutrición en América Latina y el Caribe 2020. Santiago de Chile: FAO, FIDA, OPS, WFP, and UNICEF.
Flores-Quispe, M., Restrepo-Méndez, M. C., Maia, M. F. S., Ferreira, L. Z., and Wehrmeister, F. C. (2019). Trends in socioeconomic inequalities in stunting prevalence in Latin America and the Caribbean countries: differences between quintiles and deciles. Int. J. Equity Health 18:156. doi: 10.1186/s12939-019-1046-7
Galasso, E., and Wagstaff, A. (2016). The Economic Costs of Stunting and How to Reduce Them. World Bank Group. Policy Research Note.
Headey, D., and Palloni, G. (2019). Water, sanitation, and child health: evidence from subnational panel data in 59 countries. Demography 56, 729–752. doi: 10.1007/s13524-019-00760-y
IANAS (2017). “Food and nutritional security in Venezuela. The agrifood abduction of a country: vision and commitment,” in Challenges and Opportunities for Food and Nutrition Security in the Americas The View of the Academies of Sciences. IANAS Regional Report: Inter-American Network of Academies of Sciences (IANAS), 567–608.
Khara, T., and Dolan, C. (2014). The Relationship between Wasting and Stunting, Policy, Programming, and Research Implications. Emergency Nutrition Network (ENN) - USAID. Technical Briefing Paper.
Khara, T., Dolan, C., and Shoham, J. (2015). Stunting in Protracted Emergency Contexts: What Are the Implications for Humanitarian Programming of Responding to Stunting in Protracted Emergency Contexts, and What Should We Be Doing About It? ENN Briefing Note, Oxford.
Leroy, J. L., and Ruel, M. (2014). Linear growth deficit continues to accumulate beyond the first 1000 days in low- and middle-income countries: global evidence from 51 national surveys. J. Nutr. 144, 1460–1466. doi: 10.3945/jn.114.191981
Martorell, R. (2012). Interventions and Policy Options for Combating Malnutrition in Guatemala. Washington, DC: Inter-American Development Bank.
Prendergast, A., and Humphrey, J. (2014). The stunting syndrome in developing countries. Pediatr. Int. Child Health 34, 250–265. doi: 10.1179/2046905514Y.0000000158
Schoenbuchner, M., Dolan, C., Mwangome, M., Hall, A., Richard, S. A., Wells, J. C., et al. (2016). The relationship between wasting and stunting: a retrospective cohort analysis of longitudinal data in Gambian children from 1976 to 2016. Amer. J. Clin. Nutr. 110, 498–507. doi: 10.1093/ajcn/nqy326
Sommet, N., and Morselli, D. (2017). Keep calm and learn multilevel logistic modeling: a simplified three-step procedure using Stata, R, Mplus, and SPSS. Int. Rev. Soc. Psychol. 30, 203–218. doi: 10.5334/irsp.90
Stewart, C. P., Iannotti, L., Dewey, K. G., Michaelsen, K. F., and Onyango, A. W. (2013). Contextualising complementary feeding in a broader framework for stunting prevention. Matern. Child Nutr. 9(Suppl 2), 27–45. doi: 10.1111/mcn.12088
UN OCHA (2020). Global Humanitarian Overview 2021. Abridged Version Report, United Nations Office for the Coordination of Humanitarian Affairs.
UN OCHA Venezuela (2020). Humanitarian Response Plan with Humanitarian Needs Overview. UN OCHA Venezuela.
Victoria, C., de Onis, M., and Shrimpton, R. (2014). Linear growth faltering should be assessed in absolute and relative terms. J Nutr. 144, 2092–2093. doi: 10.3945/jn.114.200543
Wasting-Stunting Technical Interest Group (2018). Child Wasting and Stunting: Time to Overcome the Separation.
WHO, UNICEF. (2019). Recommendations for Data Collection, Analysis and Reporting on Anthropometric Indicators in Children Under 5 Years Old. World Health Organization and the United Nations Children's Fund (WHO, UNICEF).
Keywords: stunting, wasting, malnutrition, Venezuela, humanitarian crisis, protracted crisis, wasting and stunting concurrence
Citation: Raffalli S and Villalobos C (2021) Recent Patterns of Stunting and Wasting in Venezuelan Children: Programming Implications for a Protracted Crisis. Front. Sustain. Food Syst. 5:638042. doi: 10.3389/fsufs.2021.638042
Received: 04 December 2020; Accepted: 06 April 2021;
Published: 13 May 2021.
Edited by:
Maria S. Tapia, Academia de Ciencias Físicas, Matemáticas y Naturales de Venezuela, VenezuelaReviewed by:
Guillermo Ramírez, Central University of Venezuela, VenezuelaMaria Del Pilar Flores, Universidade Federal de Pelotas, Brazil
Copyright © 2021 Raffalli and Villalobos. This is an open-access article distributed under the terms of the Creative Commons Attribution License (CC BY). The use, distribution or reproduction in other forums is permitted, provided the original author(s) and the copyright owner(s) are credited and that the original publication in this journal is cited, in accordance with accepted academic practice. No use, distribution or reproduction is permitted which does not comply with these terms.
*Correspondence: Carlos Villalobos, Y3ZpbGxhbG9ib3NAdXRhbGNhLmNs
†These authors have contributed equally to this work and share first authorship