 Cedric Habiyaremye
 Kurtis L. Schroeder2
 John P. Reganold
 Kevin M. Murphy
- 1Sustainable Seed Systems Lab, Department of Crop and Soil Sciences, Washington State University, Pullman, WA, United States
- 2Department of Plant Sciences, University of Idaho, Moscow, ID, United States
- 3Department of Crop and Soil Sciences, Washington State University, Pullman, WA, United States
Barley (Hordeum vulgare L.) has a storied history as a food crop, and it has long been a dietary staple of peoples in temperate climates. Contemporary research studies have focused mostly on hulled barley for malt and animal feed. As such, nitrogen (N) and seeding rate agronomic data for naked food barley are lacking. In this study, we evaluated the effects of N on ß-glucan and protein content, and N and seeding rate on phenotypic characteristics of naked food barley, including grain yield, emergence, plant height, days to heading, days to maturity, test weight, percent plump kernels, and percent thin kernels. Experiments were conducted at two no-till farms, located in Almota, WA, and Genesee, ID, in the Palouse region of the Pacific Northwest from 2016 to 2018. The experiment comprised two varieties (“Havener” and “Julie”), employed N rates of 0, 62, 95, 129, and 162 kg N ha−1, and seeding rates of 250, 310, and 375 seeds/m−2. Increased N fertilization rate was shown to significantly increase all response variables, except β-glucan content of the variety Julie, days to heading, test weight, and percent plump and thin kernels. Increased N fertilization resulted in higher mean grain yield of Havener and Julie in both Almota and Genesee up to 95 kg N ha−1. Havener had higher yields (3,908 kg N ha−1) than Julie (3,099 kg N ha−1) across locations and years. Julie had higher β-glucan (8.2%) and protein (12.6%) content compared to Havener (β-glucan = 6.6%; protein = 9.1%). Our results indicate that β-glucan content is associated with genotype, environmental, and agronomic factors in dryland cropping systems of the Palouse.
Introduction
Since antiquity, barley (Hordeum vulgare L.) has been a rich source of human nutrition (Newman and Newman, 2006). It was first domesticated in the Fertile Crescent of Asia over 10,000 years ago (Zohary and Hopf, 1993; Mohammed et al., 2016), making it among the oldest domesticated crops (Salamini et al., 2002). Barley is a principal cereal crop in the world's temperate regions and is ubiquitous across many agroecological zones, from 70° N in Norway to 46° S in Chile, and often grown at higher elevations than other cereals (Von Bothmer et al., 1995, 2003; Leff et al., 2004; Kaso and Guben, 2015). Principal cropping regions for barley are Europe and Russia, but it is also a valuable resilient crop in arid and semi-arid areas of Asia, the Middle East, and North Africa (FAO, 2014; FAOSTAT, 2017; USDA, 2019). Barley, boasting 140.6 million metric tons (MMT) globally in 2019, ranked fourth in worldwide grain production after maize, wheat, and rice with 1,009.61, 734.74, and 495.87 MMT, respectively (STATISTA, 2020). Over half of global barley production occurred in less-developed nations (Grando and Macpherson, 2005; Zhou, 2009; Mohammed et al., 2016).
Barley is a major staple food in areas of North Africa, the Near East, the highlands of Central Asia, the Horn of Africa, Andean countries, and the Baltic States (Grando and Macpherson, 2005). Food barley is generally grown in regions where other cereals grow poorly due to inadequate rainfall, high altitude, or saline soils. It remains the most viable cereal crop option in arid regions (<300 mm of rainfall) and when alternative non-cereal cropping options are limited (Grando and Macpherson, 2005). Furthermore, food barley is a popular relief crop during periods of food shortage, given its relatively short growing season—it is also used as a substitute food for wheat when wheat market prices are too high. Therefore, food barley holds an esteemed position in the food security of harsh and marginal regions of the world (Grando and Macpherson, 2005; Zhou, 2009; Mohammed et al., 2016).
Of late, however, relatively little barley is consumed in human diets but is instead grown as animal feed and for value-added markets, such as malting for brewing and distilling (Grando and Macpherson, 2005; Vasanthan and Hoover, 2009; Meints et al., 2015). The majority of barley germplasm has a hull that tightly adheres to the grain, requiring that almost all barley currently used for food be pearled, which removes the hull and a significant portion of the pericarp and bran, where phytonutrients and minerals are predominantly concentrated (Grando and Macpherson, 2005; Moreau et al., 2007; Bleidere et al., 2017). Pearling, by default, excludes barley from being considered a whole grain (Seal et al., 2006; O'Neil et al., 2010). In some barley varieties, however, the hull does not adhere, and the grain threshes clean and does not require pearling. These types are referred to as hulless or naked; Meints and Hayes (2019) recently proposed that the use of the term “naked” is preferable for the sake of clarity. Naked barley has the advantage of allowing the whole grain to be used without pearling the nutritious bran layers away, and this allows the naked barley to be labeled as a whole grain (Bhatty, 1995; O'Neil et al., 2010; Bleidere et al., 2017). Besides the nutritional benefit to consumers, farmers are also saved the cost of pearling naked barley. Interest from consumers and food companies in a nutritionally dense and β-glucan-rich food barley is growing and the time is opportune for plant breeders and agronomists to capitalize on this whole foods zeitgeist (Baik and Ullrich, 2008; Thorwarth et al., 2017).
Interest in barley as a food grain is also increasing due to the presence of constituents in barley known to prevent or alleviate certain diseases (Slavin et al., 2000; Arndt, 2006; Madhujith et al., 2006; De Angelis et al., 2015; Baidoo et al., 2019). Barley grain is an excellent source of soluble and insoluble dietary fiber (DF) and other bioactive constituents, such as vitamin E, B-complex vitamins, minerals, and phenolic compounds (Slavin et al., 2000; Madhujith et al., 2006). β-glucans, the major fiber constituents of barley, have been implicated in lowering plasma cholesterol, improving lipid metabolism, and achieving a low glycemic index (Delaney et al., 2003; Li et al., 2003; Behall et al., 2004, 2005, 2006; Keenan et al., 2007; Garcia-Mazcorro et al., 2018). In 2005, the US Food and Drug Administration (FDA) allowed whole grain barley and barley-containing products to carry a claim that they reduce the risk of coronary heart disease (Wellness Foods, 2005; Food and Drug Administration, 2006). Some anticipate that the health benefits of barley will stimulate interest among food producers and consumers in using barley for food purposes (Quinde et al., 2004; Baik and Ullrich, 2008; Thorwarth et al., 2017). The development of naked food barley varieties with high protein combined with β-glucan content would provide an incentive for the production of barley for non-malt and non-feed purposes.
Historically, barley has been an important rotational crop in the US Pacific Northwest (PNW), and notably in the Palouse region of Washington State and Idaho (Juergens et al., 2004; McCoy, 2014; Brouwer et al., 2016a,b). Rotations with barley have been shown to improve yield in its cereal crop counterpart, wheat, and its fibrous root system enhances nutrient cycling, benefits soil structure, helps reduce erosion, improves water infiltration, and helps build soil organic matter in the winter wheat-centric cropping systems of the PNW (Guy and Gareau, 1998; Paulitz et al., 2002; Juergens et al., 2004). There are demonstrated economic and environmental benefits of incorporating spring barley into the prevailing winter wheat-summer fallow (WW-SF) cropping systems in the PNW (Juergens et al., 2004). Those benefits include higher annual income, reduction of wind erosion, and suppression of weed, plant pathogens, and insect pests (Smiley et al., 1994; Young et al., 1994; Juergens et al., 2004). WW-SF is the dominant cropping system in the low-precipitation (<300 mm annual) region of the PNW. In east-central Washington and north-central Oregon, where annual precipitation ranges from 150 to 300 mm, WW-SF cropping is practiced on 1.5 million ha (Juergens et al., 2004). There are environmental disadvantages of WW-SF that include recurrent wind erosion, especially during drought cycles when straw production is low (Juergens et al., 2004). Research in the PNW and elsewhere has shown that no-till cropping mitigates soil erosion and builds soil quality, by leaving residue on the field after harvest, where it acts as a mulch to protect the soil from erosion and foster soil productivity compared with tillage-based systems (Guy and Cox, 2002; Juergens et al., 2004; Huggins and Reganold, 2008; Pittelkow et al., 2015).
Alternative cropping systems are needed to reinvigorate rainfed crop production of the US PNW. To determine the agronomic requirements of naked food barley in no-till cropping systems in the Palouse region, we evaluated the effect of N fertilization and seeding rate on ß-glucan content, protein content, grain yield, and agronomic and quality traits on two recently released barley varieties on two no-till farms.
Materials and Methods
Location
A 3-year study (2016–2018) was conducted on two no-till farms; one in Genesee, ID (Jensen farm) (46.611134° N Lat., −117.009925° W Long.) and the other in Almota, WA (Aeschliman farm) (46.791288° N Lat., −117.438473° W Long.). Both Genesee and Almota soils are part of the Palouse series soil and are classified as silt loams (Donaldson, 1980; Frazier and Cheng, 1989). Genesee received total annual precipitation of 565 mm in 2016, 657 mm in 2017, and 446 mm in 2018 and Almota received total annual precipitation of 455 mm in 2016, 535 mm in 2017, and 392 mm in 2018. The average maximum day temperature recorded during the growing season in Genesee were 23.47°C in 2016, 24.96°C in 2017, and 24.14°C in 2018. The total precipitation recorded during the growing seasons 2016, 2017, and 2018 was 68.06, 65.45, and 86.36 mm, respectively. In Almota the average maximum day temperature recorded during the growing season 2016, 2017, and 2018, was 25.55, 26.23, and 25.90°C, respectively. The total precipitation recorded during the growing seasons 2016, 2017, and 2018 was 55.12, 61.96, and 76.75 mm, respectively. Most of this precipitation occurred during the winter and early in the spring (AgWeatherNet, 2021; Weather Underground, 2021).
Previous crops grown in the field where experiments were conducted are as follows: in Genesee, winter wheat (WW), winter peas, and WW in 2016, 2017, and 2018, respectively. In Almota, WW in 2016, 2017, and 2018.
Experimental Design and Data Collection
Experimental Design
The trial consisted of two food barley varieties (“Havener” and “Julie”) (Obert et al., 2013). The experiments were arranged in a randomized complete block design with five replicates. The main plot treatments were varieties Julie and Havener and sub-plots were N applicatio N rates (0, 62, 95, 129, and 162 kg N ha−1), and seeding rates (250, 310, and 375 seeds/m−2). Plot size was 1.5 m by 6.1 m. Phosphorus (P) and Sulfur (S) were applied following recommended practices of the North Idaho fertilizer guide for Spring barley by Mahler and Guy (2007). The P and S rates were constant across years and sites and weeds were managed using best management practices for each location.
Plots were planted using a no-till drill equipped with Flexi-Coil Stealth openers that allow fertilizer to be banded below and between paired rows. The openers are spaced 25 cm apart and seed was placed in paired rows 7.6 cm apart. Fertilizer was banded below the seed at the time of planting. It was all rainfed fields—no irrigation was included in this experiment.
Agronomy and Yield Assessment
Agronomic data were as follows: percent emergence was recorded as a visual observation on a scale of 1–5 with 1 (0% emergence) and 5 (100% emergence). Days to heading were recorded as the number of days from sowing to the time when 50% ear had emerged from the flag leaf sheath (stage 10.3 on the Feekes scale) according to Wise et al. (2011) and Miller (1992). Days to maturity were recorded as the number of days from sowing to the time when kernels could not be split with a fingernail (stage 11.4 on the Feekes scale) according to Wise et al. (2011) and Miller (1992). Plant height was measured from soil surface to tip of the spike (excluding awns). Grain yield was measured as the weight of the grain harvested from the whole plot.
Seed harvesting was conducted using a Wintersteiger Nursery Master Elite plot combine (Wintersteiger Inc., Austria). Seed cleaning was conducted using an electrical seed thresher (Midwest Industry Inc., Bozeman, MT) for one 30 s interval. Test weight and seed size were recorded for each sample. Test weight was measured using a cox funnel and collecting a 473 ml sample (Seedburo Equipment Co., Chicago, IL). Seed size was measured by taking 250 g sub-samples from each test-weight sample and shaking them for 30 s using a grain sizer model G-2 (Swenko, Minneapolis, MN) with screen sizes of 2.38 and 2.18 mm. Each experimental unit was analyzed for its contents of β-glucan and protein on a dry basis using previously calibrated near-infrared spectroscopy (NIR) (Perten DA 7250, Hägersten, Sweden). Values obtained from wet chemistry using a Megazyme enzymatic assay kit for mixed β-glucan linkage was used to calibrate the NIR (Choi et al., 2020). Briefly, 452 barley genotypes (including those used in this study) with a range of 2.7–10.9% β-glucan were used to calibrate the NIR. The standard error of cross-calibration (SEVC) was 0.525 and the RMSEC was 0.533. Honig's regression value (R2 = 0.81) verified a strong correlation between NIR spectra predicted β-glucan and wet chemistry analysis (Choi et al., 2020). Shapiro-Wilk normality test on the β-glucan residuals resulted in a p-value of 0.4186 indicating no significant difference from the normal curve.
Statistical Data Analyses
Statistical analysis was performed using the statistical software SAS 9.4 University Edition (SAS Institute IN., Cary, NC). The mixed-effects methodology was used to analyze data and was performed using a mixed model with PROC GLIMIX. Model assumptions were verified using marginal and conditional studentized residuals from PROC MIXED and studentized residuals from PROC GLIMMIX. A logarithmic transformation was used for yield and plant height to satisfy the homogeneity of variance assumption. Contrasts were calculated to show which of the two varieties differed by N and seeding rates. Means and least significant differences for all the data in the table were reported. The statistical significance level was set at α = 0.05 unless otherwise noted. ANOVA was performed with all factors using a mixed model with PROC GLIMIX. Pearson's correlation coefficients were calculated based on mean trait values and used to estimate phenotypic relationships between traits of interest. Fisher's LSD test was used to compare treatment means.
Results
β-glucan
Nitrogen did not have a significant effect on β-glucan across all 3 years and at both locations (Table 1 and Figure 1). However, there was a significant N × variety interaction for β-glucan (Table 1). There was a significant difference between varieties for β-glucan content across all five N rates in Almota and Genesee in all 3 years of the study (Table 1) and grain β-glucan content in the varieties varied by year (Table 2). When comparing varieties' β-glucan content, Julie consistently had significantly higher β-glucan content than Havener in both locations-−1.6% higher in Almota and 1.5% higher in Genesee (Table 3).
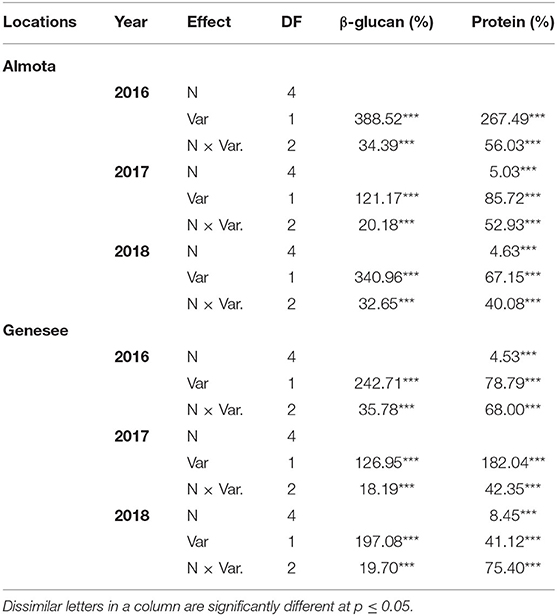
Table 1. Analysis of Variance with F value for β-glucan and protein for food barley grown under five nitroge N treatments on no-till farms of Almota and Genesee.
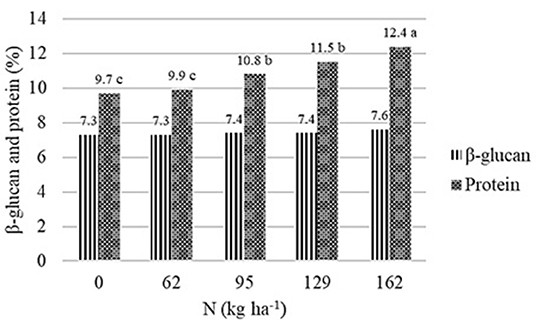
Figure 1. Effect of N rate on β-glucan and protein content of barley across all locations and years. Dissimilar letters in a column are significantly different at p ≤ 0.05.
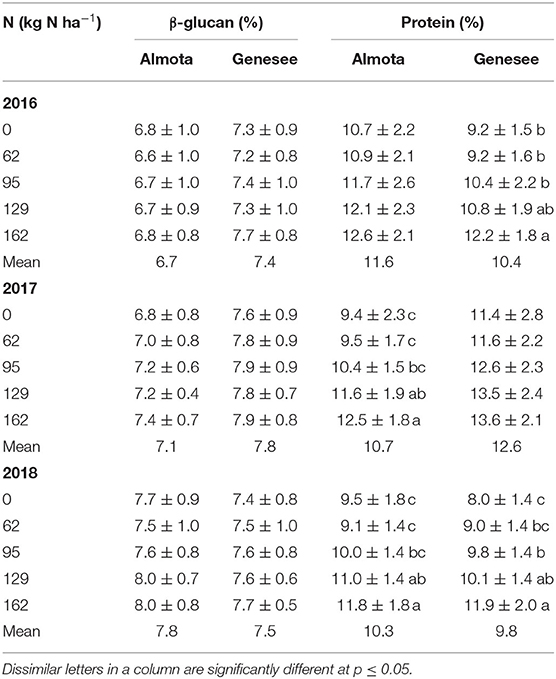
Table 2. Mean data across six site-years for the effect of N rates on β-glucan and protein.

Table 3. Mean data across six site-years for varietal differences in β-glucan and protein.
Protein
Nitrogen had a highly significant effect (p < 0.001) on protein in Almota in 2017 and 2018 (but not 2016) and in Genesee in 2016 and 2018 (but not 2017) (Table 1). Grain protein responded positively to increasing N rates in both varieties, where the highest protein content was observed in response to 162 kg N ha−1 (Table 2 and Figure 1). The average protein content across all N rates, varieties, and years was 10.9% at both Almota and Genesee (Table 2 and Figure 2). There was a difference in protein content between varieties across the N rates in Almota and Genesee (Table 3). When comparing varieties' protein content, Julie had an average of 3.5% higher protein content than Havener across all years and locations (Table 3).
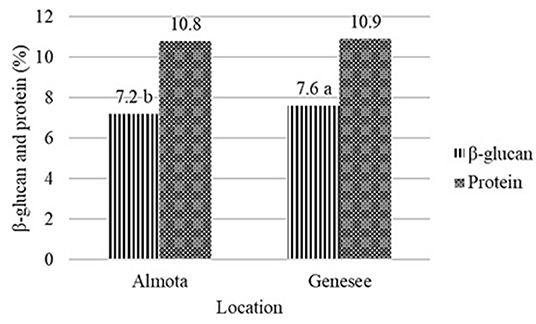
Figure 2. Effect of location on β-glucan and protein content of barley across all varieties and years. Dissimilar letters in a column are significantly different at p ≤ 0.05.
Grain Yield
In all 3 years, there was a highly significant N × variety interaction for yield in Almota and Genesee (p < 0.0001) (Table 4). N rates caused a difference in grain yield across Havener and Julie and 3 years in Almota and Genesee (Table 4). In all years at both locations, there was an increase in grain yield with increasing N rates across both Havener and Julie (Table 5). The higher N rates increased grain yield of both varieties with the highest grain yield being observed in response to 129 kg N ha−1 in half of the six site-years, while the maximum yield occurred with 162 kg N ha−1 at both locations in 2016 and the highest yield at the 2018 Almota site was with 95 kg N ha−1 (Tables 5, 6). Across the five N treatments in all 3 years, the grain yield in Genesee was 336 kg N ha−1 higher than the grain yield in Almota (Table 7).
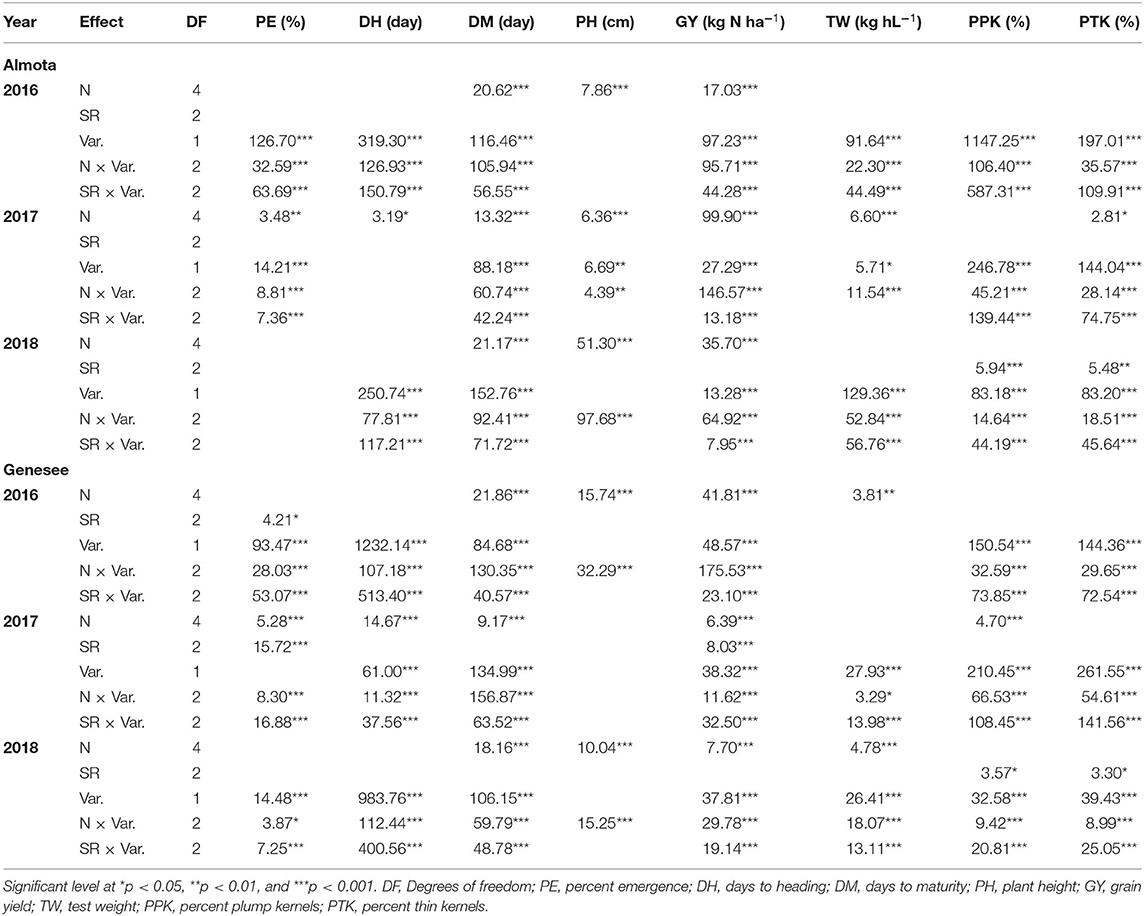
Table 4. Analysis of Variance with F value for emergence rate, day to heading, days to maturity, plant height, grain yield, test weight, percent plump kernels, and percent thin kernels for food barley grown under five nitroge N treatments and three seeding rates on no-till farms of Almota and Genesee.
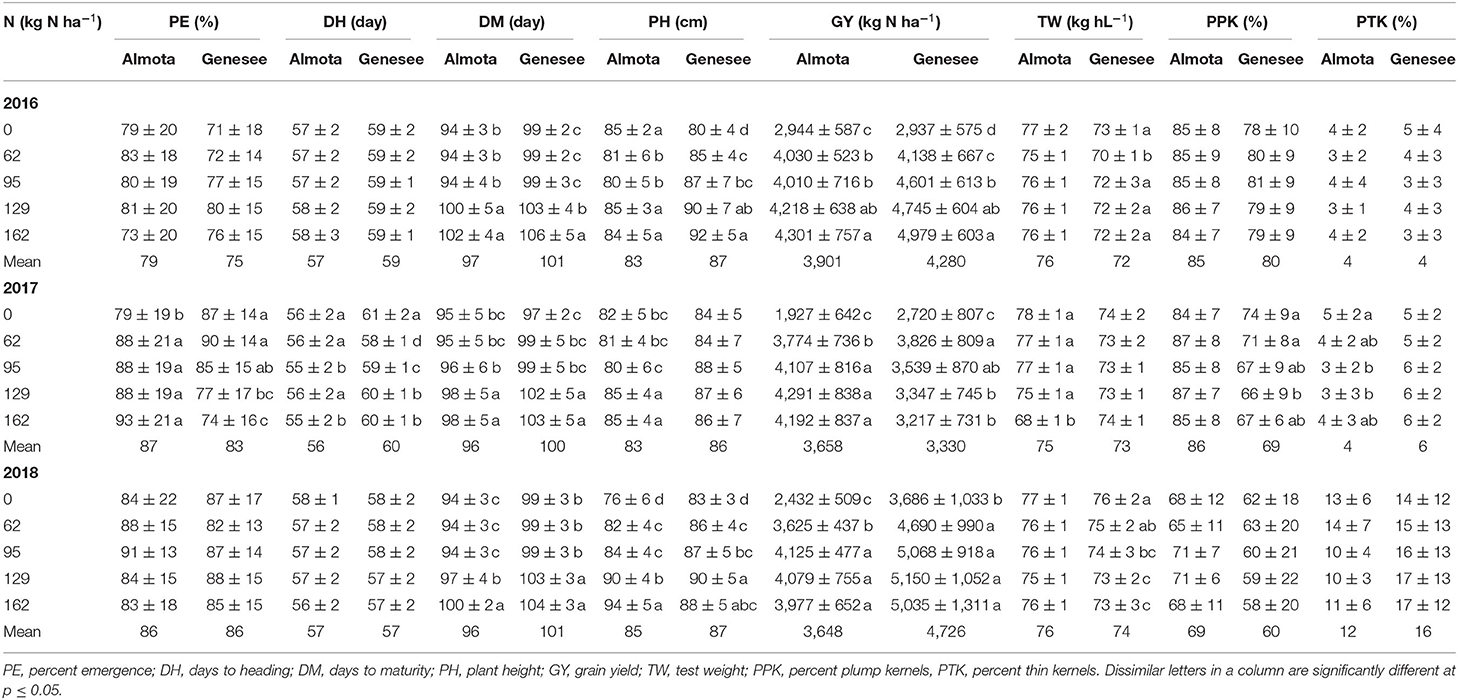
Table 5. Mean data across six site-years for nitroge N rates on agronomic traits.

Table 6. Effect of N rate on grain yield and seed quality of barley across all locations and years.
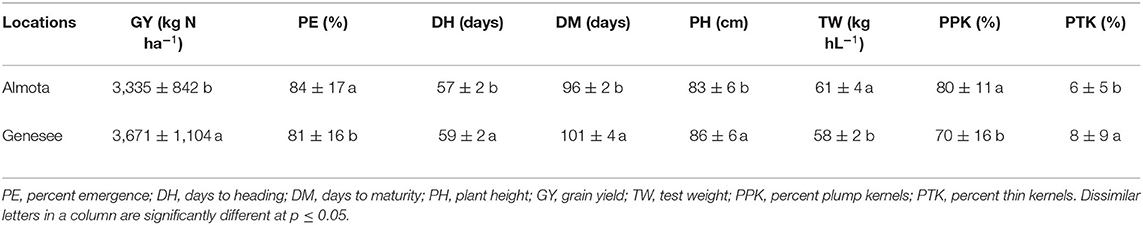
Table 7. Location differences in yield and grain quality across all N treatments, varieties, and years.
When comparing varietal grain yield across years, location, and N treatments, the results showed a difference in grain yield between Havener and Julie (Tables 8, 9). Havener was consistently higher yielding than Julie with average of 806 kg N ha−1 higher grain yield than Julie (Table 9).
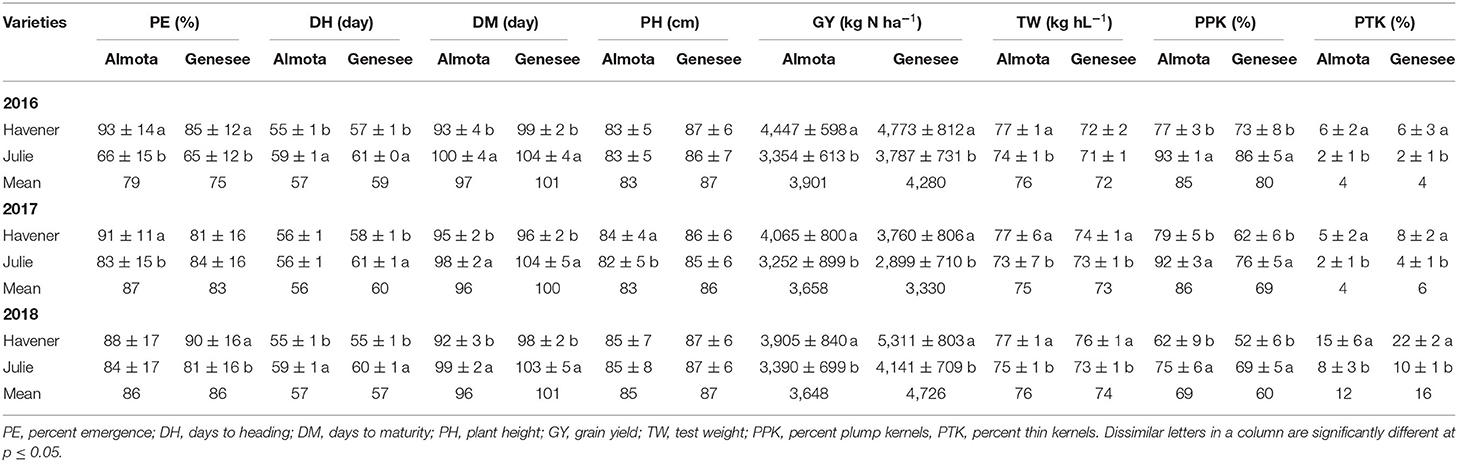
Table 8. Mean data across six site-years for varietal differences across N and seeding rates treatments.
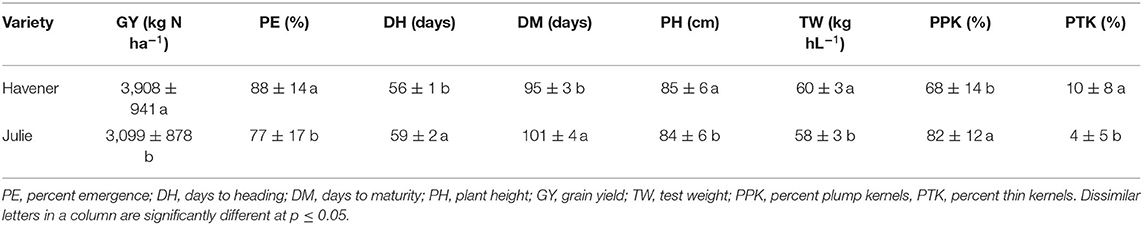
Table 9. Barley varietal differences in yield and grain quality across all N treatments, locations and years.
In Almota, there was a significant seeding rate × variety interaction for yield in 2016 and 2018 (p < 0.0001) (Table 4). In Genesee, there was a seeding rate × variety interaction for yield in 2017 and 2018 (Table 4). Increased seeding rates 250, 310, and 375 seeds/m−2 increased grain yield 3,440, 3,453, and 3,616 kg N ha−1, respectively in all the varieties in all years and locations (Table 11).
Emergence
Nitrogen did not have an impact on plant emergence in Almota or Genesee in 2016 and 2018 (Table 4). However, in 2017, N had a significant impact on plant emergence in both locations (Table 4). Across all N treatments in all years, emergence in Almota was 3% higher than in Genesee (Table 7). In Almota, there was a highly significant difference (p < 0.0001) in emergence rates between varieties in 2016 and 2017, but not in 2018 (Table 4). In Genesee, there was a highly significant difference (p < 0.0001) in varieties' emergence rates in 2016 and 2018 (Table 4). Across all N rates and two locations, Havener had on average 11% higher emergence rate than Julie (Table 9). Seeding rate only had a significant effect on emergence at Genesee in 2016 and 2017 (Table 4).
Plant Height
Nitrogen positively affected plant height in 2016, 2017, and 2018 in Almota (p < 0.0001); in Genesee, N positively affected plant height in 2016 and 2018 (Table 4). Increasing N rates increased plant height across both varieties in all years and locations; the maximum plant height of 88 cm was recorded at both 129 and 162 kg N ha−1 (Table 6). Plant height did not differ between varieties with the exception of Almota in 2017 where Havener was significantly taller than Julie (Table 8). When comparing the plant height of varieties across all N rates, years and locations, Havener was taller than Julie (Table 9). Seeding rate did not have a significant effect on plant height (Tables 4, 11).
Days to Heading
Analysis of variance revealed that N rates affected days to heading in 2017 at both Almota (p = 0.02) and Genesee (p ≤ 0.0001) (Table 4). However, there was not a clear trend to suggest that the N rate has an influence on days to heading. Over the course of the study, Almota was 2 days earlier than Genesee for days to heading (Table 7). In five of the six site-years, there was a significant difference in days to heading between varieties (Table 4). When comparing varieties' days to heading across all N and seeding rates in both Almota and Genesee, Havener reached heading 3 days earlier than Julie (Tables 8, 9). Seeding rates did not have any effect on days to heading (Tables 10, 11).

Table 10. Mean data across six site-years for the effect of seeding rates on agronomic traits.
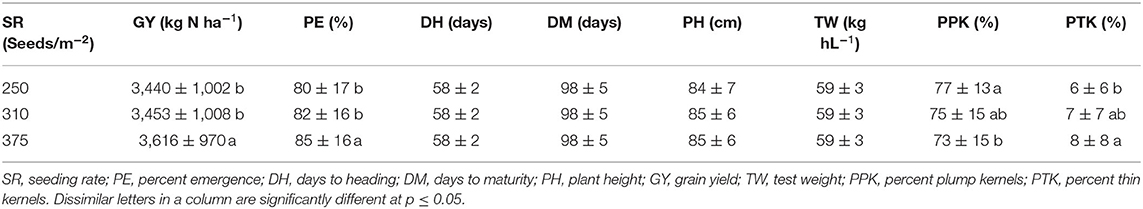
Table 11. Effect of seeding-200mm][4mm]Q21 rate on grain yield and seed quality across all locations and years.
Days to Maturity
Nitrogen rate affected days to maturity at both Almota and Genesee in 2016, 2017, and 2018 (Table 4). Increased N rates increased days to maturity of all the varieties; across varieties in all years and locations, the highest number of days to maturity was observed in response to 162 kg N ha−1 (Table 6). Across all N treatments in all 3 years, the barley varieties in Almota matured 5 days earlier than in Genesee (Table 7). When comparing varieties' days to maturity across all five N rates in both Almota and Genesee, Havener matured 3–8 days earlier than Julie (Table 9). Seeding rate did not have an effect on days to maturity (Tables 10, 11).
Test Weight
The effect of different N rates on test weight was significant in Almota in 2017 (p < 0.0001) and at Genesee in 2016 (p = 0.01) and 2018 (p < 0.0001) (Table 4). Across all N treatments in all years, Almota was 3 kg hL−1 higher in test weight than Genesee (Table 7). Increasing N rates usually resulted in decreased test weight; across all locations and years the 0 N treatment resulted in the highest test weight, and the 162 N treatment resulted in the lowest test weight (Tables 5, 6). There was a difference between Havener and Julie in test weight across all five N rates in both Almota and Genesee; Havener was 2 kg hL−1 higher in test weight than Julie (Tables 8, 9). There was no difference in test weight caused by seeding rates across all 3 years at Almota and Genesee (Tables 10, 11). For all 3 years in Almota, there was a N × variety interaction for test weight (Table 4). In Genesee there was a N × variety interaction for test weight in 2017 (p = 0.04) and 2018 (p < 0.0001), but not in 2016 (Table 4).
Percent Plump Kernels
Nitrogen did not have a significant impact on percent plump kernels at Almota in any of the 3 years (Table 4). However, N had a significant impact on percent plump kernels 2017 at Genesee (p < 0.0001) but not in 2016 or 2018 (p > 0.05) (Table 4). Increased N rates resulted in decreased percent plump kernels only in 2017 in Genesse (Table 5). Across all N treatments in all years, Almota was 10% higher in percent plump kernels than Genesee (Table 7). There was a difference between varieties in percent plump kernels across all 3 years (Table 4). When comparing varieties' percent plump kernels across all five N rates in both Almota and Genesee, Julie was 14% higher in percent plump kernels than Havener (Table 9).
Seeding rate had a significant effect on percent plump kernels in 2018 at both Almota (p < 0.0001) and Genesee (p = 0.03). However, seeding rates did not affect percent plump kernels in either location in 2016 or 2017 (Table 4). Across all locations and years, increased seeding rates resulted in decreased percent plump, the 250 seeds/m−2 treatment resulted in the highest percent plump kernels and the 375 seeds/m−2 treatment resulted in the lowest percent plump kernels (Table 11).
Percent Thin Kernels
Nitrogen rate had a significant impact on percent thin kernels in Almota in 2017 (p = 0.03) (Table 4). There was a difference between locations for percent thin kernels across all N treatments in 3 years and barley grown in Genesee had 2% more thin kernels than Almota (Table 7). There was a difference between varieties in percent plump kernels across all 3 years in Almota and Genesee (Table 4). When comparing varieties' percent thin kernels, Havener was 6% higher in percent thin kernels than Julie (Table 9).
Seeding rates had an effect on percent thin kernels in 2018 at Almota (p = 0.01), but not in 2016 or 2017. There was no significant difference in percent thin kernels associated with the seeding rate at Genesee (Table 4). Increased seeding rates resulted in increased percent thin kernels; across all locations and years, the 375 seeds/m−2 treatment resulted in the highest percent thin kernels and the 250 seeds/m−2 treatment resulted in the lowest percent thin kernels (Table 11).
Correlations
Across all the varieties in all years, no correlation was found between grain yield and other measured traits in Almota; however, in Genesee, grain yield had a strong negative correlation with test weight (r = −0.94; p = 0.02) and a strong positive correlation with plant height (r = 0.90; p = 0.04) (Table 12). When measuring between emergence rates and other traits, the results showed that in both Almota and Genesee, there was no correlation between emergence rate and other measured traits (Table 12).
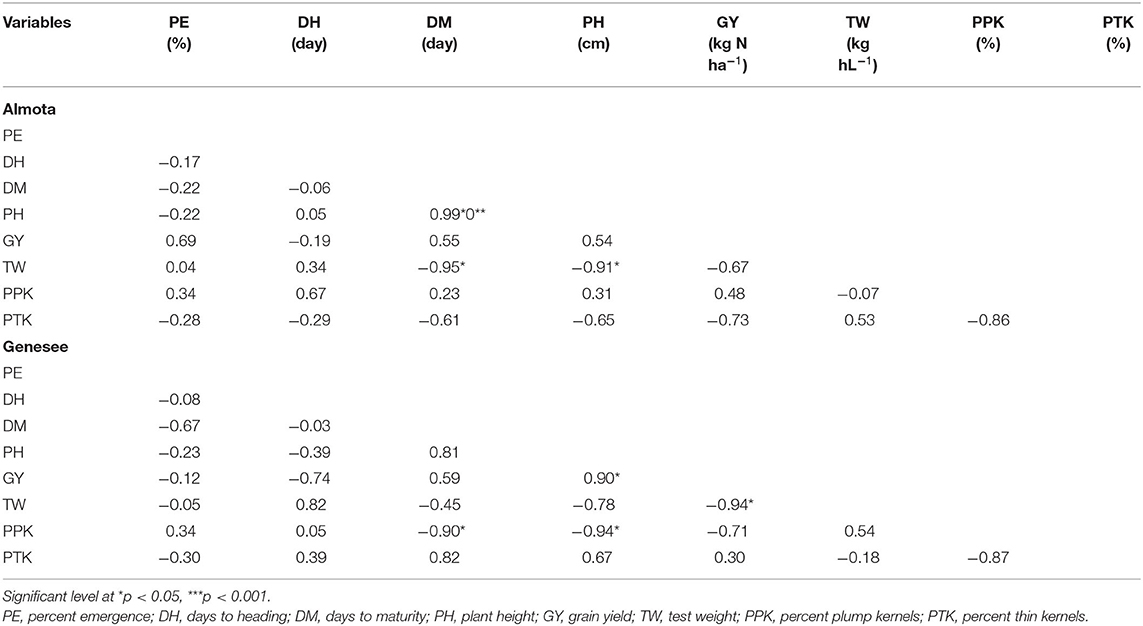
Table 12. Pearson correlation for percent emergence, days to heading, days to maturity, plant height, grain yield, test weight, percent plump kernels, and percent thin kernels in Almota and Genesee.
For plant height in Almota, there was a strong negative correlation between plant height and test weight (r = −0.90; p = 0.03), and a strong positive correlation between plant height and days to maturity (r = 0.99; p = 0.0001) (Table 12). In Genesee, plant height had a strong negative correlation with percent plump kernels (r = −0.94; p = 0.02) (Table 12). Days to heading did not correlate with any other measured traits (Table 12). However, in Almota, there was a strong negative correlation between days to maturity and test weight (r = −0.95; p = 0.01). In Genesee, there was a strong negative correlation between days to maturity and percent plump kernels (r = −0.90; p = 0.04) (Table 12). No correlation was found between percent thin kernels and other traits in either location (Table 12).
Discussion
Data are lacking for fertilizer and seeding rate guidelines in food barley. The amount of N fertilizer needed for optimal production and seed end-use quality depend on the barley's intended use—food, malting, or feed grain (Mahler and Guy, 2007). Foodpreci barley has important traits that make it distinct from feed or malt; in particular, malt barley should have low protein and low β-glucan.
Nitrogen Effects
Cultivar, environmental factors, and nitrogen fertilization have been reported to affect yield, chemical composition, and grain quality of barley (Widdowson et al., 1982; Åman and Newman, 1986; Knudsen et al., 1987; Conry, 1994; Zhang et al., 2001; Anker-Nilssen et al., 2008; Choi et al., 2020). β-glucan and protein are major components of barley (Åman et al., 1985). Given its unique functional and nutritional properties, β-glucan is the most important fiber component in barley. It is found throughout the grain endosperm and germ, but germ β-glucan has higher dietetic value (Fincher, 1975; McNeil et al., 1975; Bacic and Stone, 1981; Salomonsson et al., 1984). β-glucan content is associated with both genotype and environmental factors (Gill et al., 1982; Stuart et al., 1988; Güler, 2003; Goudar et al., 2020). Similarly, in this study there were differences among varieties in grain β-glucan content; Julie had higher β-glucan content than Havener in all years.
Nitrogen fertilizers are usually employed to increase grain yield. However, Brunner and Freed (1994) reported that β-glucan was affected by N levels, location, and years. The grain β-glucan content reported in our study was affected by location (Figure 2). Additionally, the nitrogen treatment affected the β-glucan content of Havener but not of Julie across all sites and years (Table 13). Our findings are in agreement with those of Sørensen and Truelsen (1985), Henry (1986), and Oscarsson et al. (1998), who reported that barley β-glucan content increased with increasing nitrogen rate. Brunner and Freed (1994), Thomason et al. (2012), and Aghdam and Samadiyan (2014) also found that higher nitrogen levels generally increased grain β-glucan in barley and oats. However, Gohl et al. (1978); Aastrup (1979); Hesselman et al. (1981), and Zhang et al. (2001) argued that the β-glucan content has not been consistently influenced by nitrogen, but rather that it varies across locations, typically decreasing under moist growing conditions and high temperature.
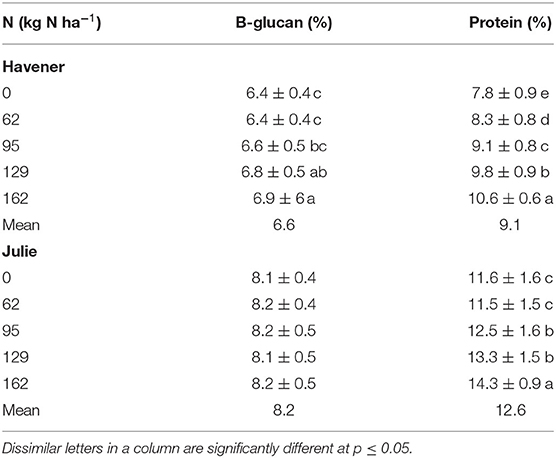
Table 13. Effect of N rate on β-glucan and protein content of barley varieties Havener and Julie across all sites and years.
Differences were found in β-glucan content between Almota and Genesee, where Genesee was 0.4% higher than Almota in β-glucan content across all varieties and years. This is in agreement with Åman (1986), Lehtonen and Aikasalo (1987), Åman et al. (1989), Zhang et al. (2001), and Goudar et al. (2020) who reported significant differences in barley β-glucan content across locations. They reported that drought conditions may be related to increased β-glucan concentration. Peterson (1991) observed a significantly higher mean β-glucan concentration for oat and barley cultivars grown under dryland vs. irrigated conditions at two locations in Idaho. Ehrenbergerová et al. (2008), reported higher precipitation during the flowering time and grain filling period and lower temperatures during the flowering time have negative effects on concentration of β-glucans. Conversely, drier and warmer weather in enhanced the content of β-glucans. This is also in line with Tiwari and Cummins (2009), who reported that temperature and precipitation were the most important climatic factors affecting β-glucan content. Because β-glucan accumulates late in grain development, stress from temperature and precipitation factors can cause the early end of grain development, and therefore, reduced β-glucan concentration in grains (Tiwari and Cummins, 2009). Thus, conditions favorable to endosperm development would increase the accumulation of β-glucan in the grain (Zhang et al., 2001; Goudar et al., 2020).
Generally, protein content increases with increasing nitrogen supply (Sørensen and Truelsen, 1985; Conry, 1994; Therrien et al., 1994). Dubetz (1961) and Hutcheon and Paul (1966) found that moisture and N availability were two important factors affecting the protein content of wheat. Soper and Huang (1963) and Nuttall et al. (1971) also demonstrated that percent protein and total protein per unit area could be predicted by measuring available soil N plus added N fertilizer. In our study, grain protein responded positively to increasing N rates in both barley varieties, where the highest protein content was observed in response to 162 kg N ha−1. Considering the combined results across all six site-years, an increase in N rates resulted in increased protein content. Janković et al. (2011) also found that increased nitrogen N rates significantly affected the total protein content in malting barley grain, where an increase in the total nitrogen rate (50, 70, 90, and 110 kg N ha−1) increased the protein content (12.6, 12.8, 12.9, and 13.5%).
Grain yield and quality traits of spring barley can vary greatly due to growing conditions (Leistrumaite and Paplauskiene, 2005). Mouchova et al. (1996) found that the efficiency of applied nitrogen fertilizers and their loss are influenced by the interaction of many factors, such as type of soil, crop, agricultural practice, including the rate, the form, the timing of fertilization and year-to-year weather patterns. The amount of nitrogen that a barley crop needs to maximize yield and quality depend on seasonal conditions, soil type, rotational history of the soil, and yield potential. Nitrogen is needed for early tiller development, without which the yield potential of the crop is limited. As expected, increased N rates increased grain yield of all the barley varieties in all years and locations; the highest grain yield observed in response to 95, 129, and 162 kg N ha−1. These results are consistent with previous reports by Singh et al. (1992) and Alazmani (2014) who reported increased wheat and barley grain yield resulting from increased nitrogen fertilization in India and Iran. Ryan et al. (2009) reported that nitrogen increased leaf area, tiller formation, leaf area index and leaf area duration and that this increase led to much greater production of dry matter and barley grain yield in Morocco. However, Singh et al. (1992) reported that increasing N fertility beyond a certain limit ultimately decreased wheat grain yield in India. In this study, Havener had a higher average grain yield (806 kg N ha−1) than Julie across all N rates, years and locations. It is possible to select barley cultivars and different growing locations, but environmental factors are much more difficult to control. The interaction between predetermined and environmental factors could play an important role in the yield and quality of barley.
Nitrogen fertilizer application, while often required to increase grain yield and protein composition of the barley grain may also reduce physical grain quality traits. Increased N rates resulted in decreased test weight. Across all site-years, the 0 N treatment resulted in the highest test weight, and the 162 N treatment resulted in the lowest test weight. However, the percent plump kernels and percent thin kernels remained constant despite the change in N rates. Jackson et al. (1994) and Bleidere et al. (2013) also found that a decline in test weight of naked spring barley, resulted from increasing N rates. Our results also indicated no correlation between days to heading and days to maturity. Tsenov (2009) found that the growing conditions significantly affected the time to heading and physiological maturity of wheat, especially under heat stress. Tsenov (2009) also reported that the period between heading and physiological maturity varied according to the temperatures in respective years. Higher temperature sums should, in principle, accelerate the date to heading and maturity. Moreover, in warmer years, highest degree maturation is accelerated, which increase the correlation between days to heading and days to maturity, while in cooler years combined with more available soil moisture during grain filling, maturation is retarded, i.e., the correlation between days to heading and days to maturity decreases. Bullrich et al. (2002) and Blake et al. (2009) reported a lack of correlation between days heading and days to physiological maturity, and that the period of grain filling was markedly less affected by the temperature, moisture, and light than time to heading, but rather, was dictated exclusively by genotype.
Seeding Effects
The seeding rates currently used for barley vary between agroclimatic zones. In the drier areas with a mean annual precipitation <250 mm, the recommended rate of 257 plants m−2 (Turk, 1998) is much lower than for semi-arid areas that receive a mean annual precipitation of 250–500 mm (Munir, 2002). Higher seeding rates are recommended in areas with a higher mean annual precipitation in part because they promote greater crop competition against weeds (Kirkland, 1993). In this study, only 1 in 6 site years showed an increase in yield due to seeding rate increases; the highest grain yield was observed in response to the 375 seeds/m−2 treatment. According to Kirkland (1993), yield increase observed alongside increased seeding rates is a function of more spikes being produced as a result of more plants being established. In Kirkland (1993), grain yields increased as seeding rates increased, with maximum yields obtained at 400 plants m−2. This suggests that the effects of seeding rate on grain yield are derived from increased production of spikes per unit area, not through the increased production of fertile tillers per plant. In general, fertility and seeding rate were directly associated with the yield of barley. Similarly, our study revealed that a seeding rate of 375 seeds/m−2 combined with N rates from 95 to 162 kg N ha−1 is optimal for realizing the maximum grain yield.
Conclusion
Nitrogen had a significant effect on protein content of both Havener and Julie but did not have an effect on β-glucan content of Julie. Julie had higher β-glucan (8.2%) and protein (12.6%) content compared to Havener, which had β-glucan (6.6%) and protein (9.1%). The location had a significant effect on β-glucan but not on protein content. Genesee resulted in higher β-glucan (7.6%) and protein (10.9%) content compared to Almota. This is likely because Genesee received more precipitation and had cooler temperatures compared to Almota. β-glucan appeared to be more related to environmental factors, such as precipitation, than to fertility. Therefore, the selection of food barley varieties with high β-glucan content should be conducted, keeping environmental adaptation in mind. Increased nitrogen fertilization resulted in higher mean grain yield up to 95 kg N ha−1, but no significant difference in yield was found between 95, 129, and 162 kg N ha−1 N. Based on our results, N rate recommendation for farmers growing food barley in these regions should be ~95 kg N ha−1 with a seeding rate of ~375 seeds/m−2 to optimize grain yield and protein content. The recommended N rate is very similar to recommendations for feed barley that has a long history of production in the region. However, the suggested seeding rate is about 50% higher than recommended for malt or feed barley.
Data Availability Statement
The original contributions presented in the study are included in the article/supplementary material, further inquiries can be directed to the corresponding author.
Author Contributions
CH, KS, JR, and KM conceived the research project. CH wrote the manuscript. KS, JR, DW, DP, and KM edited and provided additional information. All authors read and approved the final manuscript.
Conflict of Interest
The authors declare that the research was conducted in the absence of any commercial or financial relationships that could be construed as a potential conflict of interest.
Acknowledgments
We thank Western Sustainable Agriculture Research and Education (Project # SW15-061), the Washington Grain Commission, the Robert Nilan Endowment for Barley Research, and the WSU Grand Challenges Strategic Initiative for funding this research project.
References
Åman, P. (1986). A note on the content of mixed-linked β-glucans in Swedish barley. Swedish J. Agric. Res. 16, 73–75.
Åman, P., Graham, H., and Tilly, A. C. (1989). Content and solubility of mixed-linked (1 → 3), (1 → 4)-β-d-glucan in barley and oats during kernel development and storage. J. Cereal Sci. 10, 45–50. doi: 10.1016/S0733-5210(89)80033-5
Åman, P., Hesselman, K., and Tilly, A. C. (1985). The variation in chemical composition of Swedish barleys. J. Cereal Sci. 3, 73–77. doi: 10.1016/S0733-5210(85)80035-7
Åman, P., and Newman, C. W. (1986). Chemical composition of some different types of barley grown in Montana, USA. J. Cereal Sci. 4, 133–141. doi: 10.1016/S0733-5210(86)80016-9
Aastrup, S. (1979). The effect of rain on β-glucan content in barley grains. Carlsberg Res. Commun. 44:381. doi: 10.1007/BF02906187
Aghdam, S. M., and Samadiyan, F. (2014). Effect of nitrogen and cultivars on some of traits of barley (Hordeum vulgare L.). Int. J. Adv. Biol. Biomed. Res. 2, 295–299.
AgWeatherNet (2021). Washington Historical Data. Whitman, MA: Washington State University. Available online at: http://weather.wsu.edu/index.php?p=88650
Alazmani, A. (2014). Effect of nitrogen fertilizer on feed and grain yield of barley cultivar. Int. Res. J. Appl. Basic Sci. 8, 2013–2015. doi: 10.20431/2454-6224.0404005
Anker-Nilssen, K., Sahlstrøm, S., Knutsen, S. H., Holtekjølen, A. K., and Uhlen, A. K. (2008). Influence of growth temperature on content, viscosity and relative molecular weight of water-soluble β-glucans in barley (Hordeum vulgare L.). J. Cereal Sci. 48, 670–677. doi: 10.1016/j.jcs.2008.02.009
Arndt, E. A. (2006). Whole-grain barley for today's health and wellness needs. Cereal Foods World. 51, 20–22. doi: 10.1094/CFW-51-0020
Bacic, A., and Stone, B. A. (1981). Chemistry and organization of aleurone cell wall components from wheat and barley. Funct. Plant Biol. 8, 475–495. doi: 10.1071/PP9810475
Baidoo, E. A., Murphy, K., and Ganjyal, G. M. (2019). Hulled varieties of barley showed better expansion characteristics compared to hull-less varieties during twin-screw extrusion. Cereal Chem. 96, 391–404. doi: 10.1002/cche.10138
Baik, B. K., and Ullrich, S. E. (2008). Barley for food: characteristics, improvement, and renewed interest. J. Cereal Sci. 48, 233–242. doi: 10.1016/j.jcs.2008.02.002
Behall, K. M., Scholfield, D. J., and Hallfrisch, J. (2004). Diets containing barley significantly reduce lipids in mildly hypercholesterolemic men and women. Am. J. Clin. Nutr. 80, 1185–1193. doi: 10.1093/ajcn/80.5.1185
Behall, K. M., Scholfield, D. J., and Hallfrisch, J. (2005). Comparison of hormone and glucose responses of overweight women to barley and oats. J. Am. Coll. Nutr. 24, 182–188. doi: 10.1080/07315724.2005.10719464
Behall, K. M., Scholfield, D. J., and Hallfrisch, J. G. (2006). Barley β-glucan reduces plasma glucose and insulin responses compared with resistant starch in men. Nutr. Res. 26, 644–650. doi: 10.1016/j.nutres.2006.10.001
Bhatty, R. S. (1995). Hull-less barley bran: a potential new product from an old grain. Cereal Foods World 40, 819–824.
Blake, N. K., Lanning, S. P., Martin, J. M., Doyle, M., Sherman, J. D., Naruoka, Y., et al. (2009). Effect of variation for major growth habit genes on maturity and yield in five spring wheat populations. Crop Sci. 49, 1211–1220. doi: 10.2135/cropsci2008.08.0505
Bleidere, M., Jansone, Z., Grunte, I., and Jakobsone, I. (2017). Biochemical composition of spring barley grain pearled to varying degrees. Sect. B Nat. Exact Appl. Sci. 71, 468–473. doi: 10.1515/prolas-2017-0082
Bleidere, M., Zute, S., Brunava, L., Bobere, N., and Jākobsone, I. (2013). Yield and grain quality of hulless spring barley in field trials under different nitrogen management conditions. Sect. B Nat. Exact Appl. Sci. 67, 229–235. doi: 10.2478/prolas-2013-0040
Brouwer, B. O., Murphy, K. M., and Jones, S. S. (2016a). Plant breeding for local food systems: A contextual review of end-use selection for small grains and dry beans in Western Washington. Renew. Agric. Food Syst. 31, 172–184. doi: 10.1017/S1742170515000198
Brouwer, B. O., Schwarz, P. B., Barr, J. M., Hayes, P. M., Murphy, K. M., and Jones, S. S. (2016b). Evaluating barley for the emerging craft malting industry in Western Washington. Agron. J. 108, 939–949. doi: 10.2134/agronj2015.0385
Brunner, B. R., and Freed, R. D. (1994). Oat grain β-glucan content as affected by nitrogen level, location, and year. Crop Sci. 34, 473–476. doi: 10.2135/cropsci1994.0011183X003400020031x
Bullrich, L., Appendino, M., Tranquilli, G., Lewis, S., and Dubcovsky, J. (2002). Mapping of a thermo-sensitive earliness per se gene on Triticum monococcum chromosome 1A m. Theor. Appl. Genet. 105, 585–593. doi: 10.1007/s00122-002-0982-5
Choi, H., Esser, A., and Murphy, K. M. (2020). G × E interaction and stability of β-glucan content in barley in the Palouse Region of eastern Washington. Crop Sci. 60, 2500–2510. doi: 10.1002/csc2.20181
Conry, M. J. (1994). Comparative effect of six cultivars at four rates of nitrogen on the grain yield and grain quality of spring-sown malting barley in Ireland. J. Agric. Sci. 122, 343–350. doi: 10.1017/S0021859600067265
De Angelis, M., Montemurno, E., Vannini, L., Cosola, C., Cavallo, N., Gozzi, G., et al. (2015). Effect of whole-grain barley on the human fecal microbiota and metabolome. Appl. Environ. Microbiol. 81, 7945–7956. doi: 10.1128/AEM.02507-15
Delaney, B., Carlson, T., Frazer, S., Zheng, T., Hess, R., Ostergren, K., et al. (2003). Evaluation of the toxicity of concentrated barley β-glucan in a 28-day feeding study in Wistar rats. Food Chem. Toxicol. 41, 477–487. doi: 10.1016/S0278-6915(02)00298-3
Donaldson, N. C. (1980). Soil Survey of Whitman County. Washington, DC: Department of Agriculture; Soil Conservation Service. Available online at: https://www.nrcs.usda.gov/Internet/FSE_MANUSCRIPTS/washington/WA075/0/wa075_text.pdf
Dubetz, S. (1961). Effect of soil type, soil moisture, and nitrogen fertilizer on the growth of spring wheat. Can. J. Soil Sci. 41, 44–51. doi: 10.4141/cjss61-007
Ehrenbergerová, J., Belcredi, N. B., Psota, V., Hrstková, P., Cerkal, R., and Newman, C. W. (2008). Changes caused by genotype and environmental conditions in beta-glucan content of spring barley for dietetically beneficial human nutrition. Plant Foods Hum. Nutr. 63:111. doi: 10.1007/s11130-008-0079-7
FAOSTAT (2017). Production/Yield Quantities of Barley in World. Available online at: http://www.fao.org/faostat/en/#data/QC/visualize
Fincher, G. B. (1975). Morphology and chemical composition of barley endosperm cell walls. J. Inst. Brew. 81, 116–122. doi: 10.1002/j.2050-0416.1975.tb03672.x
Food and Drug Administration H. H. S. (2006). Food labeling: health claims; soluble dietary fiber from certain foods and coronary heart disease. Final Rule. 71, 29248–29250. Available online at: https://www.govinfo.gov/content/pkg/FR-2006-05-22/html/06-4703.htm
Frazier, B. E., and Cheng, Y. (1989). Remote sensing of soils in the eastern Palouse region with Landsat Thematic Mapper. Remote Sens. Environ. 28, 317–325. doi: 10.1016/0034-4257(89)90123-5
Garcia-Mazcorro, J. F., Mills, D. A., Murphy, K., and Noratto, G. (2018). Effect of barley supplementation on the fecal microbiota, caecal biochemistry, and key biomarkers of obesity and inflammation in obese db/db mice. Eur. J. Nutr. 57, 2513–2528. doi: 10.1007/s00394-017-1523-y
Gill, A. A., Morgan, A. G., and Smith, D. B. (1982). Total β-glucan content of some barley cultivars. J. Inst. Brew. 88, 317–319. doi: 10.1002/j.2050-0416.1982.tb04115.x
Gohl, B., Nilsson, M., and Thomke, S. (1978). Distribution of soluble carbohydrates in barley grain at late stage of maturity and relation to viscosity. Cereal Chem. 55, 341–347.
Goudar, G., Sharma, P., Janghu, S., and Longvah, T. (2020). Effect of processing on barley β-glucan content, its molecular weight and extractability. Int. J. Biol. Macromol. 162, 1204–1216. doi: 10.1016/j.ijbiomac.2020.06.208
Grando, S., and Macpherson, H. G. (2005). Food Barley: Importance, Uses and Local Knowledge. Aleppo: ICARDA.
Güler, M. (2003). Barley grain β-glucan content as affected by nitrogen and irrigation. Field Crops Res. 84, 335–340. doi: 10.1016/S0378-4290(03)00100-X
Guy, S. O., and Cox, D. B. (2002). Reduced tillage increases residue groundcover in subsequent dry pea and winter wheat crops in the Palouse region of Idaho. Soil Tillage Res. 66, 69–77. doi: 10.1016/S0167-1987(02)00014-4
Guy, S. O., and Gareau, R. M. (1998). Crop rotation, residue durability, and nitrogen fertilizer effects on winter wheat production. J. Prod. Agric. 11, 457–461. doi: 10.2134/jpa1998.0457
Henry, R. J. (1986). Genetic and environmental variation in the pentosan and β-glucan contents of barley, and their relation to malting quality. J. Cereal Sci. 4, 269–277. doi: 10.1016/S0733-5210(86)80029-7
Hesselman, K., Elwinger, K., Nilsson, M., and Thomke, S. (1981). The effect of β-glucanase supplementation, stage of ripeness, and storage treatment of barley in diets fed to broiler chickens. Poult. Sci. 60, 2664–2671. doi: 10.3382/ps.0602664
Huggins, D. R., and Reganold, J. P. (2008). No-till: the quiet revolution. Sci. Am. 299, 70–77. doi: 10.1038/scientificamerican0708-70
Hutcheon, W. L., and Paul, E. A. (1966). Control of the protein content of Thatcher wheat by nitrogen fertilization and moisture stress. Can. J. Soil Sci. 46, 101–108. doi: 10.4141/cjss66-018
Jackson, G. D., Berg, R. K., Kushnak, G. D., Blake, T. K., and Yarrow, G. I. (1994). Nitrogen effects on yield, beta-glucan content, and other quality factors of oat and waxy hulless barley. Commun. Soil Sci. Plant Anal. 25, 3047–3055. doi: 10.1080/00103629409369245
Janković, S., Glamočlija, D., Maletić, R., Rakić, S., Hristov, N., and Ikanović, J. (2011). Effects of nitrogen fertilization on yield and grain quality in malting barley. Afr. J. Biotechnol. 10, 19534–19541. doi: 10.5897/AJB11.2633
Juergens, L. A., Young, D. L., Schillinger, W. F., and Hinman, H. R. (2004). Economics of alternative no-till spring crop rotations in Washington's wheat–fallow region. Agron. J. 96, 154–158. doi: 10.2134/agronj2004.0154
Kaso, T., and Guben, G. (2015). Review of barley value chain management in Ethiopia. J. Biol. Agric. Healthc. 5, 84–97.
Keenan, J. M., Goulson, M., Shamliyan, T., Knutson, N., Kolberg, L., and Curry, L. (2007). The effects of concentrated barley β-glucan on blood lipids in a population of hypercholesterolaemic men and women. Br. J. Nutr. 97, 1162–1168. doi: 10.1017/S0007114507682968
Kirkland, K. J. (1993). Weed management in spring barley (Hordeum vulgare) in the absence of herbicides. J. Sustain. Agric. 3, 95–104. doi: 10.1300/J064v03n03_07
Knudsen, K. B., Åman, P., and Eggum, B. O. (1987). Nutritive value of Danish-grown barley varieties, I, Carbohydrates and other major constituents. J. Cereal Sci. 6, 173–186. doi: 10.1016/S0733-5210(87)80053-X
Leff, B., Ramankutty, N., and Foley, J. A. (2004). Geographic distribution of major crops across the world. Glob. Biogeochem. Cycles 18, 1–27. doi: 10.1029/2003GB002108
Lehtonen, M., and Aikasalo, R. (1987). Beta-glucan in two-and six-rowed barley. Cereal Chem. 64, 191–192.
Leistrumaite, A., and Paplauskiene, V. (2005). Genetic resources of spring barley: screening for yield stability and grain malt quality traits. Biologija 3, 23–26.
Li, J., Kaneko, T., Qin, L. Q., Wang, J., and Wang, Y. (2003). Effects of barley intake on glucose tolerance, lipid metabolism, and bowel function in women. Nutrition 19, 926–929. doi: 10.1016/S0899-9007(03)00182-5
Madhujith, T., Izydorczyk, M., and Shahidi, F. (2006). Antioxidant properties of pearled barley fractions. J. Agric. Food Chem. 54, 3283–3289. doi: 10.1021/jf0527504
Mahler, R. L., and Guy, S. O. (2007). Spring Barley. Northern Idaho Fertilizer Guides, CIS 920, 0–3. Available online at: https://www.extension.uidaho.edu/publishing/pdf/CIS/CIS0920.pdf
McCoy, R. (2014). Harvest heritage: agricultural origins and heirloom crops of the Pacific Northwest. Oregon Histor. Q. 115, 258–261. doi: 10.5403/oregonhistq.115.2.0258
McNeil, M., Albersheim, P., Taiz, L., and Jones, R. L. (1975). The structure of plant cell walls: VII. Barley aleurone cells. Plant Physiol. 55, 64–68. doi: 10.1104/pp.55.1.64
Meints, B., Cuesta-Marcos, A., Ross, A. S., Fisk, S., Kongraksawech, T., Marshall, J. M., et al. (2015). Developing winter food barley for the Pacific Northwest of the US. Crop Sci. 55, 1563–1573. doi: 10.2135/cropsci2014.10.0710
Meints, B., and Hayes, P.M. (2019). Breeding naked barley for food, feed, and malt. Plant Breed. Rev. 43, 95–119. doi: 10.1002/9781119616801.ch4
Miller, T. D. (1992). Growth stages of wheat. Better crops with plant food. Potash Phosphate Inst. 76:12.
Mohammed, J., Seleshi, S., Nega, F., and Lee, M. (2016). Revisit to Ethiopian traditional barley-based food. J. Ethnic Foods 3, 135–141. doi: 10.1016/j.jef.2016.06.001
Moreau, R. A., Flores, R. A., and Hicks, K. B. (2007). Composition of functional lipids in hulled and hulless barley in fractions obtained by scarification and in barley oil. Cereal Chem. 84, 1–5. doi: 10.1094/CCHEM-84-1-0001
Mouchova, H., Klir, J., and Lippold, H. (1996). “Effect of weather conditions and time of N application on the uptake of soil and applied N by winter wheat,” in Progress in Nitrogen Cycling Studies, eds O. Van Cleemput, G. Hoffman, and A. Vermoesen (Dordrecht: Springer), 237–242. doi: 10.1007/978-94-011-5450-5_39
Munir, A. T. (2002). Influence of varying seeding rates and nitrogen levels on yield and yield components of barley (Hordeum vulgare L. cv. Rum) in the semi-arid region of Jordan. Bodenkultur Wien Muchen. 53, 13–18.
Newman, C. W., and Newman, R. K. (2006). A brief history of barley foods. Cereal Foods World 51, 4–7. doi: 10.1094/CFW-51-0004
Nuttall, W. F., Zandstra, H. G., and Bowren, K. E. (1971). Exchangeable ammonium-and nitrate-nitrogen related to yields of Conquest barley grown as second or third crop after fallow in northeastern Saskatchewan. Can. J. Soil Sci. 51, 371–377. doi: 10.4141/cjss71-050
Obert, D. E., Hang, A., Hu, G., Burton, C., Satterfield, K., Evans, C. P., et al. (2013). Registration of “Julie” high β-glucan spring barley. J. Plant Registr. 7, 1–4. doi: 10.3198/jpr2011.12.0639crc
O'Neil, C. E., Nicklas, T. A., Zanovec, M., and Cho, S. (2010). Whole-grain consumption is associated with diet quality and nutrient intake in adults: The National Health and Nutrition Examination Survey. 1999-2004. J. Am. Diet. Assoc. 110, 1461–1468. doi: 10.1016/j.jada.2010.07.012
Oscarsson, M., Andersson, R., Åman, P., Olofsson, S., and Jonsson, A. (1998). Effects of cultivar, nitrogen fertilization rate and environment on yield and grain quality of barley. J. Sci. Food Agric. 78, 359–366. doi: 10.1002/(SICI)1097-0010(199811)78:3<359::AID-JSFA126>3.0.CO;2-R
Paulitz, T. C., Smiley, R. W., and Cook, R. J. (2002). Insights into the prevalence and management of soilborne cereal pathogens under direct seeding in the Pacific Northwest, USA. Can. J. Plant Pathol. 24, 416–428. doi: 10.1080/07060660209507029
Peterson, D. M. (1991). Genotype and environment effects on oat beta-glucan concentration. Crop Sci. 31, 1517–1520. doi: 10.2135/cropsci1991.0011183X003100060025x
Pittelkow, C. M., Liang, X., Linquist, B. A., Van Groenigen, K. J., Lee, J., Lundy, M. E., et al. (2015). Productivity limits and potentials of the principles of conservation agriculture. Nature 517, 365–368. doi: 10.1038/nature13809
Quinde, Z., Ullrich, S. E., and Baik, B. K. (2004). Genotypic variation in color and discoloration potential of barley-based food products. Cereal Chem. 81, 752–758. doi: 10.1094/CCHEM.2004.81.6.752
Ryan, J., Abdel Monem, M., and Amir, A. (2009). Nitrogen fertilizer response of some barley varieties in semi-arid conditions in Morocco. J. Agric. Sci. Technol. 11, 227–236.
Salamini, F., Özkan, H., Brandolini, A., Schäfer-Pregl, R., and Martin, W. (2002). Genetics and geography of wild cereal domestication in the near east. Nat. Rev. Genet. 3, 429–441. doi: 10.1038/nrg817
Salomonsson, A. C., Theander, O., and Westerlund, E. (1984). Chemical characterization of some Swedish cereal whole meal and bran fractions. Swedish J. Agric. Res. 14, 111–117.
Seal, C. J., Jones, A. R., and Whitney, A. D. (2006). Whole grains uncovered. Nutr. Bull. 31, 129–137. doi: 10.1111/j.1467-3010.2006.00559.x
Singh, V. P. N., Uttam, S. K., and Laddin, J. D. (1992). Response of wheat cultivars to different N levels under early sown conditions. Crop Res. 5, 82–86.
Slavin, J., Marquart, L., and Jacobs, D. Jr. (2000). Consumption of whole-grain foods and decreased risk of cancer: proposed mechanisms. Cereal Foods World 45, 54–58.
Smiley, R. W., Ingham, R. E., Uddin, W., and Cook, G. H. (1994). Crop sequences for managing cereal cyst nematode and fungal pathogens of winter wheat. Plant Dis. 78, 1142–1149. doi: 10.1094/PD-78-1142
Soper, R. J., and Huang, P. M. (1963). The effect of nitrate nitrogen in the soil profile on the response of barley to fertilizer nitrogen. Can. J. Soil Sci. 43, 350–358. doi: 10.4141/cjss63-041
Sørensen, C., and Truelsen, E. (1985). Chemical composition of barley varieties with different nutrient supplies. 1: concentration of nitrogen, tannins, phytate, beta-glucans and minerals. Tidsskrift Planteavl 89, 253–261.
STATISTA (2020). Worldwide Production of Grain in 2018/19, by Type (in Million Metric Tons). Available online at: https://www.statista.com/statistics/263977/world-grain-production-by-type/
Stuart, I. M., Loi, L., and Fincher, G. B. (1988). Varietal and environmental variations in (1 → 3, 1 → 4)-β-glucan levels and (1 → 3, 1 → 4)-β-glucanase potential in barley: relationships to malting quality. J. Cereal Sci. 7, 61–71. doi: 10.1016/S0733-5210(88)80060-2
Therrien, M. C., Grant, C. A., Carmichael, C. A., and Noll, J. S. (1994). Effect of fertilizer management, genotype, and environmental factors on some malting quality characteristics in barley. Can. J. Plant Sci. 74, 545–547. doi: 10.4141/cjps94-098
Thomason, W. E., Phillips, S. B., Warren, J. A., and Alley, M. M. (2012). Winter hulless barley response to nitrogen rate and timing and foliar phosphorus. J. Plant Nutr. 35, 225–234. doi: 10.1080/01904167.2012.636125
Thorwarth, P., Ahlemeyer, J., Bochard, A. M., Krumnacker, K., Blümel, H., Laubach, E., et al. (2017). Genomic prediction ability for yield-related traits in German winter barley elite material. Theor. Appl. Genet. 130, 1669–1683. doi: 10.1007/s00122-017-2917-1
Tiwari, U., and Cummins, E. (2009). Factors influencing β-glucan levels and molecular weight in cereal-based products. Cereal Chem. 86, 290–301. doi: 10.1094/CCHEM-86-3-0290
Tsenov, N. (2009). Relation between time to heading and date of maturity of winter common wheat varieties (Triticum aestivum L.). Agric. Sci. Technol. 1, 126–132.
Turk, M. A. (1998). Effect of nitrogen and phosphorus levels on barley cultivars grown in semi-arid conditions. J. Agronomy Crop Sci. 181, 257–262. doi: 10.1111/j.1439-037X.1998.tb00426.x
USDA (2019). World Agricultural Production. USAD-FAS Circular Series WAP 6-19. Available online at: https://apps.fas.usda.gov/psdonline/circulars/production.pdf
Vasanthan, T., and Hoover, R. (2009). “Barley starch: production, properties, modification and uses,” in Starch, 3rd Edn., eds J. BeMiller, and R. Whistler (Cambridge: Academic Press), 601–625. doi: 10.1016/B978-0-12-746275-2.00016-1
Von Bothmer, R., Sato, K., Komatsuda, T., Yasuda, S., and Fischbeck, G. (2003). “The domestication of cultivated barley,” in Diversity in Barley (Hordeum vulgare), eds R. von Bothmer, T. Van Hintum, H. Knupffer, and K. Sato (Amsterdam: Elsevier), 9–27. doi: 10.1016/S0168-7972(03)80004-X
Von Bothmer, R. V., Jacobsen, N., Baden, C., Jorgensen, R. B., and Linde, L. (1995). An Ecogeographical Study of the Genus Hordeum. International Board for Plant Genetic Resources.
Weather Underground (2021). Almota and Genesee Historical Weather Data. Available online at: https://www.wunderground.com/
Wellness Foods (2005). FDA Allows Barley Products to Claim Reduction in Risk of Coronary Heart Disease. FDA News Release. Available online at: https://www.foodprocessing.com/industrynews/2005/592/
Widdowson, F. V., Jenkyn, J. F., and Penny, A. (1982). Results from factorial experiments testing amounts and times of granular N-fertilizer, late sprays of liquid N-fertilizer and fungicides to control mildew and brown rust on two varieties of spring barley at Saxmundham, Suffolk 1975–8. J. Agric. Sci. 99, 377–390. doi: 10.1017/S0021859600030173
Wise, K., Johnson, B., Mansfield, C., and Krupke, C. (2011). Managing Wheat by Growth Stage. Purdue Extension. ID-422. West Lafayette, IN: Purdue University. Available online at: https://www.extension.purdue.edu/extmedia/ID/ID-422.pdf
Young, F. L., Ogg, A. G., Papendick, R. I., Thill, D. C., and Alldredge, J. R. (1994). Tillage and weed management affects winter wheat yield in an integrated pest management system. Agron. J. 86, 147–154. doi: 10.2134/agronj1994.00021962008600010027x
Zhang, G., Chen, J., Wang, J., and Ding, S. (2001). Cultivar and environmental effects on (1 → 3, 1 → 4)-β-D-glucan and protein content in malting barley. J. Cereal Sci. 34, 295–301. doi: 10.1006/jcrs.2001.0414
Zhou, M. X. (2009). “Barley production and consumption,” in Genetics and Improvement of Barley Malt Quality. Advanced Topics in Science and Technology in China, eds G. Zhang and C. Li (Berlin: Springer), 1–17.
Keywords: naked barley, β-glucan, nitrogen, seeding rate, no-till
Citation: Habiyaremye C, Schroeder KL, Reganold JP, White D, Packer D and Murphy KM (2021) Effect of Nitrogen and Seeding Rate on β-Glucan, Protein, and Grain Yield of Naked Food Barley in No-Till Cropping Systems in the Palouse Region of the Pacific Northwest. Front. Sustain. Food Syst. 5:663445. doi: 10.3389/fsufs.2021.663445
Received: 02 February 2021; Accepted: 03 May 2021;
Published: 31 May 2021.
Edited by:
Rakesh Bhardwaj, National Bureau of Plant Genetic Resources (ICAR), IndiaReviewed by:
Paras Sharma, National Institute of Nutrition, IndiaDinesh Kumar, Indian Institute of Wheat and Barley Research (ICAR), India
Copyright © 2021 Habiyaremye, Schroeder, Reganold, White, Packer and Murphy. This is an open-access article distributed under the terms of the Creative Commons Attribution License (CC BY). The use, distribution or reproduction in other forums is permitted, provided the original author(s) and the copyright owner(s) are credited and that the original publication in this journal is cited, in accordance with accepted academic practice. No use, distribution or reproduction is permitted which does not comply with these terms.
*Correspondence: Kevin M. Murphy, a211cnBoeTJAd3N1LmVkdQ==