 Ejovi Akpojevwe Abafe
- Department of Agriculture and Animal Health, University of South Africa, Roodepoort, South Africa
The seamless, strong positive relationship across numerous nations, years, livestock, and crops on the welfare effects of commercialization highlights its importance in achieving the United Nations food security goals. This article examines the drivers of commercialization and heterogeneities existing at household levels. Here, the benefit of using a quantile regression technique is compared with the ordinary least square estimate to examine the relationships between smallholder commercialization and predictors. Using 177 observations from a single district in North West Province, South Africa, this paper empirically investigates the auxiliary benefit of the quantile regression technique as a strategic policy instrument to assess determinants and variations of agricultural commercialization. The principal finding of this study indicates that the degree of sunflower commercialization differs significantly across households in the study area. In addition, sunflower commercialization, at mean, is uniquely associated with hectares cultivated for sunflower production, household head, and market outlet. However, the emphasis of the ordinary least square is whether variation counts on average. This supposition may inaccurately depict the response distribution. For this reason, bootstrap quantile regression (QR) was implemented to tackle this limitation. The results of the QR indicate that heterogeneity in sunflower commercialization cannot be disregarded for the case of household size, market outlet, hectares cultivated for sunflower production, education, access to information, and gender. In addition, the market outlet and farming system appear to maintain their significant impact, although with varying magnitudes across all quantiles. Finally, the findings indicate that those in policy space promoting smallholder commercialization should be cognizant of the heterogeneity and potential benefits of efficacious sunflower promotion in South Africa and other African nations.
Introduction
The seamless, strong positive relationship across numerous nations, crops, livestock, and years on welfare effects of commercialization highlight its importance in achieving food security. Scientific evidence on smallholder commercialization in Sub-Saharan Africa (SSA) dating back to the 1980s has attracted increasing attention due to its vital role in modernization, agricultural specialization, and systemic economic transformation in the direction of exponential and sustainable growth (Mbitsemunda and Karangwa, 2017; Abate et al., 2021). Other previous studies conducted in SSA and elsewhere indicate that agricultural commercialization increases household incomes and promotes rural development, combating food insecurity (Lifeyo, 2017; Kyaw et al., 2018). Compelling evidence from other high-quality literature (Pender and Dawit, 2007; Barrett, 2008; Sigei, 2014; Muricho et al., 2015; Mmbengwa et al., 2018) has also established the empirical regularity that achieving increased income, food security, farm productivity, and high standards of living is positively and strongly associated with commercialization. In a plurality of context, higher income resulting from commercialization stimulated increased households' dietary diversity and better nutrition security. Among these bases, researchers, government, policymakers, and other institutional entities in low-income countries are keen to promote agricultural sustainability through smallholder market participation. However, despite the attention and employing 1,000 times more people than commercial agriculture, small-scale farming systems are characterized by low household incomes due to market integration constraints (Thamaga-Chitja and Morojele, 2014; Von Loeper et al., 2016). Ubiquitous market failures in SSA put farmers at the peril of engaging in crucial cash cropping operations, mainly if this renders households reliant on unpredictable food markets to meet their food intake needs. For example, where market failure prevails, the adverse effect is primarily registered on factors such as incomes, food consumption, and nutrition, ultimately weakening household safety to insecure land tenure, policy biases, and gender equalities (Pender and Dawit, 2007). This suggests that policy must be tailored to help farmers overcome market failure/barrier traps as indicated in the intensity of market participation literature (Omiti et al., 2009; Kiwanuka and Machethe, 2016) because smallholder agriculture accounts for nearly two-thirds of the natural wealth and 80% of food consumed in developing countries, covering pastureland, and crops.
Commercializing smallholder agriculture has been a critical component of rural development and poverty eradication programs in South Africa (SA) and other African countries. These would entail strengthening the agricultural production system and fostering stable trading frameworks, aided by greater specialization of high-value-cash crops such as the sunflower. As Omiti et al. (2009) explain, market-oriented production entails system transformation based on improved production techniques, technological advances, and agricultural modernization. According to this view, profit-maximization orientation drives input utilization and output mix selections since higher marketable share outputs lead to higher-value specialized farming operations, ultimately displacing integrated farming systems. Indeed, commercialization increases the diversity of sold outputs at the national level while also encouraging specialization at local and household levels (Nwafor, 2015). The potential advantage of specialization through market integration of smallholder farmers highlights the importance of agricultural commercialization.
On the one hand, the commercialization of smallholder farms leads to increased market competition and lowers transaction costs, resulting in a progressive decline in real food prices (Jayne et al., 1996). On the other hand, if market access is guaranteed, the benefits of better commodity prices and lower input costs for commercialization are efficiently transmitted to financially deprived households (Rahman and Westley, 2001). These transformations improve household welfare (as a consumer) by lowering real food prices, resulting in increased purchasing power, while also allowing for the reallocation of scarce farm income (as producers) to other off-farm enterprises for increased income (Davis, 2006). Jaleta et al. (2009) summarize the effects of commercialization into three major categories: (a) employment and income accumulation mirroring household welfare state, (b) nutrition and health, dependent on the level of income obtained via the current level of market integration, and finally, macro-economic aspects, which are beyond household level. Thus, the positive effects of commercialization transcend any associated adverse effects despite the heterogeneous impacts at household levels.
Pingali and Rosegrant (1995) further explain how commercialization follows a three-stage process, starting with subsistence, semi-commercial, and finally, full-fledged commercial state. From the household's perspective, subsistence agriculture aims to achieve food self-sufficiency using non-traded and household inputs. Then, in semi-commercial, the input sources and goals rapidly shift to surplus production, leveraging traded and non-traded household inputs. And as farmers attain a full commercial state, profit maximization becomes the goal when purchasing inputs from the markets. While the net household welfare benefits via commercialization are widely acknowledged, there is no universally accepted criterion in determining the levels of commercialization. Since commercialization is continually advanced in Sub-Saharan Africa for household wealth creation and rural development, there has been an uptick concern regarding “what scale to employ in quantifying its intensity.”
While the extant literature on commercialization nods mutually in delineation, scholars have employed various techniques, such as proportions of sale output, conditional on market participation decisions to examine the level (intensity) of smallholder commercialization (Kyaw et al., 2018). Other authors have used a ratio taking value from zero (no sales) to one (all outputs sold), focused on marketed agricultural outputs, indicating that farmers can be at any point of the continuum (Fredriksson et al., 2010; Abu et al., 2014; Nwafor, 2015). The latter followed the concept of agricultural commercialization of Govereh et al. (1999) as a proportion of sales outputs. Thus, commercialization can be seen as a process of transition, with the two extremities of the continuum representing entirely subsistence and fully commercial, respectively, and combinations of households in-between. This gives a better-nuanced picture of a household output market behavior and the quantity of output they choose to sell. Though the net effects are not invariably or homogeneously positive, there is significant agreement that commercialization comes with varying impacts on different social strata (wealthy and the economically challenged, young and old, landowners and landless, small landholdings and large landholdings, children, and women) under various household, organizational, and policy settings (Jaleta et al., 2009).
To date, there has been an overwhelmingly higher number of cited successes in SSA regarding the commercialization of smallholder farmers. However, the existing empirical evidence on commercialization differs widely in several dimensions, including methodologies. There are quite a lot of studies that touch on commercialization in SSA in regard to livestock, high-value cash crops, and staple food grains using various methodologies, such as supply and demand function (Ouma et al., 2010), probit regression model (Mbitsemunda and Karangwa, 2017; Mathagu et al., 2018; Yaméogo et al., 2018; Dlamini-Mazibuko, 2019), Cragg double hurdle model (Mignouna et al., 2016; Mbitsemunda and Karangwa, 2017; Dlamini and Huang, 2019; Abate et al., 2021; Hlatshwayo et al., 2021), Triple Hurdle Model (Burke et al., 2015; Lifeyo, 2017), Heckman and Tobit models (Zamasiya et al., 2012; Adeoti, 2014; Mbitsemunda and Karangwa, 2017; Kyaw et al., 2018), and instrumental variable approach using two-stage least square (Kondo, 2019). While these studies cited above have different coverage and certain commonalities, the trend is relatively explicit-farm households participate actively in markets as a function of distinct concurrent decisions and sales volume choices, both of which are contingent on market participation. For example, Heckman's two-stage model uses the probit regression model to assess household market participation decisions. Then, the inverse Mills ratio derived from the binary probit regression model is merged with other predictor variables in explaining variance in the continuous, non-zero response variable (proportion of sales) (Kyaw et al., 2018). The primary premise of the Heckman model is that a given value of the outcome variable is observed if it is greater than a specific cutoff. While this aids in reducing selection bias, it has limits since it is unsuited for purely non-negative data. Unlike the Heckman model, the Tobit model is a single estimator that defines the choice between positive and zero sales and sales volume due to market participation (Adeoti, 2014). In addition, the Tobit model stipulates that the same drivers influence both market participation and sales quantity. Although the outcome variable (sales proportion) can assume negative values, in theory, censoring prevents them from being observed. Going one step further, Cragg's double hurdle model, like the Heckman model, is a two-stage econometric regression model. The model, however, is a generalization of the Tobit model, wherein two distinct stochastic processes drive market participation and sales volume decisions (Dlamini and Huang, 2019). The significant distinction in the two-stage models is predicated on Heckman's assumption that non-participants will likely not participate in the market under any situations (Kiwanuka and Machethe, 2016). The Cragg model is a more flexible variation of the Heckman and Tobit models in a specific context (Eakins, 2016). The model can be adjusted to account for heteroscedasticity by describing the variance of the errors as a function of a range of continuous variables (Aristei and Pieroni, 2008); even so, it cannot offer a complete depiction of the response variable. Again, another critical limitation of the double-hurdle specification is that it is based on the assumption of bivariate normality of the error terms; meaning, if the normality assumption is violated, the maximum likelihood estimates of the model will be discordant (Aristei and Pieroni, 2008). Thus, due to these limitations and apparent variability at household levels, applying models mentioned above or the classical regression model to derive inferences of the average household in this scenario may mask salient information of the outcome variable.
For this reason, we invoke a quantile regression technique to examine the relationship between covariates and smallholder commercialization across the conditional proxy for commercialization distribution. Quantile regression has numerous advantages, such as allowing for heterogeneous impact, but one downside is that parameters are difficult to assess than Gaussian or generalized regression (Waldmann, 2018). Nonetheless, only a few, if any, studies in SSA have employed a quantile regression to model smallholder farmer commercialization. We are also oblivious of any formal empirical studies employing quantile regression estimates to investigate sunflower commercialization in African agriculture. Furthermore, no other study has specifically investigated sunflower commercialization, except perhaps Mathagu et al. (2018), using a binary logistic model to examine the factors that affect smallholder market participation.
With all comparative advantages of increasing commercialization through sunflower production, this manuscript examines the drivers of sunflower commercialization and the heterogeneity at household levels while expanding the literature on this subject. Taking a completely different technique, this article compares quantitative empirical evidence that offers little insight into the effects of covariates on commercialization and conjectural intuitions with quantitative experiential work that highlights critical influences of regressors on household commercialization using a more deterministic statistical approach. The study also identifies possible research gaps that merit future studies in smallholder commercialization conceptual and analytical aspects. This study considered all smallholder sunflower farmers as market participants since all respondents sold portions, while others sold all their produce to NWK market outlets. Another contribution of this article is that no arbitrary cutoff or typology was used to categorize respondents (subsistence, semi-commercial, and commercial), as the impact of the explanatory variables differs across households. The article focuses primarily on the degree of household commercialization, employing quantiles ranging from 0 to 100% output sales. We contend that understanding these drivers and the quantiles to which the covariates influence sunflower commercialization within the district is critical for policy implications.
The remainder of this paper proceeds as follows. The following section briefly presents an overview of the sunflower sector in South Africa, preceded by the analytical context and data collection pattern. Next, the sections explain the analytical model used to evaluate the impacts of commercialization, then the summary statistics. The penultimate section explains the analytical result and discussions, and the last section presents inferences and addresses the policy implication of the result.
Overview of Sunflower Production in South Africa
Sunflower (Helianthus Annuus L.) is the fourth largest vegetable oil in global trade after rapeseed, peanut, and soybean, with a production of 53.6 million metric tons in the 2018/2019 season, where Russia and Ukraine accounted for 53.6% of the total (Louw, 2020; The Southern African Grain Laboratory NPC., 2020). If correctly exploited, the yield can be tapped to its maximum potential as an option to conventional oil crops such as soybean, rapeseed, peanut, palm oil, and palm kernel oil. At present, South Africa is the leading producer of sunflower crops in SSA and the tenth-largest globally, with an estimated average yield of 1.32 tons/ha and annual production of over 700,000 tons (AgriBusiness10, 2020). In terms of domestic production, the Free State and North West Province accounted for 89.6% of the total 678,000 tons produced during the 2018/2019 season (The Southern African Grain Laboratory NPC., 2020). Sunflower is currently the leading oilseed crop in Southern Africa and the third most adaptable grain crop produced after wheat and maize. As a result of climate change, many African farmers—particularly rain-dependent farmers in South Africa, are increasingly adopting the cultivation of this drought-resistant crop. It is mainly grown during the summer months when there is abundant rainfall. Nevertheless, the production yields fluctuate yearly, contingent on meteorological circumstances and market conditions. Unlike other cereal grains, sunflowers thrive in harsh, dry weather conditions and have long planting windows suitable for the South Africa dryland areas (Ferdi and Gerhard, 2015). Beyond these potentials mentioned above, sunflower oil is a healthy and highly valued vegetable oil used by households, food industries, restaurants, and feed industries (Department of Agriculture, Forestry, and Fisheries, 2019; Marinda, 2020). Sunflowers account for approximately 87% of vegetable oil output, making it a preferred crop over other oilseeds. Furthermore, sunflower seeds constitute 5% of the total cereal grain production in South Africa. It is a promising and cost-effective agricultural crop with numerous advantages in increasing soil health, local cropping systems, and biodiversity in crop rotation systems (Adeleke and Babalola, 2020).
Sunflower production is, therefore, an excellent choice for local and national agribusiness with significant potential in household farming systems, owning to its low input cost, consistent yields, marginal cropping conditions, and short growing window (Markowitz, 2018; Department of Agriculture, Forestry, and Fisheries, 2019). The crop is cultivated by smallholder and commercial farmers in South Africa, constituting 3.8% of the total arable land. Sunflower is ideal for crop rotation and can be used as a backup crop by households in late planting seasons. Combined with other high-value agro operations, farming sunflower positively impacts food security, wealth development, and poverty alleviation, making it an excellent option to promote the much recommended agricultural commercialization. The top features that emerge are that sunflower has considerable socioeconomic merit since it can offer roughly 25% of the edible oil requisite by South Africans and can be a viable source of income for agricultural households (Torimiro et al., 2014). Moreover, the rising demand for healthy vegetable oil and oilcake presents South African farmers, especially rural dwellers, with many opportunities in the sunflower sectors to boost their living standards. For example, Mathagu et al. (2018), studying market participation in Limpopo Province, South Africa, find evidence that smallholder farmers benefit from commercializing sunflower, but several socioeconomic constraints hamper their participation. Torimiro et al. (2014) make a similar case that the economic benefits of sunflower crops point to promising potentials for increasing agricultural productivity and alleviating rural poverty.
The value chain of sunflower offers other ample opportunities for households and small-scale entrepreneurs, and its primacy in South African crop production cannot be understated. Further reinforcing the impression that the value chain offers extensive opportunities, sunflowers are food plants that can be eaten raw, dried, cooked, pulverized, and roasted, and the roasted seeds can serve as a coffee substitute. From horticultural standpoints, sunflower acts as multifunctional decorative plants grown for wildlife games, recreational uses, domicile for birds and rodents, and sources of food and earnings for households. Efficient use of these opportunities (participating in lucrative expanding sunflower market) can be linked to good supply response with potential in achieving food security through wealth creation. Given the blatant empirical consistency of a positive association, Hlatshwayo et al. (2021) surmise that expanding markets and assisting smallholder farmers in participating in cash crop marketing is effective in supporting households in reducing food poverty and insecurity.
In terms of domestic contribution, sunflower production accounted for over 6.04% of gross value production for field crops in 2017, making sunflower seed the primary driver of the South African seed complex market (van Zyl, 2010; Department of Agriculture, Forestry, and Fisheries, 2019). Between 2008 and 2017, about 751.3 thousand tons of sunflower seed were produced, with gross values of approximately 3.2 billion Rand per year (Department of Agriculture, Forestry, and Fisheries, 2019). In South Africa, the principal demand for sunflower comes from vegetable oil and animal feed producers, and the domestic sunflower industry is intertwined (demand, supply, and price linkage). The interaction of this interwoven system impacts sunflower production and consumption (see Figure 1 for the provincial contribution of the sunflower crop in South Africa for the 2018/2019 season). Over the past 12 years, the demand for sunflower oil has risen by 68%, with a projected 41% increase in demand for oil and a 28% estimated increase in the demand for sunflower oilcake in the coming decade (The Southern African Grain Laboratory NPC., 2020), but perhaps the greatest concern is that domestic supply has barely kept pace with demand. While farmers in South Africa are rapidly embracing sunflower production, the rate of increase is much faster than the increase in supply for sunflower oil (Lekunze et al., 2011; Ferdi and Gerhard, 2015; Adeleke and Babalola, 2020). As a corollary, South Africa will undoubtedly remain a net importer of sunflower seeds, although having double-sized seed crushing capacities to produce vegetable oil and oilcake, and vast arable land that should justify stakeholders and the government involvement in promoting awareness as well as production through market participation. Understanding what smallholder farmers have accomplished in their market access, particularly in the sunflower sector, is critical for government, stakeholders, agricultural scholars, and private sector programs.
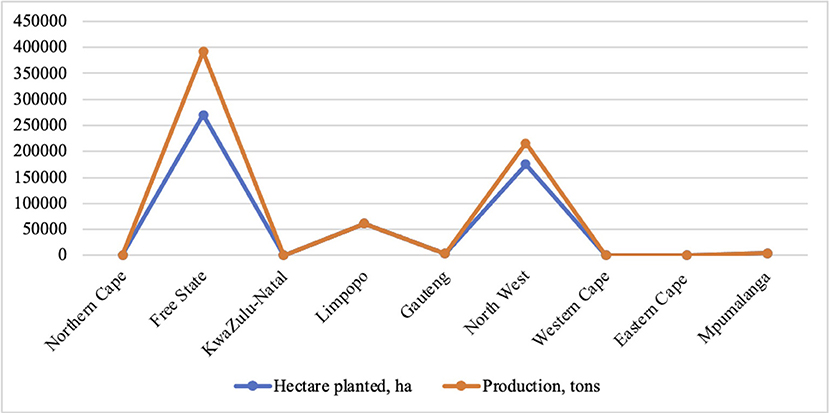
Figure 1. Stylized provincial contributions to sunflower production in South Africa (2018/2019 season).
Materials and Methods
Conceptual Framework/Empirical Strategy
To provide the rationale for the quantile regression model, we first outlined the level to which smallholder sunflower farmers are market oriented. Considering that all respondents in our dataset market some sunflowers produce: A precise proxy that measures the sheer variation of the level of commercialization across survey samples is essential. Within this framework, a farmer with a zero value is presumed fully subsistence; the nearer the score climbs to 100, the more commercialized the household is. Recall that the central premise of the article is that the impacts of commercialization are not homogeneous and, therefore, cannot be averaged. As a result, we used the household commercialization index (HCI) implemented by Govereh et al. (1999) and Strasberg et al. (1999), defined as:
where hhi is the ith farmer in year j.
This portrays the ratio of the gross value of all sunflower sales per respondent per year to the gross value of all sunflower production. Thus, capture the complete proxy for the outcome variable. Importantly, it also allows for discussion on how much production (sunflower yield) households choose to sell while being relatively easy to quantify (Carletto et al., 2017). However, the most significant concern of using HCI is the caveat of estimation inconsistency across time (Strasberg et al., 1999). Unfortunately, this was not tested in this study since our data was gathered over one season. Nevertheless, the sparse evidence that attempts to appraise this implication tends to prioritize different time-period (Cazzuffi et al., 2018); the proof is at best tentative than exhaustive.
Since the HCI has presented a perfect aperture into the outcome variable, we, therefore, invoked quantile regression following Koenker and Bassett (1978), a crucial technique for modeling heterogeneous impacts of predictors on response and, concomitantly, account for unobserved heterogeneity and permits for heteroscedasticity in the disturbance (Koenker, 2005). Contrary to summary point estimates given by ordinary least square estimate, the mean effect of regressors on the “average market participant” E (y/x) is measured. Focusing on average commercially oriented households can obfuscate essential aspects of the causal relationship, resulting in a partial representation of household market behavior. It is crucial to highlight that the focus of this study is to define the relationship at various percentage points of the response distribution, which other models, including OLS, cannot perform. Akin to how the mean presents an imperfect depiction of a single distribution, OLS produces an imperfect matching picture for a given dataset, but the quantile regression (QR) model can capture the heterogeneous impact of regressors on the outcome variable.
For various reasons, we feel that using quantile regression to estimate the heterogeneity in the commercialization of smallholder farmers is superior to models mentioned above in proceeded sections and the traditional least, as the response variable also violates least-squares assumptions of normality and homoscedasticity. Moreover, QR estimates are also less sensitive to outliers and heavy-tailed exponential distribution, i.e., invariant to outliers of the regressand that appears to be ± ∞, whereas OLS estimators are not robust to minor deviations from a normal distribution (Coad and Rao, 2008). Unlike OLS, which focuses on average estimates, QR has the added advantage of explaining the whole conditional-response variable distribution by calculating the values of the coefficients at different quantiles. It is also worth noting that QR avoids the restrictive conjecture that the error term is uniform across the conditional distribution. Easing this assumption permits the recognition of the heterogeneity at household levels, thereby considering the probability that the slope estimate differs at various quantiles of the conditional response distribution. Overall, there are two basic estimation approach for QR (a) minimizing the weight absolute deviation, i.e., the most traditional inferential approach of QR, and (b) the maximization of a Laplace likelihood used in developing Bayesian variants of QR. However, we consider the former due to estimation brevity, but Kostov and Davidova (2013) present an overt overview of the latter. The quantile regression is expressed as follows:
where the index i stands for the individual household, yi is the outcome variable, while Xi is the covariate vector for household i. The βτ represents the linear quantile precise effects, given 0 < τ < 1 for fixed and known quantile. Unlike, OLS with a fixed coefficient, QR allows the coefficients to vary with quantiles. They are expressed in the above equation as the unknown function of the quantile τ, where the unknown error term μτi indicates the unspecified cumulative distribution function τi. There are no unique distribution assumptions regarding the distribution function other than the limit in the above equation, meaning, the distribution function at θ is τ. The latter is referred to as a linear quantile restriction and can be relaxed when considering a non-parametric approach of the quantile regression model (Kostov and Davidova, 2013). This restriction results in the following Equation (2) below:
where Qyι(τ / Xi) depicts the quantile function of the outcome variable yi conditional on the vector of covariates Xi at a given quantile τ. Consequently, the quantile model describes the τth quantile of the outcome variable in linearity of the covariate. Unlike the classical OLS regression, quantile regression does not assume that the mean of the outcome is conditionally Gaussian (normal). Quantile regression predicts the conditional median and ranges of different quantile functions by asymmetric minimization of the weighted absolute residuals. This distinction makes it possible to fit data that are not normally distributed to quantile regression without worrying about parameter bias. Accordingly, QR can be used to evaluate the association of X and Y within a given distribution quantile of Y, which involves the process of determining the sample score of Y that correlates with the specific quantiles of concern, and it is achieved through asymmetric minimization of the weighted absolute residuals (Petscher and Logan, 2014). This is expressed in the following equation:
where YI is the vector of the explanatory variables, while ξτ is the response variable, and τ is the quantile of interest. In this case, if the residual is positive, then it is assigned a weight of τ, and if the residual is negative, then it is assigned a weight of 1 − τ. The estimated conditional quantile function can differ across all quantiles, and the coefficient shares a similar interpretation with the OLS model as specified in Equation (2.1.4). The standard conditional quantile is specified to be linear:
For the jth predictor, the marginal effect is the coefficient for the qth quantile
where βqj coefficients are inferred to be the partial derivative of the conditional regressand quantile regarding a specific predictor while fixing the other variables, δQq(yij|xij)/δx. The coefficients are interpreted as the degree of change in the quantile q of the response distribution as a unit in the value of the corresponding predictor. The marginal effects are for infinitesimal changes in the predictor, assuming the regressand remains at the same quantile. Our response variable is continuous in a continuum of 0 to 1 (the ratio of crop sold from total quantity produced) was used as a proxy for market integration. For the sake of comparison and estimation niceties, we regressed smallholder farmer commercialization on selected regressors using OLS alongside QR on different conditional quantiles; θ = 0.05, 0.10, 0.20, 0.30, 0.40, 0.50, and 0.60, respectively.
Study Area
Sunflower is the principal economic crop farmed in the North–West Province, and the province is renowned for being South Africa's leading producer of sunflowers (Adeleke and Babalola, 2020).
With regard to provincial production, the 2018/2019 season followed a downward trend covering 175,000 ha (dryland 174,100 ha; irrigation 900 ha) with a total yield of 215,800 tons (dryland 214,000 tons; irrigation 1,800 tons) on 1.23 tons/ha (dryland 1.23 tons/ha; irrigation 2.00 tons/ha), contrasting production of the previous season—233,000 ha (dryland 231,900 ha; irrigation 1,100 ha) with a production of 1.40 tons/ha (dryland 1.40 tons/ha; irrigation 2.05 tons/ha) resulting in 326,200 tons (dryland 323,950 tons; irrigation 2,250 tons) (The Southern African Grain Laboratory NPC., 2020). It is mainly cultivated in open fields along roadsides in Mafikeng, the Provincial Capital, a location marked by dryland, little rainfall, and a mixture of abiotic stresses, with irrigation being used to augment production in some areas. Regrettably, we confined our samples to a single district (Ngaka Modiri Molema) housing the provincial capital for this study, partly due to logistical and financial bottlenecks. As a result, other comparable district municipalities in the province were not explored. This study used a cross-sectional survey conducted in Ngaka Modiri Molema District Municipality (NMMDM) consisting five local municipalities in North West Province, South Africa, from March to October 2020. The district was chosen for its large number of farmers and major contributions to the provincial sunflower seed exports. Between 2010 and 2016, the district contributed the highest proportion of sunflower seed exports, whereas other districts contributed only a marginal portion of the total (Department of Agriculture, Forestry, and Fisheries, 2019). Precisely, in 2014, the district accounted for approximately R = 2,000,000 in value of sunflower seed exports from the North–West province.
The district covers a total area of approximately 28,206 km2, and is home to the province capital (Mahikeng) with five local municipalities (Ditsobotla, Ramotshere Moiloa, Tswaing, Ratlou, and Mahikeng) comprising a population of 889,108 of which 2,726 are involved in grains and food crop production (Statistics South Africa, 2016). Note that when this survey was undertaken, exhaustive official records of the total number of households involved in sunflower production were lacking. Ngaka Modiri Molema District Municipality shares a boundary to the west with Dr. Ruth Segomotsi Mompati District, Bojanala Platinum District to the east, and Dr. Kenneth Kaunda District to the south. Furthermore, the district shares a strategic transnational boundary to the North with the Republic of Botswana [aptly a gateway to other regions of Southern African Development Countries (SADC), Ngaka Modiri Molema, 2021]. The district is semi-arid, and the municipal area is dry and flat to the West and a Bushveld in the East with an annual average rainfall of 300 and 700 mm. The leading economic driver within the district is Agriculture, while Art and Culture, Tourism, and Mining are limited to a specific area. Agriculture accounted for 4.9% of the district GDP, and in 2017, the sector recorded its highest annual growth of 25.5%. The most common crop grown within the district are maize, wheat, sunflower, vegetables, and fruits (Tlholoe, 2016).
Data Collection
Local (chiefs) authorities and the District Department of Agriculture and Rural Development, North West Province, South Africa, provided the list of 221 sunflower-producing households followed by semi-structured questionnaires designed and administered with the assistance of two locally trained enumerators who captured the data of the respondents through face-to-face interviews. Given the lack of proper farm records, this study depended on the recall of farmers for certain essential data. The questionnaire was designed with opened and closed-ended questions to capture quantitative data on human capital variables such as (household size, age of household head, education, years of farming), natural resource endowment (land size, tenure, and fertility), the input used (chemicals, fertilizers, labor), physical capital (truck ownership, farm equipment, and farm size), transaction cost (distance to market and agricultural information), as well as tons produced and quantity sold. To ensure content validity and reliability, the questionnaire was pre-tested before data were collected to minimize errors, redundant questions, improper terminology, and choice of word. First, we determine the sample size using Krejcie and Morgan, 1970 formula. Then households from the five local municipalities were grouped into strata, and a disproportionate stratified random sampling technique was employed to select respondents from each stratum. Unfortunately, due to incomplete data and irretrievable questionnaires, five respondents were omitted from the final study, reducing the sample to 177 respondents for the empirical analysis. Table 1 presents the sample size for each stratum of the five municipalities.
where:
n = sample size
X2 = Chi-square value at 95% confidence level with 1 degree of freedom (3.84)
N = population size
P = population proportion (0.96%)
ME = desired margin of error express as a proportion (0.05).
From Equation (2.3.1)
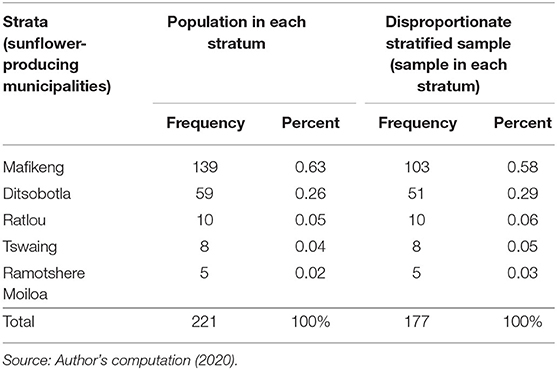
Table 1. Data collected according to the five local municipalities.
Descriptive Statistics
Table 2 reports the summary and descriptive statistics of the variables used in the empirical model. It also showed the definitions of the variables. As discussed in previous sections, the dependent variable was proxied using the quantity sold divided by the total quantity produced in tons. The results suggest that, on average, households sold 78 tons of sunflower. Considering the average sample output was 82 tons, this signifies that nearly all (95%) of the respondents sold their sunflower seeds. The percentage of sunflower sold was significantly higher than other reports of comparable crops such as wheat in Ethiopia, cowpea in Nigeria and Zambia, and common bean in Malawi (Mignouna et al., 2016; Gondwe et al., 2017; Abate et al., 2021). This indicates that even the least market-oriented households in our estimate cannot be classified as subsistence farmers. Instead, they are less-commercial farmers. This study used insights from prior empirical studies to proxy explanatory determinants of smallholder commercialization. The variable includes age, gender, land size, household size, marital status, market distance, land tenure system, access to credit, information, extension and grant, education, farming system, market outlet, transportation ownership, market distance, and livestock ownership.
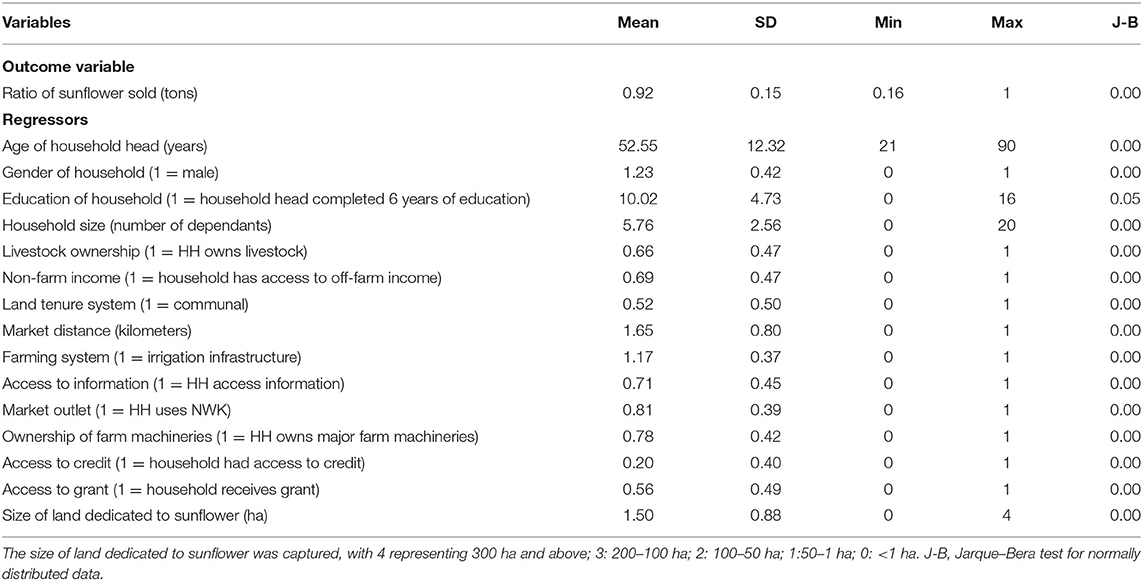
Table 2. Summary statistics of the variables used in the empirical analysis.
Age of household, for instance, is expected to increase farmer commercialization as older farmers tend to have gained more experience in the production and marketing of produce. Following Nkoana et al. (2020), older farmers have better market ties and acumen, which lessens variable and fixed transaction costs. The anticipated sign of the variable is, thus, positive.
The gender of household heads is a dummy variable that epitomizes market integration between male and female respondents. According to previous research, male households in Africa are more market-oriented because most female household heads are localized to trade, requiring less labor (Mathenge et al., 2010). Years of farming sunflower was a proxy for farming experience instead of farming years, as the focus is on sunflower production. Therefore, a positive sign is expected for this variable because households with several years of producing sunflower will likely have a better knowledge of the crop and frequent interactions with others, enabling proper maximization of the scarce resources of the household. Market outlets represent fixed and variable transaction costs. In contrast to informal market channels like farmgate, selling to formal market outlets is expected to increase the level of household commercialization. Formal market channels are associated with regulations that guarantee higher, stable, and uniform production prices, which are assumed to stimulate household market integration and, as a result, minimize variable transaction costs of sales (Ouma et al., 2010; Nxumalo et al., 2019).
This survey observed that most respondents use North West Kooperative (NWK), the district primary market outlet. This privately owned agribusiness enterprise guarantees a market for respondents regardless of quality, quantity, or production time and, hence, is predicted to have a beneficial impact on the sale proportion. The premise that households incur an associated marginal cost in locating prospective purchasers for their produce underpins the projected positive association for this variable. While fixed transaction cost, such as distance to a market outlet, is expected to have adverse multiplier effects on commercialization due to the severe impact of dilapidated road infrastructure and transportation cost inhibiting the proper movement of produce.
Based on Mbitsemunda and Karangwa (2017), market distance is a deterrent to commercialization since the longer the distance traveled, the lesser the desire of the household to participate in output markets.
Formal education attainment of the household was used to proxy human capital. Educational attainment is believed to enhance the perception of the farmers to interpret market dynamics and production competence. It could also ease the acquisition of skills that empowers farmers to generate non-farm income via formal or informal sector while decreasing agricultural operations of the households (Ouma et al., 2010). If the latter remark is valid in this study, then a negative coefficient would be expected for this variable. Household size corresponds to the number of dependents, which is expected to have stern impacts on household income since the larger the household, the more financial commitments it has, reducing the commercialization capacity of the farmer, on the one hand. On the other hand, active household members are indicative of household agricultural labor supply, which has a beneficial impact on household commercialization (Randela et al., 2008).
Information access is flagged as a fixed transaction cost, similar to market distance. Access to information is crucial in determining how commercialized a household is. Respondents were asked to define the sort of information (production or market information) they had access to, as well as the channels via which the information came, to see if access to information was a germane factor that might be used to predict the level of commercialization. Information snag stymies smallholder commercialization and production, raising transaction costs associated with searching, vetting, and negotiating. As Randela et al. (2008) explain, lack of price and markets information limits the level of markets participation of smallholder farmers. As a result, access to information was used to proxy market and production information. However, most of our sampled observations had sufficiently good access to information; therefore, an expected positive association is hypothesized for this variable. Availability of credit induces household access to procure technical inputs needed for cash crop production, and it helps lower market entry barriers, which boosts market participation. Conversely, credit inaccessibility is a snag for households since it raises transaction costs associated with input and output markets, deterring smallholder agricultural commercialization. Access to credit is a necessary prerequisite for capital accumulation. It helps farmers to meet their financial obligations induced by the farm production cycle, such as preparation of land, cultivation, harvesting, and marketing of crops, which is usually done over a long period where little to no income is earned, while input purchases, materials, and consumption expenditures are mostly made in cash (Nzomo and Muturi, 2014). Because most of the sampled observations had poor access to credit, this variable is expected to negatively influence smallholder commercialization.
Farm size under sunflower production, land tenure system, farming system (irrigated or dryland), cattle ownership, farm machinery, trailers, irrigation, and other equipment are all examples of physical assets used as proxies for wealth indicators. On the one hand, Poorer households frequently participate in low-return economic activities as a result of agricultural difficulties such as land, low yield returns, and seasonal production trends. On the other hand, unlike the indigent, affluent households often have better prospects of accessing profitable non-farm activities to generate increased income (Benali et al., 2018). The point is ex ante wealth endowment enhances agricultural commercialization by giving greater flexibility to wealthier farmers to choose from varieties of options than economically disadvantaged households. The ubiquitous possession of wealth inter ala by households is perchance with positive impacts on commercialization by reducing the vulnerability of farmers to production and market shock factors. The size of sunflower holding is a possible factor with significant impacts on commercialization. Households with enormous sunflower-producing areas may have better access to sunflower input and output markets, as well as associated innovations and information. To test this association, we use hectares dedicated to sunflower farming. A curvilinear relationship is hypothesized for the farming system; farmers using irrigation infrastructure are expected to have higher commercialization ratios than farmers operating on the dryland system. Despite the widespread drought hampering crop output in the research area, the descriptive statistics suggest that most respondents lack access to irrigation infrastructure and rely on rainfed agriculture. This condition reduces crop output and deters poorer households without access to irrigation from commercialization, forcing them to embrace steeper expected returns and higher income risks. Drought is, in reality, an inveterate menace to agricultural production in South Africa, and it is seldom infrequent for drought not to occur every year in the study area. This lucidly reflects the consequence of drought, and lack of irrigation infrastructure in the dryland regions of Southern Africa are apparent in losses of crops to diseases, weeds, pests, and insect infestation (Twomlow et al., 2015). A parallel relationship is expected for land tenure systems. Land rights play a critical role in agricultural commercialization that cannot be understated. This explicates why some farmers with land security (title deeds) might sell or lease their land to meet income needs and overcome market entry barriers. Sadly, only a few respondents possessed land rights, and the rest relied on community landholding arrangements. Land ownership is regarded as an essential driver of rural household income. However, most farmers in South Africa lack land rights and farm on communal land projects, characterized by many households sharing a single plot of land (Baloyi, 2010). This affects market factors and stifles commercialization by limiting farmers' access to high-value national and international markets. Non-farm income is another important factor linked to agricultural commercialization. Non-agricultural income enables households to cope with ex-post income shocks caused by crop failure and livestock losses. By contrast, if credit markets are unavailable or narrow, but non-farm earnings are readily available, off-farm income can be a valuable channel to lessen the exerted effects of operating capital pressure to procure necessary variable agricultural inputs, such as seeds, equipment, fertilizers, and labor, as well as capital upgrades. However, commercialization is hampered, if off-farm income leads to non-farm diversification (Barrett et al., 2001; Alene et al., 2008; Omiti et al., 2009).
Result and Discussion
We now turn to interpretations of the multivariate quantile analysis for effects of predictors on the commercialization variable. As discussed in previous sections, this article provides more detailed insights into the impact of variables across the commercialization continuum, from subsistence to fully commercial households. Moreover, in contrast to the OLS regression, QR offers the latitude to estimate the complete distribution of the outcome variable based on values of regressors. While QR is regarded as an annex of OLS, it is advantageous when OLS assumptions, such as normality, linearity, and equal variance (homoscedasticity), are violated. Thus, we performed Jarque–Bera and Shapiro–Wilk W tests on normally distributed data, and the results suggest that the hypothesis of normally distributed data can be repudiated for all covariates (see Table 2). To substantiate the application of the quantile regression model, an unequal variance (heteroscedasticity) test was conducted; we observed that the Breusch–Pagan test statistic is substantially different from zero–Chi2(14) = 52.18, prob > Chi2 = 0.0000. Therefore, the residuals suffer from heteroscedasticity, and we are justified in the use of QR since the null hypothesis of equal variance is rejected in favor of the alternate hypothesis (presence of heteroscedasticity in the datasets).
The empirical quantile regression offers the medium for heterogeneous impacts; while some covariates influence the response variable at various quantiles, their effect changes and varies across the continuum. Thus, to properly assess whether changes in magnitudes of estimated impacts are significantly different across quantiles, we tested for equivalence of coefficients. We find that most estimates distinctly oppose the equality of predicted coefficients for three percentiles of the continuum. The F-values reject null hypotheses of equal slopes. Note each coefficient measures changes in ratios of sunflower sold resulting from a unit increase in continuous regressors, such as household size, or changes in dummy regressors from 0 to 1 (gender), while fixing other regressors. To aid interpretation of results, we invoke Joao Pedro Azevedo's graphical routine in STATA to display how the magnitude of each regressor varies across quantiles, in contrast to OLS fixed effects as indicated in Figure 2. Each panel in Figure 2 represents a regressor in the analysis, and vertical axes represent the magnitude of coefficients while horizontal axes represent quantiles. The horizontal solid dash line represents OLS coefficients. Therefore, they do not vary across locations of x-axes and are within 95% confidence interval (dotted lines). The solid grey polygonal line displays QR coefficients and confidence intervals. The QR coefficients are plotted as lines that differ across quantiles with confidence bands. For example, it can be inferred that the effect of regressors is significantly different from OLS estimates, where QR coefficients are outside OLS confidence bands (indicated by the + symbol in Table 3). We estimated seven distinct quantiles, ranging from 0.05th to 60th quantiles. We also consider that commercial point is attained at the 60th quantile because our observations contain a lot of 100 percent sales. Thus, it will be inconsequential to estimate the model at higher quantiles. For policy implications, households at 60th to 95th quantiles sold all their sunflower produce. Similar to mean effects, the median (q = 0.50) estimates the central tendency of a dataset by comparing the statistical significance and size of median coefficients with conditional quantiles, permitting distinct impacts of regressors across the commercialization continuum (explained variable).
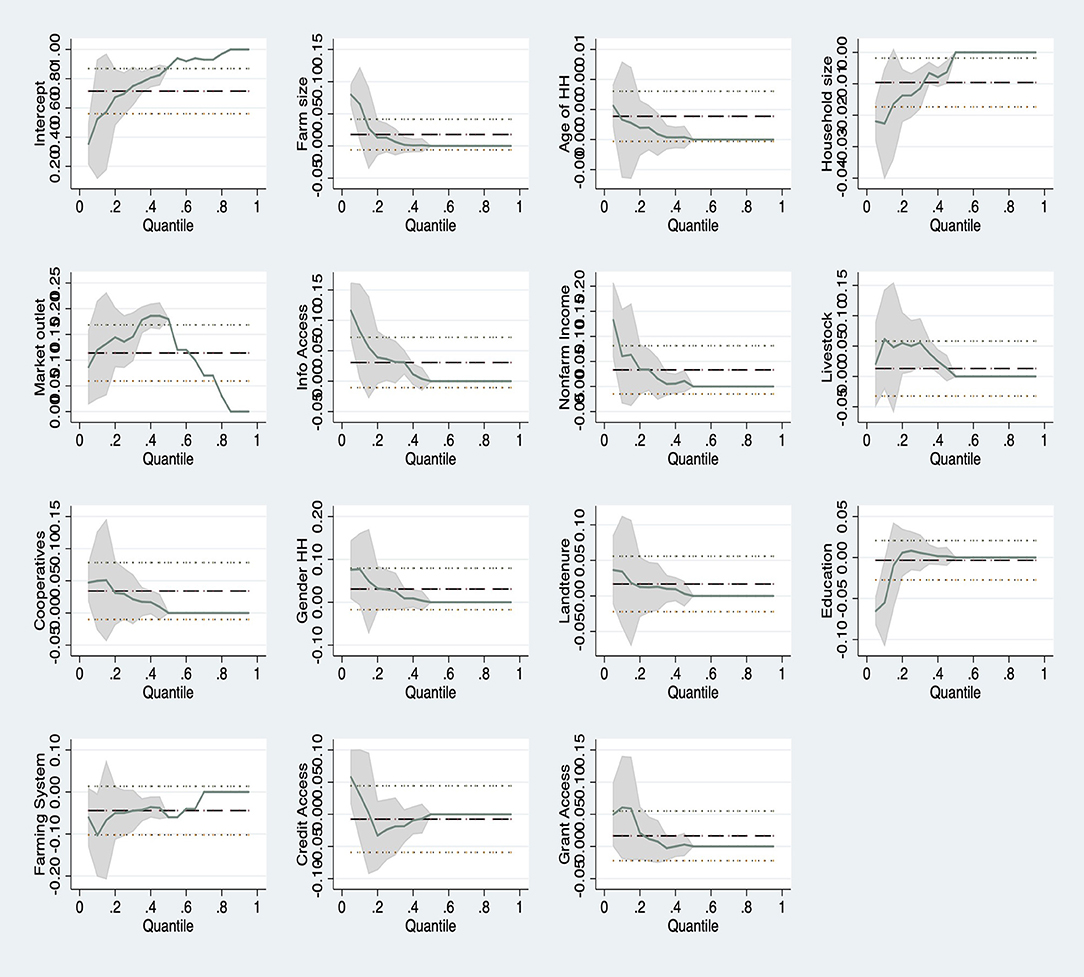
Figure 2. Joao Pedro Azevedo's graphical routine in STATA displaying OLS and QR coefficients for different predictors on sunflower commercialization over conditional quantiles. Horizontal lines indicate OLS estimates with 95% confidence bands.
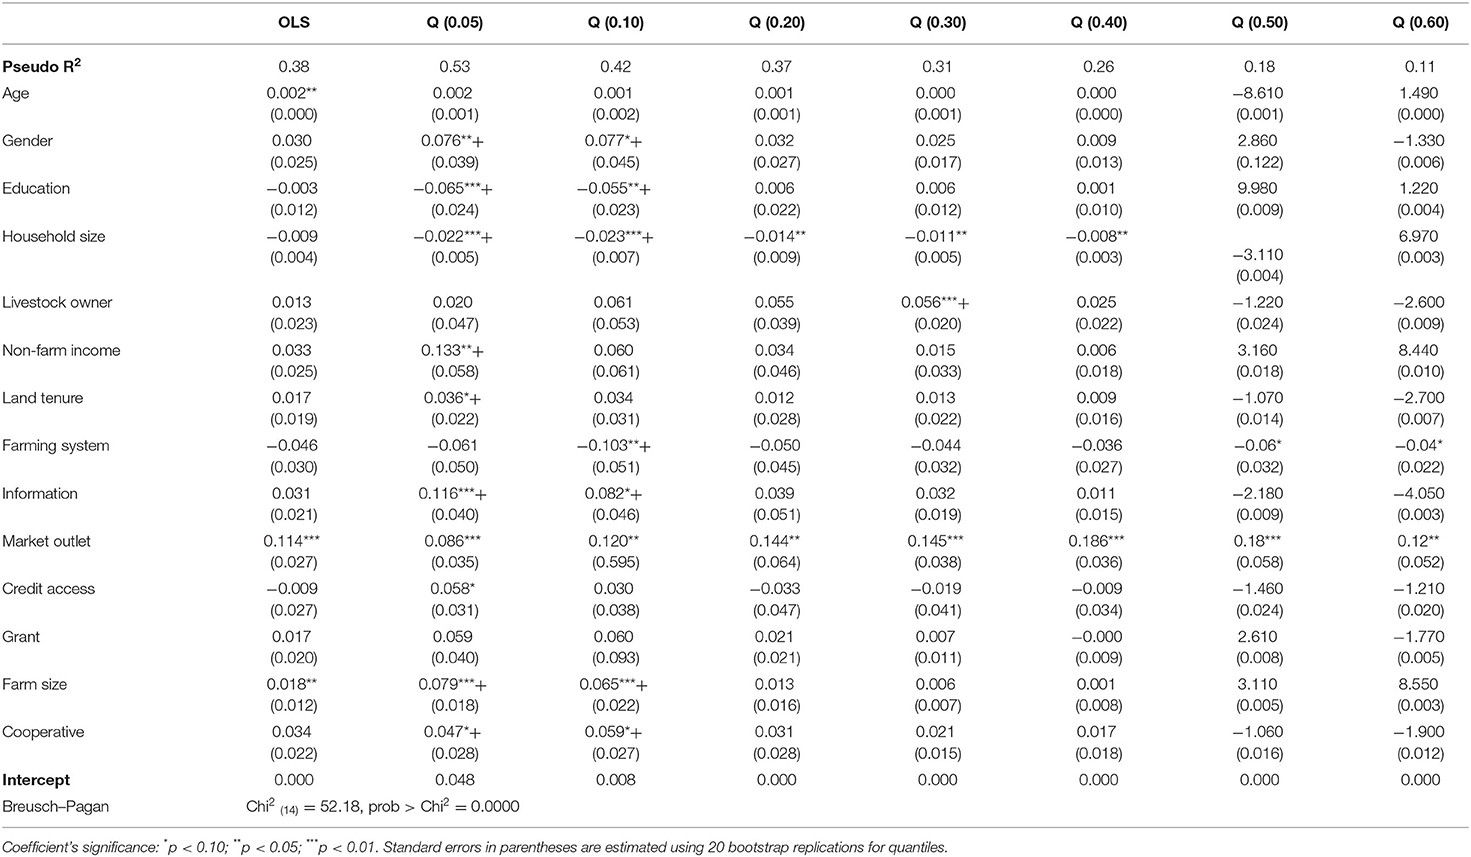
Table 3. Effects of covariates using OLS and QR estimate at various quantiles.
It is noteworthy to state that, to keep the volume of the result to a minimum, we narrowed our discussions to selected covariates. The intercept plot in the first panel of Figure 2 is self-referential. It depicts the estimated conditional quantile function of households selling lower sunflower output at lower quantiles of the commercialization continuum than households at higher quantiles. The graph shows a positive upward slope line over the conditional quantiles, in contrast to the lower quantiles, indicating a positive impact in the upper quantiles. One point of QR, as seen in panel 5, is that certain covariates with significant influence did not exhibit any inversion signs across the quantiles, i.e., the regressors did not have a positive impact at some quantiles while having a negative effect at others. The OLS estimate in Table 3 reveals, for example, that the average quantity of sunflower sold by respondents is uniquely associated with the age of the household head, market outlet, and farm size allocated to sunflower production, while other factors are held constant. The OLS coefficient for the market outlet, which is a variable of interest, is positive, indicating that increase in the use of market outlets will, on average, result in an 11.4% rise in the ratio of output sold, while other regressors remain constant.
Quantile regression plot indicates that the estimated coefficient of market outlet is positive as well, although with varying impact across the conditional distribution of the response variable, as suggested by the equivalence test F(2,157) = 3.24, p < 0.043. When q = 50% quantile, the market outlet appears to have a minimal effect on the commercialization continuum. The coefficient of this variable tends to increase for less commercial sunflower farmers in the lower quantiles. Another point worth highlighting is that when the quantile increases, the estimated impacts decrease, implying that the magnitude is greater for less commercial households. Evidently, the QR findings suggest that the presence of formal market outlets such as NWK (main market outlet) is indeed a significant contributing factor to the success of fast-transitioning households (from subsistence to commercial). Market outlets are characterized by several driving factors such as geographical proximities, structures, i.e., power asymmetry, expertise of the producer, adherence to quality standards, and legislations (Dolan and Humphrey, 2000; Blandon et al., 2009). Comprehensive empirical studies on smallholder farmers in SSA provide indications of bottlenecks in accessing formal marketing outlets (Martey et al., 2012; Arinloye et al., 2015). By contrast, if access is not hampered, market outlets influence shares of sale outputs, as in our case. Arinloye et al. (2015), Mathagu et al. (2018), and Kassaw et al. (2019) found consistent evidence that formal market outlets positively influence smallholder market participation and sales proportions. A farmer weighs the expected utility returns against the associated expenditure, entry barrier, and other transaction costs when deciding whether to engage in a given market. The decreasing effect of this predictor at the upper quantile of the continuum is presumably due to a lesser likelihood of farmers increasing their sales ratio as they progressively attain a full commercial state.
The remaining regressors have minor impacts on certain quantiles while exerting no effect on others. This evinces discernable cluster effects, given that most of predictors appear to affect lower quantiles of the continuum. More specifically, the magnitude of these regressors is skewed toward the lower quantiles, i.e., less commercial households, apart from the farm system variable, which ignores the clustering pattern, impacting q10, q50, and q60, respectively.
The following regressors are discussed in order of statistical significance quantiles. Contrary to OLS fix effects, household size is statistically significant but negatively influenced sale portions from 0.05th to 40th quantiles. As quantile increases, the scale of the variable diminishes, but a statistically insignificant spike emerges in the middle of the conditional outcome distribution (at the 50 quantiles). Importantly, the equivalence test is statistically significant—F(2,157) = 2.66, p < 0.073, evidencing the heterogeneous impact of this regressor on the outcome variable. The negative impact is premised on the assumption that as the number of dependents increases, households at the lower part of the commercialization continuum incur limited returns on sale outputs. Analogously, Kassaw et al. (2019) and Abate et al. (2021) find that the larger the household size, the less commercially oriented tomato farmers are in the South Gonder zone, Ethiopia. Insofar, the QR coefficient in panel 4 sloped downward from the lowest quantiles to the 40th before stabilizing, illustrating that households in this category are less market oriented, possibly owing to financial constraints. In this context, a farmer may be pushed to redistribute scarce farm income to other household demands and responsibilities, inhibiting their production and, as a result, lowering farm outputs. Compared with the average estimate, farm size has a non-monotonic impact across the conditional quantiles, with a significant influence at the lower quantile of the response distribution. The QR coefficient of this variable displays a positive upward movement from the lowest quantile up until the 50th quantiles well over the OLS confidence interval, as seen in Panel 4 of Figure 2. The null hypothesis of equal slopes is likewise rejected by the Wald test of equality F(2,157) = 4.00, p < 0.020, confirming the differing impact of farm size on the percentage of sales volume. In certain instances, this explains that the desire to increase hectares under sunflower production indicates commercial orientation in the lower 40th quantiles. It also suggests that expansion aspirations are more heightened for less commercial farmers. At first glance, this may appear counterintuitive that the positive effects only emerged at lower quantiles. Nevertheless, we can advance some tentative interpretations. To begin with, farmers at lower quantiles are more likely to be driven by expansion plans due to inherent effects on quantities produced, therefore raising sale outputs. While as a farmer reaches full commercial status, the urge to extend the area under cultivation diminishes since differences generated would be negligible, mirroring diminishing marginal returns. Abate et al. (2021), Aku et al. (2018) and Radchenko and Corral's (2018) also find that larger farm holdings favor less commercial households. The farming system variable impacts both lower and upper quantiles. The regressor was used to proxy whether a farmer owns irrigation infrastructure or depends on rainfed agriculture. While the association between farming systems and share of output sold is statistically significant at 10th, 50th, and 60th quantiles, the impact is negative and minuscule across quantiles, meaning the regressor is marginally sensitive to commercialization. Severe crop failure, increased biodiversity loss, and land degradation experienced in the district and other dryland regions due to agricultural intensification explain the negative association between the farming system and the share of sale outputs. The effect is visible across the continuum (less and full commercial households) with and without irrigation infrastructures. This is also reflected in the equivalence test F(2,157) = 0.34, p < 0.713 indicating a homogenous effect. Twomlow et al. (2015) bullishly point that agricultural intensification void of appropriate exogenous input factors often results in low crop yields and farmland degeneration through the synthesis of crop nutrient absorption and weak soil conservation.
Household education attainment, like most other predictors, is insignificant in OLS but with a negative statistical impact in QR. Table 3 shows that the magnitude of this variable manifested at 0.05th and 0.10th quantiles (the least commercial households) but with an insignificant reversal effect from 0.20th quantiles. Ironically, farmers at this level—especially those engaging in cash crop production (sunflower), see farming as a means rather than an end, likely due to the wide range of constraints that are associated with emerging households. Given the hypothesized effect in summary statistics, it is reasonable to establish that the educational attainment of least commercial households stimulates non-farming activities, decreasing the share of their sale outputs. The equivalence test result F(2,157) = 4.00, p < 0.026 explicitly contradicts the homogeneity of estimated coefficients, indicating that the impact of education differs across quantiles of the conditional response distribution.
As for the gender of the household head, the equality test F(2,157) = 1.95, p < 0.146 fails to account for the heterogeneity of coefficients, with a pronounced decreasing significant positive effect at the lower quartiles. The findings demonstrate that male-headed households are more commercialized than female-headed households, suggesting a significant impact of gender inequalities at the lower end of the commercialization variable. Again, this is expected, considering the high male dominance in the district sunflower sector. Abdullah et al. (2019), studying the determinants of commercialization and its welfare impact, similarly finds that male rice farmers had the highest commercialization ratios, highlighting gender inequalities at household levels. This corroborates the findings of Yaméogo et al. (2018) that male farmers have a higher probability of participating in markets than female household heads, mainly due to inaccessibility to traditional lowlands. On the flip side, gender inequalities in farming operations evince the challenge of a diver, including limited access to farm inputs and low outputs returns, land rights restrictions, and gender-based commodity market anomalies faced by female household heads (Rodgers and Akram-Lodhi, 2019). At the root of these drawbacks are unfair power structures, gendered norms, traditions, and a relatively static gender severance of labor found at household levels, which impedes their agricultural market participation. On the other hand, it is reasonable to infer that female-headed households are customarily weighed down by more domestic chores, causing them to allocate less time to farm operations, which is consistent with a related study by Lekunze et al. (2011), acknowledging gender disparity in provincial sunflower production. As a result, closing gender gaps will require a shift in power structures and dynamics.
Last, yet importantly, is the proxy for production and market information access. As quantile increases, the variable appears to only exert a positive decreasing significant impact at the 0.05th and 10th quantiles. The variable underscores the importance of information (production and market information) for less commercial farmers as it influences the proportion of their sales outputs. Obtaining production and market information displays a desire to improve and strengthen their farming operations, leading to higher sales. The equivalence results verified the varied impact F(2,157) = 4.43, p < 0.013, revealing that the magnitudes differ across the conditional-response distribution. However, as households progress into a full commercial state, they are more likely to have acquired both experience and expertise from advisory services, so the residual effects diminish with more information and advice until they are entirely waned (Kostov and Davidova, 2013).
Conclusions and Recommendations
In contemporary economic assessment, agricultural commercialization is assigned a core role in rural development and wealth creation. Empirical evidence suggests that commercialization is rapidly being advocated across numerous African countries seeking to achieve the United Nations food security goal through smallholder farming systems. Using 177 observations from a single district in North West Province, South Africa, this paper empirically investigates the auxiliary benefit of the quantile regression technique as a strategic policy instrument to examine determinants and variations of agricultural commercialization. The principal finding of this study is that the degree of smallholder commercialization differs significantly across households in the study area. In addition, sunflower commercialization, at mean, is uniquely correlated with hectares cultivated, household head, and market outlet among samples. The emphasis of ordinary least square estimates is whether variation counts on average. However, this supposition may inaccurately depict the response distribution. For this reason, bootstrap QR was implemented to tackle this limitation. Besides, QR permits for descriptive assessment of covariates across the outcome distribution, resulting in heterogeneous impact. For instance, certain regressors exert different effects at various quantiles; their impact differs for different households, as suggested by equivalence tests. These insights can help policymakers and stakeholders design inclusive measures for rural sunflower farmers to increase commercialization. Typically, OLS and other models used in market participation literature are unlikely to offer this insight. The empirical findings confirm the essentiality to look beyond central tendency, location, and direction in which regressors are associated with the commercialization variable to understand the heterogeneous influence at household levels.
The findings indicate that heterogeneity in sunflower commercialization cannot be disregarded for the case of household size, market outlet, hectares cultivated, education, access to information, and gender. Market outlet and farming system variables appear to have maintained their significant impact, although with varying magnitudes across all quantiles. This does not negate the significance of the remaining covariates. The influence of the market outlet is positive, as evidenced by the QR result, exhibiting a sharp increase from lower quantiles of the conditional response distribution but a diminishing magnitude from the median quantile. The farming system variable negatively impacted lower and upper quantiles with homogeneously minuscule effects. While irrigation infrastructure is vital, we advised that agricultural intensification without appropriate complementary input factors would enervate irrigation outcomes. Finally, the remaining regressors showed heterogenic clustering patterns. Their effects centered primarily at lower quantiles of the commercialization distribution (less commercial households), indicating that less commercial households bear the full impact of these regressors, not vice versa. According to QR findings, male household heads are more market oriented than female heads, especially at lower quantiles. Gender imbalance hinders the competitiveness and contributions to the agricultural sector and the broader rural economy and social development goals of women. It is surprising that despite being ranked fifth on the Sustainable Development Goals and receiving a plethora of policy plans, it seems that attention to rural agrarian gender disparities is often casual and laissez-faire rather than being taken as a critical element of sustainable agriculture. Rodgers and Akram-Lodhi (2019) tie the marginalization of women to the complexities of scaling the ladder of high-value crops owing to farmland ownership, size, quality, and other systemic social barriers. Consequently, increasing sunflower commercialization among female household heads in the study area will require intervention that addresses systemic societal barriers impeding their participation.
To recap, the findings of this study show that exploring the ordinary least and quantile regression approach presents distinct pictures of the outcome variable and set of predictors. Furthermore, this method enables the identification of specific areas where gaps occur, resulting in valuable insights on how to tailor policies to minimize these gaps. The findings also suggest that policymakers need to recognize the existence of heterogeneity in commercialization and be wary of using a blanket or conventional macro policy approach, which, even if effective, is unlikely to achieve overarching welfare and behavioral responses across targeted households. Of course, a no victor, no vanquish approach would entail dismantling other microscale and mesoscale barriers. Those in policy space working to promote smallholder commercialization should be cognizant of potential benefits of efficacious sunflower promotion in SA and other SSA nations. Given that this study only looked at cross-sectional data from a single district municipality, a primary assignment for future studies may be to understand how viable commercialization frameworks between smallholders and market outlets have been structured so that their successful components can be mirrored and embedded more expansively into commercialization initiatives. This can follow a panel data approach involving the remaining districts or provinces. Next, in-depth studies are needed to evaluate the welfare response to agricultural development initiatives on women's empowerment in the sunflower sector. Finally, this study and the inferences reached should be viewed in light of its limitations.
Data Availability Statement
The raw data supporting the conclusions of this article will be made available by the authors, without undue reservation.
Ethics Statement
The studies involving human participants were reviewed and approved by College of Agriculture and Environmental Sciences Health Research Ethics Committee (reference number 2020/CAES_HREC/006), University of South Africa. The patients/participants provided their written informed consent to participate in this study.
Author Contributions
EA was the principal researcher for the study and took the research from inception, including fieldwork, data analysis/management, and drafting of the manuscript. ST and OO provided expert proofing and reviews of the manuscript. All authors contributed to the article and approved the submitted version.
Conflict of Interest
The authors declare that the research was conducted in the absence of any commercial or financial relationships that could be construed as a potential conflict of interest.
Publisher's Note
All claims expressed in this article are solely those of the authors and do not necessarily represent those of their affiliated organizations, or those of the publisher, the editors and the reviewers. Any product that may be evaluated in this article, or claim that may be made by its manufacturer, is not guaranteed or endorsed by the publisher.
Acknowledgments
The authors would like to thank UNISA for funding, as well as the agricultural officials (Matshidiso Thobatsi) and research participants for their cooperation.
References
Abate, D., Mitiku, F., and Negash, R. (2021). Commercialization level and determinants of market participation of smallholder wheat farmers in northern Ethiopia. Afr. J. Sci. Technol. Innov. Dev. 13, 1844854. doi: 10.1080/20421338.2020.1844854
Abdullah, Rabbi, F., Ahamad, R., Ali, S., Chandio, A. A., Ahmad, W., et al. (2019). Determinants of commercialization and its impact on the welfare of smallholder rice farmers by using Heckman's two-stage approach. J. Saudi Soc. Agric. Sci. 18, 224–233. doi: 10.1016/j.jssas.2017.06.001
Abu, B. M., Osei-Asare, Y. B., and Wayo, S. (2014). Market participation of smallholder maize farmers in the upper west region of Ghana. Afr. J. Agric. Res. 9, 2427–2435. doi: 10.5897/AJAR2014.8545
Adeleke, B. S., and Babalola, O. O. (2020). Oilseed crop sunflower (Helianthus annuus) as a source of food: nutritional and health benefits. Food Sci. Nutr. 8, 4666–4684. doi: 10.1002/fsn3.1783
Adeoti, A. (2014). Determinants of market participation among maize producers in Oyo State, Nigeria. BJEMT 4, 1115–1127. doi: 10.9734/BJEMT/2014/7826
AgriBusiness10 (2020). The Sunflower Oil Market in the Africa. Think AgriBusiness. Available online at: http://thinkagribusiness.com/2020/06/24/the-sunflower-oil-market-in-the-africa/ (accessed February 2, 2021).
Aku, A., Mshenga, P., Afari-Sefa, V., Ochieng, J., and Yildiz, F. (2018). Effect of market access provided by farmer organizations on smallholder vegetable farmer's income in Tanzania. Cogent Food Agric. 4, 1560596. doi: 10.1080/23311932.2018.1560596
Alene, A. D., Manyong, V. M., Omanya, G., Mignouna, H. D., Bokanga, M., and Odhiambo, G. (2008). Smallholder market participation under transactions costs: maize supply and fertilizer demand in Kenya. Food Policy 33, 318–328. doi: 10.1016/j.foodpol.2007.12.001
Arinloye, D.-D. A. A., Pascucci, S., Linnemann, A. R., Coulibaly, O. N., Hagelaar, G., and Omta, O. (2015). Marketing channel selection by smallholder farmers. J. Food Prod. Market. 21, 337–357. doi: 10.1080/10454446.2013.856052
Aristei, D., and Pieroni, L. (2008). A double-hurdle approach to modelling tobacco consumption in Italy. Appl. Econ. 40, 2463–2476. doi: 10.1080/00036840600970229
Baloyi, J. K. (2010). An analysis of constraints facing smallholder farmers in the Agribusiness value chain: A case study of farmers in the Limpopo Province (MSc Dissertation). University of Pretoria, South Africa. Available online at: https://repository.up.ac.za/bitstream/handle/2263/29038/dissertation.pdf?sequence=1&isAllowed=y
Barrett, C. B. (2008). Smallholder market participation: concepts and evidence from eastern and southern Africa. Food Policy 33, 299–317. doi: 10.1016/j.foodpol.2007.10.005
Barrett, C. B., Reardon, T., and Webb, P. (2001). Nonfarm income diversification and household livelihood strategies in rural Africa: concepts, dynamics, and policy implications. Food Policy 26, 315–331. doi: 10.1016/S0306-9192(01)00014-8
Benali, M., Brümmer, B., and Afari-Sefa, V. (2018). Smallholder participation in vegetable exports and age-disaggregated labor allocation in Northern Tanzania. Agric. Econ. 49, 549–562. doi: 10.1111/agec.12441
Blandon, J., Henson, S., and Islam, T. (2009). Marketing preferences of small-scale farmers in the context of new agrifood systems: a stated choice model. Agribusiness 25, 251–267. doi: 10.1002/agr.20195
Burke, W. J., Myers, R. J., and Jayne, T. S. (2015). A triple-hurdle model of production and market participation in Kenya's dairy market. Amer. J. Agric. Econ. 97, 1227–1246. doi: 10.1093/ajae/aav009
Carletto, C., Corral, P., and Guelfi, A. (2017). Agricultural commercialization and nutrition revisited: empirical evidence from three African countries. Food Policy 67, 106–118. doi: 10.1016/j.foodpol.2016.09.020
Cazzuffi, C., McKay, A., and Perge, E. (2018). The Impact of Commercialization of Rice on Household Welfare in Rural Vietnam, 130th Edn. WIDER Working Paper. UNU-WIDER. doi: 10.35188/UNU-WIDER/2018/572-5
Coad, A., and Rao, R. (2008). Innovation and firm growth in high-tech sectors: a quantile regression approach. Res. Policy 37, 633–648. doi: 10.1016/j.respol.2008.01.003
Davis, J. R. (2006). How can the poor benefit from the growing markets for high value agricultural products? SSRN J. doi: 10.2139/ssrn.944027
Department of Agriculture, Forestry, and Fisheries (2019). A Profile of the South African Sunflower Market Value Chain. South Africa.
Dlamini, S. I., and Huang, W.-C. (2019). A double hurdle estimation of sales decisions by smallholder beef cattle farmers in Eswatini. Sustainability 11, 5185. doi: 10.3390/su11195185
Dlamini-Mazibuko, B. P. (2019). Factors affecting the choice of marketing outlet selection strategies by smallholder farmers in Swaziland. Afr. J. Sci. Technol. Innov. Dev. 11, 569–577. doi: 10.1080/20421338.2018.1554323
Dolan, C., and Humphrey, J. (2000). Governance and trade in fresh vegetables: the impact of UK supermarkets on the African horticulture industry. J. Dev. Stud. 37, 147–176. doi: 10.1080/713600072
Eakins, J. (2016). An application of the double hurdle model to petrol and diesel household expenditures in Ireland. Transp. Policy 47, 84–93. doi: 10.1016/j.tranpol.2016.01.005
Ferdi, M., and Gerhard, V. D. B. (2015). The Future of Sunflower Production in South Africa. Avalable online at: https://www.grainsa.co.za/the-future-of-sunflower-production-in-south-africa (accessed February 18, 2021).
Fredriksson, L., Davidova, S., and Bailey, A. (2010). WP Leader for this Deliverable Partners Involved Document Status: Due Date of deliverable: Date: 40.
Gondwe, T., Tegbaru, A., Oladeji, A. E., Khonje, M., Manda, J., and Gaya, H. (2017). Correlates and consequences of women's participation in the cowpea value chain in eastern Zambia. Agrekon 56, 263–273. doi: 10.1080/03031853.2017.1317643
Govereh, J., Jayne, T. S., and Nyoro, J. (1999). Smallholder Commercialization, Interlinked Markets, and Food Crop Productivity: Cross-Country Evidence in Eastern and Southern Africa. Work Pap Dep Agric Econ Dep Econ Michigan State Univ.
Hlatshwayo, S. I., Ngidi, M., Ojo, T., Modi, A. T., Mabhaudhi, T., and Slotow, R. (2021). A typology of the level of market participation among smallholder farmers in South Africa: Limpopo and Mpumalanga Provinces. Sustainability 13, 7699. doi: 10.3390/su13147699
Jaleta, M., Gebremedhin, B., and Hoekstra, D. (2009). Smallholder commercialization: processes, determinants and impact, in Improving Productivity and Market Success of Ethiopian Farmers Improving Market Opportunities. Addis Ababa: International Livestock Research Institute.
Jayne, T., Mukumbu, M., Duncan, J., Staatz, J., Howard, J., Lundberg, M., et al. (1996). Trends in Real Food Prices in Six Sub-Saharan African Countries. AMEX International, Inc., SD Publication Series Office of Sustainable Development Bureau for Africa.
Kassaw, H. M., Birhane, Z., Alemayehu, G., and Yildiz, F. (2019). Determinants of market outlet choice decision of tomato producers in Fogera woreda, South Gonder zone, Ethiopia. Cogent Food Agric. 5, 1709394. doi: 10.1080/23311932.2019.1709394
Kiwanuka, R. N. L., and Machethe, C. (2016). Determinants of smallholder farmers' participation in Zambian dairy sector's interlocked contractual arrangements. J. Sustain. Dev. 9, 230. doi: 10.5539/jsd.v9n2p230
Koenker, R. (2005). Quantile Regression, Econometric Society Monographs. Cambridge; New York, NY: Cambridge University Press.
Koenker, R., and Bassett, G. (1978). Regression quantiles. Econometrica 46, 33. doi: 10.2307/1913643
Kondo, E. (2019). Market participation intensity effect on productivity of smallholder cowpea farmers: evidence from the Northern Region of Ghana. RAAE 22, 14–23. doi: 10.15414/raae.2019.22.01.14-23
Kostov, P., and Davidova, S. (2013). A quantile regression analysis of the effect of farmers' attitudes and perceptions on market participation. J. Agric. Econ. 64, 112–132. doi: 10.1111/j.1477-9552.2012.00366.x
Krejcie, R. V., and Morgan, D. W. (1970). Determining sample size for research activities. Educ. Psychol. Meas. 30, 607–610. doi: 10.1177/001316447003000308
Kyaw, N., Ahn, S., and Lee, S. (2018). Analysis of the factors influencing market participation among smallholder rice farmers in Magway Region, Central Dry Zone of Myanmar. Sustainability 10, 4441. doi: 10.3390/su10124441
Lekunze, J., Antwi, M. A., and Oladele, O. I. (2011). Socio-economic constraints to sunflower production in Bojanala farming community of the North-West province, South Africa. Life Sci. J. 8, 502–508. Available online at: http://www.lifesciencesite.com/lsj/life0802/67_5305life0802_502_506.pdf
Lifeyo, Y. (2017). Market Participation of Smallholder Common Bean Producers in Malawi. Working Paper, Lilongwe University of Agriculture and Natural Resources, Bunda College, Malawi.
Louw, M. (2020). Sunflower Production, South Africa. Available online at: https://southafrica.co.za/sunflower-production.html (accessed February 18, 2021).
Markowitz, C. (2018). Driving a Sunflower Value Chain in Malawi: Challenges and Opportunities. South African Institute of International Affairs.
Martey, E., Annin, K., Wiredu, A. N., and Attoh, C. (2012). Does access to market information determine the choice of marketing channel among smallholder Yam farmers in the Brong Ahafo Region of Ghana? A multinomial logit regression analysis. J. Econ. Sustain. Dev. 3, 18–28. doi: 10.7176/JESD
Mathagu, H., Belete, A., Oluwatayo, I., and Nesamvuni, A. (2018). Market Participation of Smallholder Sunflower Farmers in Sekhukhune District of Limpopo Province, South Africa. Mini-Disertation, Master of Science, Faculty of Science and Agriculture, University of Limpopo. doi: 10.19080/ARTOAJ.2018.15.555938
Mathenge, M., Place, F., Olwande, J., and Mithoefer, D. (2010). Participation in Agricultural Markets among the Poor and Marginalized: Analysis of Factors Influencing Participation and Impacts on Income and Poverty in Kenya. Tegemeo Institute of Agricultural Policy and Development.
Mbitsemunda, J. P. K., and Karangwa, A. (2017). Analysis of factors influencing market participation of smallholder bean farmers in Nyanza District of Southern Province, Rwanda. J. Agric. Sci. 9, 99. doi: 10.5539/jas.v9n11p99
Mignouna, D. B., Abdoulaye, T., Akinola, A. A., Kamara, A. Y., and Oluoch, M. (2016). Understanding market participation choices and decision of maize and cowpea farmers in Northern Nigeria. Tropicultura 34, 26–39. Available online at: https://hdl.handle.net/20.500.11766/6869 (accessed October 3, 2021).
Mmbengwa, V. M., Khoza, T. M., Rambau, K., and Rakuambo, J. (2018). Assessment of the participation of smallholder farmers in agro-processing industries of Gauteng Province. OIDA Int. J. Sustain. Dev. 11, 11–14. Available online at: https://ssrn.com/abstract=3149148
Muricho, G., Kassie, M., and Obare, G. (2015). “Determinants of Market Participation Regimes among Smallholder Maize Producers in Kenya,” in International Conference of Agricultural Economists (Italy).
Ngaka Modiri Molema. (2021). Profile and Analysis: Ngaka Modiri Molema District. District Development Model. Governance and Traditional Affairs of South Africa.
Nkoana, M. A., Belete, A., and Hlongwane, J. (2020). Willingness to pay for climate change adaptation strategies among small-scale crop livestock farmers in Limpopo province, South Africa. J. Hum. Ecol. 70, 36–50. doi: 10.31901/24566608.2020/70.1-3.3197
Nwafor, C. U. (2015). Prospects of Commercialization Among Small Scale Potato Farmers in Bizana. Disssertation, Central University of Rechnology (CUT), South Africa.
Nxumalo, K. K. S., Samuel, O. O., Antwi, M. A., and Sylvia, T. S. (2019). Determinants of market channel choice utilised by maize and sunflower farmers in the North West province, South Africa. Cogent Soc. Sci. 5, 19. doi: 10.1080/23311886.2019.1678451
Nzomo, M., and Muturi, W. (2014). The effect of types of agricultural credit programmes on productivity of small scale farming businesses in Kenya: a survey of Kimilili Bungoma Sub County. J. Econ. Sustain. Dev. 5, 150–160. Available online at: https://www.iiste.org/Journals/index.php/JEDS/article/view/16767
Omiti, J. M., Otieno, D. J., Nyanamba, T. O., and McCullough, E. (2009). Factors influencing the intensity of market participation by smallholder farmers: a case study of rural and peri-urban areas of Kenya. Afr. J. Agric. Rur. Econ. 3, 57–82.
Ouma, E., Jagwe, J., Obare, G. A., and Abele, S. (2010). Determinants of smallholder farmers' participation in banana markets in Central Africa: the role of transaction costs. Agric. Econ. 41, 111–122. doi: 10.1111/j.1574-0862.2009.00429.x
Pender, J., and Dawit, A. (2007). Determinants of Smallholder Commercialization of Food Crops. IFPRI, IFPRI Discussion Paper 88.
Petscher, Y., and Logan, J. A. R. (2014). Quantile regression in the study of developmental sciences. Child Dev. 85, 861–881. doi: 10.1111/cdev.12190
Pingali, P. L., and Rosegrant, M. W. (1995). Agricultural commercialization and diversification: processes and policies. Food Policy 20, 171–185. doi: 10.1016/0306-9192(95)00012-4
Radchenko, N., and Corral, P. (2018). Agricultural commercialisation and food security in rural economies: Malawian experience. J. Dev. Stud. 54, 256–270. doi: 10.1080/00220388.2017.1283014
Rahman, A., and Westley, J. (2001). The challenge of ending rural poverty. Dev. Policy Rev. 19, 553–562. doi: 10.1111/1467-7679.00152
Randela, R., Alemu, Z. G., and Groenewald, J. A. (2008). Factors enhancing market participation by small-scale cotton farmers. Agric. Econ. Res. Policy Pract. South. Afr. 47, 451–469. doi: 10.1080/03031853.2008.9523810
Rodgers, Y., and Akram-Lodhi, H. (2019). The Gender Gap in Agricultural Productivity in Sub-Saharan Africa: Causes, Costs, and Solutions. Availabe online at: jashttps://www.unwomen.org/-/media/headquarters/attachments/sections/library/publications/2019/un-women-policy-brief-11-the-gender-gap-in-agricultural-productivity-in-sub-saharan-africa-en.pdf?la=enandvs=1943 (accessed April 6, 2021).
Sigei, G. K. (2014). Determinants of Market Participation Among Small-Scale Pineapple Farmers in Kericho County, Kenya. MSc Dissertation, Egerton University, Egerton University, Egerton University, Kenya.
Statistics South Africa. (2016). Community Survey 2016 in Brief. Statistics South Africa, South Africa.
Strasberg, P. J., Jayne, T. S., Yamano, T., Nyoro, J., Karanja, D., and Strauss, J. (1999). “Effects of agricultural commercialization on food crop input use and productivity in Kenya,” in International Development Working Paper 71. Presented at the MSU International Development Working Papers, Department of Agricultural Economics and the Department of Economics, Michigan State University (MSU), (Michigan State University), p. 43. doi: 10.22004/ag.econ.54675
Thamaga-Chitja, J. M., and Morojele, P. (2014). The context of smallholder farming in south africa: towards a livelihood asset building framework. J. Hum. Ecol. 45, 147–155. doi: 10.1080/09709274.2014.11906688
The Southern African Grain Laboratory NPC. (2020). SAGL Sunflower Reports | The Southern African Grain Laboratories NPC (Commerical Sunflower Quality 2018/2019). The Southern African Grain Laboratory NPC, Pretoria, South Africa.
Tlholoe, M. M. (2016). Smallholder Livestock Farmers' Willingness to Buy Index-Based Insurance in South Africa: Evidence from Ngaka Modiri Molema District Municipality, North West Province. MSc Dissertation, North-West University, South Africa.
Torimiro, D. O., Yusuf, O. J., Subair, S. K., Amujoyegbe, B. J., Tselaesele, N., and Ayinde, J. O. (2014). Utilisation of sunflower crop among smallholder farmers in sub-Saharan Africa: evidence from Nigeria and Botswana. J. Agric. Extens. Rur. Dev. 6, 298–304. doi: 10.5897/jaerd2014.0579
Twomlow, S. J., Steyn, J. T., and Du Preez, C. C. (2015). “Dryland farming in Southern Africa,” in Agronomy Monographs, eds G. A. Peterson, P. W. Unger, and W. A. Payne (Madison, WI: American Society of Agronomy, Crop Science Society of America, Soil Science Society of America), 769–836. doi: 10.2134/agronmonogr23.2ed.c19
van Zyl, I. C. J. (2010). Capturing the Dynamics of the South African Sunflower Seed Market in a Partial Equilibrium Framework. MSc Dissertation, University of Pretoria, South Africa.
Von Loeper, W., Musango, J., Brent, A., and Drimie, S. (2016). Analysing challenges facing smallholder farmers and conservation agriculture in South Africa: a system dynamics approach. SAJEMS 19, 747–773. doi: 10.4102/sajems.v19i5.1588
Waldmann, E. (2018). Quantile regression: a short story on how and why. Stat. Modell. 18, 203–218. doi: 10.1177/1471082X18759142
Yaméogo, T. B., Bossa, A. Y., Torou, B. M., Fusillier, J.-L., Da, D. E. C., Yira, Y., et al. (2018). Socio-economic factors influencing small-scale farmers' market participation: case of rice producers in Dano. Sustainability 10, 16. doi: 10.3390/su10124354
Keywords: quantile regression (QR), smallholder famers, sunflower (Helianthus annus L.), ordinary least square (OLS), commercialization
Citation: Abafe EA, Oduniyi OS and Tekana SS (2022) Beyond Least Squares Assumptions: Quantile Regression Estimates of the Heterogeneity in Commercialization–The Case of Sunflower-Producing Households in North West Province, South Africa. Front. Sustain. Food Syst. 5:758399. doi: 10.3389/fsufs.2021.758399
Received: 22 September 2021; Accepted: 20 December 2021;
Published: 10 February 2022.
Edited by:
Edward Martey, CSIR-Savanna Agricultural Research Institute, GhanaReviewed by:
Richard Bannor, University of Energy and Natural Resources, GhanaFranklin Mabe, University for Development Studies, Ghana
Prince Etwire, CSIR-Savanna Agricultural Research Institute, Ghana
Copyright © 2022 Abafe, Oduniyi and Tekana. This is an open-access article distributed under the terms of the Creative Commons Attribution License (CC BY). The use, distribution or reproduction in other forums is permitted, provided the original author(s) and the copyright owner(s) are credited and that the original publication in this journal is cited, in accordance with accepted academic practice. No use, distribution or reproduction is permitted which does not comply with these terms.
*Correspondence: Ejovi Akpojevwe Abafe, ejoviabafe@gmail.com