 Emily K. Burchfield
 Britta L. Schumacher1†
 Kaitlyn Spangler
- 1Department of Environmental Sciences, Emory University, Atlanta, GA, United States
- 2Pennsylvania State University, University Park, PA, United States
In nine of the last 10 years, the United States Department of Agriculture (USDA) has reported that the average funds generated on-farm for farm operators to meet living expenses and debt obligations have been negative. This paper pieces together disparate data to understand why farm operators in the most productive agricultural systems on the planet are systematically losing money. The data-driven narrative we present highlights some troubling trends in US farm operator livelihoods. Though US farms are more productive than ever before, rising input costs, volatile production values, and rising land rents have left farmers with unprecedented levels of farm debt, low on-farm incomes, and high reliance on federal programs. For many US farm operators, the indicators of a “good livelihood”—stability, security, equitable rewards for work—are largely absent. We conclude by proposing three axes of intervention that would help US agriculture better sustain all farmers' livelihoods, a crucial step toward improving overall agricultural sustainability: (1) increase the diversity of people, crops, and cropping systems, (2) improve equity in access to land, support, and capital, and (3) improve the quality, accessibility, and content of data to facilitate monitoring of multiple indicators of agricultural “success.”
Introduction
United States (US) agricultural systems excel at producing food, fuel, and fiber. The pursuit of productivity has fostered the development of technologies that increase efficiency (Tilman et al., 2011; Coomes et al., 2019), spare land (Phalan et al., 2014), and boost yields. US consumers now spend an average of only 8.6% of their disposable personal income on food—a number which has trended consistently downward since the 1960s (USDA ERS, 2021b). The focus on producing calories and consumer goods as cheaply as possible, however, has meant that the true costs of food production have been externalized—whether through the reduced nutritional content of food (Mayer, 1997; Davis et al., 2004), environmental degradation (Tscharntke et al., 2012; Allan et al., 2015; Clark and Tilman, 2017), unethical labor practices (Snipes et al., 2017; Klocker et al., 2020; Soper, 2020), or, as we review in this paper, the livelihoods of those who operate US farms.
In nine of the last 10 years, the United States Department of Agriculture (USDA) has reported that the average funds generated on-farm for farm operators to meet living expenses and debt obligations have been negative1 (USDA ERS NASS, 2021). This paper pieces together disparate data—typically presented independently in fact sheets, white papers, websites, arcane and poorly documented databases, or in the hands of individuals working at federal institutions—to understand why farm operators in the most productive agricultural systems on the planet are systematically losing money. We construct a data-driven narrative that leverages the highest resolution data openly available to understand the following imperative questions:
(1) Who operates US farms?
(2) What is the state of US farm operator livelihoods?
(3) Why are US farm operators systematically losing money?
The goal of this paper is to link the insights and contradictions revealed by merging, cleaning, exploring, documenting, and sharing clean versions of available federal data with broader conversations around the causes and effects of agricultural livelihood precarity. We also hope to contribute to important conversations about who and what is currently (not) monitored, how this reflects paradigms and priorities on who and what “counts” in US agriculture, and the importance of broadening definitions and metrics of “agricultural progress” to include the livelihoods of the individuals engaged in US agriculture.
Background
One of the oldest questions in rural social science and theory has concerned the fate of agricultural producers. Which farmers in which contexts continue to farm, and why? This question has been pursued theoretically and empirically for decades in different national settings; these works comprise the backbone of agrarian political economy and critical agrarian studies. Although a full accounting lies beyond the scope of this paper (for excellent reviews, see (Bernstein, 1994; Akram-Lodhi and Kay, 2010a,b; Watts, 2021 and, for the US context specifically, Lobao and Meyer, 2001), we briefly sketch its lineages here to anchor our questions. We pay particular attention to two areas. First, we sketch the theoretical roots of agrarian political economy to underscore the potential for data science to contribute to long-standing debates. Second, we summarize the factors underpinning the economic decline of US farm households to situate the trends we identify within the scholarship on their drivers.
Critical agrarian studies' roots lie in late 19th century efforts to understand and predict peasant producers' varied roles in different processes of national development [Kautsky, 1983 [1899]; Lenin, 1956 [1899]; Marx, 1995 [1867]]. The key question was whether agricultural production would or would not follow the trajectory of industry—would the agricultural sector also fracture into classes delineated by labor relations, or would the particular characteristics—the “dependent autonomy”—of peasantries act as a barrier to class polarization (Narotzky, 2016)? A significant thread within these conversations was establishing the logics and practices through which family farms could reproduce themselves from one generation to the next (Chayanov, 1966; van der Ploeg, 2013). After going dormant in the first part of the 20th century, this question prompted renewed scholarly interest during the 1970s and 1980s against the backdrop of the Cold War; international work analyzed agrarian class evolution not as a universal process but rather as dynamics inescapably situated within regional historical contexts (Brenner, 1976; Goodman et al., 1987; Mann, 1990; Byres, 1995). Agriculture's requisite interface with the natural world and its biological cycles (Mann and Dickinson, 1978) and farm households' ability to “self-exploit” family labor (Friedmann, 1978; Reinhardt and Barlett, 1989) emerged as important explanations for how and why agricultural systems resisted class polarization in certain contexts.
This body of scholarship remains the theoretical backbone for much critical social science work on the structure of agriculture in the US and its impacts on agricultural livelihoods. The long-term decline in number of US farms and farmers, the concomitant increase in average farm size, and the marginal financial returns earned by most farms are widely reported trends (USDA ERS, 2021a). There is clearly money being made in agriculture, but the lion's share largely accrues to processors, input suppliers, distributors, and retailers. Even as US production of grain commodities and livestock products have achieved record highs in recent years, agricultural livelihoods remain precarious. What conditions of US agriculture accounts for these trends? Drawing on and adapting the theoretical contributions of agrarian political economy, more recent agricultural social science scholarship has generated several explanations. First, the structure of agriculture changed drastically during the 20th century. The sector trended heavily toward enterprise specialization, intensification and over-production, and large-scale, monocultural production (Barlett, 1989; Buttel, 2006). Livestock and crop production became spatially segregated, creating waste disposal challenges for the former and fertility challenges for the latter (Berry, 1977). This process also created economic conditions opposing the interests of livestock producers who purchase feed as an input to grain producers, setting the stage for the uneven rewards of the ethanol boom (Baines, 2015). Second, these changes were made possible in part through the replacement of draft and human labor with capital intensive technology and equipment (Fitzgerald, 1991). The classic treadmill effect has compelled growers to adopt new technologies to maintain competitiveness (Cochrane, 1993); as robotics, precision agriculture, and other digital technologies have become increasingly common in agriculture (Fraser, 2018; Carolan, 2020), the capital investment required to farm has risen exponentially (but see Janssen, 2018). Much work has also explicated the role that the World Trade Organization and other institutions of global governance played in re-writing the international trade rules that create the global market context on which commodity producers depend (Weis, 2007; McMichael, 2009; Winders, 2020). Finally, an important through line across social science efforts to understand the precarious economic situations of agricultural producers in the US has demonstrated the drivers and effects of corporate consolidation in the food system (Hendrickson et al., 2002; Howard, 2016; Clapp, 2021). As food system power concentrates among fewer firms, farmers' economic choices become both constrained and compelled (Hendrickson et al., 2005: p. 283).
Even as briefly sketched here, the breadth and depth of this scholarship clearly outlines the structural contexts that create growers' fragile economic positions. The pressures exerted by supply-side input providers, market-side agricultural processors, and global markets render fragile growers' autonomy and economic power. In response, some farmers pursue capital-intensive economies of scale, some stop farming, and some tap into the same reserves of family labor that have long reproduced agriculture (Kohl and Bennett, 1982; Reinhardt and Barlett, 1989). Others opt out of the commodity system by pursuing direct-market or niche production (Paxson, 2013; Campbell and Veteto, 2015; Janssen, 2018), even as the logics of globalized industrial agriculture continue to influence their alternative agricultural livelihoods (Rissing, 2021). Yet, critical agrarian scholarship is rarely in conversation with the full accounting of nationally available data collected by the USDA; its empirical evidence is more often rooted in case studies or analyzing publicly available data at face value. The USDA, on the other hand, publishes an impressive array of statistically rigorous reports devoid of an avowed theoretical orientation. In charting a preliminary approach to bridging these longstanding bodies of disparate agricultural research, we show how data science can shed new light on the national patterns, regional contradictions, and historical trends of farmers' livelihoods.
This paper takes a deep and direct dive into these data, informed by the breadth of literature that has examined the livelihoods of US agricultural producers. We create a data-driven narrative that applies these theories to guide a critical engagement with USDA data and tell a more holistic story of who US farmers are, how they are doing, and how it has become this way. In examining this data, we also highlight the ways in which what we measure reflects national priorities—and call for an increase in the accessibility and coherence of agricultural data collection to identify and track the challenges farm operators face.
Data Overview
We collected, cleaned, and merged multiple public datasets that monitor (1) historical descriptions of farm operations and operators (USDA Economic Research Service, henceforth ERS, compiled by R. Hoppe and provided to the authors), (2) operator demographics (USDA Census of Agriculture, or CoA, accessed through the USDA National Agricultural Statistics Service, or NASS), (3) indicators of farm management (CoA), and (4) production expenditures and revenues (US Bureau of Economic Analysis, henceforth BEA; USDA CoA). A full list of datasets, including descriptions of their spatiotemporal resolution, unit definitions, and links to tidy data for download can be found in Supplementary Table 1.
These data present several important limitations that we cannot overlook. First, while the goal of this paper is to start a broader conversation about the livelihoods of those engaged in US agriculture, the USDA largely monitors the attributes of farm operations—defined as a place from which more than $1,000 of agricultural products were produced and sold in a year2—and principal farm operators—or the persons primarily responsible for on-farm decision-making3. The majority of the visualizations presented focus on these two units of analysis. When this is not the case, we explicitly define the alternative unit of analysis (Supplementary Table 1). We readily acknowledge that this focus on farm operations and principal farm operators4 excludes, among others, the over 2.5 M farmworkers essential to US agriculture not listed as principal farm operators (National Center for Farmworker Health, 2020) who are, in large part, systemically vulnerable and unprotected within the US agriculture system (Calo and De Master, 2016; Snipes et al., 2017; Klocker et al., 2020; Soper, 2020). However, there are no nationally representative databases analogous to the USDA CoA for farm operators available for the mobile and diverse population of US farmworkers5. Because this population is under-surveyed, they are also understudied—this is an urgent limitation of both this research and the broader conversation about agricultural livelihoods in the US.
Second, though we visualize and describe data at the highest spatial resolution available, much of the data are only publicly available at national or regional scales (Supplementary Table 1). When possible, we refer to regional variability using US states, counties, or Farm Resource Regions—nine regions delineated by the USDA to capture important differences in climate, soil, topography, political-economy, and culture that strongly shape cultivation possibilities for US farmers (Figure 1). When data are only available at a national scale, it is important to note that our descriptions of “average” farm operations or operators overlook important spatial differences in operator demographics, operation management, operation typologies, and rural livelihoods. In addition, these national data are strongly shaped by the commodity crops that dominate many US agricultural landscapes and fail to capture the realities of operators and operations engaged in specialty crop production.
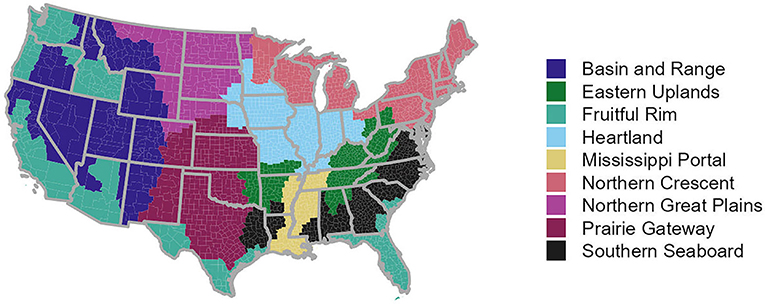
Figure 1. The nine US Farm Resource Regions delineated by the USDA ERS (2000).
Third, the structure of the data seldom allows for exploration of intersectionality across indicators of demographics, management, and livelihood. Structural racial (Gilbert et al., 2002; Horst and Marion, 2019; Minkoff-Zern, 2019) and gendered (Sachs, 1983; Allen and Sachs, 2007; Keller, 2014) inequities in access to farmland, capital (Ghimire et al., 2020), federal support (EWG, 2021), and professional respect (Snipes et al., 2017) have long characterized the US agricultural sector, these barriers have systematically limited the diversity of people and perspectives in US food production. This is reflected in data availability. To our knowledge, we cannot currently report on major indicators of agricultural livelihoods (see Table 1) across race, ethnicity, or gender at a sub-national scale. We have searched extensively and have found that intersectional data are only reported by the USDA NASS in their summary reports at national scales (e.g., USDA NASS, 2019, Chapter 1: United States Data, Tables 55–64).
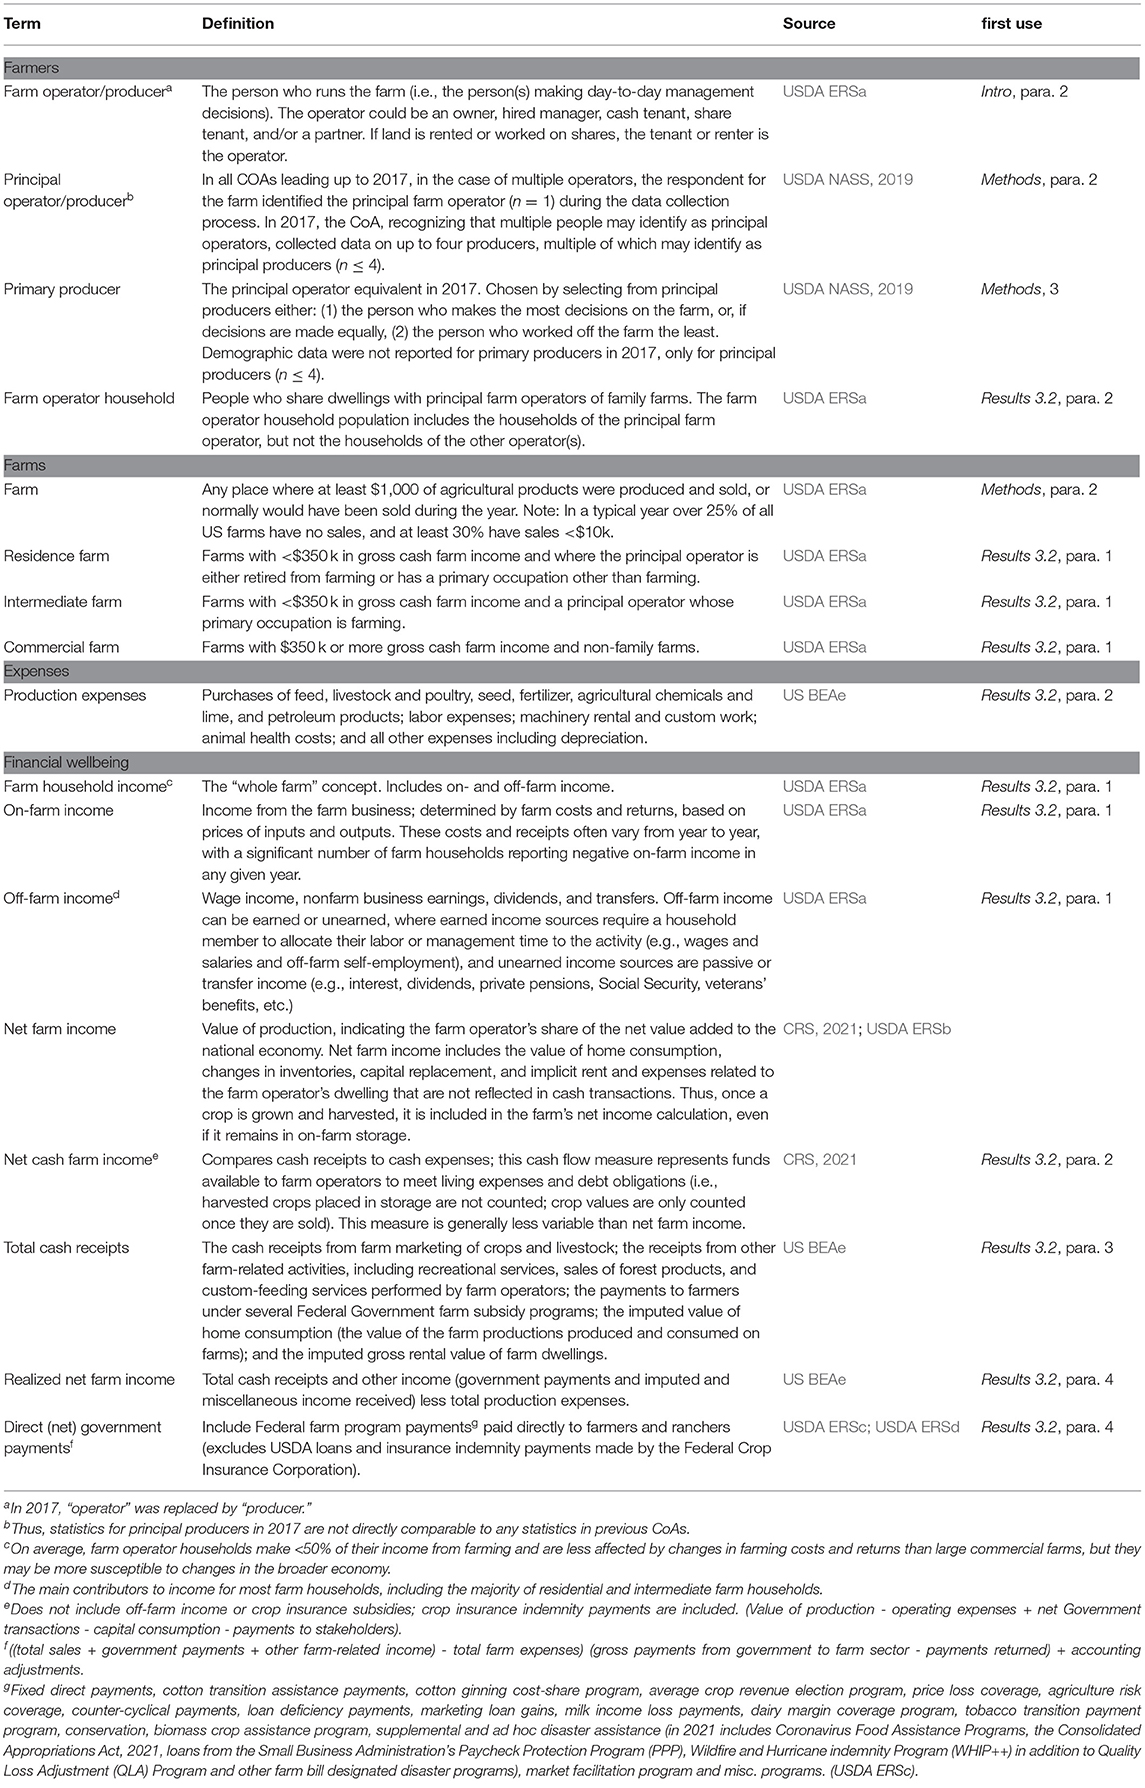
Table 1. Commonly used terms, definitions, and sources.
Finally, we examine operator livelihoods in aggregate, largely ignoring the major operational differences between commodity grain (e.g., corn, soy, wheat, rice), specialty crop (e.g., vegetable, fruit, nut), and livestock operations6. Importantly, the trend toward agricultural specialization over the twentieth century created an agricultural sector where one group of farmers (grain producers) essentially produce the inputs on which another group (livestock producers) depends—conditions which oppose their interests and make it difficult to meaningfully discuss producer livelihoods in an all-encompassing way. These differences have major implications for agricultural livelihoods; for instance, the average per farm net farm income of beef cattle ranchers in 2017 was $3,904, compared to $83,065 in oilseed and grain, and $389,897 in poultry and egg producers (USDA NASS, 2019). Our focus on aggregate livelihood outcomes is driven by data availability. To our knowledge, we can only look at the main indicators of farm livelihoods by operational category at the national level and only for the 2002, 2007, 2012, and 2017 CoA years7. By focusing on coarser operational classifications, we are able to examine available livelihood indicators at higher spatiotemporal resolutions and over longer periods of time. This focus also allows us, to the limited extent currently possible, to visualize the intersection of these indicators of livelihood with race, gender, and geography.
We made three notable adjustments to these data. First, when appropriate, data were adjusted for inflation using the chain type GDP deflator provided by the USDA ERS, the consumer price index provided by the US Bureau of Labor Statistics (BLS), or the price as paid index provided by the USDA NASS. Second, in 2002 the USDA began incorporating statistical adjustments into official CoA estimates and reported some adjustments retroactively for 1997; these adjustments are meant to correct for systematic biases in data collection that may misrepresent particular populations in the farm sector (e.g., small farm operations) (see MacDonald et al., 2018, Appendix A for more details). Throughout the paper, bar graphs show unadjusted numbers through agricultural CoA year 1992 and adjusted from CoA year 1997 on; line graphs show both adjusted and unadjusted values in 1997. Third, in all county-level maps, we utilize a quantile binning methodology8 where we break data into quantiles (e.g., 13, 28, 45, 76) and then assign interpretable values (e.g., 15, 25, 50, 75) to our bins.
All the code used to clean, merge, and visualize these data is provided at https://github.com/blschum/US-Farming-Data-Narrative. We also provide links to download clean versions of the original data under each figure to facilitate future research in this space. Finally, we provide a table of definitions for terms commonly used by US institutions, linked to the definitions' source and its first use in our manuscript (Table 1). These terms—which describe US farms, farmers, and farmer livelihoods—are currently defined in disparate institutional documentation and metadata that is often very difficult to find. In Table 1, we consolidate and elucidate the subtle differences between institutional terminology with the hope of promoting informed use of these data.
US Farm Operator Livelihoods
Who Operates US Farms?
We begin by providing an overview of who currently operates US farms and how this has changed through time. Overall, the number of farm operations has dropped precipitously since the beginning of the century—from 6.8 million at its peak in 1935 to 2.0 million in 2017 (Figure 2A). The US is currently home to an estimated 2.0 million farm operations that cover 900 million cultivated acres and employ an estimated 2.6 million individuals (1.3% of total US employment) (USDA ERS, 2020a; USDA NASS, 2020). The average size of these operations has increased three-fold over the same period—from 147 acres in 1900 to 441 acres in 2017 (Figure 2A, Supplementary Figure 1). The number of individuals employed by the agricultural sector has dropped by 1.3 million since the 1980s Farm Crisis (Figure 2B); however, there are many US regions, particularly the Northern Great Plains and Prairie Gateway, in which agriculture remains a primary source of employment (Supplementary Figures 2, 3).
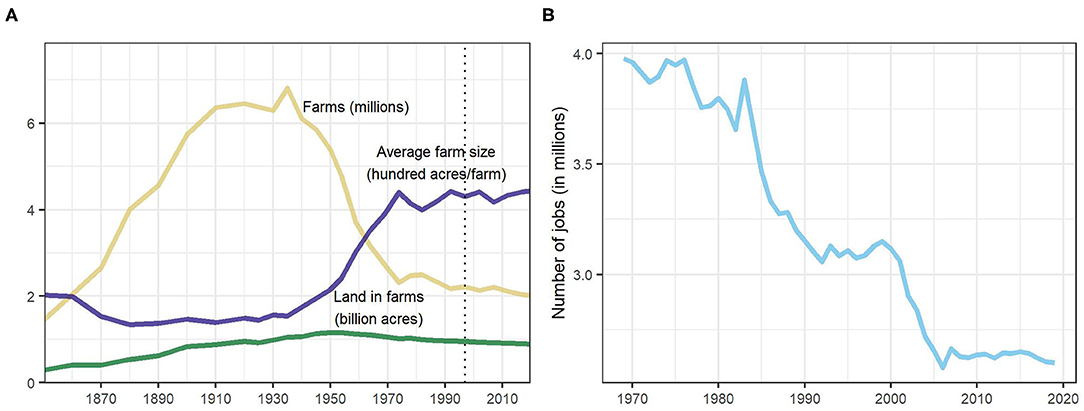
Figure 2. (A) US farms (in millions), land in farms (in billion acres), and average farm size (in hundred acres/farm) from 1850 to 2017. The vertical line in 1997 reflects USDA NASS adjustments for under-coverage. Data: USDA ERS, compiled by R. Hoppe. (B) Number of agricultural jobs from 1969 to 201913. Data: US BEAa.
Today, US farms are operated overwhelming by white males (Figure 4C), with individuals not identifying as white9 currently operating <7.1% of farmland and representing only 5.2% of operations (Figure 3B, Supplementary Figures 5, 6). According to the 2017 USDA CoA, today the “average” US farm operator is a 58-year-old white male (Figure 3A, Supplementary Figure 4). While white males have long dominated the US agricultural sector, the last century has seen a precipitous drop in the relative number of Black operators. Today, only 1.4% of operators identify as Black (38 k of 2.74 M total; Figure 3B), and these operators are heavily concentrated in the Southeastern US (Figure 4A)10. Within the majority of operators identifying as white, there is an increasing number of Hispanic operators (84 k of 2.6 M white operators), largely along the Fruitful Rim (Figure 4B)11. In 2017, 6.1% of operators identified as non-white and non-Black, including 46k operators identifying as American Indian12 or Native Alaskan.
Figure 3. (A) The average age of principal operators from 1940 to 2017. Note that the y axis begins at 47, not 0. (B) The number of US farms with principal operators identifying as Black (red), white (blue) and non-white and non-Black (yellow) from 1900 to 2017. For scale, farms operated by Black operators and members of all other races are shown in hundreds of thousands, while white operated farms are shown in millions. (C) Number of principal operators by reported gender (hundreds of thousands), overlayed with percent female principal operators. Note the 2017 CoA was the first year farms could report multiple principal operators. Note adjustments for under coverage in 1997 (unadjusted = 54.3, adjusted = 54.0). Finally, note the multiple x-axis scales representing the various, inconsistent timeframes for which agricultural data are available. Data: USDA ERS, compiled by R. Hoppe.
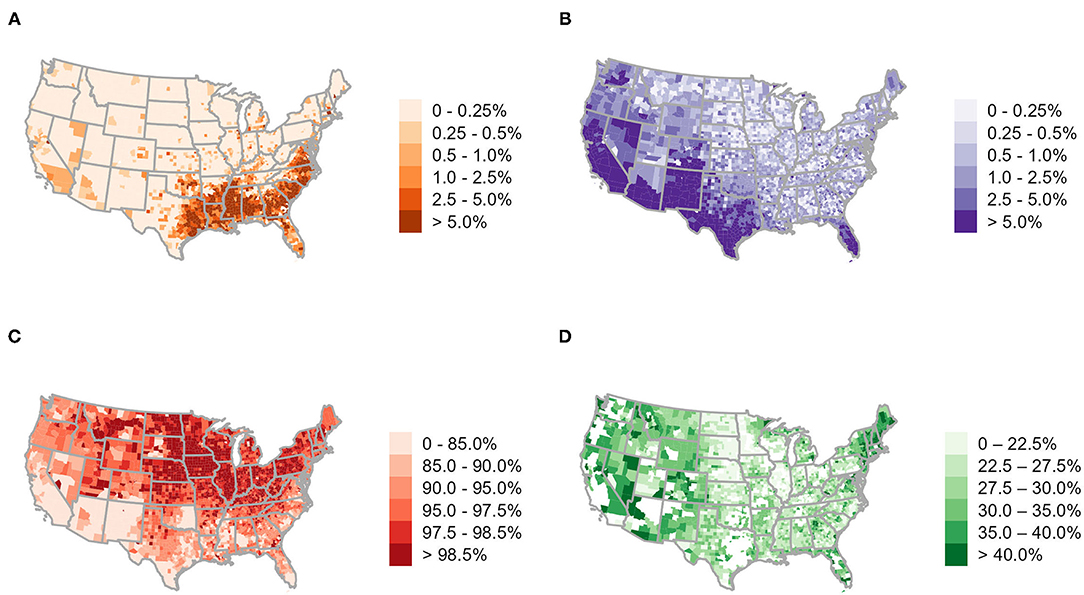
Figure 4. Percent principal operators identifying as (A) Black, (B) Hispanic, (C) white, and (D) female in 2017. Note, (B) includes all farmers identifying their ethnicity as Hispanic (i.e., includes all races) (C) includes both Hispanic and non-Hispanic identifying operators. DataA−C, D: USDA NASS QuickStats.
Though women's labor has long been vital to US farms (Sachs, 1983, 1996; Rosenfeld, 1987), until 2000, the percent of reported principal operators identifying as female was consistently below 10% (Figure 4D; see Supplementary Figure 7D for female operated acreage). This number has risen in recent years, particularly from 2012 to 2017 when the percent of female operators rose from 13.7% (288 k female operators of 2.1 M total) to 29.1% (799 k females of 2.7 M total) (Figures 3C, 4D); however, this increase largely reflects a shift in USDA CoA reporting from a “one farm, one farmer” policy to allowing reporting of up to four principal operators per farm operation (Pilgeram et al., 2020).
What Is the State of US Farm Operator Livelihoods?
Federal agencies largely monitor livelihoods using indicators of farm revenue. Within this narrow conceptualization of livelihood, a myriad of terms and metrics are used to capture on-farm income. The USDA ERS reports farm household income, which includes both income earned on the farm and income earned off the farm, and net cash farm income, which captures on-farm income after accounting for production expenses. The BEA reports net income, or the total cash receipts from all farms in a county less total production expenses, as well as realized net farm income which includes total cash receipts as well as government payments. Accessing, navigating, and understanding these data (and their metadata) is a challenge. We share these definitions (and source documents describing metrics) in Table 1 and host clean versions of each dataset at https://github.com/blschum/US-Farming-Data-Narrative to facilitate use moving forward. In what follows, we explore what these disparate definitions and metrics have to say about US operator livelihoods. To the extent possible, we describe how available livelihood indicators intersect with gender and race and highlight the ways in which this important intersectional data is largely unreported.
In 2019, residential and intermediate farm operators (see Table 1 for definitions) reported average household incomes of $138 k and $69 k, respectively, as compared to the national average of $99 k (Schnepf and Rosch, 2020). Commercial farm operators, which represent only 8.2% of all US farms, reported household incomes of $286 k—nearly three times the US average (USDA ERS NASS, 2020a). These numbers initially suggest that operating a farm is a potentially profitable livelihood choice. A more careful look at the data, however, suggests that this is not necessarily true. This metric of farm household income includes both on-farm income, or income received directly from the farm business, and off-farm income, which includes non-farm business earnings, non-farm wage income, dividends, and transfers (Supplementary Table 2). Nationally, on-farm production contributes to <25% of farm household income, with the remaining 75% earned off-farm (Figure 5A). This has consistently been the case for the last century, with on-farm revenues increasing as a proportion of total household income in more recent years. Available data indicates that the contribution of on-farm work to household income also varies by farm type, with an average of only 2.2% of residential farm household income earned on-farm as compared to nearly 79% of commercial farm household income in 2019 (Schnepf and Rosch, 2020). We were unable to find data describing how on-farm and off-farm income intersect with operator race, however national data reported by the ERS suggests that the national mean on-farm income generated by females is less than a fourth of what male operators bring in ($6,612 for females as compared to $27,354 for males) (USDA ERS NASS, 2020b).
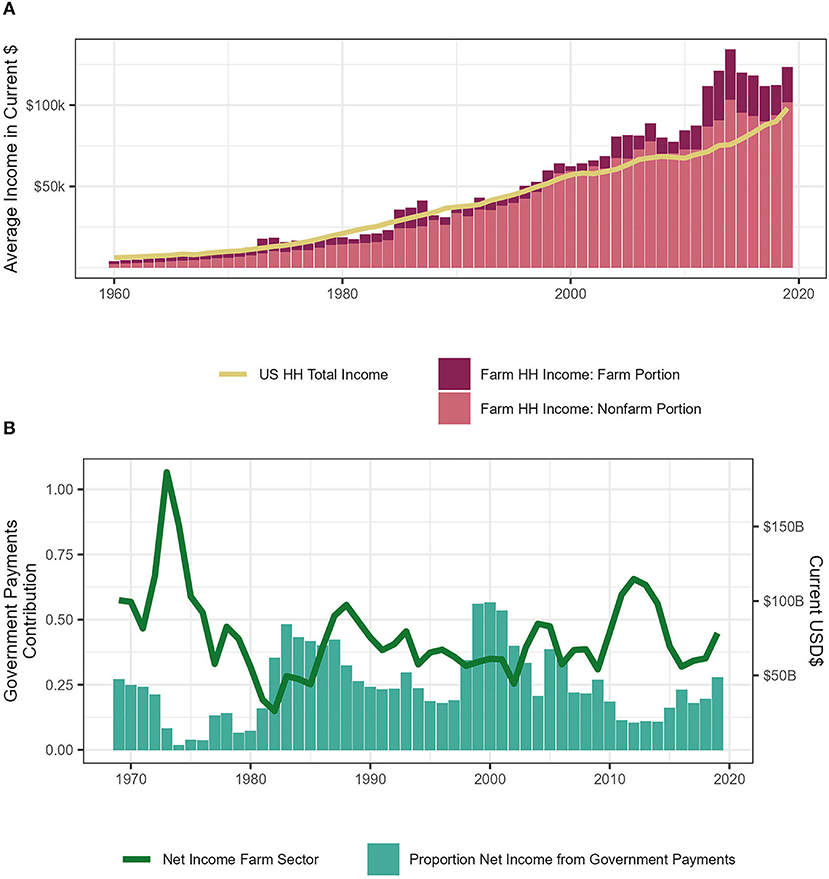
Figure 5. (A) Average farm household income and US household income in current $. Data: USDA ERS, 2020. (B) Contribution of government payments to net farm sector income, in current $. Data: US BEAd.
It is important to highlight that the relatively small proportion of farm household income coming from on-farm activities does not account for production expenses incurred on-farm. This, we focus here on what is perhaps the strongest indicator of the profitability of farming: net cash farm income, or the funds generated on-farm available to meet living expenses and debt obligations after accounting for production expenses. In 2017, in 14.6% of reporting counties, farm operators reported negative net cash farm incomes, with some counties reporting average annual operational losses as high as $55 k (Woodward County, OK) (Figure 6B). The national median farm income generated in 2017 was negative $1,035 per principal farm operator household (USDA ERS NASS, 2021). This implies that the actual revenue generated by on-farm activities—or by the act of farming—is small or even negative in many parts of the US. Unfortunately, net farm income is only available back to 2002 (Figure 6A), but this data suggests that even over the short period from 2002 to 2017, there has been a 6.8% increase in the number of US counties reporting negative returns to farming (Figure 6). We were unable to find data to assess how these indicators vary across gender and racial identities.
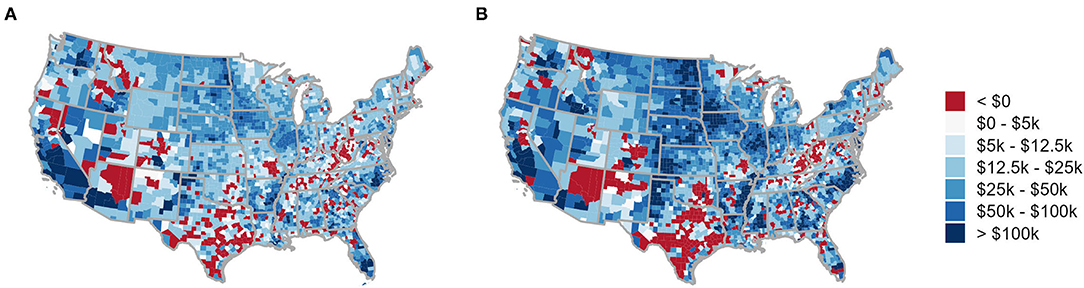
Figure 6. Inflation adjusted net cash farm income of operations (measured in $/operation) reported by the USDA NASS in (A) 2002 and (B) 2017. Data: USDA NASS QuickStats.
To understand the profitability of operating a farm before 2002, we turned to the US BEA, which reports realized net farm income, or the total cash receipts from all farms in a county less total production expenses back to the 1960s. This metric is similar to the ERS's net cash farm income metric in that it quantifies revenue flows to farm operators after accounting for expenses, but different in the way it accounts for government payments and revenue flows to the operation (see Table 1 for details). The BEA data suggest that over the last 60 years, in many agriculturally important regions of the US (much of Texas, the Eastern Uplands, and the Basin and Range) total production expenditures have far surpassed production revenues (Figure 7). From 2015 to 2019, an average of 28.9% of counties reported negative realized net farm income as compared to 1.0% over the period from 1969 to 1973 (Figure 7, Supplementary Figure 15). This income loss is spatially concentrated, with farmers throughout the US Heartland and along the Fruitful Rim reporting large positive net incomes and those across much of the Southeast, Prairie Gateway and Basin and Range reporting significant losses (Figure 7B; Supplementary Table 2)14. Though we were unable to formally assess the intersections between BEA data and operator gender and race, we note that many regions with significant realized net farm income losses are also regions with disproportionally more non-white farm operators.
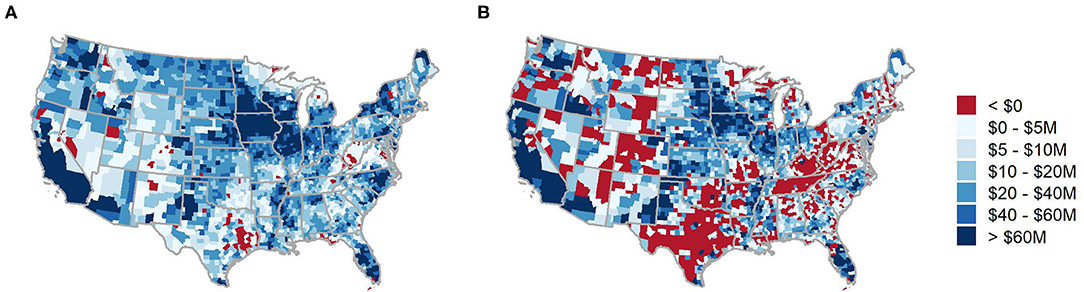
Figure 7. Realized net income of farmers in (A) 1969 (adjusted to 2019 dollars) and (B) 2019. Net income is defined as total cash receipts from all farms less production expenses15 and is analogous to USDA NASS measures of net cash farm income. We visualize BEA realized net income data because it dates back to 1969 while USDA NASS county-level data only dates back to 1997. Counties in which net income is negative (red) had average production expenses that surpassed total cash receipts. For instance, Parker, TX realized $17M in 1969, but -$67M in 2019. Data: US BEAb.
The increase in negative realized net average farm incomes is troubling, but what adds to this concern is that both the net cash farm income reported by the USDA and the realized net farm income reported by the BEA include direct payments to farmers from federal programs including federal crop insurance indemnity payments and crop subsidies. In the mid-1970s, government payments constituted only 8.2% of net farm income, which had risen to $1.87B (Figure 5B). Today, government payments make up anywhere from 10 to 25% of net farm income, which has remained at $60–80B since 2015. From 1995 to 2020, farm operations received a total of $424.4 billion in subsidies ($240.5 billion of which was for commodity programs—mostly for corn, wheat, and soy) (Schnepf and Rosch, 2020)16. These payments cover much of the US, with some of the highest per-acre direct federal payments and use of crop insurance in the US Heartland (Figure 8). These subsidies also go overwhelmingly to massive producers, with the top 10% of commodity payment recipients receiving 78% of commodity payments. These disparities can be, in part, explained by base acre designations, or acreage defined at the farm-level that is eligible for commodity program payments based on the historical average acreage of covered commodities, not the current acreage, on that parcel of land. Historical acreage was set in the 2002 Farm Bill based on planted acreage from 1998 to 2001, and farmers could reallocate existing base acres (but not add new ones) in the 2014 Farm Bill based on 2009 to 2012 planted acreage (Farm Bureau, 2016). These designations help incentivize keeping land in commodity production, as well as consolidating that land into larger farms, to help mitigate the risk of potential loss with adequate subsidy payments (Newton, 2017; Spangler et al., 2020). Meanwhile, farmers without base acres are not eligible to receive commodity payments, even if growing covered commodities. Data describing the intersections of base acreage with race and gender are not available; however, according to the 2017 CoA, Black operators managed 120 acres on average, female operators 331 acres on average, while white operators managed 431 acres nationally. Available national data suggests that white operators receive nearly twice as much as from federal programs (an average of $14 k per farm) as Black ($6.4 k per farm) operators, while Hispanic ($14.7 k) and Native Indian (12.1 K) operators receive comparable average receipts to white operators (USDA NASS, 2019). Female operators also receive less support than their male counterparts ($12.5 k vs. $14.4 k). The concentration of federal payments among largely white male large-scale producers reflects long histories of structural racism that increase challenges for non-white farmers in accessing the land, base acreage, labor, and capital necessary to operate a farm (Gilbert et al., 2002; Fagundes et al., 2020).
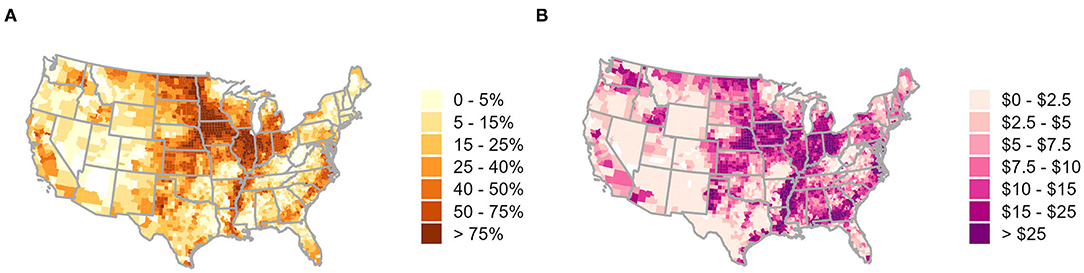
Figure 8. (A) Percent of county agricultural acres covered by crop insurance in 2017; (B) Dollars provided per agricultural acre in government payouts to farmers in 2017. In 2017, US farms received an average of $11.59/acre (median = $8.69/acre) in government payments and an estimated 31.1% (median = 23.9%) of all agricultural acres were covered by crop insurance (Figure 12). Data: USDA NASS QuickStats.
Why Are Operators Losing Money?
Available data suggests that nationally, many farm operators are increasingly losing money and relying on federal payments and off-farm income to support their households. Though data availability at a sub-national scale is extremely limited, available data describing the intersections of indicators of on-farm income with operator demographics suggest that female and non-white operators hold less land, receive less federal support, and generate less revenue than their white male counterparts. In what follows, we review available data describing the potential drivers of this revenue loss and (to the extent possible) discuss the intersections of these drivers with race and gender.
Rising Input Costs
The last century has brought major changes to how US farms are managed in terms of the composition of input use, the efficiency with which these inputs are used, and the specialization of crops cultivated. Over the last 70 years, labor and land inputs declined by 76 and 28%, respectively. Meanwhile, the use of other intermediate goods—including energy, fertilizer, pesticides, purchased services, seeds, and feed—increased by 133% (USDA ERS, 2020c). These major inputs to production are managed more efficiently than ever before; over the last century, the US yields of soybeans and winter wheat roughly tripled and maize yields increased 5-fold (USDA NASS, 2020) while the total inputs used in agriculture grew only 7% (ibid.)17. However, over the last 45 years, farms have consistently spent more than 75% of earnings on inputs; spending peaked in 1982 during the farm crisis at 93.5% and more recently in 2019, at 82.5% (Supplementary Figure 9). Per acre costs18 for corn, soy, and wheat have tripled since 1990, from $177 per acre to $690 per acre in 2020 for corn, from $107 to $500 for soy, and from $79 to $323 per acre for wheat (Supplementary Figure 10). In 2017, the USDA estimated that annual farm expenditures—of which labor, machinery, fertilizer, and chemicals comprise over 30%—averaged over $176 k, with median (mean) per acre costs of $427 ($605) (Figure 9). As evidenced above, in several regions—notably parts the Eastern Uplands (TN, WV, and KY) and much of Texas—farmers now regularly spend more on production expenses than they earn from production (Figure 7B, Supplementary Figure 11). Rising input costs, equipment costs, and repair costs place significant financial burdens on many farmers and push on-farm expenditures beyond on-farm revenues19. Though the USDA provides farm loans at competitive rates and supports several programs that favor beginning and minority farmer, evidence suggests that non-white farmers still face structural discrimination in loan access essential to purchase of inputs (Daniel, 2013; Minkoff-Zern and Sloat, 2017; Escalante et al., 2018; US CRS, 2021).
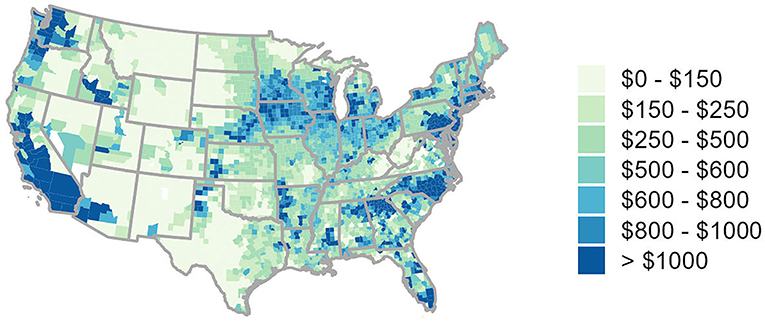
Figure 9. Per acre expenditure on agricultural inputs in 2017; county-level agricultural expense data1 standardized by a county's total agricultural acres2. Data: US BEAc, and USDA NASS QuickStats.
Low Returns on Production
Another potential driver of declining on-farm incomes is price volatility for many widely cultivated commodities. One of the overarching trends that defines US agriculture is simplification—of cropping regimes, management practices, and of the individuals who operate the land. Five crops—corn, soy, wheat, hay, and alfalfa—now constitute nearly 80% of cultivated US acreage (USDA NASS CDL, 2020). These crops are increasingly spatially concentrated (Aguilar et al., 2015; Crossley et al., 2020; Spangler et al., 2020; Nelson and Burchfield, 2021; Petersen-Rockney et al., 2021), with the average number of major commodities produced per farm decreasing from roughly 4.5 to 1.5 over the last 60 years (Dimitri et al., 2005; USDA NASS, 2019)20. The most commonly grown commodity crops—wheat, rice, corn and soybeans—now comprise about 75% of the caloric content of food production worldwide (Cassman, 1999; Roberts and Schlenker, 2009) and cover well over half of cultivated US acreage (USDA NASS, 2020). The simplification of farm operations can leave operations over-exposed to market fluctuations and decrease livelihood resilience (Abson et al., 2013; Perrin et al., 2020; Petersen-Rockney et al., 2021). Indeed, prices of the three commodities that dominate US landscapes—corn, wheat, and soy—have varied greatly over the last two decades (Figure 10), particularly due to trading on the international stock market (Hendricks et al., 2014; Bouët and Laborde, 2017; Conger, 2020), shifts in global biofuel production (Roberts and Schlenker, 2013; Lark et al., 2015), and increased competition with other high-yielding operations (Nigatu et al., 2020). Over the last 30 years, the steady increase in per acre production costs for these crops has matched or outpaced growth in production values, leaving net production value of major commodities low or even negative (Figure 11).
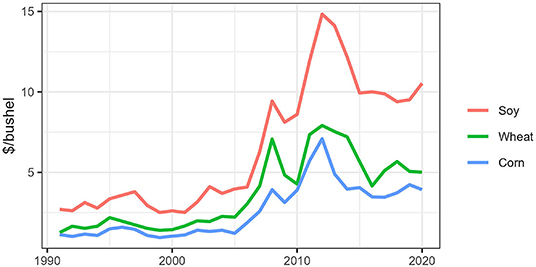
Figure 10. Major commodity prices, adjusted using the price as paid index (PPITW) provided by the National Agriculture Statistics Service based on instruction for deflation from Jeff Gillespie, REE-ERS. Data: (USDA ERS, 2021c).
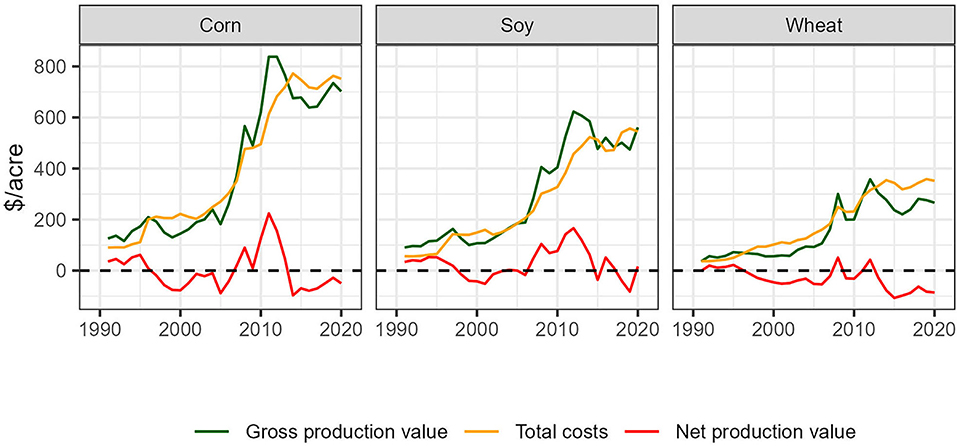
Figure 11. Gross production value, total costs, and net production value for major commodity crops over the last 40 years, adjusted for inflation using the chain-type GDP deflator provided by the USDA ERS. Data: (USDA ERS, 2021c).
Though programs included in the omnibus legislation of the Agricultural Improvement Act (or the Farm Bill) attempt to provide a buffer for such volatility by offering coverage payments for movements in the market price of covered commodities21, these subsidy programs amplify political-economic incentives to specialize in covered commodities–and disincentivize specialization in different crops–exacerbating the reliance on federal support to turn a profit (Ayazi and Elsheikh, 2015). An increasingly small number of transnational firms have capitalized on and invested in these crops; this strongly influences available technologies and narrows innovation pathways to privilege high-tech proprietary technologies that are good for their bottom lines but exacerbate dependence on high-input costs for producers (Vanloqueren and Baret, 2009; Clapp, 2021).
Land Access
A common response to growing concerns about the declining profitability of managing a farm in the US is that farmers are “land rich, cash poor” (Inwood, 2013). It is important to note, however, that the negative net incomes reported by the USDA are not necessarily for farm owners but for farm operators who, in many cases, do not own the land they operate. Indeed, access to the most fundamental of agricultural inputs, land, remains a major challenge for many farm operators. From 2015 to 2019, 10% of all US farmland (93 million acres) was transferred, most of which (6%, or 55.8 million acres) changed hands through gifts, trusts, or wills (Bigelow et al., 2016). In 2015, a USDA survey asked farmland owners if they were planning to transfer ownership in the next 5 years; only 2.3% of respondents anticipated selling to non-family members (Bigelow et al., 2016; Bawa and Callahan, 2021). Because of the low turnover in farmland ownership, the importance of inheritance, and the high cost of land in many markets, access to farmland through tenancy is an important means of entering into agriculture or expanding existing operations (Bawa and Callahan, 2021). In 2017, only 35% of farm operators fully owned the land they operated (Figure 12A); 55% of farm operators are partial owners—or individuals who operate land they own in addition to land rented from others—and 10% are tenants—individuals that operate land they rent from others or worked on shares for others (USDA NASS, 2019, Appendix B pgs. 9–10; Supplementary Figure 12).
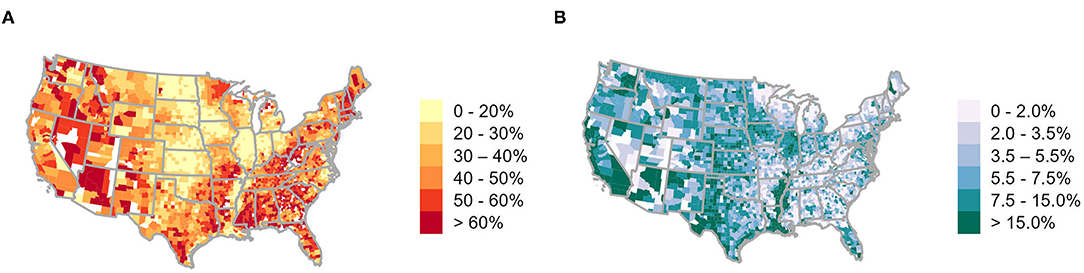
Figure 12. (A) Percent agricultural acres operated by principal producers who fully own the land they work in 2017. (B) Percent agricultural acres operated by principal producers who rent the land they operate (i.e., tenants) in 2017. Data: USDA NASS QuickStats.
Over 80% of rented land is owned by “non-operating landlords” (NOLs) who do not operate farms22. NOLs own over 40% of all agricultural land, over 50% of which was acquired through an inheritance or gift (Bigelow et al., 2016). These NOL-tenant relationships represent complex power dynamics over who primarily makes land use decisions and how these decisions are enacted. Some research indicates that tenant operators maintain significant control over how rented land is used, particularly when NOLs are women, of older age, do not have a background in farming, or reside far from the rented land (Petrzelka and Marquart-Pyatt, 2011; Eells and Soulis, 2013; Petrzelka et al., 2013; Barnett et al., 2020). Yet, in other cases, NOLs may enact power over their land through strict stipulations in their lease agreements that either promote or incentivize certain conservation practices, as well as increasing cash rent (Ranjan et al., 2019; Barnett et al., 2020). Such power dynamics further complicate the assumption that operators are “land rich” as they may either not own the land they operate or have influential power over how that land can be used.
The challenge of land access is exacerbated for non-white operators. Counties with higher rates of tenancy (and thus, lower rates of full land ownership) are also those with higher proportions of non-white and Hispanic identifying operators. For example, the Mississippi Portal, home to the majority of US operators identifying as Black, has some of the highest rates of tenancy in the US (Figure 12B). This region reports an average rate of tenancy of 20.1%, over double the national average of 9.5% of operations. The southwestern Fruitful Rim and Basin and Range regions, home to many of the operators that identify as Hispanic or American Indian, also has some of the highest rates of agricultural tenancy in the US23. While the national tenancy rate for non-white operators has declined through time, tenancy has consistently remained much higher for non-white operators than for white operators over the last century (Figure 13).24 In 2017, CoA data suggested that on average, non-white farmers owned 58.1% of the farms they operated as compared to 69.6% of white operators. This same data suggests non-white operators fully own 63.3% of non-white operated acreage, while white farmers fully own only 32.6% of white operated acreage. At the same time, non-white owner-operators represent only 10.2% of all land fully owned in farms in the US. This suggests that while white operators are more likely to own their farm, and non-white operators own a higher proportion of their operational acreage, white owner-operators control the lions' share (89.8%) of owned operational acreage in the US.
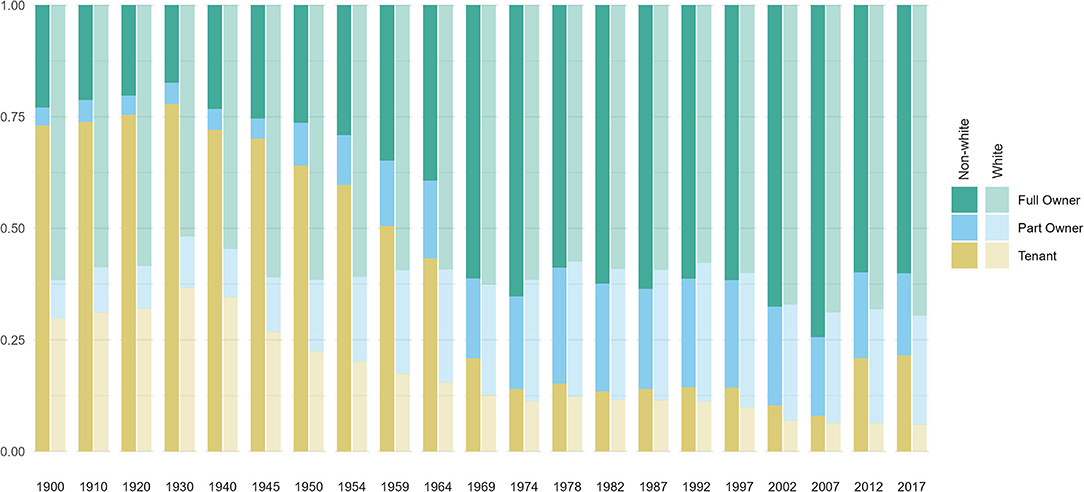
Figure 13. Proportion ownership of farms by race from 1900 to 2017. In each year the left column shows the proportion of farms owned and rented by non-white operators, and the right, by white operators. Due to data limitations (i.e., historical lack of intersectionality in data collection) we can only visualize white vs. all other races. Data: (Haines et al., 2018); distributed by ICSPR.
These rates of tenancy and complex land ownership dynamics imply that, for many farm operators, particularly those who are non-white, land is not a source of wealth but a significant production expense. For tenant operators and partial owners, agricultural land rent averages $126/acre for cropland, $216/acre for irrigated cropland, and $13 per acre for pastureland; these costs vary widely however, from an average of $35/acre in Oklahoma to $331/acre in California (USDA NASS, 2020; USDA NASS QuickStats). Finding farmland can be a challenge for anyone without family access to large acreages, particularly aspiring, beginning, and socially disadvantaged farmers (Ahearn, 2013; Ruhf, 2013; Calo and De Master, 2016; Ackoff et al., 2017). Securing long-term, stable access to land with infrastructure such as wells and buildings, proximity to markets and amenities, and with existing housing presents a particular challenge (Carlisle et al., 2019; Valliant and Freedgood, 2020). Productive agricultural land is an increasingly scarce commodity, and inflation-adjusted values of farmland in the US have tripled since the 1970s (USDA ERS, 2020b). In addition to systemically excluding aspiring farmers without access to sufficient relationships or capital (Pilgeram, 2019), these rising costs place a continuing financial burden on current owner operators (Prager et al., 2018).
Unprecedented Farm Debt
Taken together, the intersections of rising input costs, stagnant production values, commodity specialization, and challenges in land access have left farmers with unprecedented levels of farmer debt (Figure 14). Average farm debt is now at levels not seen since the 1980s Farm Crisis—a period of significant agricultural financial loss defined by plummeting commodity prices and export values (Barnett, 2000). According to the USDA ERS, farm operator households hold an average on-farm debt of $99 k and off-farm debt of $116 k (USDA ERS, 2021d). Much of this debt is related to real estate25 and is financed largely by federal loans (Figure 14; Supplementary Figures 13, 14).
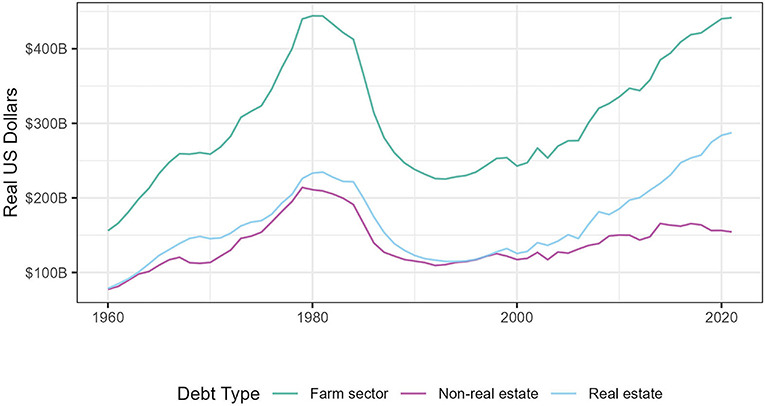
Figure 14. Rising farm sector debt, adjusted for inflation using the chain-type GDP deflator provided by the USDA ERS. Farm sector debt is all debt (real estate and non-real estate) accrued by the agricultural sector. See Supplementary Figures 13, 14 for breakdown of non-real estate and real estate debt. Data: (USDA ERS, 2021b).
Operators can borrow from several existing programs through the Farm Service Agency (FSA)—the USDA's lending arm—which provide loans at competitive interest rates. Despite programs that favor beginning and minority farmers, like the DIRECT and GUARANTEE programs, non-white borrowers are more likely to borrow lower loan amounts at higher interest rates relative to white borrowers (Escalante et al., 2018). Evidence suggests that Black farmers are still discriminated against by the FSA. Black farmers were denied USDA loans at higher rates than any other group in 2020 (25 vs. 8% in White Non-Hispanic applicants) (ibid.). A recent analysis of USDA data found that in 2020 only 37% of Black applicants were granted loans last year in one program that helps farmers pay for land, equipment and repairs; however, they accepted 71% of applications from white farmers (Bustillo, 2021)26. At the same time, Black-owned farmland and Black operators have declined disproportionately in the national aggregate over recent decades, which can be largely attributed to discrimination by lenders and equitable lack of access to government programs (Gilbert et al., 2002; Graddy-Lovelace, 2017; Orozco et al., 2018). The Biden administration's recent efforts to provide $4B in debt relief to minority farmers meant to address years of financial discrimination was met with strong resistance from banks concerned about profits and investors (Rappeport, 2021). Though this debt relief will ultimately help many farmers, access to future loans will likely remain a significant challenge for those historically excluded (Sewell, 2021).
Discussion
The data-driven narrative we present in this paper reflects the steep challenges facing US farm operator livelihoods. Today in the US, fewer and fewer people are operating larger and increasingly specialized farms (USDA NASS, 2019; Spangler et al., 2020). Though these farms are more productive than ever before, rising input costs, volatile production values, and rising land rents have left farmers with unprecedented levels of farm debt and negative median on-farm incomes. Nearly 40% of shrinking on-farm income already comes from federal programs supported by US taxpayers. As has been recognized and predicted by many agricultural social scientists, many operators have turned to off-farm work to secure their livelihoods, with an average of 75% of farm household income now earned off the farm. These trends imply that the value being produced by US farms is not being captured by the people who operate US farms. For many US farm operators, the indicators of a “good livelihood”—stability, security, equitable rewards for work—are largely absent, as indicated by the data we present on farm household income, tenancy, and farm closures.
Much work must be done to improve the sustainability, equity, and resilience of the US agricultural sector. This, of course, includes supporting initiatives to relieve debt of those who have faced structural discrimination, as well as supporting targeted loan programs, farmland trusts, and conservation easements for historically underrepresented populations to minimize the burden of acquiring sufficient capital to invest in land (Johnson, 2008; Beckett and Galt, 2013). Further, support for beginning farmer incubator and training programs (Niewolny and Lillard, 2010; Schreiner et al., 2018) and food sovereignty initiatives can help share important seed saving practices (Campbell and Veteto, 2015; Hoover, 2017), and promoting the need for agricultural social policies can improve crucial access to services such as health care and childcare essential to agricultural livelihoods (Becot and Inwood, 2020).
To these important efforts, we add the urgent need (1) to critically re-examine what and who we monitor through federal agricultural data, (2) to increase the accessibility and transparency of this data, and (3) to develop more robust (and intersectional) indicators of “livelihoods.” To our first point, perhaps the most troubling and frustrating aspect of this analysis was the lack of data describing the intersections of operator livelihoods with operator race, gender, and class. Though the USDA produces intersectional data at national scales (e.g., acres owned by race, experience differences by sex) and publishes them in CoA summaries, there are limited data available to assess the ways that access to land, credit, or government programs at state or county-scales intersect across various social identities and experiences. These data are essential to understanding and mitigating the current inequitable nature of access to land, labor, capital, and federal support. Though our focus was on farm operators, to this discussion we add that our understanding of farmworkers—the population of H2-A visa holders, US citizens, and illegal migrants who plant, harvest, and package the vast majority of our produce and livestock products—is also astonishingly limited. Previously published work (Minkoff-Zern and Sloat, 2017; Horst and Marion, 2019) and the work of countless advocacy organizations has established that that a fair return on agricultural labor is confined to the few people whose embodied and geographic privileges enable them to take advantage of economies of scale. Our inability to track, monitor, and highlight these inequities is a significant problem.
In addition to reporting intersectional data, we call for increased efforts to improve data availability. Data availability is one of the big challenges facing researchers, practitioners, and activists engaged in understanding and supporting sustainable agricultural livelihoods in the US. By data availability, we mean: (1) open access to clean datasets, linked to (2) clear, informative, and thorough metadata describing data collection and statistical adjustment methods used in building the final data product, provided at (3) spatial and temporal scales relevant to policy and management. We readily acknowledge that the institutions that currently curate and gatekeep our nation's publicly available agricultural data (e.g., USDA NASS, ERS, and US BEA) have the daunting task of collecting, aggregating, disseminating, and referencing their data products while at the same time managing projects and developing policies that address the complex challenges faced by the citizens they serve. We also acknowledge (and regularly use) many of the high-quality data products managed by these institutions such as the USDA's Cropland Data Layer—which provides researchers with high temporal and spatial resolution land cover data for the coterminous US—as well as the USDA's Farm and Ranch Irrigation Survey (FRIS), Water and Irrigation Management Survey (IWMS), and Agricultural Surveys, which along with the CoA provide the only comprehensive, openly available data on agricultural and irrigation activities linked to farm(er) characteristics across the US. When taken together, these data provide a fairly detailed narrative about US farmers and agricultural operations, but they still present important limitations. First, many of these data are limited by scale. For instance, FRIS/IWMS data is only aggregated and disseminated at the state-scale, but as recent studies demonstrate (Schumacher et al., 2022) the spatial and temporal variability in US irrigation at sub-state scales make state-level recommendations produced from typical aggregations erroneous and potentially harmful to farmers. In addition, these data products are also gatekept by US institutions, either financially in the case of the FRIS/IWMS27, or via repository infrastructure that is unintuitive at best, and entirely incoherent at worst. For instance, the NASSs Quickstats repository, which houses all USDA Survey and CoA data, is difficult to navigate because the unique codes built into its system are not attached to metadata and because of data download limits. This leaves even the most skillful data scientist searching across questionnaires and disparate USDA NASS publications and metadata28, to attempt to establish a clear understanding of the data they are accessing, cleaning, and analyzing.
Finally, these data reflect the limited ways in which we currently assess and measure agricultural livelihoods in terms of revenues, agricultural yield, and efficiency (e.g., state and national estimates of Total Factor Productivity). This narrow scope misses farm/farm worker wellbeing entirely. Although farm families' off-farm labor keeps many farms afloat, key indicators of family well-being, such as access to childcare (Rissing et al., 2021), health care (Inwood, 2017, see also Becot and Inwood, 2020), and family members' mental health (Fraser et al., 2005; Henning-Smith et al., 2021) remain persistent blind spots. We need more robust indicators than yield alone if agricultural futures are to be reimagined in truly sustainable and resilient ways (DeLonge and Basche, 2017).
This lack of accessible, intersectional, and inclusive data may exacerbate agricultural livelihoods by limiting our capacity to identify and track the drivers of livelihood challenges. Moving forward, we call for five specific axes of intervention:
1) the express and open (i.e., the elimination of gatekeeping) dissemination of fully referenced institutional data via clearly built repositories;
2) the aggregation and dissemination of national- and state-level datasets to the county-scale;
3) the publication of county-level intersectional data on farmer identity and farm characteristics;
4) the design of representative farm worker surveys sampling a greater proportion of the 2.5 M US farmworkers than that currently captured by NAWS; and
5) the imagining and building of more robust agricultural livelihood indicators.
This call requires US institutions to invest in personnel with the expertise to execute this massive revitalization and restructuring of institutionally held and disseminated data. It also calls for collaborative efforts between academics, policymakers, and agricultural stakeholders to imagine the data infrastructures necessary to monitor, support, and understand sustainable agricultural futures. Recognizing the work to be done, and the barriers to entry faced by researchers without a background in data science, we provide all raw and clean data and scripts in reproducible form at this project's GitHub (github.com/blschum/US-Farming-Data-Narrative). In so doing, we provide a novel resource, at the finest scale available to researchers, to guide future research into the economic viability and sustainability of US agriculture. We also provide a table of definitions for terms commonly used by US institutions to describe US agriculture to consolidate and elucidate institutional terminology that currently gatekeeps informed use of these data (Table 1, Supplementary Table 1).
Conclusions
The data narrative presented in this paper merges available data with related research and theory to paint a picture of the state of farm operator livelihoods in the US. Farm operators are largely white males over the age of fifty. Though many farm households have incomes comparable to the US average, much of this revenue comes from off-farm activities. On-farm revenues are often eclipsed by on-farm costs, meaning that in many regions of the US, farm operators pay to engage in the labor- and time-intensive act of operating a farm. Though data is limited, available literature and data indicates that this is only exacerbated for non-white, non-male farm operators.
Based on the data we review, we attribute this to rising input costs, shrinking production values, commodity specialization, and challenges in land access. Importantly, these factors are all connected to what is perhaps one of the most important drivers of declining operator livelihoods: a paradigm that prioritizes productivity and efficiency above other factors. As this narrative has shown, efficiency and productivity gains do not necessarily mean livelihood gains. Measuring and monitoring agricultural progress using only metrics of production (e.g., yields), efficiency (e.g., total factor productivity), and revenue (e.g., net farm income) masks the lived realities of the humans operating our farms.
To render this data both more accessible and visible, we have cleaned all data described in this paper, clearly documented meta-data, and provided links for download at our projects' GitHub repository. This is a first step toward increasing transparency surrounding the state of US operator livelihoods; however, additional work is needed in rethinking how we need to monitor and measure US agriculture moving forward. Meeting growing food demand while also preserving rural livelihoods and ecological integrity in a rapidly changing climate will require a significant reconceptualization of the ultimate goals of agriculture. These reconceptualizations can build from the proposed definition by the USDA of sustainable agricultural systems: satisfying human demand while also enhancing environmental quality, efficiently using natural resources, supporting farmer livelihoods, and enhancing quality of life for farmers and society as a whole. We applaud this and other reimaginings of the end-goal of agricultural systems that expand the production-centric paradigm to reposition agriculture as a force for positive, regenerative change for both people and planet. What is crucial now is to engage diverse people and perspectives in larger discussions about how to measure and monitor our progress toward these broader goals and crucially, how to align these goals with actual policy instruments to support a sustainable, adaptive transition.
Data Availability Statement
The original data are all publicly available and described in the Supplementary Material. To download clean versions of the data, visit https://github.com/blschum/US-Farming-Data-Narrative.
Author Contributions
BS and EB contributed equally to the conceptualization of the article. BS led the data construction and visualization. EB led the writing. KS and AR contributed to the writing and editing of the article. All authors contributed to the article and approved the submitted version.
Funding
EB and AR were supported in part by USDA National Institute of Food and Agriculture Grant No. 2020-67019-31157. KS was supported by National Science Foundation under Grant No. 1633756.
Author Disclaimer
Any opinions, findings, conclusions, or recommendations expressed in this publication are those of the authors and do not necessarily reflect the view of the U.S. Department of Agriculture.
Conflict of Interest
The authors declare that the research was conducted in the absence of any commercial or financial relationships that could be construed as a potential conflict of interest.
Publisher's Note
All claims expressed in this article are solely those of the authors and do not necessarily represent those of their affiliated organizations, or those of the publisher, the editors and the reviewers. Any product that may be evaluated in this article, or claim that may be made by its manufacturer, is not guaranteed or endorsed by the publisher.
Acknowledgments
We would like to thank Kathy Kassel, James MacDonald, Robert Hoppe, and their teams at the United States Department of Agriculture's Economic Research Service for their assistance with data collection. We would also like to thank our reviewers for their excellent feedback.
Supplementary Material
The Supplementary Material for this article can be found online at: https://www.frontiersin.org/articles/10.3389/fsufs.2021.795901/full#supplementary-material
Footnotes
1. ^Farm-level average net cash income of farms making less than $100k, nearly 82% of all US farms, ranged between -$2900 and $900 between 2012 and 2021 (USDA ERS, 2021e).
2. ^Though the current definition of farm operation has been in place since 1974, thereit was established in 1850 (US Department of Commerce, 1992). Though this limits our assessment of historical data provided by the USDA, we nevertheless include available data, noting limitations as relevant.
3. ^Direct comparisons between 2017 and other CoA years are complicated by changing definitions of farm operators/producers. In 2012, demographic information from up to three operators, and one designated principal operator were collected. In 2017, “operator” was replaced by “producer”, and the CoA, recognizing that multiple people may identify as principal operators, collected data on up to four producers, multiple of which may identify as principal producers. Prior to 2017 the principal operator (n = 1) self-identified, while in 2017, the principal operator equivalent, primary producer (n = 1) was chosen by designating either: (1) the person who makes the most decisions on the farm, or, if decisions are made equally, (2) the person who worked off the farm the least. Demographic data were not reported for primary producers in 2017, only for principal producers (n ≤ 4), thus, statistics for principal producers in 2017 are not directly comparable to any statistics in previous CoAs (USDA NASS, 2019, Appendix B pg. 20).
4. ^Throughout this paper we will use producer and operator interchangeably considering “producer” only replaced “operator” in the 2017 CoA. When referring to farm producers/operators, all reported farm(er) data refers to the n = 1 principal operators per farm operation through the 2012 CoA, and the n ≤ 4 principal producers per farm operation in 2017, unless otherwise stated. We recognize that changing definitions impact our ability to report shifts in farm(er) characteristics through time, but feel it is important to report all available data, acknowledging the data's limitations.
5. ^Of the data covering US farm workers, the National Agricultural Workers Survey (NAWS), which samples and interviews between 1500 and 3600 workers each year, is the most representative survey; NAWS does not, however, cover the population of over 250k H-2A farmworker visa holders. (USDL, NAWS).
6. ^In 2017, oilseed and grain farming comprised 15.9% of farms, vegetable and melon farming 2.2%, fruit and tree nut farming 4.7%, cattle ranging and farming 31.4%, and poultry and egg production 2.2% (Tables 48 and 75 of USDA NASS, 2019).
7. ^State-level NAICS data is only available for the total farms (“Table 44. Farms by North American Industry Classification System”) in each category, not any other operational characteristics. Even then, NAICS classification cannot be conflated with what, exactly, growers cultivate/raise on their farms (e.g., “cotton farming (NAICS 11192)” growers report corn, wheat, tobacco, etc. sales), or for that matter, how they make their livelihoods.
8. ^Thus, all bins include nearly the same number of observations, ensuring equal spatial representation across quantitative categories. Note that this binning methodology can place similar features in adjacent classes, or place widely different features in the same class.
9. ^While these categories falsely and problematically collapse multiple racial categories into a white-centered binary, the racial categories used across datasets included in this paper are inconsistent. Thus, condensing them into “white” and “non-white” allows for maximum data usage and comparison. This precedent has been set in recent literature (see Horst and Marion, 2019). Racial categories listed in the 2017 CoA are as follows: Black or African American, Asian, American Indian or Native Alaskan, Native Hawaiian or other Pacific Islander, White; where respondents are able to answer more than one race (USDA NASS, 2019).
10. ^Operators identifying as Black are now heavily concentrated in the Southeastern US (Figure 4A), particularly in Mississippi (12.9% of 36k reporting operators), Louisiana (7.0% of 37k reporting), South Carolina (6.7% of 33k reporting), and Alabama (6.6% of 54k reporting). Despite this heavy concentration, the raw numbers of farmers identifying as Black remains quite small, rising to 5,167 in GA, 5,669 in LA, 3,740 in NC, 4,757 in SC, 7,677 in AL, 20, 791 in TX, and 4,237 in FL in 2017. Black operated acres are also strongly concentrated here, with 5.3% of acreage in MS, 3.9% in SC, 3.7% in AL, and 2.3% in LA. Black operations are also strongly concentrated here, with 13.7% of operations in MS, 7.7% in LA, 7.1% in SC, and 4.5% in GA. Black operators also manage more acreage in these states than elsewhere in the US, but the operated acreage does not match the number of operators. For example, in Mississippi, nearly 13% of operators identify as Black, but Black individuals operate only 5.2% of agricultural acreage (Supplementary Figure 7A).
11. ^8.3% (of 70k reporting) of operators identifying as Hispanic in Florida, 23.4% (of 44k reporting) in New Mexico, 10.2% (of 110k reporting) in California, and 9.1% (of 368k reporting) in Texas (Supplementary Figure 7B). Hispanic operated acres are also strongly concentrated along the Fruitful Rim, with 5.8% of acreage in Florida, 12.7% in NM, 8.9% in CA, and 6.1% in TX. Hispanic operations are also strongly concentrated along the Fruitful Rim, with 9.4% of operations in Florida, 24.8% in NM, 12.3% in CA, and 10.4% in TX.
12. ^These operators operate largely in Arizona (54.9% of 27k reporting operators), New Mexico (16.0% of 44k reporting), and Oklahoma (8.9% of 108k reporting).
13. ^Note these data are biased low compared to USDA estimates because the BLS Quarterly Census of Employment and Wages counts only employees covered by unemployment insurance (James MacDonald, personal communication on June 2, 2021).
14. ^There are large differences in the number of counties reporting negative net incomes across FRRs; for instance, only 5.5% of counties reported net negative incomes in US Heartland, while 62.0% reported net negative incomes in the Basin and Range in 2017 (Supplementary Table 2).
15. ^According to the BEA metadata, production expenses include: purchases of feed, livestock and poultry, seed, fertilizer, agricultural chemicals and lime, and petroleum products; labor expenses; machinery rental and custom work; animal health costs; and all other expenses including depreciation.
16. ^In 2020, a near-record year for farm subsidies, government payments supplied 40% of net farm incomes nationally; That's double what direct payments represent during the average year (e.g., 15.3% in 2017, 16.9% in 2018). These direct government payments, which stem mainly from COVID-19 related relief, were projected to decrease by over $20B in 2021 compared to 2020. (USDA ERS, 2021a).
17. ^Our discussion of agricultural efficiency here examines inputs and yields; calculations examining energy inflows and outflows reach different conclusions regarding the relative efficiency of input intensive production (Akram-Lodhi, 2021). When accounting for the full suite of agricultural energy inputs (including the fossil fuel required to run machines and produce pesticides and fertilizers), human-powered agricultural production is much more efficient than the mechanized systems discussed here.
18. ^This includes seed, fertilizer, manure, chemicals, fuel, replacement, nonland capital, repairs, capital recovery, paid and unpaid labor, land rent, operating capital, general farm overhead, taxes, and insurance.
19. ^One investigative report finds that for John Deere, a major producer of US farm equipment, and its dealerships, parts and services are three to six times more profitable than sales of original equipment.
20. ^Data compiled (github.com/blschum/US-Farming-Data-Narrative/commodities-per-farm.xlxs) from “Table 1. Historical Highlights: 2017 and Earlier Census Years” of the CoA (USDA NASS, 2019).
21. ^These include wheat, corn, sorghum, barley, oats, seed cotton, long- and medium-grain rice, certain pulses, soybeans/other oilseeds, and peanuts.
22. ^Though these individuals are not the focus of this study, it is important to note that though the USDA captures NOLs in their Tenure, Ownership and Transition of Agricultural Land (TOTAL) surveys, information on this group of landowners is extremely limited. According to the 2014 TOTAL survey, the USs 1.9M NOLs owned over 283M agricultural acres. Unsurprisingly, the majority of these NOLs are white and male (though 37% of non-operator principal landlords are female), and the majority of acres are controlled by someone over the age of 65 (76% and 63% of land owned by female and male non-operators, respectively) (Bigelow et al., 2016).
23. ^For instance, in San Juan County, NM 67.2% of principal operators identified as renters in 2017 and 62.0% of operators identified as American Indian or Alaskan Native.
24. ^Of the land in farms operated by POC (about 7% of all agricultural land), the vast majority is owned.
25. ^Real estate debt represents loans for the purchase of farmland and buildings (i.e., mortgages), and FSA Storage Facility Loans, and excludes all debt for farm operators' dwellings. Non-real estate debt covers all other debt (e.g., production loans, loans for machinery and equipment, emergency loans, breeding livestock loans). (Carrie Litkowski, USDA ERS, personal communication on August 26, 2021).
26. ^These rates are linked to both property appraisal values and FSA program participation; however, to our knowledge data are not publicly available describing the intersections of race with these factors.
27. ^Grower-level irrigation data exists behind a literal paywall (1 year of access costs $5 k).
28. ^We have had to reach out to multiple USDA employees to clarify definitions, data types, and sources included in this manuscript that we could not find in any available USDA sources.
References
Abson, D. J., Fraser, E. D., and Benton, T. G. (2013). Landscape diversity and the resilience of agricultural returns: A portfolio analysis of land-use patterns and economic returns from lowland agriculture. Agric. Food Security 2, 2. doi: 10.1186/2048-7010-2-2
Ackoff, S., Bahrenburg, A., and Shute, L. L. (2017). Building a future with farmers II: Results and recommendations from the National Young Farmer Survey. Retrieved from National Young Farmers Coalition. Available online at: https://www.youngfarmers.org/resource/building-a-future-with-farmers-ii/ (accessed May 1, 2021).
Aguilar, J., Gramig, G. G., Hendrickson, J. R., Archer, D. W., Forcella, F., and Liebig, M. A. (2015). Crop species diversity changes in the United States: 1978–2012. PLoS ONE 10, e0136580. doi: 10.1371/journal.pone.0136580
Ahearn, M. (2013). Beginning farmers and ranchers at a glance (Economic Brief No. EB-22). Retrieved from the U.S. Department of Agriculture Economic Research Service. Available online at: https://www.ers.usda.gov/publications/pub-details/?pubid=42876 doi: 10.2139/ssrn.2266443 (accessed May 1, 2021).
Akram-Lodhi, A. H. (2021). The ties that bind? Agroecology and the agrarian question in the twenty-first century. J. Peasant Stud. 48, 687–714. doi: 10.1080/03066150.2021.1923010
Akram-Lodhi, A. H., and Kay, C. (2010a). Surveying the agrarian question (part 2): current debates and beyond. J. Peasant Stud. 37, 255–284. doi: 10.1080/03066151003594906
Akram-Lodhi, A. H., and Kay, C. (2010b). Surveying the agrarian question (part 1): unearthing foundations, exploring diversity. J. Peasant Stud. 37, 177–202. doi: 10.1080/03066150903498838
Allan, E., Manning, P., Alt, F., Binkenstein, J., Blaser, S., Blüthgen, N., et al. (2015). Land use intensification alters ecosystem multifunctionality via loss of biodiversity and changes to functional composition. Ecol. Lett. 18, 834–843. doi: 10.1111/ele.12469
Allen, P., and Sachs, C. (2007). Women and food chains: the gendered politics of food. Int. J. Sociol. Food Agric. 15, 1–23. doi: 10.48416/ijsaf.v15i1.424
Ayazi, H., and Elsheikh, E. (2015). The US Farm Bill: Corporate Power and Structural Racialization in the US Food System. Available online at: https://escholarship.org/uc/item/55v6q06x (accessed May 1, 2021).
Baines, J. (2015). Fuel, feed and the corporate restructuring of the food regime. J. Peasant Stud. 42, 295–321. doi: 10.1080/03066150.2014.970534
Barlett, P. F. (1989). “Industrial agriculture,” in Economic Anthropology, ed S. Plattner (Palo Alto, CA: Stanford University Press), 253–291.
Barnett, B. J. (2000). The U.S. farm financial crisis of the 1980s. Agric. History 74, 366–380. Available online at: https://www.jstor.org/stable/3744858
Barnett, M. J., Spangler, K., Petrzelka, P., and Filipiak, J. (2020). Power dynamics of the non-operating landowner-renter relationship and conservation decision-making in the Midwestern United States. J. Rural Stud. 78, 107–114. doi: 10.1016/j.jrurstud.2020.06.026
Bawa, S. G., and Callahan, S. (2021). Absent landlords in agriculture – a statistical analysis. USDA, 35.
Beckett, J., and Galt, R. E. (2013). Land trusts and beginning farmers' access to land: exploring the relationships in coastal California. J. Agric. Food Syst. Commun. Dev. 4, 19–35. doi: 10.5304/jafscd.2014.042.008
Becot, F. A., and Inwood, S. M. (2020). The case for integrating household social needs and social policy into the international family farm research agenda. J. Rural Stud. 77, 185–198. doi: 10.1016/j.jrurstud.2020.05.005
Bernstein, H. (1994). “Agrarian classes in capitalist development,” in Capitalism and Development, ed L. Sklair (London: Routledge), 40–71. doi: 10.4324/9780203201961_chapter_3
Bigelow, D., Allison, B., and Todd, H. (2016). US Farmland Ownership, Tenure, and Transfer, EIB-161, U.S. Department of Agriculture, Economic Research Service. Available online at: https://www.ers.usda.gov/publications/pub-details/?pubid=74675 (accessed September 19, 2021).
Bouët, A., and Laborde, D. (2017). US Trade Wars with Emerging Countries in the 21st Century: Make America and Its Partners Lose Again (SSRN Scholarly Paper ID 3029615). Social Science Research Network. Available online at: https://papers.ssrn.com/abstract=3029615 (accessed May 1, 2021).
Brenner, R. (1976). Agrarian class structure and economic development in pre-industrial Europe. Past Present 70, 30–75. doi: 10.1093/past/70.1.30
Bustillo, X. (2021). ‘Rampant issues': Black farmers are still left out at USDA. POLITICO. Available online at: https://www.politico.com/news/2021/07/05/black-farmers-left-out-usda-497876 (accessed September 1, 2021).
Buttel, F. H. (2006). “Sustaining the unsustainable: agro-food systems and environment in the modern world,” in Handbook of Rural Studies, eds P. J. Cloke, T. Marsden, and P. Mooney (New York, NY: Sage Publications), 213–229. doi: 10.4135/9781848608016.n15
Byres, T. J. (1995). Political economy, the agrarian question and the comparative method. J. Peasant Stud. 22, 561–580. doi: 10.1080/03066159508438589
Calo, A., and De Master, K. (2016). After the incubator: factors impeding land access along the path from farmworker to proprietor. J. Agric. Food Syst. Commun. Dev. 6, 1–17. doi: 10.5304/jafscd.2016.062.018
Campbell, B. C., and Veteto, J. R. (2015). Free seeds and food sovereignty: anthropology and grassroots agrobiodiversity conservation strategies in the US South. J. Polit. Ecol. 22, 445–465. doi: 10.2458/v22i1.21118
Carlisle, L., de Wit, M. M., DeLonge, M. S., Calo, A., Getz, C., Ory, J., et al. (2019). Securing the future of US agriculture: The case for investing in new entry sustainable farmers. Elementa 7, 17. doi: 10.1525/elementa.356
Carolan, M. (2020). Automated agrifood futures: robotics, labor and the distributive politics of digital agriculture. J. Peasant Stud. 47, 184–207. doi: 10.1080/03066150.2019.1584189
Cassman, K. G. (1999). Ecological intensification of cereal production systems: Yield potential, soil quality, and precision agriculture. Proc. Natl. Acad. Sci. 96, 5952–5959. doi: 10.1073/pnas.96.11.5952
Chayanov, A. (1966). The Theory of Peasant Economy, eds D. Thorner, R. E. F. Smith, and B. Kerblay, Published for the American Economic Association by R. D. Irwin. Madison, WI: University of Wisconsin Press.
Clapp, J. (2021). The problem with growing corporate concentration and power in the global food system. Nat. Food 2, 404–408. doi: 10.1038/s43016-021-00297-7
Clark, M., and Tilman, D. (2017). Comparative analysis of environmental impacts of agricultural production systems, agricultural input efficiency, and food choice. Environ. Res. Lett. 12, 064016. doi: 10.1088/1748-9326/aa6cd5
Cochrane, W. W. (1993). The Development of American Agriculture: A Historical Analysis, 2nd Edn. Minneapolis: University of Minnesota Press.
Conger, R. (2020). Families in Troubled Times: Adapting to Change in Rural America. London: Routledge. doi: 10.4324/9781003058809
Congressional Research Service (CRS) (2021). U.S. Farm Income Outlook: February 2020 Forecast. Available online at: https://crsreports.congress.gov/product/pdf/R/R46249 (accessed June 1, 2021).
Coomes, O. T., Barham, B. L., MacDonald, G. K., Ramankutty, N., and Chavas, J.-P. (2019). Leveraging total factor productivity growth for sustainable and resilient farming. Nat. Sust. 2, 22–28. doi: 10.1038/s41893-018-0200-3
Crossley, M., Burke, K., Schoville, S., and Radeloff, V. (2020). Recent collapse of crop belts and declining diversity of US agriculture since 1840. Glob. Change Biol. 27, 151–164. doi: 10.1111/gcb.15396
Daniel, P. (2013). Dispossession: Discrimination against African American Farmers in the Age of Civil Rights. Chapel Hill, NC: UNC Press Books.
Davis, D. R., Epp, M. D., and Riordan, H. D. (2004). Changes in USDA Food Composition Data for 43 Garden Crops, 1950 to 1999. J. Am. Coll. Nutr. 23, 669–682. doi: 10.1080/07315724.2004.10719409
DeLonge, M., and Basche, A. (2017). Leveraging agroecology for solutions in food, energy, and water. Elementa Sci. Anthropocene 5, 6. doi: 10.1525/elementa.211
Dimitri, C., Effland, A., and Conklin, N. (2005). The 20th Century Transformation of U.S. Agriculture and Farm Policy. Available online at: https://www.ers.usda.gov/publications/pub-details/?pubid=44198 (accessed May 1, 2021).
Eells, J.C., and Soulis, J. (2013). Do women farmland owners count in agricultural: a review of research on women farmland owners in the United States. J. Soil Water Conserv. 68, 121A−123A. doi: 10.2489/jswc.68.5.121A
Escalante, C. L., Osinubi, A., Dodson, C., and Taylor, C. E. (2018). Looking beyond farm loan approval decisions: loan pricing and nonpricing terms for socially disadvantaged farm borrowers. J. Agric. Appl. Econ. 50, 129–148. doi: 10.1017/aae.2017.25
EWG (2021). Environmental Working Group Farm Subsidy Database. Available online at: https://farm.ewg.org/ (accessed May 1, 2021).
Fagundes, C., Picciano, L., Tillman, W., Mleczko, J., Schwier, S., Graddy-Lovelace, G., et al. (2020). Ecological costs of discrimination: racism, red cedar and resilience in farm bill conservation policy in Oklahoma. Renew. Agric. Food Syst. 35, 420–434. doi: 10.1017/S1742170519000322
Farm Bureau (2016). Options for Updating Bases and Yields. Farm Bureau: 2018 Farm Bill. Washington, DC: Farm Bureau. Available online at: https://www.fb.org/files/2018FarmBill/Options_for_Updating_Bases_and_Yields.pdf
Fitzgerald, D. (1991). Beyond tractors: the history of technology in American agriculture. technology and culture, 32, 114-26 ST-beyond tractors: the history of technology. Technol. Cult. 32, 114–126. doi: 10.2307/3106015
Fraser, A. (2018). Land grab/data grab: precision agriculture and its new horizons. J. Peasant Stud. 6150, 1–20. doi: 10.31235/osf.io/9utyh
Fraser, C. E., Smith, K. B., Judd, F., Humphreys, J. S., Fragar, L. J., and Henderson, A. (2005). Farming and mental health problems and mental illness. Int. J. Soc. Psychiatry 51, 340–349. doi: 10.1177/0020764005060844
Friedmann, H. (1978). World market, state, and family farm: social bases of household production in the era of wage labor. Compar. Stud. Soc. History 20, 545–586. doi: 10.1017/S001041750001255X
Ghimire, J., Escalante, C., Ghimire, R., and Dodson, C. (2020). Do farm service agency borrowers' double minority labels lead to more unfavorable loan packaging terms? Agric. Finance Rev. doi: 10.1108/AFR-03-2020-0038
Gilbert, J., Sharp, G., and Felin, S. M. (2002). The loss and persistence of black-owned farms and farmland: a review of the research literature and its implications. Southern Rural Sociol. 18, 1–30. Available online at: https://egrove.olemiss.edu/jrss/vol18/iss2/1
Goodman, D., Sorj, B., and Wilkinson, J. (1987). From Farming to Biotechnology: A Theory of Agro-Industrial Development. Oxford: Basil Blackwell.
Graddy-Lovelace, G. (2017). The coloniality of US agricultural policy: articulating agrarian (in)justice. J. Peasant Stud. 44, 78–99. doi: 10.1080/03066150.2016.1192133
Haines, M., Fishback, P., and Rhode, P. (2018). United States Agriculture Data, 1840 - 2012. Inter-university Consortium for Political and Social Research (35206) [distributor].
Hendricks, N. P., Sinnathamby, S., Douglas-Mankin, K., Smith, A., Sumner, D. A., and Earnhart, D. H. (2014). The environmental effects of crop price increases: nitrogen losses in the U.S. Corn Belt. J. Environ. Econo. Manag. 68, 507–526. doi: 10.1016/j.jeem.2014.09.002
Hendrickson, M. K., Heffernan, W. D., Howard, P., and Heffernan, J. (2002). Consolidation in food retailing and dairy. Br. Food J. 103, 715–728. doi: 10.1108/00070700110696742
Hendrickson, M. K., and James, H. S. Jr. (2005). The ethics of constrained choice: How the industrialization of agriculture impacts farming and farmer behavior. J. Agric. Environ. Ethics 18, 269–291. doi: 10.1007/s10806-005-0631-5
Henning-Smith, C., Alberth, A., Bjornestad, A., Becot, F., and Inwood, S. (2021). Farmer mental health in the US Midwest: key informant perspectives. J. Agromed. 27, 1–10. doi: 10.1080/1059924X.2021.1893881
Hoover, E. (2017). “You can't say you're sovereign if you can't feed yourself”: defining and enacting food sovereignty in American Indian community gardening. Am. Indian Cult. Res. J. 41, 31-70. doi: 10.17953/aicrj.41.3.hoover
Horst, M., and Marion, A. (2019). Racial, ethnic and gender inequities in farmland ownership and farming in the U.S. Agric. Hum. Values 36, 1–16. doi: 10.1007/s10460-018-9883-3
Howard, P. H. (2016). Concentration and Power in the Food System: Who Controls What We Eat? London: Bloomsbury Publishing. doi: 10.5040/9781474264365
Inwood, S. (2013). Social Forces and Cultural Factors Influencing Farm Transition. Choices: The Magazine of Food, Farm and Resource Issues, 28, 1–5.
Inwood, S. (2017). Agriculture, health insurance, human capital and economic development at the rural-urban-interface. J. Rural Stud. 54, 1–14. doi: 10.1016/j.jrurstud.2017.05.009
Janssen, B. (2018). Small Farms, big plans: mechanization and specialization as measures of “The Middle.” Cult. Agric. Food Environ. 40, 96–104. doi: 10.1111/cuag.12221
Johnson, K. (2008). Conserving farmland in California: For what and for whom? How agricultural conservation easements can keep farmland farmed. Sust. Dev. Law Policy. 9, 45–75.
Kautsky, K. (1983). “The agrarian question,” in Karl Kautsky: Selected Political Writings, eds P. Goode (London: The MacMillan Press Ltd.), 1–14.
Keller, J. C. (2014). “I Wanna Have My Own Damn Dairy Farm!”: women farmers, legibility, and femininities in rural Wisconsin, US. J. Rural Soc. Sci. 29, 4. Available online at: https://egrove.olemiss.edu/jrss/vol29/iss1/4
Klocker, N., Dun, O., Head, L., and Gopal, A. (2020). Exploring migrants' knowledge and skill in seasonal farm work: More than labouring bodies. Agric. Hum. Values37, 463–478. doi: 10.1007/s10460-019-10001-y
Kohl, S. B., and Bennett, J. W. (1982). “The agrifamily household,” in Of Time and the Enterprise: North American Family Farm Management in the Context of Resource Marginality, ed J. Bennett (Minneapolis, MN: University of Minnesota Press), 148–171.
Lark, T. J., Salmon, J. M., and Gibbs, H. K. (2015). Cropland expansion outpaces agricultural and biofuel policies in the United States. Environ. Res. Lett. 10, 044003. doi: 10.1088/1748-9326/10/4/044003
Lenin, V. I. (1956). The Development of Capitalism in Russia: The Process of the Formation of a Home Market for Large-Scale Industry. London: Foreign Languages Pub. House.
Lobao, L., and Meyer, K. (2001). The great agricultural transition: Crisis, change, and social consequences of twentieth century US farming. Annu. Rev. Sociol. 27, 103–124. doi: 10.1146/annurev.soc.27.1.103
MacDonald, J. M., Hoppe, R. A., and Newton, D. (2018). Three Decades of Consolidation in US Agriculture, Economic Information Bulletin Number 189, USDA ERS. Available online at: https://www.ers.usda.gov/publications/pub-details/?pubid=88056/ (accessed May 1, 2021).
Mann, S. (1990). Agrarian Capitalism in Theory and Practice. Chapel Hill, NC: University of North Carolina Press.
Mann, S. A., and Dickinson, J. M. (1978). Obstacles to the development of a capitalist agriculture. J. Peasant Stud. 5, 466–481. doi: 10.1080/03066157808438058
Marx, K. (1995). Capital: A New Abridgement. Edited by David McLellan. Oxford: Oxford University Press.
Mayer, A. (1997). Historical changes in the mineral content of fruits and vegetables. Br. Food J. 99, 207–211. doi: 10.1108/00070709710181540
McMichael, P. (2009). A food regime genealogy. J. Peasant Stud. 36, 139–169. doi: 10.1080/03066150902820354
Minkoff-Zern, L.-A. (2019). The New American Farmer: Immigration, Race, and the Struggle for Sustainability. MIT Press. doi: 10.7551/mitpress/11263.001.0001
Minkoff-Zern, L.-A., and Sloat, S. (2017). A new era of civil rights? Latino immigrant farmers and exclusion at the United States Department of Agriculture. Agric. Hum. Values 34, 631–643. doi: 10.1007/s10460-016-9756-6
Narotzky, S. (2016). Where have all the peasants gone? Ann. Rev. Anthropol. 45, 301–318. doi: 10.1146/annurev-anthro-102215-100240
National Center for Farmworker Health (2020). “Facts About Agricultural Workers”. Available online at: http://www.ncfh.org.
Nelson, K. S., and Burchfield, E. K. (2021). Landscape complexity and US crop production. Nat. Food 2, 330–338. doi: 10.1038/s43016-021-00281-1
Newton, J. (2017). Modernizing Base Acres. Market Intel. Farm Bureau. Available online at: https://www.fb.org/market-intel/modernizing-base-acres (accessed May 1, 2021).
Niewolny, K. L., and Lillard, P. T. (2010). Expanding the boundaries of beginning farmer training and program development: areview of contemporary initiatives to cultivate a new generation of American farmers. J. Agric.Food Syst. Commun. Dev. 1, 65–88. doi: 10.5304/jafscd.2010.011.010
Nigatu, G., Badau, F., Seeley, R., and Hansen, J. (2020). Factors Contributing to Changes in Agricultural Commodity Prices and Trade for the United States and the World. Available online at: https://www.ers.usda.gov/webdocs/publications/95697/err-272.pdf?v=5113.6 (accessed July 1, 2021).
Orozco, A. A., Ward, A., and Graddy-Lovelace, G. (2018). Documenting USDA discrimination: community-partnered research on farm policy for land justice. ACME Int. J. Crit. Geogr. 17, 999–1023. Retrieved from: https://acme-journal.org/index.php/acme/article/view/1514
Paxson, H. (2013). The Life of Cheese: Crafting Food and Value in America. Berkeley, CA: University of California Press. doi: 10.1525/9780520954021
Perrin, A., Milestad, R., and Martin, G. (2020). Resilience applied to farming: organic farmers' perspectives. Ecol. Soc. 25, 5. doi: 10.5751/ES-11897-250405
Petersen-Rockney, M., Baur, P., Guzman, A., Bender, S. F., Calo, A., Castillo, F., et al. (2021). Narrow and brittle or broad and nimble? Comparing adaptive capacity in simplifying and diversifying farming systems. Front. Sust. Food Syst. 5, 56. doi: 10.3389/fsufs.2021.564900
Petrzelka, P., Ma, Z., and Malin, S. (2013). The Elephant in the room: absentee landowner issues in conservation and land management. Land Use Pol. 30, 157–166. doi: 10.1016/j.landusepol.2012.03.015
Petrzelka, P., and Marquart-Pyatt, S. (2011). Land tenure in the U.S.: power, gender, and consequences for conservation decision making. Agric. Hum. Values 28, 549–560. doi: 10.1007/s10460-011-9307-0
Phalan, B., Green, R., and Balmford, A. (2014). Closing yield gaps: Perils and possibilities for biodiversity conservation. Philos. Trans. R. Soc. B Biol. Sci. 369, 20120285. doi: 10.1098/rstb.2012.0285
Pilgeram, R. (2019). “How Much Does Property Cost Up There?”: exploring the relationship between women, sustainable farming, and rural gentrification in the US. Soc. Nat. Resour. 32, 911–927. doi: 10.1080/08941920.2018.1530818
Pilgeram, R., Katherine, D., Paul, L., and Kelsey, C. (2020). How the USDA changed the way women farmers are counted in the census of agriculture. Choices 35, 1–6.
Prager, D. L., Tulman, S., and Durst, R. (Eds.). (2018). Economic Returns to Farming for U.S. Farm Households. doi: 10.22004/ag.econ.276224
Ranjan, P., Wardropper, C.B., Eanes, F.R., Reddy, S.M.W., Harden, S.C., Masuda, Y.J., et al. (2019). Understanding barriers and opportunities for adoption of conservation practices on rented farmland in the US. Land Use Pol. 80, 214–223. doi: 10.1016/j.landusepol.2018.09.039
Rappeport, A. (2021). Banks Fight $4 Billion Debt Relief Plan for Black Farmers. The New York Times. Available online at: https://www.nytimes.com/2021/05/19/us/politics/black-farmers-debt-relief.html (accessed July 1, 2021).
Reinhardt, N., and Barlett, P. (1989). The persistence of family farms in united states agriculture. Sociol. Ruralis 29, 203–225. doi: 10.1111/j.1467-9523.1989.tb00367.x
Rissing, A. (2021). “We feed the world”: the political ecology of the Corn Belt's driving narrative. J. Polit. Ecol. 28, 471–487. doi: 10.2458/jpe.2959
Rissing, A., Inwood, S., and Stengel, E. (2021). The invisible labor and multidimensional impacts of negotiating childcare on farms. Agric. Hum. Values 38, 431-447. doi: 10.1007/s10460-020-10162-1
Roberts, M. J., and Schlenker, W. (2009). World supply and demand of food commodity calories. Am. J. Agric. Econ. 91, 1235–1242. doi: 10.1111/j.1467-8276.2009.01290.x
Roberts, M. J., and Schlenker, W. (2013). Identifying supply and demand elasticities of agricultural commodities: implications for the US ethanol mandate. Am. Econ. Rev. 103, 2265–2295. doi: 10.1257/aer.103.6.2265
Rosenfeld, R. A. (1987). Farm Women: Work, Farm and Family in the United States. Chapel Hill, NC: University of North Carolina Press. doi: 10.2307/2071253
Ruhf, K. (2013). Access to farmland: a systems change perspective. J. Agric. Food Syst. Commun. Dev. 4, 1–10. doi: 10.5304/jafscd.2013.041.006
Sachs, C. E. (1983). The Invisible Farmers: Women in Agricultural Production, 1st Edn. Lanham, MD: Rowman and Littlefield Pub Inc.
Sachs, C. E. (1996). Gendered Fields: Rural Women, Agriculture, and Environment. Boulder, CO: Westview Press.
Schnepf, R., and Rosch, S. (2020). U.S. Farm Income Outlook: December 2020 Forecast. 39. Available online at: https://crsreports.congress.gov/product/pdf/R/R46676 (accessed July 1, 2021).
Schreiner, L., Levkoe, C., and Schumilas, T. (2018). Categorizing practical training programs for new farmers: a North American scan. J. Agric. Food Syst. Commun. Dev. 8, 9–17. doi: 10.5304/jafscd.2018.082.012
Schumacher, B. L., Yost, M. A., Burchfield, E. K., and Allen, N. (2022). Water in the West: trends, production efficiency, and a call for open data. J Environ. Manag. 306, 114330.
Sewell, S. (2021). ‘Not what it was sold to be': Why promised debt relief will affect hardly any Black farmers. The Guardian. Available online at: http://www.theguardian.com/us-news/2021/aug/20/black-indigenous-farmers-were-promised-reparations-debt-relief-all-but-four-farmers-are-still-waiting (accessed July 1, 2021).
Snipes, S. A., Cooper, S. P., and Shipp, E. M. (2017). “The Only Thing I Wish I Could Change Is That They Treat Us Like People and Not Like Animals”: injury and discrimination among latino farmworkers. J. Agromed. 22, 36–46. doi: 10.1080/1059924X.2016.1248307
Soper, R. (2020). How wage structure and crop size negatively impact farmworker livelihoods in monocrop organic production: Interviews with strawberry harvesters in California. Agric. Hum. Values 37, 325–336. doi: 10.1007/s10460-019-09989-0
Spangler, K., Burchfield, E. K., and Schumacher, B. (2020). Past and current dynamics of U.S. agricultural land use and policy. Front. Sust. Food Syst. 4, 98. doi: 10.3389/fsufs.2020.00098
Tilman, D., Balzer, C., Hill, J., and Befort, B. L. (2011). Global food demand and the sustainable intensification of agriculture. Proc. Natl. Acad. Sci. U. S. A. 108, 20260–20264. doi: 10.1073/pnas.1116437108
Tscharntke, T., Clough, Y., Wanger, T. C., Jackson, L., Motzke, I., Perfecto, I., et al. (2012). Global food security, biodiversity conservation and the future of agricultural intensification. Biol. Conserv. 151, 53–59. doi: 10.1016/j.biocon.2012.01.068
US BEAa Gross Domestic Product (GDP), “CAGDP1: GDP Summary by County and MSA” and “CAGDP2: GDP in Current Dollars by County and MSA”. Available online at: https://apps.bea.gov/regional/downloadzip.cfm (accessed May 1 2021).
US BEAb Personal Income (State and Local), “CAEMP25N: Total Full-Time and Part-Time Employment by NAICS Industry” & “CAEMP25S: Total Full-Time and Part-Time Employment by SIC Industry”. Available online at: https://apps.bea.gov/regional/downloadzip.cfm (accessed May 1 2021).
US BEAc Personal Income (State and Local), “CAINC5N: Personal Income by Major Component and Earnings by NAICS Industry” & “CAINC5S: Personal Income by Major Component and Earnings by SIC Industry”. Available online at: https://apps.bea.gov/regional/downloadzip.cfm (accessed May 1 2021).
US BEAd Personal Income (State and Local), “CAINC45: Farm Income and Expenses”. Available online at: https://apps.bea.gov/regional/downloadzip.cfm (accessed May 1 2021).
US BEAe Regional Economic Accounts: Regional Definitions. Available online at: https://apps.bea.gov/regional/definitions/ (accessed July 1, 2021).
US Department of Commerce (1992). 1987 Census of Agriculture. Volume 2, Subject Series, Part 4: History, AC87-S-4. Available online at: http://agcensus.mannlib.cornell.edu/AgCensus/.
USDA ERS (2000). Farm Resource Regions. Agricultural Information Bulletin 760. Washington, DC: USDA Economic Research Service. Available online at: https://www.ers.usda.gov/webdocs/publications/42298/32489_aib-760_002.pdf?v=42487 (accessed February 1, 2021).
USDA ERS (2020a). “Ag and Food Sectors and the Economy”. Available online at: https://www.ers.usda.gov/data-products/ag-and-food-statistics-charting-the-essentials/ag-and-food-sectors-and-the-economy/Sectors and the Economy (accessed February 1, 2021).
USDA ERS (2020b). “Farmland Value”. Available online at: https://www.ers.usda.gov/topics/farm-economy/land-use-land-value-tenure/farmland-value/ (accessed February 1, 2021).
USDA ERS (2020c). “The Role of Productivity Growth in U.S. Agriculture”. Available online at: https://www.ers.usda.gov/data-products/agricultural-productivity-in-the-us/the-role-of-productivity-growth-in-us-agriculture/ (accessed February 1, 2021).
USDA ERS (2021a). U.S. and State-Level Farm Income and Wealth Statistics: “U.S. farm sector financial indicators, 2014-21F”. Available online at: https://www.ers.usda.gov/data-products/farm-income-and-wealth-statistics/data-files-us-and-state-level-farm-income-and-wealth-statistics/ (accessed May 1, 2021).
USDA ERS (2021b). U.S. and State-Level Farm Income and Wealth Statistics: “February 5, 2021 release”. Available online at: https://www.ers.usda.gov/data-products/farm-income-and-wealth-statistics/data-files-us-and-state-level-farm-income-and-wealth-statistics/ (accessed May 1, 2021).
USDA ERS (2021c). Commodity Costs and Returns: “Corn, Soybeans, and Wheat”. Available online at: https://www.ers.usda.gov/data-products/commodity-costs-and-returns/commodity-costs-and-returns/ (accessed May 1, 2021).
USDA ERS (2021d). Farm Household Income and Characteristics: “Principal Farm Operator Household Finances”. Available online at: https://www.ers.usda.gov/data-products/farm-household-income-and-characteristics/ (accessed May 1, 2021).
USDA ERS (2021e). U.S. and State-Level Farm Income and Wealth Statistics: “Farm-level average net cash income by farm typology and sales class”. Available online at: https://www.ers.usda.gov/data-products/farm-income-and-wealth-statistics/data-files-us-and-state-level-farm-income-and-wealth-statistics/ (accessed May 1, 2021).
USDA ERS and NASS (2020a). “Principal farm operator household finances, by ERS farm typology, 2019”, from the Agricultural Resource Management Survey. Available online at: https://www.ers.usda.gov/data-products/farm-household-income-and-characteristics/ (accessed May 1, 2021).
USDA ERS and NASS (2020b). “Principal farm operator household finances, by ERS gender characteristics, 2019”, from the Agricultural Resource Management Survey. Available online at: https://www.ers.usda.gov/webdocs/DataFiles/48870/table08.xls?v=2242.8/ (accessed June 1, 2021).
USDA ERS and NASS (2021). “Principal farm operator household finances, 2016-2021F”, from the Agricultural Resource Management Survey. Available online at: https://www.ers.usda.gov/data-products/farm-household-income-and-characteristics/ (accessed February 1, 2021).
USDA ERSa Farm Household Well-being: Glossary. Available online at: https://www.ers.usda.gov/topics/farm-economy/farm-household-well-being/glossary/#farmoperator (accessed July 1, 2021).
USDA ERSb Farm Income and Wealth Statistics: General Documentation. Available online at: https://www.ers.usda.gov/data-products/farm-income-and-wealth-statistics/general-documentation/ (accessed July 1, 2021).
USDA ERSc Farm Income and Wealth Statistics: Government payments by program. Available online at: https://data.ers.usda.gov/reports.aspx?ID=17833#Pbd85abdd57c84e5b806a719dff8ee0c1_2_118iT0R0x0 (accessed July 1 2021).
USDA ERSd Farm Sector Income and Finances: Farm Sector Income Forecast. Available online at: https://www.ers.usda.gov/topics/farm-economy/farm-sector-income-finances/farm-sector-income-forecast/ (accessed May 1, 2021).
USDA NASS (2019). 2017 Census of Agriculture: United States Summary and State Data. Volume 1, Geographic Area Series, Part 51, AC-17-A-51. Available online at: https://www.nass.usda.gov/Publications/AgCensus/2017 (accessed February 1, 2021).
USDA NASS (2020). Farms and Land in Farms, 2019 Summary. Available online at: https://www.nass.usda.gov/Publications/Todays_Reports/reports/fnlo0220.pdf (accessed February 1, 2021).
USDA NASS CDL (2020). USDA National Agricultural Statistics Service Cropland Data Layer. Published crop-specific data layer. Available online at https://nassgeodata.gmu.edu/CropScape/ (accessed February 1, 2021).
USDA NASS QuickStats (2022). Available online at: https://data.nal.usda.gov/dataset/nass-quick-stats (accessed May 1, 2021).
Valliant, J., and Freedgood, J. (2020). Land access policy incentives: emerging approaches to transitioning farmland to a new generation. J. Agric. Food Syst. Commun. Dev. 9, 1–8. doi: 10.5304/jafscd.2020.093.027
van der Ploeg, J. D. (2013). Peasants and the Art of Farming: A Chayanovian Manifesto. Nova Scotia, CA: Fernwood Publishing.
Vanloqueren, G., and Baret, P. V. (2009). How agricultural research systems shape a technological regime that develops genetic engineering but locks out agroecological innovations. Res. Policy 38, 971–983. doi: 10.1016/j.respol.2009.02.008
Watts, M. (2021). “The agrarian question.” in Handbook of Critical Agrarian Studies, eds A. H. Akram-Lodhi, et al. (Cheltenham: Edmond Elgar Publishing). doi: 10.4337/9781788972468.00015
Weis, T. (2007). The Global Food Economy: The Battle for the Future of Farming. Zed Books. doi: 10.5040/9781350223165
Keywords: agriculture, United States, livelihoods, farms, operators
Citation: Burchfield EK, Schumacher BL, Spangler K and Rissing A (2022) The State of US Farm Operator Livelihoods. Front. Sustain. Food Syst. 5:795901. doi: 10.3389/fsufs.2021.795901
Received: 15 October 2021; Accepted: 28 December 2021;
Published: 21 February 2022.
Edited by:
Tapan Kumar Nath, University of Nottingham Malaysia Campus, MalaysiaReviewed by:
Krista Swanson, University of Illinois at Urbana-Champaign, United StatesPatrick Baur, University of Rhode Island, United States
Copyright © 2022 Burchfield, Schumacher, Spangler and Rissing. This is an open-access article distributed under the terms of the Creative Commons Attribution License (CC BY). The use, distribution or reproduction in other forums is permitted, provided the original author(s) and the copyright owner(s) are credited and that the original publication in this journal is cited, in accordance with accepted academic practice. No use, distribution or reproduction is permitted which does not comply with these terms.
*Correspondence: Emily K. Burchfield, ZW1pbHkuYnVyY2hmaWVsZEBlbW9yeS5lZHU=
†These authors share first authorship