 Daniel Milner
 Levi Wolf3
 Mark Van Wijk
 James Hammond
- 1Sustainable Livestock Systems, International Livestock Research Institute, Nairobi, Kenya
- 2Department of Mathematics, University of Bristol, Bristol, United Kingdom
- 3Department of Geography, University of Bristol, Bristol, United Kingdom
The risk of malnutrition, particularly micronutrient deficiency, is high in large parts of Sub-Saharan Africa for smallholder farmers. Access to diverse and nutritious food is a key component of food security, and a major development objective. It is widely accepted that good access to markets can play a key role in improving nutrition at the foodshed level. However, the magnitude and even the direction of the effect of increased market access on household dietary diversity (and thus food security) is not universal, with studies showing divergent results. One reason for these divergences may be that models do not account for place-based mediation effects, that is, farmers' local context can affect whether (and the extent to which) access to market is important to their nutrition. Drawing on household survey data from 914 Kenyan smallholder farmers from ten counties in South and West Kenya, we used a novel methodology to evaluate the role of market access in determining household dietary diversity. This methodology combines the clustering of households along places with similar characteristics and multi-level regression analysis to understand the place based variation in effects of different factors on dietary diversity. We found that, depending on how “access to market” is measured, there can be significant impacts on dietary diversity, and this is mediated by farm characteristics. For small farms with already good market access, higher diet diversity is associated with cultivating larger areas and owning larger livestock holdings, but not with easier market access. For isolated larger farms with a focus on livestock production, higher diet diversity is associated with easier market access (i.e., proximity to road), as well as greater livestock diversity. For medium-sized farms with good market access, diet diversity is mildly correlated with easier market access (i.e., proximity to road) but significantly associated with greater crop diversity. The need to account for place-based mediating effects is clearly important and highlights an exigency for greater use and development of localized models that can capture the extent to which effects might change when contexts change.
Introduction
Despite significant food security improvements, ~800 million people are still chronically hungry and over 2 billion people suffer from malnutrition (FAO, 2018). Africa and Asia are home to a significant share of undernourished people, many of which are smallholder farm households engaged in agriculture (Nandi et al., 2021). The self-consumption of on-farm produce is typical among such households, leading some studies to conclude that greater production diversity leads to better household dietary diversity (Snapp and Fisher, 2015; Jones, 2016; Ickowitz et al., 2019) whilst others find the contrary, that greater specialization raises incomes and dietary diversity (Sibhatu et al., 2015). Dietary diversity, defined as the number of unique foods consumed over a given period of time (IFPRI, 2002), is a widely accepted proxy indicator of broad nutritional status (Verger et al., 2019). At the same time, understanding the degree of on-farm diversification/specialization, defined as the number of unique agricultural products produced (e.g., crop species, livestock breeds), best suited to maximize a households dietary diversity will contribute toward greater food security (Thornton and Herrero, 2014), which is a major development objective.
Smallholders are rarely strictly subsistence-oriented nor wholly market-oriented, as there is almost always some level of inseparability between farm production and food consumption. Market catchments are diverse and across geographies are expected to have differing social norms, consumer preferences, or opportunities to participate as consumers and sellers, all of which define the level of market functionality (Nandi et al., 2021). If markets function poorly then production and consumption decisions are “non-separable” (i.e., foods produced and consumed are identical), whilst well-functioning markets allow such decisions to be “independent” (i.e., food production has no influence on household food consumption) (Nandi et al., 2021).
Whether pursuing diversified or specialized farm strategies, smallholders can utilize markets at any point in the crop cycle, and prior to planting they are likely to consider the desired level of market orientation for maximizing their utility (Davidson and Kropp, 2017). Studies have reported that where agro-ecological conditions are good and markets are functioning well, then farm production diversity becomes less important for dietary diversity (Sibhatu and Qaim, 2017). In these instances, improving market access and specialization are more effective strategies for increasing dietary diversity than increasing on-farm diversity, which could likely reduce incomes due to the lost benefits of specialization (Sibhatu et al., 2015). In apparent contradiction, several studies show the relationship between farm production diversity and dietary diversity to be positive, particularly when market access allows for high quality agricultural inputs to be purchased (Snapp and Fisher, 2015; Bellon et al., 2016). Furthermore, studies find that high levels of specialization can lead to reduced food security at the foodshed level, manifesting in instances of smallholders having higher incomes but lower dietary diversity (Jones, 2016; Ickowitz et al., 2019).
The decision to produce food on-farm or to purchase it from market is complex, has important implications for dietary diversity and, given the heterogeneous nature of markets and context specificity, is difficult to assess (Nandi et al., 2021). There are multiple possible indicators for market access including (a) distance to market (the most commonly used indicator), (b) travel time to market, (c) travel time to nearest town, (d) household ownership of mode of transport, (e) household distance from milk collection center, (f) walking time to district-level market, (g) transportation costs, (h) market participation, (i) distance to population center, (j) proportion of food purchased, (k) distance to nearest paved road, and (l) access to market information (Nandi et al., 2021). In an exploration of the effectiveness of common market access indicators, Chamberlin and Jayne (2013) found few correlations between them, and concluded that no single definition of market access captures all local market access dimensions, therefore advocating a more nuanced and context-specific approach to measuring market access.
Kenya exemplifies this situation as its agricultural sector is dominated by smallholders that often have to tackle this question of diversification and market-orientation for their livelihoods and food security (Wilkus et al., 2019). Kenya has a large variation in climatic and socio-economic conditions, resulting in a mosaic of agroecological and market opportunities, as well as constraints (Bryan et al., 2013). This makes it an interesting study context to try and disentangle the effects of different drivers of food security across different scales. Furthermore, Kenya is representative of how several countries in East and Southern Africa are developing rapidly from an economic perspective, while population growth rates are high. Food insecurity and hunger remain huge problems especially in its rural areas, where agriculture is the backbone of the local economy (Bryan et al., 2013). In this study we focus on farming communities in South and West Kenya that share these general characteristics, but also have a good availability of a wide range of geo-referenced farm household characteristic data, as well as data needed to construct market access indicators.
The objective of this study is to assess if the role of market access, and other farm-household characteristics, in relation to dietary diversity can be meaningfully interpreted in a quantitative and spatially heterogeneous manner. As yet, no holistic measure of market access has been agreed (Nandi et al., 2021). For this reason, and in order to capture a variety of routes to market this study has included two market access indicators: (a) the walking time from household to nearest road (“time to road”) and (b) the drive time to market from the nearest road (“drive time to market”). Neither indicator aims to capture market participation or market quality, but whilst still imperfect we do attempt to provide a community-wide and non-product specific assessment of two dimensions of market access: (a) access to physical market locations (“drive time to market”) and (b) access to traveling marketing agents (“time to road”). Whilst a study in a specific locality will generally produce one set of parameter values showing which is the most effective dietary diversity strategy within that study location, a meta-analysis across multiple locations can smooth and average out the differences, and generally identify whether any of these strategies works reliably. In response, we employ a multi-level logistic regression model that provides probability distributions for each variable and are location sensitive.
Methodology
Research approach
Due to the intricacy of the topic a relatively complex and multistage methodology has been used. Figure 1 outlines the different methodological steps undertaken in this study. Here we rely on secondary data collected by the Rural Household Multi-Indicator Survey (RHoMIS) open-access dataset (van Wijk et al., 2020). After extracting and treating the data for the relevant study region (Section Data collection) we estimate a dietary diversity indicator (Section Dietary diversity). Subsequently based on the decision of six relevant farm household characteristics (see below) we constructed two market access indicators (Section Market access). Households were then separated into clusters based on geographical proximity before model construction (Section Multilevel logistic regression).
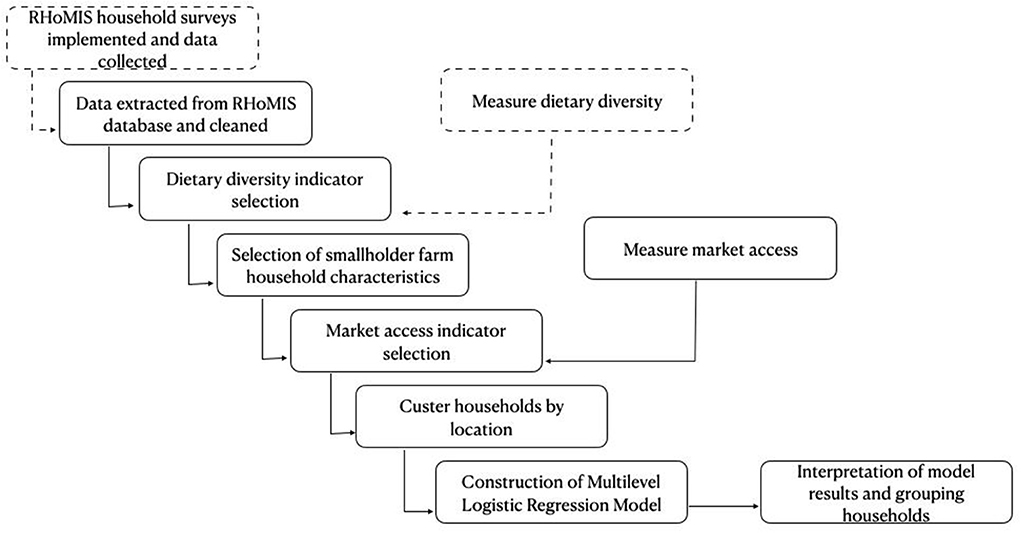
Figure 1. Flow diagram denoting each stage of the methodology. Dashed lines indicates process or decision outside the control of the study.
The selection of the six smallholder farm household characteristics used here to describe farm configuration was guided by a literature review (Ellis, 1998; Chamberlin and Jayne, 2013; Wiggins and Keats, 2013; Castello et al., 2015; Bellon et al., 2016; Qaim et al., 2016; Koppmair et al., 2017; Ickowitz et al., 2019) and refined through an additive approach in the model construction. Below we introduce briefly the six selected characteristics.
“Crop Diversity” is the number of crop species grown and is a prominent factor influencing dietary diversity (Snapp and Fisher, 2015; Bellon et al., 2016; Qaim et al., 2016; Sibhatu and Qaim, 2017; FAO, 2018; Ickowitz et al., 2019). “Livestock Diversity” is the number of livestock types kept with no distinction between draft and non-draft animals. Diversification is a central livelihood strategy for millions of rural households (Bellon et al., 2016) and is often seen as an immediate way to improve dietary diversity (Nandi et al., 2021). Diversification and commercialization are not binary, Conelly and Chaiken (2000) found that can go hand-in-hand via intercropping farming methods, whereby subsistence crops suitable for human and animal consumption are grown alongside cash-crops such as coffee, tea and French-beans.
“Land Cultivated” is the total area of land (whether rented or owned) farmed by a household measured in hectares. A study in India by Kadiyala et al. (2014) finds farm size is more important for determining dietary diversity than crop diversity, but this is specific to context. Frelat et al. (2015) suggest a farm of 0.4 ha is enough to feed a household of 4.4 Male Adult Equivalent (MAE) in sub-Saharan Africa, although if the household is isolated from markets more land would be required. Farm size can also influence foodshed diversity, as landscapes of many small farms produce a wider variety of nutrients than landscapes of large mono-culture farms (Herrero et al., 2017).
“Livestock Holdings” is the total livestock owned measured in Tropical Livestock Units (TLUs) (FAO, 1993). Higher livestock ownership has been found to improve dietary diversity but with diminishing returns after 0.2 TLUs (Frelat et al., 2015). Ownership of small livestock is more positively associated with dietary diversity than ownership of large livestock (Azzarri et al., 2015).
“Household Size” is the number of members of the household measured in MAE. Household members are an important source of on-farm labor but, depending on the household's assessment of marginal return, can also be used to generate off-farm and non-farm income. Overall, household size and dietary diversity tend to be negatively correlated, but this can vary depending on where household members are employed (Abafita et al., 2016).
“Total Income” is the sum of all cash incomes earned by a household, calculated by adding the annual household income from crop sales, livestock sales and off-farm incomes. Household members can generate off-farm and non-farm income through the sale of their labor, which has been found to be positively correlated to dietary diversity, particularly if controlled by a female household head (Koppmair et al., 2017).
Study sites
The study households were located in 10 counties located in (a) southern Kenya (Kitui and Makueni counties), (b) west-central (Baringo county), and west Kenya (Migori, Homa Bay, Kericho, Kisumu, Vihiga, Siaya, and Busia counties). Climatic conditions in both of the southern Kenya counties range between Arid Steppe and Equatorial Desert (Kottek et al., 2006) providing a hot, arid environment. The road network in Kitui county is sparse compared to Makueni county, which is connected south-east to north-west by the Mombassa-Nairobi Expressway. Climatic conditions in the west-central county (Baringo) are also classified as Equatorial Dessert (Kottek et al., 2006), with a sparce road network containing few paved roads, and a steep terrain with elevations > 2,500 m. Finally, all seven of the western study counties are located on the shores of Lake Victoria, with the climate categorized as Equatorial Fully Humid (Kottek et al., 2006), and a road network that is dense but mostly unpaved.
Households within these study areas are dispersed across four farming systems: (a) maize mixed, (b) pastoral, (c) agropastoral, and (d) highland perennial. Each farming system is defined as a population of farm households of mixed types and sizes that have broadly similar patterns of available/used resources, livelihoods, consumption patterns, and relevant constraints and opportunities (Dixon et al., 2021).
The majority of study households (591 households, Section Data collection) are classified as within a maize mixed system, a predominantly sub-humid agroecological zone with a crop growing season of about 6 months. Households are located in an average altitude of around 1000 meters above sea level, and experience a rainfall regime that follows a bimodal pattern, contributing to the long crop growing season. Maize dominates their cropping systems, but there is also cash-cropping, often coffee, tea, fruit and vegetables (Dixon et al., 2021).
Approximately 180 households are within a pastoral farming system and 50 households are within an agropastoral farming system. Pastoral systems are predominantly within the tropical warm arid agroecological zone whilst, agropastoral systems are predominantly within the tropical warm semi-arid zone. Again, rainfall in these systems tends to be bimodal, which spreads the growing season over a long period but with high inter-annual rainfall variation. This in turn leads to high inter-annual variation in forage available to herders, and a severe mid-season dry spell that can disrupt pollination and negatively impact crop yields. Soils in these systems tend to be of low quality, both poor in nutrients and physical properties (Dixon et al., 2021).
Finally, there are 93 households located within a highland perennial system, a predominantly tropical cool subhumid agroecological zone. It is characterized by a long growing season, relatively fertile volcanic soils, and generally plentiful water. Consequently, population densities in this system tend to be very high, reaching up to 1,000 persons/km2 (Dixon et al., 2021).
It should be mentioned that the distribution of study households across farming systems does not follow exactly the geographical distribution of the sample. In other words in each study region the study households fall in a combination of different farming systems.
Data collection
In this study we use household survey data collected from the Rural Household Multi-Indicator Survey (RHoMIS) open-access dataset (van Wijk et al., 2020). The questionnaire tool has been applied across smallholder farming systems in Africa, Asia, and Latin America, to collect geo-located farm-livelihood characterization data and standardized dietary indicators (Hammond et al., 2017). Responses are collected via trained enumerators who spend 40–60 min surveying each household. The RHoMIS data has been widely used by researchers in academic and NGO communities and is considered a robust data source (Fraval et al., 2019b).
The households included in this study were interviewed in three tranches between late 2016 and early 2017. Data collected in 2016 was part of the Africa and South-East Asia wide CCAFS project, IMPACTlite. We sampled 160 households in each of Wote, Makueni County, and Kap Sarok, on the Kisumu County-Kericho County border. Data collected in early 2017 was part of the Ethiopia, Kenya, Tanzania wide SAIRLA project, led by Bioversity International. Over 300 households were interviewed in Kenya, with 192 located in Kitui County and 123 in Makueni County. The remaining 396 households were also interviewed in early 2017, and were part of the ICRAF project SCAN. All data collection exercises conducted random sampling of smallholder farm households within the selection study sites in order to capture the full heterogeneity of farming systems and geographies.
RHoMIS data collection conforms to the principals of the 1964 WMA declaration of Helsinki, they are processed in an anonymised way and no household identification variables are published within this study. For each application of RhoMIS the research was approved by the lead institutions research ethics review board, and in each case informed consent was received from the respondents prior to beginning the interview, with the respondents able to skip questions or cancel the interview at any time. Written approvals were not collected due to respondents' poor literacy and their quite reasonable mistrust of signing documents which they could not understand (van Wijk et al., 2020).
Overall, in terms of geographic distribution the subset of the RHoMIS dataset used here incorporated 914 households from ten counties in Southern and Western Kenya.
In total 408 households were located in Southern Kenya, split between the Makueni (296 households) and Kitui (192 households) counties.
In west-central Kenya, 192 households were located in Baringo county.
The remaining 351 households were located in west Kenya, and split between: Migori (7), Homa Bay (56), Kericho (100), Kisumu (62), Vihiga (44), Siaya (22), Busia (35).
We should note here that RHoMIS data collection conforms to the principals of the 1964 WMA declaration of Helsinki. They are processed in an anonymised way and no household identification variables are published within this study. For each application of RhoMIS the research was approved by the lead institutions research ethics review board, and in each case informed consent was received from the respondents prior to beginning the interview, with the respondents able to skip questions or cancel the interview at any time. Written approvals were not collected due to respondents' poor literacy and their quite reasonable mistrust of signing documents which they could not understand (van Wijk et al., 2020).
Data analysis
Dietary diversity
Dietary diversity was measured using an adapted version of the Household Dietary Diversity Score (HDDS) (FAO, 2013), also used and described in detail in Fraval et al. (2019a); Fraval et al. (2020) and Ritzema et al. (2019). The indicator is a categorical variable calculated by tallying the number of food groups (from a standardized list of 10 food groups), that a household has consumed over a 4-week recall period and indicating whether that food group was consumed “daily”, “weekly”, “monthly” or “never/less than monthly” (Hammond et al., 2017). Food groups consumed monthly, less than monthly, or never are given a score of 0 whilst food groups consumed on at least a weekly basis are given a score of 1, with a maximum achievable score of 10.
As this is an adaptation of the standard HDDS definition, the results in this study only indicate the variation in dietary diversity in the population sample and not household nutrition (Verger et al., 2019). Household dietary diversity scores were collected for both the “good season” (mean HDDS 6.0; std 2.3) and the “lean season” (mean HDDS 4.2; std 2.6). All HDDS scores used in this study are “lean season” only as this is generally the time of lowest dietary diversity (Bellon et al., 2016) and the time when markets are most important for alleviating food scarcity (Nandi et al., 2021). Data for other variables are not disaggregated by season.
Market access
Market orientation and market participation offer two alternative, non-spatial, proxies for market access. Market orientation assesses the ratio of the quantities of farm inputs purchased and agricultural outputs sold at market. Conversely market participation captures the quantity of production excess that a smallholder sells at market. Market orientation identifies a premeditated commercial decision by households wishing to use markets as a cornerstone of food security, whilst market participation reflects markets being used as a source of cash, a practice common in the lean season (Wilkus et al., 2019). Both of these metrics are highly susceptible to seasonal variations (Abafita et al., 2016).
Whether using a market access proxy (e.g., “distance to nearest town”) or an alternative such as market orientation or market participation, it seems reasonable to agree with Chamberlin and Jayne (2013) that indicators of market access are not always highly correlated with one another. It has been argued that a more nuanced and spatially differentiated understanding of the role of market access on top of well-known micro-level effects of farm (e.g., crop diversity, land holdings, livestock holdings) and household (e.g., access to off farm income, family size) characteristics in achieving diverse diets would help in planning data-led development strategies (Ruel et al., 2018). Consequently, in this study we used two measures of market access. “Time to Road” estimated as the euclidean distance from household to nearest road, assuming a walking speed of 1.4 m/s with no allowances for topography, individual's physical capacity or use of bicycle or other transport method. “Drive Time to Market” that estimated journey time from households nearest road to the most convenient market. This latter metric assumes the use of motorized transportation traveling at the speed limit for that road, but making no allowance for congestion or seasonal reductions in road quality. Times were calculated using Opens Source Route Mapper and OpenStreetMap's road network for Kenya.
Multilevel logistic regression
In this study we use a Multilevel Logistic Regression (MLR) to accommodate the spatially varying relationships between dietary diversity and factors of smallholder farm strategy. This multilevel approach allows each effect to vary depending on its geographic place (Arcaya, 2012). At each place the effect of each variable is determined by both the data at that place and, to maintain statistical power, “pooled” data from similar households at other places (Gelman, 2006). Multilevel models are the mainstay of machine learning (Hoffman and Gelman, 2011) and provide probability distributions for predictions or estimates at each place as opposed to a single prediction or estimate. This paper contributes a case study for multilevel model use within the rural development context of a developing county.
To populate the model we used geo-tagged household survey data, and market locations, calculated realistic journey times, and explored patterns of market use among smallholders in rural South and West Kenya as outlined in Sections Data collection, Dietary diversity, and Market access. We assessed the effect of market access on household dietary diversity, whilst also taking account of on-farm production systems. In this sense this study outlines a new methodological approach that was made possible by advances in techniques for measuring household dietary diversity (HDDS) (Section Dietary diversity) and developments in open source network analysis (Open Source Route Mapping, OSRM) technologies (Section Market access).
Multilevel models are “placial,” not spatial, which means that places used within the model must be specified a priori (Arcaya, 2012). However, we only had information about the locations of surveys taken, with no reliable indicators of the geographic extent of the foodshed in which the sample was taken. Most households in the RHoMIS dataset did include a variable indicating the village name, but this was proved to be unreliable in the sense that there were many responses in the same geographical area with different village names.
Therefore, we first needed to cluster the survey responses into “places” that correspond to small communities where food and farming decisions are more likely to be similar. Using DBSCAN (Ester et al., 1996; Schubert et al., 2017; Arribas-Bel et al., 2019) we grouped the surveyed households into 12 clusters, which became our “places” (see Figure 2). Due to the dispersion between places and the sampling strategy of RHoMIS, we set the DBSCAN “separation” parameter (ε) (the straight-line distance between points beyond which data is not considered linked) to 15,000 m. This indicates the maximum distance at which a pair of sites can be considered as “nearby” in the algorithm. Further, in light of information about the sample design, we restricted communities to be of 4 or more respondents (setting minPts equal to one returns the same clustering). With these communities, we constructed place-based estimates of the relationship between our explanatory factors and diet diversity.
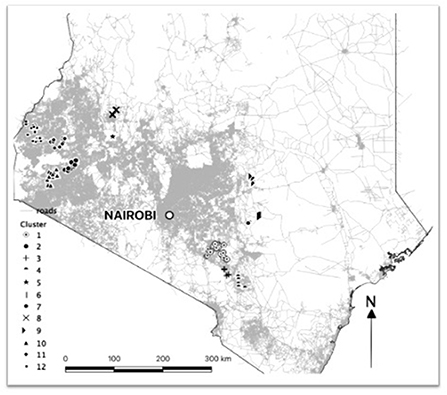
Figure 2. Survey locations by cluster. Gray shading indicates roads. Symbols indicate survey locations and cluster.
Bringing variables and clusters together the Bayesian MLR model is defined through Equation (1) as:
Where
i is an index denoting a specific survey response,
j is an index describing the place a survey response occurs, and
ß is the effect of the variate on household diet diversity.
This is a “varying-slope” multilevel model (Gelman and Hill, 2006), which allows the relationship between our variables and the response to change depending on the place (j). Thus, we may get one effect for “Time to Market” in one place, and a different effect in another. Varying-slope multilevel models are useful precisely because they can provide estimates of an “overall” effect, while also recognizing that local deviations from the overall effect can make a significant impact on the outcomes in that area.
Results of the regression model for each cluster identified a smaller number of household groups. The groups were composed of clusters which showed similar responses in the model. Membership of each group was based primarily on the similarity of experience of market access variables. Membership was then refined further, based on similarities across other livelihood variables.
Results
Descriptive statistics
Descriptive results for each of the 12 clusters are presented in Table 1. Across the survey population median dietary diversity is five suggesting moderate levels of diet diversity, but it varies significantly between clusters. Clusters 1, 2, 5, 8, 10, and 11 are dominated by households with high dietary diversity (average dietary diversity scores > 5) whilst households with low dietary diversity (average dietary diversity scores <5) are the majority in clusters 4, 6, and 7.
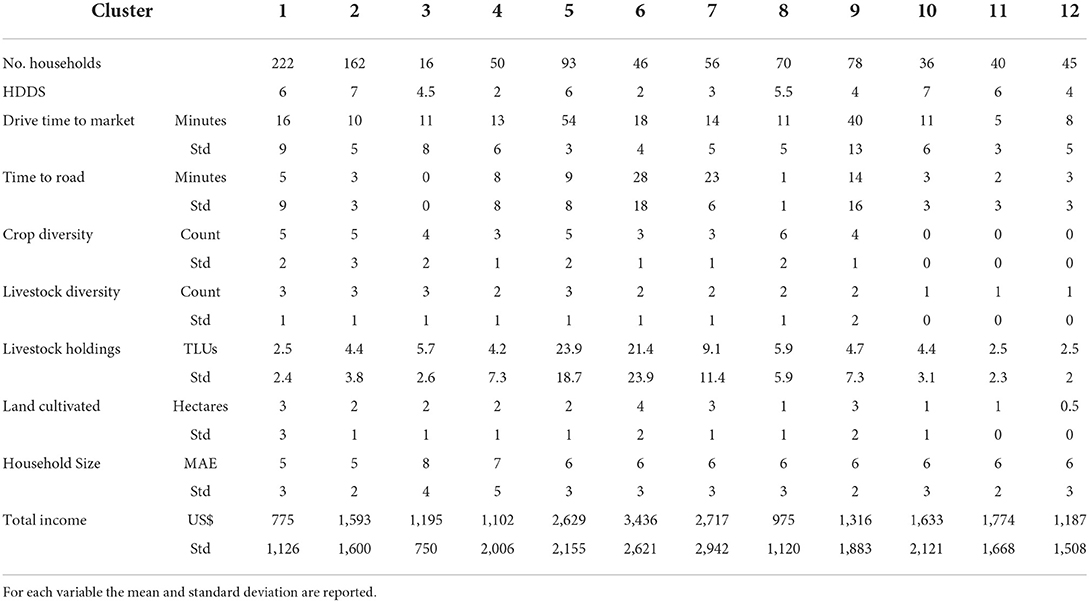
Table 1. Descriptive statistics for the main study variables for the 12 clusters.
The average “Drive Time to Market” was around 20 min, although the majority of the clusters reported times that were below this average. Conversely Clusters 5 and 9 were notably more isolated, with average “Drive Time to Market” of >40 min. A similar trend was found for the variable “Time to Road”. Whilst the average walking time from house to nearest road is about 8 min, most clusters were within a 5-min walk. Clusters 6 and 7 were much more isolated with a walk of over 20 min to the nearest road.
Clusters exhibited different farm characteristics. Growing a range of crops on-farm is common and the average “Crop Diversity” across the survey population was four crop species. However, this varied greatly between clusters. For example, no households in Clusters 10, 11, and 12 reported growing any crops, whilst households in Clusters 1, 2, 5, and 8 generally grew five or more crop species.
All households reported owning livestock, but the actual variety and quantity varied considerably. Whilst households in Clusters 10, 11, and 12 tended to specialize on one livestock type, households in Clusters 1, 2, 3, and 5 have diversified livestock species ownership and generally owned three livestock species. “Livestock Diversity” for households in the remaining clusters averaged two species. There was clearly a livestock focus among households in Clusters 5 and 6, where holdings averaged over 20 TLUs. Conversely, households in Clusters 1, 11, and 12 have much smaller livestock holdings (~2.5 TLUs). The remaining households generally owned between 4 and 6 TLUs although households in Cluster 7 averaged >9 TLUs.
The area of land cultivated by most households was small (<2 ha). The exceptions were households in Clusters 1, 6, 7, and 9, which averaged 3 ha or 4 ha in the case of Cluster 6. Household size across the survey population was broadly consistent, at or around 6 Male Adult Equivalents (MAEs). Larger households tended to be found in Clusters 3 and 4, whilst smaller households were more common in Clusters 1 and 2.
Households “Total Income” averaged USD 1,546 for the whole survey population, but there was variation by an order of magnitude across the clusters. The highest earning were reported by households in Cluster 6, where incomes averaged almost USD 3,500. Annual household incomes for the households in both Clusters 5 and 7 were also high and averaged over USD 2,500. By contrast, households in Cluster 1 and 8 reported incomes below USD 1,000. The remaining households generally reported incomes between USD 1,000–2,000.
Inferential results
Model results for all 12 clusters are presented in Table 2 and Figure 3, whilst the statistical significance of the results are presented in Figure 4. For each independent variable the “Odds” value represents the estimated change in HDDS given a unit change in that variable. For example, if “Time to Market” is reduced by 1 min for households in Cluster 6 then the likelihood of their HDDS rising by one point is estimated to increase by 4%, or put another way, their HDDS is estimated to rise by 1/25th. Table 2 rows “2.5” and “97.5” are confidence intervals and provide guidance on the significance of model results, i.e., if both “2.5” and “97.5” share the same sign then the results are statistically significant (see heat map in Figure 4). Continuing the above example, in that case the confidence intervals are −7 to −1%, which means the findings are statistically significant. However, if confidence intervals span above and below zero then findings are statistically insignificant. For example, “Livestock Diversity” confidence intervals for households in Cluster 5 are −2 and +2% with an estimated odds change of zero. Figure 4 visualizes the direction of effect and the statistical significance of findings in either dark red or dark green depending on whether it is negative or positive. Statistically insignificant findings are colored light green if the average odds estimate is positive and light red if the average odds estimate is negative.
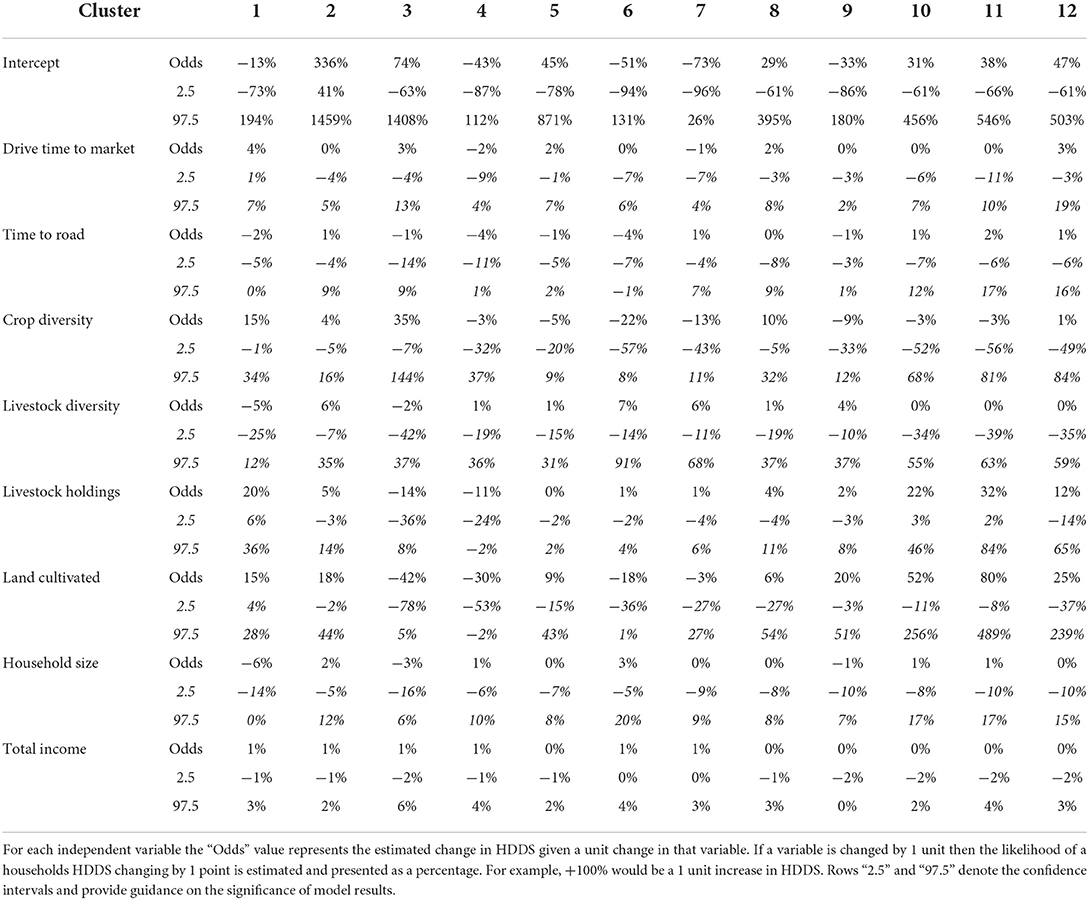
Table 2. Odds ratio of the effect of different variables to dietary diversity for each cluster.
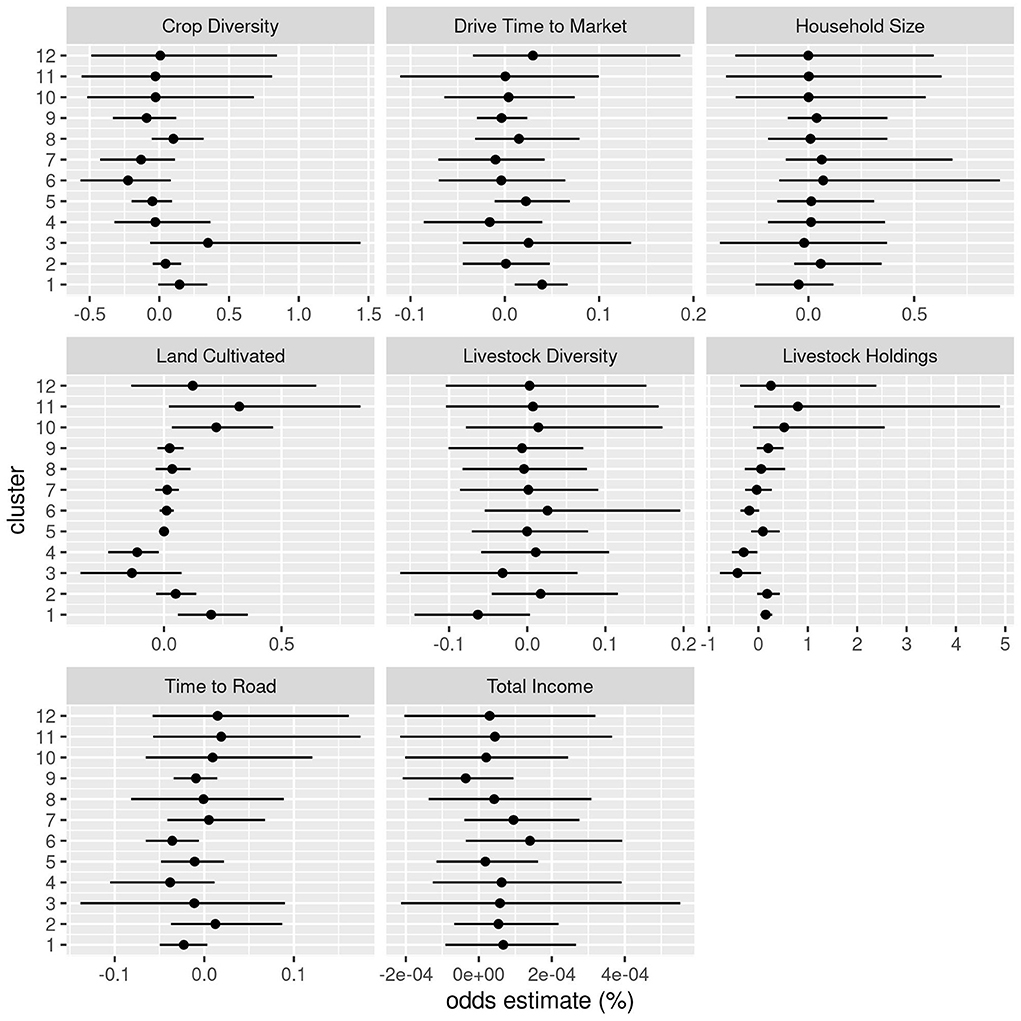
Figure 3. Distribution of odds of change in Household Dietary Diversity Score given an increase of one unit in each variable for each cluster. Bars not intersecting with zero denote statistically significant results. The italic values indicate the confidence intervals and provide guidance on the significance of model results.
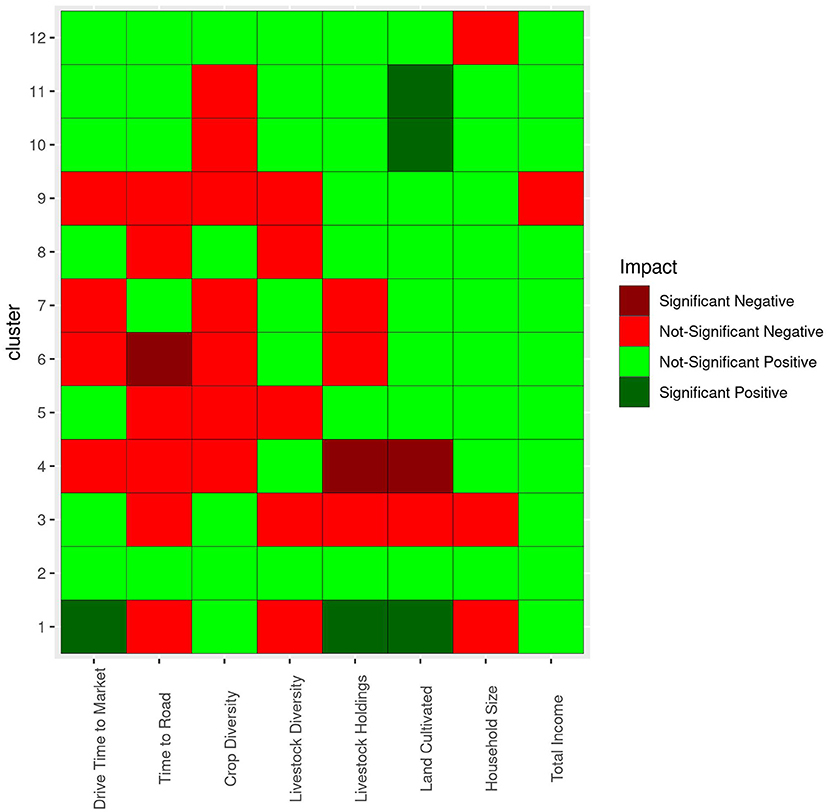
Figure 4. Statistical significance of the impact of each variable on the Household Dietary Diversity Score for each cluster.
Market access
Reducing “Drive Time to Market” by 1 min improves the odds of increasing a household's HDDS in only two clusters (Clusters 4 and 7), although confidence intervals suggest the effect is statistically weak (Figure 4). For five clusters (Clusters 2, 6, 9, 10, and 11) the overall effect is statistically insignificant, whilst for households in Cluster 1, 3, 5, 8, and 12 a shorter “Drive Time to Market” is actually associated with a lower HDDS. This suggests that “Drive Time to Market” may not have a consistent impact on diet diversity across the different kinds of places we analyzed.
Reducing “Time to Road” by 1 min improves the odds of an increased HDDS for households in five Clusters (1, 4, 5, 6, and 9), the majority of which are around a 10-min walk to nearest road. The impact of a change in “Time to Road” is minimal for households in six clusters (Clusters 2, 3, 8, 10, 11 and 12), where most households are already within a 3-min walk to the nearest road. Households in Cluster 7 are over a 20-min walk from a road, but model results do not suggest that closer proximity increases dietary diversity.
Farm household characteristics
Increasing “Crop Diversity” by one crop species is likely to improve the odds of an increase in HDDS for households in five clusters (Clusters 1, 2, 3, and 8) that already tend to grow a diverse selection of crops (>4 crop species). For households in five clusters (Clusters 4, 5, 6, 7, and 9) where average “Crop Diversity” ranges from 0 to 5, a higher crop diversity is actually associated with a lower HDDS, while for households in the remaining clusters our results are statistically insignificant (Figure 4). This suggests that the impact a change in “Crop Diversity” has on a household's dietary diversity, also varies across the different places we have analyzed.
Increasing “Livestock Diversity” by one animal species could improve the odds of an increase in HDDS for households in seven clusters (Clusters 2, 4, 5, 6, 7, 8, and 9) that tend to already own two livestock species, but the confidence intervals suggest the effect is inconsistent. For households with higher livestock diversity (~3 livestock species), which are generally found in Clusters 1 and 3, this higher diversity is associated with lower household dietary diversity, but again, confidence intervals do not suggest a consistent impact for all households. For households in Clusters 10, 11, and 12 the overall effect of “Livestock Diversity” is statistically insignificant. Overall, this suggests that across the places we analyzed, the diversity of livestock owned has a usually positive but inconsistent impact on household dietary diversity.
Increasing “Livestock Holdings” by 1 TLU is likely to improve the odds of an increase in HDDS for households in Clusters 1, 2, 10, 11, and 12, where holdings are generally at or below 4.4 TLUs. For households in all other clusters “Livestock Holdings” are usually > 4.4 TLUs and the odds of higher dietary diversity are either statistically insignificant or negative. Across the places we analyzed, “Livestock Holdings” appear to have diminishing returns for household dietary diversity and may even turn negative when it is >4.4 TLUs.
Expanding “Land Cultivated” by 1 ha is likely to improve the odds of an increase in HDDS for most households in eight clusters (Clusters 1, 2, 5, 8, 9, 10, 11, and 12) with the effects particularly significant when the area cultivated is <1 ha. Conversely, for households in three clusters (Clusters 3, 4, and 6) a 1 ha increase in “Land Cultivated” is likely to reduce the odds of an improved HDDS despite households in Clusters 3 and 4 generally cultivating small areas of land (~2 ha). For households in Cluster 7 our findings are statistically insignificant. This suggests that “Land Cultivated” has a generally positive impact on household dietary diversity, but can vary across the places we analyzed.
The overall effect of “Household Size” on household dietary diversity is statistically insignificant for households in all clusters with the exception of Cluster 1. For these households, a 1 MAE increase in “Household Size” is estimated to reduce the odds of an improvement in dietary diversity.
Increasing “Total Income” by USD 100 is likely to improve the odds of an increase in HDDS by <1%, for households in all clusters. Confidence intervals suggest the general effect is statistically insignificant.
Household groupings and market access
Based on clusters which showed similar responses in the model, we can identify three clear groups of clusters.
Group 1 is characterized by households where higher dietary diversity is not associated with being closer to a road (i.e., Clusters 2, 8, 10, 11, and 12), with the odds of a unit increase in HDDS generally increasing when cultivating larger areas of land and owning larger “Livestock Holdings”. These farms tend to be small (<2 ha) with already good market access (<3 min walk to the nearest road) and have relatively high dietary diversity scores of four or more.
Group 2 is characterized by households where higher dietary diversity is associated with being closer to a road (Clusters 4, 5, 6, and 9) and the odds of a unit increase in HDDS also increase with reduced “Crop Diversity” but greater “Livestock Diversity”. Households tend to be located >8 min walk from the nearest road and cultivate relatively large areas (>2 ha), whilst having a livestock focus (i.e., owning more than >4 TLUs). The experience between households in these clusters is not uniform though. Households in Clusters 4, 6, and 9 tend to have a low average diet diversity (≤ 4 HDDS) and both low crop diversity ( ≤ 4 crop species) and low livestock diversity (≤ 2 livestock species). This is despite households in Cluster 6 averaging livestock holdings above 20 TLUs. By contrast, households in Cluster 5 have an average crop diversity >5, livestock diversity >3 and a high HDDS > 6.
Group 3 contains households from Clusters 1 and 3, where slightly increased dietary diversity is associated with being closer to a road but the odds of a unit increase in HDDS increase significantly with a unit increase in “Crop Diversity”. These households tend to be within a 5-min walk of a road, have high diversity for both crops (more than >4 crop species) and livestock (averaging 3 livestock species) and cultivate between 1 and 3 ha of land. For households in Cluster 1, which average 2.7 TLUs, enlarging livestock holdings has a strong positive effect on the odds of an increase in HDDS, whilst for Cluster 3 households (which average 5.7 TLUs) the opposite is true. Overall, diet diversity for Group 3 households holds-up well and they average an HDDS of five points.
The 56 Households in Cluster 7 do not fit within any of the three groupings. “Time to Road” is on average >20 min, but the households furthest from the road tend to have higher HDDS. Similarly, average “Livestock Holdings” are already large (>9 TLUs), but the households with higher numbers of livestock tend to also have a higher dietary diversity. Households that have the longest “Drive Time to Market” have the highest odds of an increase in HDDS but, counter intuitively, households cultivating smaller areas of land also have higher odds of an increase in HDDS. Whilst results appear to sit outside the literature, visual inspection of satellite imagery shows significant forest cover close to the households furthest away from the road network, which may indicate that wild food is an important dietary supplement.
Discussion
The role of market access for diet diversity
Better access to market, as indicated by the drive time from a household's nearest road to a physical market, does not generally infer increased household dietary diversity (Table 2; Figure 3). This appears to contradict the widely held view that market access ameliorates nutritional outcomes for smallholders (Stifel and Minten, 2008; Wiggins and Keats, 2013; Wilkus et al., 2019). However, this is actually consistent with findings in a number of countries including Ethiopia (Abafita et al., 2016), which show physical distance and travel time to a market location or urban areas does not have a strong effect on market use. Nevertheless, when market access was indicated by the time it takes a household member to walk to their nearest road, the effect appears to be greater, which is consistent with findings in Kenya (Chamberlin and Jayne, 2013) reporting that a reduction in walk time to the nearest road is more important than a reduction in travel times to markets for improving household nutrition. Selling produce at the farm-gate is a common marketing strategy for smallholders all over sub-Saharan Africa, as is purchasing fertilizer and other farm inputs from traveling sales agents (Yamano and Arai, 2011). In this sense, when markets are interpreted as something that can move rather than being a stationary location that farmers must commute to, then access to the nearest road could be judged as a better market access proxy than the location of the nearest market.
Toward a classification of dietary diversity strategies
Exploring household groupings reveals a mixed picture (Section Household groupings and market access). Group 1 households, which are all within a Maize Mixed farming system (Section Study sites), tended to have high dietary diversity but exhibit polarized dietary diversity strategies. Couched within the literature this might suggest that market access (i.e., proximity to road) acts as an important mediator of dietary diversity for both specialized and diversified farms. Livestock-specialized households in Clusters 10, 11, and 12, appeared to conform to the prevailing orthodox economic view that specialization increases output and thus income, which translates into improved nutrition via the purchase of food stuffs from markets. By contrast, the much more diverse farms in Clusters 2 and 8, fit with evidence put forward by a number of authors (e.g., Ickowitz et al., 2019) that on-farm diversity is the most effective way to improve household nutrition. What is consistent is the generally small size of farms in Group 1, which may advocate the notion that a foodshed composed of lots of small farms with reasonably good market access are much more diverse than single farms, and can consequently produce a wider variety of nutrients than a landscape of mono-culture farms (Herrero et al., 2017). Indeed, model results for Group 1 households do not suggest that greater on-farm diversity has significant impact on dietary diversity. Instead, the households in this group with the most diverse diets tended to cultivate larger areas (>1 ha) and be more livestock-focused (i.e., own > 3 TLUs).
For Group 2 farms the observed trends are also complex (Section Household groupings and market access). Whilst farms in this group tend to be larger (>2 ha), far from markets, and according to model results they could benefit the most from improved market access (i.e., proximity to road), they do not show consistent dietary diversity scores. A theory put forward by Frelat et al. (2015) proposes that the more isolated a household is from markets, the more land it requires for producing food. In the case of these households however, and with the exception of households from Cluster 5 which is within a highland perennial farming system (Section Study sites), the dietary diversity is generally poor suggesting the larger areas cultivated are not ameliorating poor dietary diversity within an agropastoral or pastoral farming system (Section Study sites). That the ownership of generally large livestock holdings has also not ameliorated dietary diversity seems counter-intuitive, but does align with other findings from the literature suggesting that livestock holdings have diminishing returns (see Azzarri et al., 2015; Frelat et al., 2015). Across all clusters, our model finds that households with “Livestock Holdings” <4 TLUs and >5 TLUs are associated with lower HDDS (i.e., 4–5 TLU appears to be “optimum”). On the other hand, livestock diversity is, in general, positively linked to dietary diversity via the increased variety of animal products consumed, which is also in line with findings in the literature (Azzarri et al., 2015). Indeed, the much higher average diet diversity achieved by households in Cluster 5, which have much higher on-farm diversity provides further evidence for the importance of on-farm diversity when market access is difficult.
High on-farm diversity and good market access (i.e., proximity to road) are common among Group 3 households, which tend to have dietary diversity scores of around 5, and are all within a maize mixed farming system (Section Study sites). Using the evidence provided by Frelat et al. (2015) that 0.4 ha is enough to feed a household of 4.4 MAE, it appears that households in Group 3 produce enough food for consumption and for sale at market (household sizes tend to be <10 members and the areas cultivated are 1–3 ha). This chimes with Conelly and Chaiken (2000) who find that commercialization and diversification can go hand-in-hand via the implementation of intercropping farming methods, whereby subsistence crops suitable for human and animal consumption are grown alongside cash-crops such as coffee, tea, or French beans.
Across the 12 clusters, the mixed responses to market access variables, on-farm diversity, livestock holdings and land cultivated variables reflects the conflicting views found in the literature. Grouping clusters based on their characteristics and similitude of results highlights that location and resource availability are integral to understanding household strategy and provide a more nuanced interpretation.
Overall, our model results show neither specialization nor diversification to be a panacea. In the right context, each strategy has the potential to improve household dietary diversity. However, our model does provide some study-wide findings. Contrary to multiple studies, including the meta-analysis by Qaim et al. (2016), we find that consistently across all 12 clusters a change in household income has limited influence on the odds of a unit change in HDDS. The low influence of income on household dietary diversity is consistent with findings in other studies (e.g., International Food and Policy Research Institute, 2013; Kadiyala et al., 2014; Castello et al., 2015). Furthermore, the fact that our model also finds the number of household members to be statistically insignificant in determining dietary diversity is not outside the literature. The number of household members is an important source of on-farm labor, but household dietary diversity and household size tend to be negatively correlated (Abafita et al., 2016). Household members can generate off-farm and non-farm income based on their assessment of marginal return (Stifel and Minten, 2008), but the effect this income has on nutrition differs depending on its source (Barrett et al., 2001). Income from the sale of farm produce has limited effect on diet diversity (Wiggins and Keats, 2013; Kadiyala et al., 2014). Conversely the sale of household members' labor or the accruing of remittances correlate with an improved HDDS, particularly if financial control is with a female household head (Castello et al., 2015; Koppmair et al., 2017).
The potential of spatially explicit multi-level models
Qualitative studies (e.g., Wiggins and Keats, 2013) can provide rich information important to deciphering the use of markets and the effects of market access on nutrition at the household level. Unfortunately, the numerous factors households consider when formulating their livelihood strategy means that qualitative studies cannot provide representative guidance on all agriculture-nutrition pathways. Conversely, large quantitative studies (e.g., Qaim et al., 2016), use surveys of multiple thousands of households to perform global statistical analyses returning parameter estimates for the most effective drivers of household nutrition. Unfortunately, these studies are unsympathetic to local variations, as they tend to address only entire study areas, and can suffer from an “ecological fallacy”, whereby correlations and parameter estimates at the global level do not represent the various experiences at the local level (Subramanian et al., 2009). There is, therefore, a need to apply methods that inherently take account of local context, whilst not losing the statistical power provided by large data sets. In this sense, deciphering household strategies by place allows for a more nuanced interpretation of data sensitive to local contexts (Fotheringham, 1997), with the results possible to be used to formulate locally specific interventions.
There is growing recognition that efforts to improve the nutrition and food security of the rural poor need to consider agricultural production, food purchases, food culture, gender empowerment, and geographical context, as best exemplified by the burgeoning narratives around the “food system” (Fanzo et al., 2020; Stefanovic et al., 2020). However, the development of a monitoring framework for all of these factors is in the early stages (Fanzo et al., 2021), and implementation currently lags behind aspiration. The multi-level model proposed here provides a way to account for many of these issues, which can be place-specific (e.g., relating to climate and market infrastructure), and simultaneously assess the impacts due to farm household-level changes within specific locations. This analytical method goes beyond what is possible with meta-analysis, and allows for the spatial disaggregation of policy-relevant insights.
Specifically, our finding that household proximity to roads was far more important than proximity to a physical marketplace, has major implications for infrastructure development planning. We also found that for households already close to roads (<10 min) a combination of diverse crops for home consumption with one or two high value products (often livestock) was the most successful strategy to achieve dietary diversity. For households further from roads, farms tended to be larger and with more livestock, but with lower dietary diversity. Livestock ownership >5 TLU (in cattle mass equivalent) was associated with declining dietary diversity scores. In such contexts if the construction of roads is prohibitively expensive, then policy interventions to support more nutritious diets could focus on outreach to these harder-to-access areas, with a focus on improved crop diversity for home consumption.
Study limitations
Some of the elements of the adopted methodology entail some degree of uncertainty as explained below. Spatially varying regression models, such as those used in this study, inherently rely on a small number of data points at each “place”. Techniques to “pool” or “borrow” data with similar traits from across the dataset do increase statistical power, but outliers can have a disproportional impact. Whilst efforts were made to identify and remove such outliers, the risk remains. Furthermore, the market access variables used in this study entail some broad assumptions about the transport mode and its speed (i.e., walking when off road, using car/van when on road). However, a more fundamental weakness in the use of travel time to urban marketplace as an indicator of market access is the role of agricultural traders operating from their own vehicles. As Nandi et al. (2021) note, there is no consensus within the literature as to when the proximity to road or the travel time to physical market place is a more useful indicator. A further source of potential uncertainty is the dietary diversity recall reported by survey respondents. The use of lean season and flush season as recall periods means that the period of recall can be as much as 11 months in the past. This is contrary to best practice guidance Verger et al. (2019) suggesting the use of recall period the 24 h previous to the survey. Interviewee memory of food consumption 11 months in the past is likely to include some inaccuracy, but it does allow the recall periods to be compared regardless of the timing of the survey.
Conclusion
The risk of malnutrition, particularly micro-nutrient deficiency, is high among smallholder farmers in Sub-Saharan Africa, including Kenya. It is widely accepted that the existence of markets can play a key role for achieving good nutrition levels at the food shed level. In this study we used two proxy measures of market access and six household characteristics extracted from almost one thousand household surveys in South and West Kenya, to conduct a spatially-explicit, multi-level assessment of the impact of market access on household dietary diversity. Our analysis identified 12 clusters and 3 more general groups of households involving different configurations of farms and market access, each of which has been supported by studies conducted elsewhere. This indicates that the spatially explicit approach used in this study indeed permitted the identification of meaningful nuances within the study population. When looking critically at the model results it could be proposed that there is an optimum market access to land cultivated ratio to achieve dietary diversity. This optimum is for households whose market access is between 3 and 10 min walking distance to the nearest road, cultivate land between 1 and 2 ha and own livestock holdings between 4 and 5 TLUs. But this belies that across the 12 household clusters identified, the households have very different available resource and implement very different dietary diversity strategies. With the increasing threat of climate change and population pressure on smallholder farmers, the imperative for designing locally effective interventions to increase food security that are based on locally-specific evidence has never been higher. The methodology proposed here provides a way to simultaneously assess the varying impacts of multiple variables at the farm-household level at specific locations. This analytical method goes beyond what is possible with meta-analysis, and can permit policy-relevant insights to be spatially disaggregated.
Data availability statement
The datasets presented in this study can be found in online repositories. The names of the repository/repositories and accession number(s) can be found below: https://doi.org/10.7910/DVN/9M6EHS.
Author contributions
DM: overall author responsible for all parts of the research. LW: detailed guidance on modeling and model development. JH and MW: study concept, data, and text development. All authors contributed to the article and approved the submitted version.
Funding
JH acknowledges funds from the One CGIAR Initiative on Sustainable Animal Productivity for Livelihoods, Nutrition and Gender Inclusion (SAPLING). MW acknowledges funds from the One CGIAR Initiative on Sustainable Intensification of Mixed Farming Systems (SI-MFS). This work was supported by the Engineering and Physical Sciences Research Council (EPSRC) [grant number EP/S023569/1].
Conflict of interest
The authors declare that the research was conducted in the absence of any commercial or financial relationships that could be construed as a potential conflict of interest.
The reviewer KS declared a shared affiliation with the authors DM, MW, and JH at the time of review.
Publisher's note
All claims expressed in this article are solely those of the authors and do not necessarily represent those of their affiliated organizations, or those of the publisher, the editors and the reviewers. Any product that may be evaluated in this article, or claim that may be made by its manufacturer, is not guaranteed or endorsed by the publisher.
References
Abafita, J., Atkinson, J., and Kim, C. (2016). Smallholder commercialization in Ethiopia: market orientation and participation. Int. Food Res. J. 23, 1797–1807. doi: 10.48550/arXiv.1111.4246
Arcaya, M (2012). Area variations in health: a spatial multilevel modelling approach. Health Place 18, 824–831. doi: 10.1016/j.healthplace.2012.03.010
Arribas-Bel, D., Garcia-López, M. À., and Viladecans-Marsal, E. (2019). Building (s and) cities: delineating urban areas with a machine learning algorithm. J. Urban Econ. 125, 103217. doi: 10.1016/j.jue.2019.103217
Azzarri, C., Zezza, A., Haile, B., and Cross, E. (2015). Does livestock ownership affect animal source foods consumption and child nutritional status? Evidence from rural Uganda. J. Dev. Stud. 51, 1034–1059. doi: 10.1080/00220388.2015.1018905
Barrett, C.B., Reardon, T., and Webb, P. (2001). Nonfarm income diversification and household livelihood strategies in rural Africa: concepts, dynamics, and policy implications. Food Policy 26, 315–331. doi: 10.1016/S0306-9192(01)00014-8
Bellon, M., Ntandou-Bouzitou, G., Caracciolo, F., and van Wouwe, J. (2016). On-farm diversity and market participation are positively associated with dietary diversity of mothers in Southern Benin, West Africa. PLoS ONE 11, 1–20. doi: 10.1371/journal.pone.0162535
Bryan, E., Ringler, C., Okoba, B., Roncoli, C., Silvestri, S., and Herrero, M. (2013). Adapting agriculture to climate change in Kenya: household strategies and determinants. J. Environ. Manage. 114, 26–35. doi: 10.1016/j.jenvman.2012.10.036
Castello, G., Ruel, M., Winters, P., and Zezza, A. (2015). Farm-level pathways to improved nutritional status: introduction to the special issue. J. Dev. Stud. 51, 945–957. doi: 10.1080/00220388.2015.1018908
Chamberlain, J., and Jayne, T. (2013). Unpacking the meaning of “market access”. World Dev. 41, 245–264. doi: 10.1016/j.worlddev.2012.06.004
Conelly, T., and Chaiken, M. (2000). Intensive farming, agro-diversity, and food security under conditions of extreme population pressure in Western Kenya. Hum. Ecol. 28, 19–51. doi: 10.1023/A:1007075621007
Davidson, K., and Kropp, J. (2017). Does Market Access Improve Dietary Diversity? Evidence from Bangladesh. doi: 10.22004/ag.econ.252854
Dixon, J., Garrity, D., Boffa, J., Willians, O., and Amede, T. (2021). Farming Systems and Food Security in Africa: Priorities for Science and Policy Under Global Change. London: Routledge Publishing.
Ellis, F (1998). Household strategies and rural livelihood diversification. J. Dev. Stud. 35, 1–38. doi: 10.1080/00220389808422553
Ester, M., Kriegel, H.P., Sander, J., and Xu, X. (1996). “A density-based algorithm for discovering clusters in large spatial databases with noise,” in Proceedings of the 2nd International Conference on Knowledge Discovery and Data Mining, Portland, OR, AAAI Press, 226–231.
Fanzo, J., Haddad, L., McLaren, R., Marshall, Q., Davis, C., Herforth, A., et al. (2020). The food systems dashboard is a new tool to inform better food policy. Nat. Food 1, 243–246. doi: 10.1038/s43016-020-0077-y
Fanzo, J., Haddad, L., Schneider, K. R., Bén,é, C., Covic, N. M., Guarin, A., et al. (2021). Viewpoint: rigorous monitoring is necessary to guide food system transformation in the countdown to the 2030 global goals. Food Policy 104, 102163. doi: 10.1016/j.foodpol.2021.102163
FAO (1993). Agro-Ecological Land Resources Assessment for Agricultural Development Planning - A Case Study of Kenya Resources Data Base and Land Productivity Technical Annex 5. Rome: Food and AgriculturalOrganization.
FAO (2013). Guidelines for Measuring Household and Individuals Dietary Diversity. Rome: Food and Agricultural Organization.
FAO (2018). Food Security and Nutrition: Challenges for Agriculture and the Hidden Potential of Soil: A Report To The G20 Agriculture Deputies, with contributions from: International Fund for Agricultural Development (IFAD), International Food Policy Research Institute (IFPRI), The World Bank Group, World Trade Organisation (WTO). Rome: Food and Agriculture Organisation of the UN.
Fotheringham, S (1997). Trends in quantitative methods 1: stressing the local. Prog. Hum. Geogr. 21, 88–96. doi: 10.1191/030913297676693207
Fraval, S, Hammond, J, Bogard, J.R., Ng'endo, M., van Etten, J., Herrero, M., et al. (2019a). Food access deficiencies in sub-Saharan Africa: prevalence and implications for agricultural interventions. Front. Sustain. Food Syst. 3, 104. doi: 10.3389/fsufs.2019.00104
Fraval, S., Hammond, J., Wichern, J., Oosting, S., de Boer, I., Teufel, N., et al. (2019b). Making the most of imperfect data: a critical evaluation of standard information collected in farm household surveys. Exp. Agric. 55, 230–250. doi: 10.1017/S0014479718000388
Fraval, S., Yameogo, V., Ayantunde, A., Hammond, J., de Boer, I. J. M., Osting, S. J., et al. (2020). Food security in rural Burkina Faso: the importance of consumption of own-farm sourced food versus purchased food. Agric. Food Secur. 9, 2. doi: 10.1186/s40066-020-0255-z
Frelat, R., Lopez-Ridaura, S., Giller, K., Herrero, M., Douxchamps, S., Djurfeldt, A., et al. (2015). Drivers of household food availability in sub-Saharan Africa based on big data from small farms. Proc. Nat. Acad. Sci. 113, 458–463. doi: 10.1073/pnas.1518384112
Gelman, A (2006). Multilevel (hierarchical) modelling: what it can and cannot do. Technometrics 48, 432–435. doi: 10.1198/004017005000000661
Gelman, A., and Hill, J. (2006). Data analysis Using Regression and Multilevel/Hierarchical Models. Cambridge University Press.
Hammond, J., Fraval, S., van Etten, J., Suchini, J., Mercado, L., Pagella, T., et al. (2017). The rural household multi-indicator survey (RHoMIS) for rapid characterisation of households to inform climate smart agriculture interventions: description and applications in East Africa and Central America. Agric. Syst. 151, 225–233. doi: 10.1016/j.agsy.2016.05.003
Herrero, M., Thornton, P., Power, B., Bogard, J., Remans, R., Fritz, S., et al. (2017). Farming and the geography of nutrient production for human use: a transdisciplinary analysis. Lancet Planetary Health 1, 33–42. doi: 10.1016/S2542-5196(17)30007-4
Hoffman, M., and Gelman, A. (2011). The no-U-turn sampler: adaptively setting path lengths in Hamiltonian Monte Carlo. J. Mach. Learn. Res. 15, 1593−1623. doi: 10.5555/2627435.263858610.5555/2627435.2638586
Ickowitz, A., Powell, B., Rowland, D., Jones, A., and Sunderland, T. (2019). Agricultural intensification, dietary diversity, and markets in the global food security narrative. Global Food Secur. 20, 9–16. doi: 10.1016/j.gfs.2018.11.002
IFPRI (2002). Dietary Diversity as a Food Security Indicator, FCND Discussion Paper, No. 136. Washington: International Food Policy Research Institute.
International Food and Policy Research Institute. (2013). Atlas of African Agriculture Research and Development: Revealing Agriculture's Place in Africa. Washington, DC: International Food and Policy Research Institute.doi: 10.2499/9780896298460
Jones, A (2016). Critical review of the emerging research evidence on agricultural biodiversity, diet diversity, and nutritional status in low- and middle-income countries. Nutr. Rev. 75, 769–782. doi: 10.1093/nutrit/nux040
Kadiyala, S., Harris, J., Headey, D., Yosef, S., and Gillespie, S. (2014). Agriculture and nutrition in india: mapping evidence to pathways. Ann. N. Y. Acad. Sci. 1331, 43–56. doi: 10.1111/nyas.12477
Koppmair, S., Kassie, M., and Qaim, M. (2017). Farm production, market access and dietary diversity in Malawi. Public Health Nutr. 20, 325–335. doi: 10.1017/S1368980016002135
Kottek, M., Grieser, J., Beck, C., Rudolf, B., and Rubel, F. (2006). World map of the Koppen-Geiger climate classification updated. Meterol. Zeitschrift 15, 259–263. doi: 10.1127/0941-2948/2006/0130
Nandi, R., Nedumaran, S., and Ravula, P. (2021). The interplay between food market access and farm household dietary diversity in low and middle income countries: a systematic review of literature. Global Food Secur. 28, 100484. doi: 10.1016/j.gfs.2020.100484
Qaim, M., Sibhatu, K., and Krishna, V. (2016). Market access and farm household dietary diversity. Rural. 21, 12–14. Available online at: https://www.rural21.com/fileadmin/downloads/2016/en-01/rural2016_01-S12-14.pdf
Ritzema, R. S., Douxchamps, S., Fravel, S., Bolliger, A., Hok, L., Phengsavanh, C. T. M., et al. (2019). Household-level drivers of dietary diversity in transitioning agricultural systems: Evidence from the Greater Mekong Subregion. Agri. Syst. 176, 102657. doi: 10.1016/j.agsy.2019.102657
Ruel, M., Quisumbing, A., and Balagamwala, M. (2018). Nutrition-sensitive agriculture: what have we learned so far? Global Food Secur. 17, 128–153. doi: 10.1016/j.gfs.2018.01.002
Schubert, E., Sander, J., Ester, M., and Kriegel, H. (2017). DBSCAN revisited: why and how you should (still) use DBSCAN. ACM Trans. Database 42, 19–40. doi: 10.1145/3068335
Sibhatu, K., Krishna, V., and Qaim, M. (2015). Production diversity and dietary diversity in smallholder farm households. Proc. Natl. Acad. Sci. USA. 112, 10657–10662. doi: 10.1073/2Fpnas.1510982112
Sibhatu, K., and Qaim, M. (2017). Rural food security, subsistence agriculture, and seasonality. PLoS ONE 12, e0186406. doi: 10.1371/journal.pone.0186406
Snapp, S., and Fisher, M. (2015). “Filling the maize basket” supports crop diversity and quality of household diet in Malawi. Food Secur. 7, 83–96. doi: 10.1007/s12571-014-0410-0
Stefanovic, L., Freytag-Leyer, B., and Kahl, J. (2020). Food system outcomes: an overview and the contribution to food systems transformation. Front. Sustain. Food Syst. 4, 546167. doi: 10.3389/fsufs.2020.546167
Stifel, D., and Minten, B. (2008). Isolation and agricultural productivity. Agric. Econ. 39, 1–15. doi: 10.1111/j.1574-0862.2008.00310.x
Subramanian, S. V., Jones, K., Kaddour, A., and Krieger, N. (2009). Revisiting Robinson: the perils of individualistic and ecological fallacy. Int. J. Epidemiol. 38, 342–360. doi: 10.1093/ije/dyn359
Thornton, P., and Herrero, M. (2014). Climate change adaptation in mixed crop-livestock systems in developing countries. Global Food Secur. 3, 99–107. doi: 10.1016/j.gfs.2014.02.002
van Wijk, M., Hammond, J., Gorman, L., Adams, S., Ayantunde, A., Baines, D., et al. (2020). The rural household multiple indicator survey, data from 13,310 farm households in 21 countries. Sci. Data 7, 46. doi: 10.1038/s41597-020-0388-8
Verger, E., Ballard, T., Dop, M., and Martin-Prevel, Y. (2019). Systematic review of use and interpretation of dietary diversity indicators in nutrition-sensitive agriculture literature. Global Food Secur. 20, 156–169. doi: 10.1016/j.gfs.2019.02.004
Wiggins, S., and Keats, S. (2013). Leaping and Learning: Linking Smallholders to Markets, Agriculture for Impact. London: Imperial College London.
Wilkus, E., Roxburgh, C., and Rodriguez, D. (2019). Understanding Household Diversity in Rural Eastern and Southern Africa. Canberra: Australian Centre for International Agricultural Research Monograph, 205p.
Keywords: market access, food systems, agriculture, smallholders, multi-level modeling, Bayes' theorem, Bayesian
Citation: Milner D, Wolf L, Wijk MV and Hammond J (2022) Market access and dietary diversity: A spatially explicit multi-level analysis in Southern and Western Kenya. Front. Sustain. Food Syst. 6:740485. doi: 10.3389/fsufs.2022.740485
Received: 14 July 2021; Accepted: 05 July 2022;
Published: 10 August 2022.
Edited by:
Alexandros Gasparatos, The University of Tokyo, JapanReviewed by:
Kelvin Mashisia Shikuku, International Livestock Research Institute (ILRI), KenyaUgo Pica-Ciamarra, Food and Agriculture Organization of the United Nations, Italy
Eric Brako Dompreh, The University of Tokyo, Japan
Copyright © 2022 Milner, Wolf, Wijk and Hammond. This is an open-access article distributed under the terms of the Creative Commons Attribution License (CC BY). The use, distribution or reproduction in other forums is permitted, provided the original author(s) and the copyright owner(s) are credited and that the original publication in this journal is cited, in accordance with accepted academic practice. No use, distribution or reproduction is permitted which does not comply with these terms.
*Correspondence: Daniel Milner, ZG0xNzYyNEBicmlzdG9sLmFjLnVr