 Stewart A. Jennings1*
 Andrew J. Challinor1
 Pete Smith2
 Jennie I. Macdiarmid3
 Edward Pope4
 Sarah Chapman1Catherine Bradshaw4,5Heather Clark6
 Sylvia Vetter2Nuala Fitton2
 Richard King7Sithembile Mwamakamba8
 Tshilidzi Madzivhandila8
 Ian Mashingaidze8Christian Chomba9Masiye Nawiko9Bonani Nyhodo10Ndumiso Mazibuko10Precious Yeki10Pamela Kuwali11Alfred Kambwiri11Vivian Kazi12Agatha Kiama12Abel Songole12
 Helen Coskeran13
 Claire Quinn14
 Susannah Sallu14
 Andrew Dougill14
 Stephen Whitfield14Bill Kunin13Nalishebo Meebelo15Andrew Jamali16Dhaquirs Kantande17Prosper Makundi18
 Winfred Mbungu19Frank Kayula20
 Sue Walker21,22
 Sibongile Zimba13
 Joseph Hubert Galani Yamdeu23,24
 Ndashe Kapulu23
 Marcelo Valadares Galdos1
 Samuel Eze14Hemant G. Tripathi13,25
 Steven M. Sait13
 Stefan Kepinski13
 Emmanuel Likoya14
 Henry Greathead13
 Harriet Elizabeth Smith14Marcelin Tonye Mahop14Helen Harwatt7Maliha Muzammil7
 Graham Horgan26Tim Benton7
- 1Institute for Climate and Atmospheric Science, School of Earth and Environment, University of Leeds, Leeds, United Kingdom
- 2Institute of Biological and Environmental Sciences, University of Aberdeen, Aberdeen, United Kingdom
- 3School of Medicine, Medical Sciences and Nutrition, The Rowett Institute, University of Aberdeen, Aberdeen, United Kingdom
- 4Hadley Centre, Met Office, Exeter, United Kingdom
- 5Global Systems Institute, University of Exeter, Exeter, United Kingdom
- 6School of Medicine, Medical Sciences and Nutrition, Institute of Applied Health Sciences, University of Aberdeen, Aberdeen, United Kingdom
- 7Chatham House, Royal Institute of International Affairs, London, United Kingdom
- 8Food, Agriculture and Natural Resources Policy Analysis Network, Pretoria, South Africa
- 9Agricultural Consultative Forum, Lusaka, Zambia
- 10National Agricultural Marketing Council, Pretoria, South Africa
- 11Civil Society Agriculture Network, Lilongwe, Malawi
- 12Economic and Social Research Foundation, Dar es Salaam, Tanzania
- 13School of Biology, Faculty of Biological Sciences, University of Leeds, Leeds, United Kingdom
- 14Sustainability Research Institute, School of Earth and Environment, University of Leeds, Leeds, United Kingdom
- 15Regional Network of Agricultural Policy Research Institutes, Lusaka, Zambia
- 16Malawi National Planning Commission, Lilongwe, Malawi
- 17Concern Worldwide, Lilongwe, Malawi
- 18Environmental Management Unit, Ministry of Agriculture, Dodoma, Tanzania
- 19Sokoine University of Agriculture, Morogoro, Tanzania
- 20Kaypro Research Institute, Lusaka, Zambia
- 21Agricultural Research Council, Pretoria, South Africa
- 22University of the Free State, Bloemfontein, South Africa
- 23School of Food Science and Nutrition, University of Leeds, Leeds, United Kingdom
- 24Section of Natural and Applied Sciences, School of Psychology and Life Sciences, Canterbury Christ Church University, Canterbury, United Kingdom
- 25UN Environment Programme-World Conservation Monitoring Centre (UNEP-WCMC), Cambridge, United Kingdom
- 26Biomathematics and Statistics Scotland, Aberdeen, United Kingdom
Climate change will put millions more people in Africa at risk of food and nutrition insecurity by 2050. Integrated assessments of food systems tend to be limited by either heavy reliance on models or a lack of information on food and nutrition security. Accordingly, we developed a novel integrated assessment framework that combines models with in-country knowledge and expert academic judgement to explore climate-smart and nutrition-secure food system futures: the integrated Future Estimator for Emissions and Diets (iFEED). Here, we describe iFEED and present its application in Malawi, South Africa, Tanzania and Zambia. The iFEED process begins with a participatory scenario workshop. In-country stakeholders identify two key drivers of food system change, and from these, four possible scenarios are defined. These scenarios provide the underlying narratives of change to the food system. Integrated modeling of climate change, food production and greenhouse gas emissions is then used to explore nutrition security and climate-smart agriculture outcomes for each scenario. Model results are summarized using calibrated statements—quantitative statements of model outcomes and our confidence in them. These include statements about the way in which different trade futures interact with climate change and domestic production in determining nutrition security at the national level. To understand what the model results mean for food systems, the calibrated statements are expanded upon using implication statements. The implications rely on input from a wide range of academic experts—including agro-ecologists and social scientists. A series of workshops are used to incorporate in-country expertise, identifying any gaps in knowledge and summarizing information for country-level recommendations. iFEED stakeholder champions help throughout by providing in-country expertise and disseminating knowledge to policy makers. iFEED has numerous novel aspects that can be used and developed in future work. It provides information to support evidence-based decisions for a climate-smart and nutrition-secure future. In particular, iFEED: (i) employs novel and inclusive reporting of model results and associated in-country food system activities, with comprehensive reporting of uncertainty; (ii) includes climate change mitigation alongside adaptation measures; and (iii) quantifies future population-level nutrition security, as opposed to simply assessing future production and food security implications.
1. Introduction
Holistic assessments of climate change impacts and adaptation options require complex integrated knowledge of socio-environmental systems and their inherent uncertainties. Food system adaptation is therefore often referred to as a “wicked problem” (Vermeulen et al., 2013). Required policy decisions become even more complex when seeking to also minimize greenhouse gas (GHG) emissions and enhance food and nutrition security.
The Food and Agricultural Organization (FAO) define food security as “a situation that exists when all people, at all times, have physical, social and economic access to sufficient, safe and nutritious food that meets their dietary needs and food preferences for an active and healthy life.” This is commonly distilled into four “pillars”: availability, access, utilization, and stability over time. Discussion of food security has tended to focus on averting shortfalls in calories. But achieving food security means eliminating all forms of malnutrition (HLPE, 2017), including overnutrition and undernutrition, and taking into account macro- and micronutrients. Here we use the term “nutrition security” to refer specifically to an adequate supply of calories and nutrients for the population. Such complex processes inevitably require assessments of trade-offs and synergies that are challenging to include in modeling systems, and to date, there is comparatively little research in the area of food utilization in particular (Wheeler and von Braun, 2013). For these reasons, a broad range of approaches to assessing pathways toward achieving nutrition security under climate change are needed (Vermeulen et al., 2013). For example, assessments risk losing relevance if they are limited to yield and production projections. Stakeholder input can be used to direct modeling to develop country-specific adaptation recommendations given modeling outcomes (Campbell et al., 2016).
Crop modeling—driven by model projections of climate change—is a powerful tool used to assess future food production (see e.g., Ewert et al., 2015). A range of models with differing degrees of complexity are available for this purpose (Challinor et al., 2009). Integrated Assessment Models (IAMs) describe interactions between the biophysical and socio-economic systems, including how climate change and land use choices impact food production and GHG emissions. IAMs have been used for assessments of future food outcomes (e.g., see Müller and Robertson, 2014). Such models can be difficult to interpret given the complexity of these interrelated processes and uncertainty propagation (Webber et al., 2014; Ewert et al., 2015). The choice of mechanistic detail inherently determines, to a large degree, the skill of the model: too simple and the real-world processes are not captured; too complex and the determination of, and interaction between, model parameters becomes difficult to constrain with observations (Challinor et al., 2018). Thus, models should be of appropriate complexity, which will vary according to the problem being addressed and the observed data available for calibration and evaluation.
Assessment of future national-scale nutrition security can draw on integrated modeling of national-scale changes to future food supply, and resulting changes in per capita nutrient availability. However, analysis of appropriate complexity suggests that not all components of the food system can be explicitly modeled because of a lack of data and understanding of certain underlying processes and how these might scale up to the national level (Sinclair and Seligman, 2000). For example, how national-scale changes to climate change adaptation strategies might affect food access for different demographics is beyond the capabilities of models that seek to represent national-scale nutrition security. Even if all processes were included, this would introduce model components that cannot be evaluated robustly using the available data.
Given the importance of complex, place-based (Beveridge et al., 2018) processes that contribute to determining nutrition security outcomes, and the inability of models to robustly represent these processes, the integration of country-specific knowledge, social science and ecological context with modeling is of high importance in integrated assessments of nutrition security. An integrated assessment framework that combines stakeholder (including policy makers) and academic expertise with integrated climate-food-emissions modeling can therefore help to bridge the gap between large-scale integrated modeling and policy-relevant outputs (Webber et al., 2014; Hamilton et al., 2015).
Scenario frameworks have underpinned much research on global environmental changes over the last four decades, including integrated assessment modeling (O'Neill et al., 2020). Scenarios can serve as a platform around which to explore uncertainties in the future through trade-offs and synergies of interest to decision-makers, across a range of possible futures. While significant progress has been made in this area, O'Neill et al. (2020) highlight that room for improvement remains, notably in the integration of stakeholders in the scenario development process.
In their forward-looking review, Challinor et al. (2018) recommend reframing uncertainty quantification into statements concerning possible risks, especially around processes and trade-offs, as these are likely to be more informative than large uncertainty ranges. Using expert judgement to assess uncertainty is therefore of high importance in policy-oriented modeling. The leading example of this with regard to climate change is the Intergovernmental Panel On Climate Change (IPCC) methodology that ascribes confidence to statements based on the level of result robustness and agreement (Mastrandrea et al., 2011).
Here, we present the integrated Future Estimator for Emissions and Diets (iFEED)—a novel integrated assessment framework for delivering evidence to inform national-level policies on climate-smart and nutrition-secure food systems. iFEED builds upon previous climate change adaptation studies, as recommended by Webber et al. (2014) in that it provides a framework for the integration of climate-food-emissions modeling with in-country agricultural expertise and a range of expert knowledge from the social, climate, agricultural, ecological and nutritional sciences, thus ensuring that results can inform policy and do not omit in-country knowledge. Uncertainty in model outcomes is accounted for using confidence statements that summarize all sources of inherent uncertainty and frame conclusions with appropriate levels of confidence that are supported by expert opinion and the wider literature—thus building on the example of the IPCC (Mastrandrea et al., 2011). A stakeholder-driven scenarios framework is used to characterize possible futures, as recommended by O'Neill et al. (2020); contrasting these possible futures enables robust conclusions to be made regarding the direction of future environmental and policy change, despite the large irreducible uncertainties involved. In summary, iFEED provides a transparent and alternative approach to IAMs in order to assess nutrition security and climate smartness—both of which are neglected areas in climate change impacts and food security scenario studies (Challinor et al., 2018; van Meijl et al., 2020).
The iFEED methodological framework was developed and applied in four case study countries in sub-Saharan Africa: Malawi, South Africa, Tanzania and Zambia. This is a region where climate change will put millions more people at risk of nutrition insecurity by 2050 (Mbow et al., 2017). Holistic policies on agriculture, nutrition and trade are therefore urgently needed (Challinor et al., 2017). The methodology is transferrable to other regions of the globe, since the process includes in-country stakeholder engagement throughout, as well as widely-available climate-food-emissions modeling tools, nutrition data, and expert judgement on future agricultural trade developments.
2. Methods
iFEED consists of three stages. Each stage is described in the sections as detailed below, and includes a case study of how the methodology was applied in the iFEED case study countries.
Section 2.1 describes the stakeholder-driven scenarios of food system futures (Figure 1; foundation of pyramid). Section 2.1.1 describes the generic scenario process, and Section 2.1.2 its application in case study countries, including stakeholder agreement of changes to agricultural land use, trade, technological impacts on crop yields and adaptation to climate change that take place in each scenario.
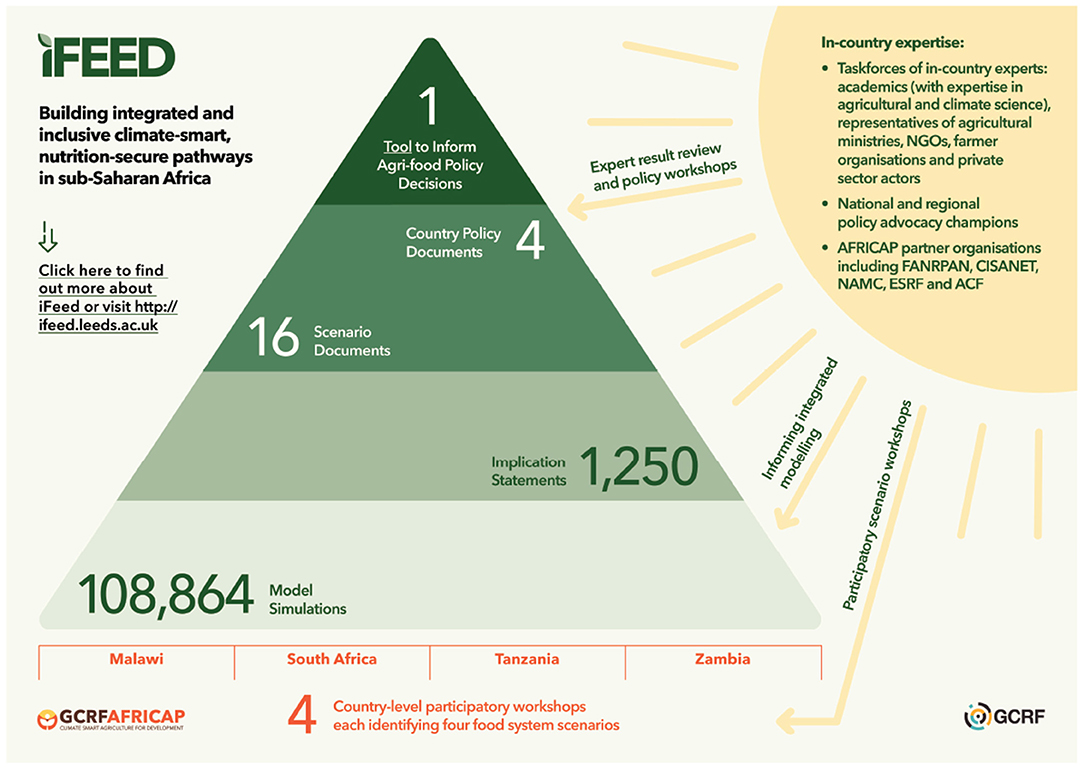
Figure 1. iFEED overview.
Section 2.2 describes the integrated climate-food-emissions modeling (Figure 1; first layer of pyramid), including how modeling is summarized using calibrated result statements that are associated with confidence assessments based on expert judgement and literature analysis. Section 2.2.3 details the application of the modeling framework in the specific case study countries.
Section 2.3 describes the process of how model results are expanded upon by a wide range of academic and in-country agricultural experts, ultimately to produce country-level policy recommendations for climate-smart nutrition security (Figure 1; top three layers of pyramid). Section 2.3.2 details the application of expert elicitation in the specific case study countries.
2.1. Stakeholder-Driven Scenario Framework
2.1.1. Participatory Scenario Workshops and the Development of Scenario Narratives
There is considerable uncertainty surrounding how food systems will evolve between now and 2050. Plans to develop agricultural systems should recognize this uncertainty and be robust to different possibilities.
A scenario exercise can help with planning for uncertainty by exploring the range of possibilities that the future may hold (Benton, 2019; O'Neill et al., 2020). In such a process, food system stakeholders identify a set of driving forces that shape future food system outcomes. Through discussion, two independent and impactful drivers (known as critical uncertainties) are selected over which there is high uncertainty, thus maximizing the range of possible futures.
The two critical uncertainties are used to create a 2 x 2 matrix that frames four potential future scenarios. Each one of these scenarios is discussed in detail, creating a narrative-driven scenario into which all driving forces of change can be integrated. Subsequently, in-country experts give inputs as to how to represent scenarios in the modeling framework.
2.1.2. Case Study Country Scenarios-Taskforce Input Describing Land Use Allocation, Crop Management, and Adaptation Options
Stakeholders participating in scenario workshops in each case study country consisted of representatives of government, academia, civil society and the agriculture sector—intended to be representative of as broad a range of food system expertise as possible.
In all four countries analyzed, climate risk was selected by workshop participants as the most important critical uncertainty by majority vote. In South Africa, Tanzania, Zambia and Malawi, the second-most voted upon critical uncertainties selected were the extent of land reform, technological development, market connectivity and the efficacy of cross-sectoral food system policies, respectively. In Malawi, efficacy of food system policy implementation was also associated with technological development; in Zambia, technology was also voted upon as an important factor and included in narratives alongside market connectivity. South Africa's non-climate critical uncertainty (land reform) was not associated with technological development, unlike the other countries.
After the scenario narratives were developed, a taskforce of stakeholders was selected by in-country project partner organizations, composed of individuals with expertise in climate-smart agriculture, nutrition security and agricultural and food systems policy. For each country's four scenarios, taskforce members shared their perspectives on how key agricultural trade, land use and crop management factors that can be represented in the integrated modeling system will change from the baseline period (centered on 2000) to 2050. The latter was chosen as a year of focus for this analysis to represent a time far enough in the future such that significant changes to the food system would be possible, due to policy implementation, demographic and biophysical changes.
Specifically, taskforce guidance was sought on changes to arable land area, pasture area for livestock, crop diversity and irrigated area. Input on possible changes to agricultural imports and exports was also provided. Further taskforce input was sought on how to represent adaptation of crops to climate change and how much technological improvements over time will affect crop yields. High technology/high market function/effective policy scenarios in Tanzania, Zambia and Malawi, respectively, were associated with the same percentage increases to yields per crop as were seen historically in observations from 1960 to 2010 - equal to an approximate doubling of crop productivity on average. For South Africa, the non-climate critical uncertainty (land reform) was not associated clearly with technological development in this manner, and therefore an intermediate yield trend was assumed of half that seen historically.
For high technology/high market function/high land reform/effective policy scenarios, where temperature caused a systematic reduction in crop growing season length, varieties were assumed to exist in 2050 that compensate for this projected shortening of the growing season. For the contrasting low technology/low market function/little land reform/ineffective policy scenarios, crop sowing windows and varieties were assumed to be restricted to varieties available in the baseline. Lastly, if stakeholders suggested an increase in irrigation was likely to occur in any scenario, all future areas not currently irrigated in the baseline were assumed to be irrigated.
If there was disagreement among stakeholders the majority opinion was selected; if there was no clear majority, a decision was agreed between the modeling team and stakeholders. Stakeholder scenario assumptions are listed in Supplementary Table S5.
2.2. Integrated Modeling of Scenarios
2.2.1. Food Production, Emissions, Trade, and Nutrition Security Outcomes
An integrated climate-food-emissions modeling framework uses multiple models and data sets to represent the impacts of climate change on crop yields, food production, GHG emissions and soil organic carbon. The end result is an assessment of how climate-smart and nutrition-secure each scenario is.
The first stage of the modeling framework is to use future climate projections to model a range of crops that are important from a food security perspective in the Southern Africa region [Figure 2, left-hand side (1)]. Food production changes are based on these projections, stakeholder-prescribed land use assumptions and crop land allocation [Figure 2, center (2)], including required changes to irrigation water [Figure 2, right-hand side (3)]. An analysis of nutrient supplies and requirements given domestic production outcomes and demographic changes under a range of illustrative trade vignettes then provides an assessment of plausible population-level nutrition security outcomes [Figure 2, right-hand side (4)].
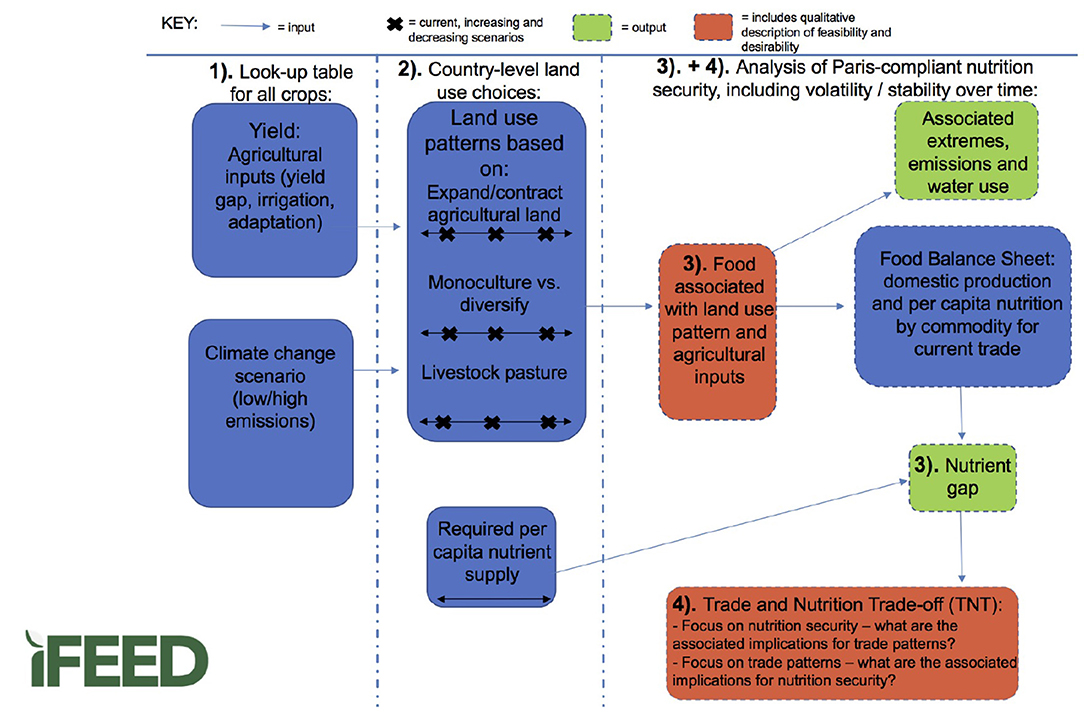
Figure 2. Schematic outlining iFEED modeling framework.
GHG emissions and soil organic carbon are modeled following the food production projections [Figure 2, (3)], assessing changes to net emissions and emissions intensity by taking into account crop and livestock production change and land use change. Alongside the integrated modeling of nutrition security and emissions, separate analysis of climate extremes ensures that the changing variability of climate change and its impacts are taken into account.
Section 2.2.3 describes the specific modeling for the four case study countries.
2.2.2. Calibrated Statements Summarizing Model Outputs
For each component of the integrated modeling, modeling experts summarize results using concise statements of key results called calibrated statements (CS). Each CS is associated with an assessment of confidence. Confidence is expressed in terms of the robustness of the evidence (based on any available quantifications of uncertainty, such as across climate model inputs, and the expert judgement of the modelers) and agreement of iFEED results with other work (based on assessments of the wider literature). An aggregate assessment of confidence is then made for each CS, combining both robustness and agreement assessments (see Table 1). This confidence assessment is based on IPCC uncertainty guidelines (Mastrandrea et al., 2011).
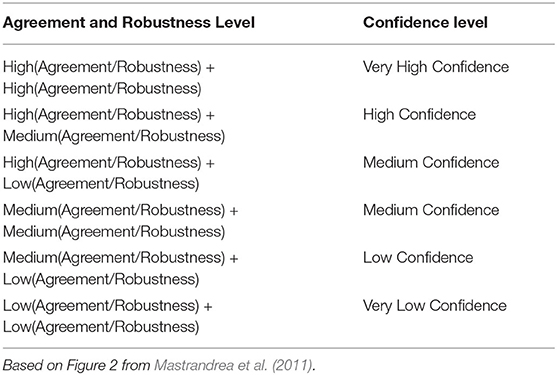
Table 1. Confidence assessments based on model robustness and agreement with literature.
2.2.2.1. Robustness Assessment
An assessment of CS robustness to model assumptions and decisions is made, for example how changes to crop model parameters or climate model inputs might affect crop yield outcomes. Robustness assessments therefore include the uncertainty associated with the climate model input data, but are not limited to this—they take into account judgement of how robust the conclusion is given all relevant decisions and assumptions that go into representing a particular model component of each modeled scenario.
IPCC calibrated language is used to allocate low/medium/high robustness. Robustness is allocated by judging whether, with different possible parameters/assumptions/climate model inputs:
• A different main conclusion is likely (e.g., >33% of climate models are outliers*) = Low robustness.
• The main conclusion is most likely the same (e.g., 10 to 33% of climate models are outliers) = Medium robustness.
• The conclusion is virtually certain/very likely the same (e.g., <10% of climate models are outliers) = High robustness.
*outliers are defined as being 1.5 x IQR +/− 3rd/1st quartile.
2.2.2.2. Agreement Assessment
An assessment is also made of the agreement of the CS with relevant material from the scientific literature:
• Low agreement = the majority of other information disagrees with iFEED results. For example, the average projected change is significantly different to the typical changes reported in the literature, and some projections are outside of the full literature range.
• Medium agreement = partial agreement with other information. For example, the average change is outside of the typical range, but all projections overlap with the full literature range.
• High agreement = strong agreement with other sources of information. For example, the average projected change is within the typical changes reported in the literature, and all projections are within the full literature range.
2.2.2.3. Combined Confidence Assessment
A combined confidence score is then given, incorporating both robustness and agreement, as shown in Table 1. For example, if a CS is associated with high robustness but low agreement with the literature, it is associated with medium confidence.
2.2.3. Case Study Country Integrated Modeling
This section contains the specifics of iFEED modeling applied in Malawi, South Africa, Tanzania and Zambia. Firstly, the preparation of specific input data for application in these countries is detailed, and then the modeling methods are described.
2.2.3.1. Input Data
2.2.3.1.1. Climate Data. Coupled Model Intercomparison Project Phase 5 (CMIP5) climate projections were used as climate input data for the iFEED analysis. These data were bias-corrected to more accurately represent the African climate using WFDEI data (WATCH Forcing Data methodology applied to ERA-Interim data) and the cumulative distribution function transform (CDF-t) method (Famien et al., 2018). The data were from the years 1980 to 2099, and available at 0.5° resolution. We used data from two Representative Concentration Pathways (RCPs)—RCP2.6 and RCP8.5—to represent the low and high climate change risk scenarios, respectively. RCP2.6 represents an optimistic climate change scenario, with emissions peaking and declining before 2050. RCP8.5 represents a pessimistic climate change scenario, with emissions continuing to rise in 2100.
From the original 29-model ensemble of Famien et al. (2018), models were limited to those that had data for both RCPs of interest to allow a direct comparison of models in the two RCP ensembles. That meant that the following models were excluded as they did not have data for RCP2.6: ACCESS1-0, ACCESS1-3, CMCC-CESM, CMCC-CM, CMCC-CMS, HadGEM2-CC, IPSL-CM5B-LR, MRI-ESM1 and inmcm4.
Two further models (HadGEM2-ES and HadGEM2-AO) were excluded from the CMIP5 ensemble as they did not have full 365-day calendar years of bias-corrected data which the daily time-step modeling requires. This left a total of 18 models in the bias-corrected CMIP5 ensemble used in this analysis: bcc-csm1-1, BNU-ESM, CSIRO-Mk3-6-0, GFDL-ESM2G, IPSL-CM5A-LR, MIROC-ESM, MPI-ESM-LR, MRI-CGCM3, NorESM1-M, bcc-csm1-1-m, CanESM2, CNRM-CM5, GFDL-CM3, GFDL-ESM2M, IPSL-CM5A-MR, MIROC5, MIROC-ESM-CHEM, and MPI-ESM-MR.
The size of the climate model ensemble (ranging from a possible 25 to 42 models in the case of CMIP5 models; Taylor et al., 2012) can be prohibitive in studies where climate model data are used as inputs into other complex impacts models. Representative subsets of climate models are therefore useful in that they allow a regionally-specific representative range of climate projections, whilst allowing computer simulation time to be devoted to other areas within the impacts arena (McSweeney and Jones, 2016). Note that a subset of 5 of the 18 climate models is used for the trade and nutrition analysis, and the emissions and soil organic carbon modeling. See climate model input data Supplementary Section S1.5 for more information on how this subset was selected using the methods of Ruane and McDermid (2017).
2.2.3.1.2. Soil Data. Soil data were from the Regridded Harmonized World Soil Database v 1.2 (Wieder et al., 2014). The soil input parameters required for crop modeling were the drained lower limit, drained upper limit and saturation limit. Percentage values of sand and clay, aggregated to the 0.5° grid, were used to calculate the above hydrological parameters using the method of Saxton et al. (1986).
2.2.3.1.3. Crop Area and Irrigation Information. For the food production analysis, LUH2 data (Hurtt et al., 2011) were used as land use data. This dataset features different land cover classes but not crop-specific data; instead, LUH2 provides information on broad crop photosynthetic pathway categories such as C4 annual and C3 annual crops. These crop classes were calculated by aggregating the crop-specific area data from Monfreda et al. (2008) to the relevant class.
The area data were matched to 2000 FAO national area totals for each crop by dividing the relevant class, based on the national fraction of LUH2 categories that were each crop according to FAO data. For example, if the FAO maize area was 60% of the total LUH2 C4 area in Zambia, 60% of the C4 area in each grid cell in Zambia was assumed to be maize. In some cases, insufficient area data were available for a crop type. If this occurred, area was re-categorized from other categories and assigned to the relevant crop class. In Malawi, other crop and pasture areas were re-categorized to C3 and C4 annual crops to match FAO area information. In Tanzania, C3 annual crop area data were re-categorized to add to the C3 nitrogen-fixing crop areas to match FAO statistics. This process was done sequentially in each grid cell, so that area was taken from the most similar land use type first, in order of: other annual crop area, other perennial crop area, and lastly pasture area.
Irrigation for the baseline was determined by a majority grid cell approach using the MIRCA data set (Monthly Irrigated and Rainfed Crop Areas; Portmann et al., 2010), representing information from the years 1998–2002. If greater than 50% of growing area in a grid cell was irrigated, supplementary irrigation simulations were used for that grid cell.
Shapefiles from the Database of Global Administrative Areas were used to define national boundaries (http://www.gadm.org/). Data were gridded onto a 0.5° grid to match the climate data using the statistical software R (R Core Team, 2017) and the Geospatial Data Abstraction software Library (GDAL/OGR contributors, 2019). In any grid containing two or more countries, the grid cell was assigned to the country with the largest fraction of area in that grid cell.
2.2.3.1.4. Protected Area Information. Data from the World Database on Protected Areas (WDPA; UNEP-WCMC and IUCNe, 2019) were used to define the amount of protected areas at the national scale that were excluded from baseline and future agricultural use. Data were gridded onto a 0.5° grid to match the available weather data using the statistical software R (R Core Team, 2017).
WDPA data consist of polygons and point data. Point data are associated with latitude and longitude but do not have boundary information. These data were included by adding the protected area from each point to the relevant grid cell. Any points that overlap with polygons were excluded.
Some of the designated protected area polygons in WDPA overlap—i.e., the same protected area can have multiple designations in the data set. Any duplicated or overlapping areas were removed from the data set when gridding. Any protected areas with unreported area were also excluded, as were protected areas with polygons smaller than 0.01 km2 as this is the approximate size of grid cells at the equator of the resolution used to grid and aggregate the WDPA data. Marine-protected areas were not included, and any protected areas designated or reported after the year 2000 were excluded as this is the center of the baseline period (with which crop growing areas are associated). Lastly, point areas were added to each grid cell and the data were aggregated to the 0.5° grid.
2.2.3.2. Modeling for Future Food Projections
The crops modeled in the four case study countries were maize, soybean, potato and groundnut. Modeling of these crops underpinned projections of the full range of agricultural commodities.
The General Large Area Model for annual crops (GLAM; Challinor et al., 2004) was used to run crop simulations that assess changes to yield mean and variability in the future. Simulations were conducted using a historical period around the year 2000 (1990 to 2010), out to a future period centered on 2050 (2040–2060). Planting windows and crop varieties were selected based on the combination that returned the highest yield in each year (using a rolling 21-year average). Different crop varieties were defined using different maturity classes. Simulations assumed irrigated conditions according to MIRCA data (Portmann et al., 2010) in the baseline and a range of irrigation conditions in the future (as defined by scenarios—see Supplementary Section S1.7).
Simulations were conducted for RCP2.6 and 8.5 (to represent low and high climate risk) using data from Famien et al. (2018). Carbon dioxide fertilization was accounted for by changing transpiration efficiency, radiation use efficiency and the maximum transpiration rate to simulate the responses seen in FACE data according to Kimball (2016). Additional simulations explored all possible yield gap and irrigation levels, as well as adaptation to not allow systematic reduction in the length of the crop growing season. See Supplementary Section S1.7 for more information on crop modeling methods and for model evaluation in case study countries.
These projections were used as the basis of a “gap-filling” method to assess climate impacts on yields for a full range of agricultural commodities. This involved averaging over C3 crop results for the majority of crops, and using maize projections as the basis for other C4 crops, similarly to Müller and Robertson (2014). Table 2 gives full details of simulated commodities. All crops with growing area according to FAO (2020) in the baseline period were included in the analysis. All crop yields were weighted to match mean baseline yield levels according to FAO (2020).
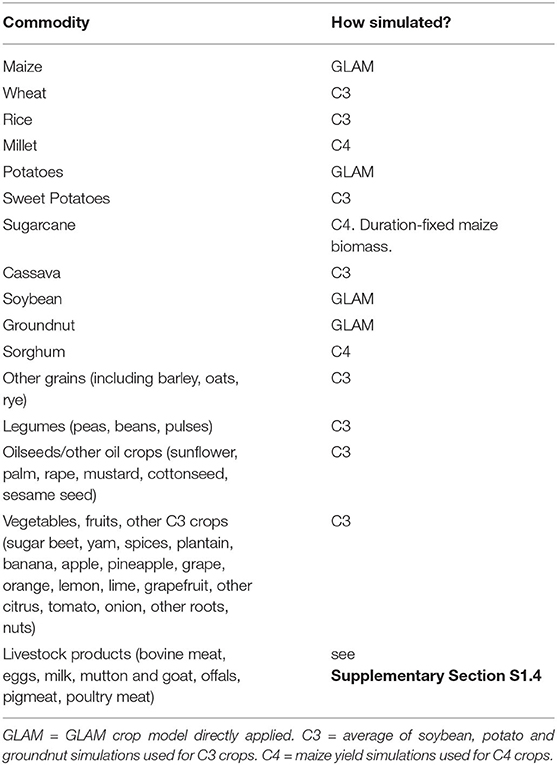
Table 2. Mapping of crop model results onto the agricultural commodities in FAO.
The impact of technology trends on future yields is also accounted for; past trends in observed yield data from FAO (2020) were analyzed, with the largest trend from 1961 to 2010 across all four countries applied to future yields in the “high tech./high market efficacy/high policy efficacy” scenarios for Tanzania, Zambia and Malawi, respectively. For the converse “low tech.” scenarios in these countries, no technology improvement was applied to yields. All four South Africa scenarios assumed half of the trend applied in the other countries, as the non-climate critical uncertainty was not clearly related to technological improvement and therefore an intermediate yield trend was assumed. If mean yields exceeded the maximum global yield historically for any crop then they were capped at this level; for the four explicitly modeled crops, if yields exceeded maximum simulated potential yields they were also capped. See Supplementary Section 1.2 for more information on gap-filling and trend methods.
Cropland allocation was determined as follows. In the high technology scenarios, future arable crop areas were optimized to maximize crop production based on future crop yields using the R package Rsolnp (Ghalanos and Theussl, 2015), which uses optimization based on the algorithm of Ye (1987). For lower technology scenarios, and all South African scenarios (not being clearly associated with technological change) simpler changes to future arable crop areas were assumed, with current crop areas remaining in the same grid cells in future and using simple expansion or contraction of land and changes to crop diversity, expressed as a change toward or away from maize. See Supplementary Section S1.3 for more details.
It was assumed that protected areas will stay constant between baseline and 2050. Urban areas and forests were also excluded from agricultural use in 2050. The protected areas were assigned spatially in coherence with the LUH2 data. The fraction of primary areas needed to match the WDPA area nationally was used to define the fraction of the primary area in each grid cell that was designated as protected. If more than the primary land available nationally is needed to cover the protected areas nationally then the fraction of the secondary land needed at the national scale was also used at every grid cell. Any forested areas in the LUH2 data that were not included in these defined protected areas were also preserved (i.e., not used for baseline or future agriculture).
Using (a) results from the crop modeling, providing crop yield projections in 2050 and (b) future crop areas, as defined by the above prescribed land use assumptions and cropland allocation, food production volume changes from the baseline to 2050 for all crops were calculated. Production changes for livestock commodities were calculated using regressions based on the historical relationships between livestock food and livestock production (Herrero et al., 2013). There are seven livestock production categories in the Herrero et al. (2013) data that were used to train regressions: bovine meat, bovine milk, sheep and goat meat, sheep and goat milk, pig meat, poultry meat, and poultry eggs.
Country-level multiple linear regressions related livestock food sources to livestock production using grid cell-level data from the data set described in Herrero et al. (2013). National-scale percentage changes to livestock food categories (crop production, residues and livestock pasture) were applied to the mean baseline grid cell data used to train regressions, giving a change to 2050 for livestock food sources. Regressions were then used to project 2050 livestock production. This assumed that proportionally, livestock groups use the same feed as in the baseline.
The percentage changes to livestock production categories were then applied to the appropriate livestock commodities in FAOSTAT Food Balance Sheets (FBS) for input into the nutrition security analysis (e.g., percentage changes to pig meat informed future pig production; where necessary, aggregated changes were calculated for aggregated FAO categories such as Fats, Animals, raw). Fish products were assumed to be constant between baseline and future. See Supplementary Section S1.4 for more details on livestock regressions and livestock commodity mapping.
2.2.3.3. Nutrition Security Analysis Under Different Trade Vignettes
Using the food production projections of commodities in Table 2 and baseline values for foods not modeled (e.g., seafood), nutrition security implications were assessed for a range of plausible trade futures for each scenario. Medium-variant United Nations (UN) population projections for 2050 were used to translate age- and sex-specific per capita nutrient requirements into population-level nutrient targets in each country (Figure 2; right-hand side). Figure 3 shows the workflow of the trade and nutrition security analysis.
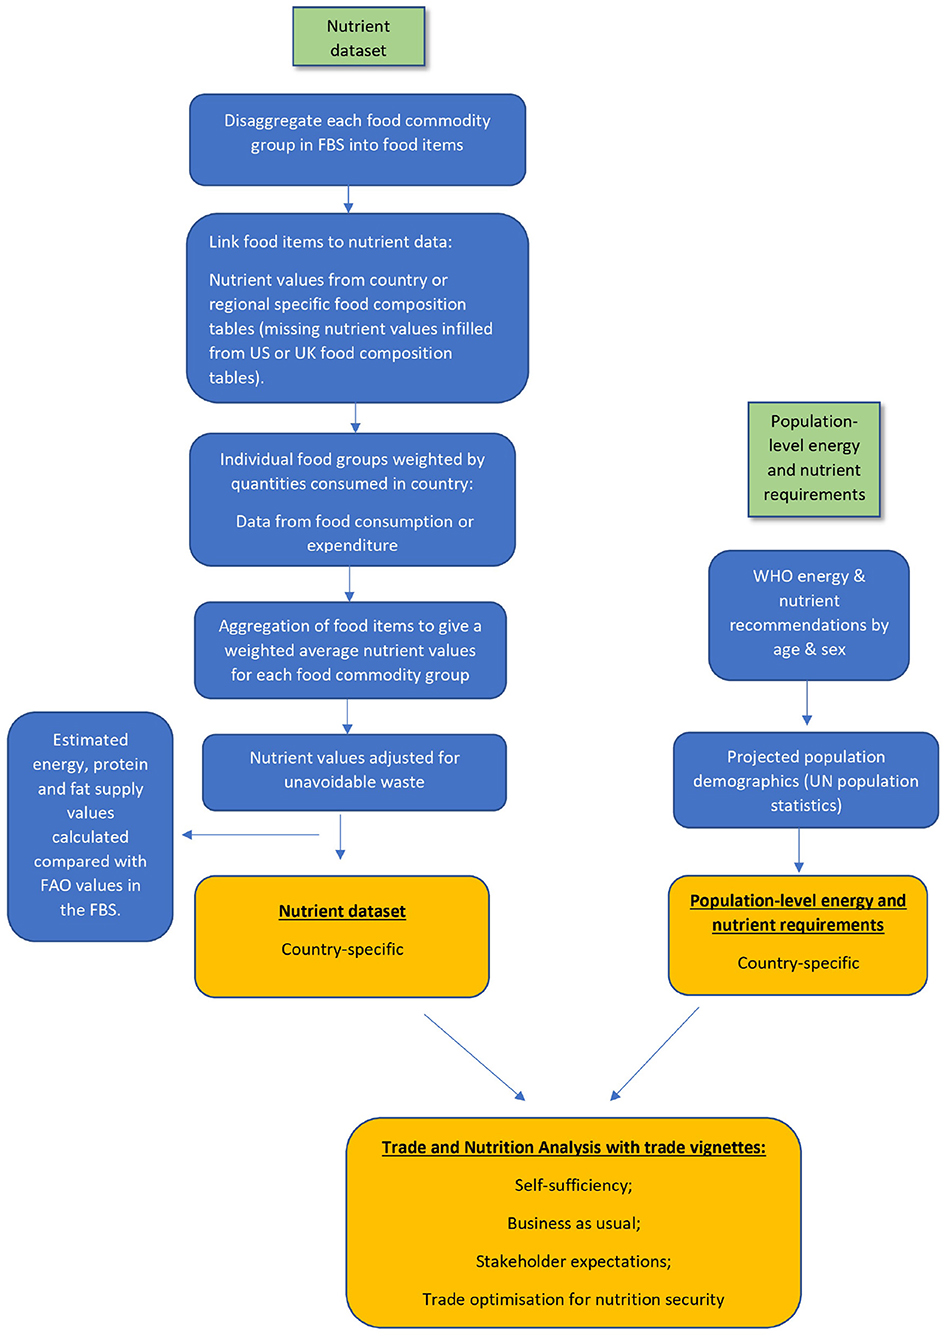
Figure 3. Flow diagram of the trade and nutrition security analysis.
A subset of 5 of the 18 climate models was used for the trade and nutrition security analysis; (see Supplementary Section S1.5) for more information on how this subset was selected. This analysis results in a large range of nutrition security outcomes that are dependent on area, yield and technological changes for domestic food production, climate pathways, and trade balances; climate model uncertainty was a comparatively small factor in shaping final nutritional outcomes. Additionally, results associated with the 5-climate model subset represented a significant fraction of the range from the wider ensemble when tested in South Africa.
Nutrient supply was estimated from FAO FBS data. The FBS provided an estimate of the supply of 96 food commodities within each country based on domestic production, imports and exports, including stock variation of each commodity within the country. These data were further categorized into the supply for human consumption and other uses (e.g., feed, seed and losses) and provided an estimate of per capita supply of calories, protein and fat. Data for micronutrients are not supplied in the FBS, therefore in iFEED these were calculated for each country using a method developed by Macdiarmid et al. (2018). In summary, FBS food commodities were converted to food as eaten, adjusting for unavoidable (e.g., inedible peel, bones) and household waste (e.g., edible food; FAO, 2011). The food commodities were disaggregated into food items and matched to foods in country or region-specific food composition tables, which provided an estimate of the supply of calories, protein, fat, carbohydrate, saturated fat, fiber, calcium, zinc, iron, vitamin C, thiamin, riboflavin, niacin, folate and vitamin B6. Each food item was then weighted to represent the quantity of each food eaten at a country level, before being aggregated back to the commodity groups, and then total nutrient supplies calculated.
The marker of adequate nutrition supply was set to achieving the supply of population-level nutrient requirements taken from World Health Organization recommendations. The nutrient requirements are country-specific and adjusted for projected demographic changes (i.e., population size, age, sex, fertility rates) based on medium-variant UN projections to 2050.
For each scenario quadrant in each country, nutrition security was evaluated under a range of four illustrative trade ‘vignettes’ to demonstrate that nutrition security outcomes are crucially dependent not only on evolutions to domestic production but also on choices about which, and how much, agricultural commodities are supplied to and sourced from international markets. The four vignettes were self-sufficiency (assuming no imports or exports and thus addressing how well domestic production matches domestic requirements); business as usual (imports and exports remain in the same proportions to domestic production as at baseline); stakeholder expectations (reflecting in-country expert judgements about likely future trade dependencies); and trade optimisation for nutrition security. The first three vignettes assessed nutrition security outcomes under contrasting future trade relationships; the fourth vignette provides an indication of import requirements and surpluses available for export if nutrition security requirements are realized, given 2050 domestic production projections.
2.2.3.4. Modeling Changes to Agricultural Greenhouse Gas Emissions and Soil Organic Carbon
The ECOSSE model (Estimating Carbon in Organic Soils—Sequestration and Emissions; Smith et al., 2010a,b) provided projections of greenhouse gas emissions, soil organic carbon (SOC) and nitrogen (N) dynamics associated with agriculture in each future scenario, taking into account yield and land use changes.
ECOSSE is based on the concepts of RothC (Jenkinson and Rayner, 1977; Jenkinson et al., 1987; Coleman and Jenkinson, 1996) and SUNDIAL (Bradbury et al., 1993; Smith et al., 1996). Soil organic matter (SOM) is described in the model as pools of inert organic matter (IOM), humus (HUM), biomass (BIO), resistant plant material (RPM) and decomposable plant material (DPM). If the carbon (C) plant input is not provided in the input file, it is estimated by a modification of the Miami model (Lieth, 1975), which is a simple conceptual model that links the climatic net primary productivity (NPP) to annual mean temperature (T) and total precipitation (P) (Grieser et al., 2006). Plant C and N inputs are added monthly to the DPM and RPM pools.
ECOSSE calculates the heterotrophic respiration (Rh) from the decomposition process which depends on temperature, water content, plant cover and pH of the soil and exchanges material between the SOM pools. The minimum inputs needed for ECOSSE are monthly precipitation (mm), temperature (°C) and potential evapotranspiration (PET, mm) and long-term averaged monthly precipitation and temperature. The soil requirements are the initial soil C content (kg/ha), soil depth of measurements (cm); soil sand, silt and clay content (%); soil bulk density (g/cm3) and soil pH. A constant 15% of biomass residues are assumed to remain on the ground following harvest. For a full description of the ECOSSE model and the plant input estimates refer to Smith et al. (2010a) and Dondini et al. (2016).
A spatial version of ECOSSE—Global ECOSSE (version 6.2b)—was used to model SOC, C and N fluxes on a spatial resolution of 1 km x 1 km for Malawi, Zambia, South Africa and Tanzania. Soil input data were derived from the Regridded Harmonized World Soil Database v1.2 (HWSD; Wieder et al., 2014). The simulations run from 2000 to 2060, using the scenario assumptions described in Table 3.
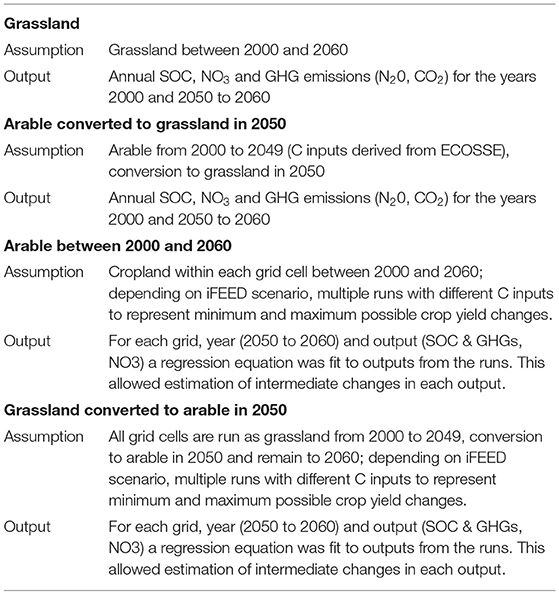
Table 3. Land use classifications simulated in ECOSSE.
Due to the large processing requirements of ECOSSE and a lack of sensitivity in modeled outcomes to climate model inputs, a subset of 5 of the 18 climate models was used for ECOSSE simulations; (see Supplementary Section S1.5) for more information on how this subset was selected. ECOSSE results from each of the 5 climate models were used in conjunction with the 18-model ensemble land use and yield change results. For example, the “hot-dry” representative model in the climate model subset was used in conjunction with yield and land use change results for all “hot-dry” models.
To incorporate crop yield change, an average yield change across all crops was first calculated in each 0.5° grid cell. This was a weighted average, with weighting in favor of those crops that had more area in the future in each grid cell. A regression equation was fit to each ECOSSE output that related yield change to output values. This allowed intermediate outputs associated with yield change to be calculated. When applied yield changes in future arable land resulted in negative emissions/NO3, these were fixed at 0 kg/ha. ECOSSE outputs were at a finer resolution than the GLAM and land use outputs. Therefore, the yield change in each GLAM grid cell was used for each finer resolution ECOSSE grid cell, and the results from all finer resolution grid cells were then averaged to calculate values at the 0.5° grid on which GLAM was simulated.
To incorporate land use change, the percentage of each grid cell that was continuous arable, continuous grassland (both livestock pasture and other grasslands), arable to grassland or grassland to arable was calculated, and the appropriate simulations from ECOSSE used for each land use category.
The per area ECOSSE future outputs were then multiplied by the area in each grid cell that was continuous arable, continuous grassland, arable to grassland or grassland to arable. This gave future absolute values of SOC and emissions, from the land that changed from arable to grassland or grassland to arable, as well as the emissions and SOC from the land that was continuous grassland or arable. Total emissions associated with each future agricultural land use pattern were then calculated.
2.2.3.5. Climate Extremes
Parallel work assessed the risks of extreme weather events such as extreme heat, precipitation, drought and severe storms. Analyses included estimating the historical risk of extreme years of rainfall and temperature, projected changes of severe storms and drought and specific agro-climatic indicators of extreme heat and rainfall.
2.2.3.5.1. Present-Day Extremes. To gain a better understanding of the present-day likelihood of extreme seasonal temperature and rainfall events, and their joint occurrence, we apply the UNprecedented Simulated Extremes using ENsembles (UNSEEN; Thompson et al., 2017) approach to a large ensemble of high-resolution initialized climate simulations in each country. We use UNSEEN to assess the annual likelihood of unprecedented seasonal temperature and precipitation extremes in the maize-growing regions of each country during January-March, and investigate the large-scale dynamics of the climate system that govern their occurrence.
2.2.3.5.2. Severe Storms. We used extreme value theory (EVT; Gilleland and Katz, 2006; Overeem et al., 2009) and regional frequency analysis to look at how very rare rainfall extremes (> 2-year return period) change with climate change in a convection-permitting model and its parameterised counterpart in East Africa (Chapman et al., In press). We also used the CORDEX-Africa ensemble (Jones et al., 2011) of regional climate models to see how length of time series impacted results. We compared the model results to the CHIRPS (Funk et al., 2015) and TRMM (Huffman et al., 2007; Huffman, 2016) satellite data.
2.2.3.5.3. Drought. Drought was assessed using the SPEI (standardized precipitation and evapotranspiration index; Vicente-Serrano et al., 2010; Whitfield et al., 2021). Drought was defined as SPEI < = −1. Droughts were assessed using the CORDEX-Africa ensemble of regional climate models.
2.2.3.5.4. Agro-climatic Indictors. Climate indices based on temperature and precipitation data can be used to provide more information about potential impacts than the temperature and precipitation data alone. We used the CMIP5 data biased-corrected to the WFDEI observational dataset (Famien et al., 2018) to generate specific climate indices of the mean number of consecutive dry days per month and the percentage of the month in which the mean temperature is greater than 35°C for the baseline period of 1981–2010 and the future period of the 2050s (2036–2065).
2.2.3.5.5. Yield Shock Rates. Changes to yield shock rates were assessed between a baseline of 1990–2010 and 2040–2060. Simulations were rainfed, and assumed adaptation of planting windows and varieties (this is considered autonomous adaptation, as these are the varieties available in the baseline climate). Yield shocks were defined as when yields were below 1.5 standard deviations from the baseline mean value (across each 21-year period), as in Parkes et al. (2015). Yield shocks were assessed for maize, soybean, potato and groundnut.
2.3. Expert Elicitation
2.3.1. Implication Statements and Integration Workshops
The calibrated statements (CS) described in Section 2.2.2 are expanded upon by a wide range of academic experts who examine model results and provide implication statements (IS). This process builds upon the integrated modeling to ensure that processes/topics not explicitly modeled are included in final result summaries.
IS are made in small academic expert teams around specific topic areas. These topic areas are agreed with in-country stakeholders and based on the expertise in the research team, selected to cover the various aspects of importance to climate change impacts and agricultural resilience in the region being studied.
The next stage of the process broadens the engagement out to the full range of experts and stakeholders involved in the project. Integration workshops are used for facilitated discussion of the IS in order to sense-check agreement with modeled outputs and across other IS. This step minimizes the chance of misinterpretation of CS. It also ensures that interrelationships between implications are adequately captured. At these workshops, each group of IS are presented to the full team and collectively agreed upon. Wider contextual details can also be discussed for inclusion in final result summaries. Figure 1 summarizes this process.
Expert elicitation in iFEED addresses a number of the guidance points raised during IPCC AR5 (Mach et al., 2017). For example, the process of moving from hundreds of thousands of model simulations to hundreds of CS, and then to a similar number of IS, is aimed at achieving appropriate generalization by going beyond listing model results and clearly stating implications. The involvement of a broad range of experts in developing IS is critical to ensuring that results are not extrapolated beyond what the model results themselves suggest.
2.3.2. Case Study Country Expert Elicitation
The following is a description of the application of the IS and workshop process in the case study countries. The topics around which IS were made by academic expert groups on each modeled scenario were as follows:
• Soil health: implications for soil erosion, degradation, soil organic carbon and fertility; how management practices such as fertilizer and irrigation application can be implemented to improve sustainability; how intensification of agriculture may impact soil health; implications of expanded livestock for soil health.
• Aflatoxin risk: how maize post-harvest losses could be impacted given climate and policy changes through aflatoxin contamination.
• Cassava toxicity: how temperature and drought changes could impact the cyanide concentrations (and therefore toxicity) of cassava, with likely implications on diets explored.
• Crop diversification: implications of reduced or enhanced crop diversity in terms of soil health, resilience to climate change, and pests and diseases; management implications for diversification; trade-offs between commercialization of crops and a diversified crop sector.
• Livestock: benefits of livestock diversification; water demands of increasing livestock; livestock breeding and management improvements.
• Pests and diseases: are biotic stresses likely to increase with climate change and/or agricultural intensification? Management practices necessary to cope with pests and diseases; policies that can be adopted to mitigate against increasing pest and disease impacts.
• Seed systems: crop breeding implications; whether new varieties are needed; the likelihood that new varieties can be developed (in time) to cope with climate change; how seed systems may need to change in terms of farmer access to genetic material.
• Water-energy-food nexus: possible conflicts between the agricultural and energy sectors for water use; possible pressures and upper limits to irrigation water given demand-driven projections; water quality implications.
• Trade and nutrition: given projected changes to domestic food production, what changes to crops, livestock or trade could be needed in order to achieve nutrition security?
• The social context: household and livelihood perspectives; which demographic groups are vulnerable to climate impacts; environmental implications of modeled agricultural changes.
Next, integration workshops were conducted to ensure CS and IS agreement. Wider contextual details were also discussed as they arose upon presentation and agreement of the IS. In all countries, some scenarios assumed that irrigation water use would increase by 2050. Integration workshops made clear that the broader implications of increasing water needed expanding upon—in particular, what this could mean for the energy sector, for example diverting water from hydro-electric power and toward agriculture. The potential for land use conflict across sectors and between producers was emphasized in Tanzania—although modeling assumed no expansion of agriculture in forested or protected areas, Tanzania experts emphasized that agricultural expansion is a major driver of deforestation in the country (Doggart et al., 2020) and that conflict between humans and wildlife, and between crop and livestock producers, are exacerbated in areas of crop expansion (Bergius et al., 2020; Msofe et al., 2020). Similarly, in Malawi, the importance of understanding potential conflicts around land for agriculture was discussed, with the importance of miombo woodlands emphasized. In South Africa, land reform was a point of particular discussion—following discussions at the workshop additional IS were drafted to further explore what land reform could entail with or without significant government support.
After the integration workshops, results were summarized (for each scenario and country) firstly by topic area. The topic areas were: food production and land use, climate smartness (including emissions and soil health), trade and nutrition security, and climate extremes.
Scenario and country-level summaries were then produced by collating the relevant topic summary information. This process was led by a country-specific member of the academic team. Country-level (cross-scenario) summaries were produced by collating the scenario summary information, resulting in country-level recommendations on the best course of action to achieve climate-smart nutrition security. At the country-level result stage, summaries were produced in consultation with in-country iFEED champions, selected from the wider iFEED stakeholder taskforce, and overseen by an iFEED Africa Coordinator and Regional Champion. Thus, policy actions with positive outcomes based on cross-scenario results were identified.
3. Example Results
As described in previous sections, iFEED provides both quantitative and descriptive results. All results are available to view at https://ifeed.leeds.ac.uk/. Crop modeling outputs are available to view directly, along with the following result summaries.
Key model results are viewable as calibrated statements (CS), as described in Section 2.2.2. Example calibrated statements are shown here—specifically how crop yield projections are used to make CS, and then how the CS are used to create implication statements. We also demonstrate how these statements are incorporated into wider result summaries to firstly assess food production outcomes, and then country-level nutrition security.
3.1. Calibrated Statements
For each scenario, crop yield projections used the adaptation options as agreed with stakeholders. For example, in low technology scenarios, only incremental changes in planting dates and crop varieties were permitted. In high technology scenarios new crop varieties were simulated that compensated for warming-induced growing season duration reduction. The calibrated statements for the two low climate risk scenarios for Zambia are as follows. Note that the confidence assessments are based on a robustness assessment (expert opinion on model uncertainty) and an agreement assessment, as described in Section 2.2.2.
Calibrated statement for the low market connectivity and RCP2.6 scenario:
The mean percentage change to maize yield with autonomous adaptation for RCP2.6 is –14% (range across climate models –28 to –4%; 0/18 climate models are outliers).
Robustness assessment: Medium robustness. 0/18 climate models are outliers, which means highly robust with respect to climate model uncertainty; however, there is some uncertainty associated with crop model parameterisation (e.g., CO2 and response to duration, which differ across crop models; and only one crop model was run here). Therefore, the robustness assessment has been downgraded to medium.
Agreement assessment: High agreement. Many studies in the literature suggest that maize yields are likely to decline with climate change, even with some adaptation. The Challinor et al. (2014) meta-analysis shows a range of yield losses with adaptation that are entirely commensurate with the range produced by iFEED, hence high agreement.
Confidence Assessment: High confidence (medium robustness and high agreement).
Calibrated statement for the high market connectivity and RCP2.6 scenario:
The mean percentage change to maize yield with adaptation to negate warming-induced growing season reduction for RCP2.6 is 5% (range across climate models –1 to 13%; 0/18 climate models are outliers).
Robustness assessment: Medium robustness. 0/18 climate models are outliers, which means high robustness with respect to climate model uncertainty; there is also some uncertainty associated with crop model parameterisation (e.g CO2 and response to duration, which differ across crop models; and only one crop model was run here). Overall, this suggests medium robustness.
Agreement assessment: Medium agreement. Many studies in the literature suggest that maize yields are likely to benefit from adaptation; there is uncertainty over how large this benefit is. For example the Challinor et al. (2014) meta-analysis shows figures of 7–15% in general for adaptation, but for cultivar adjustment in particular the benefit could be higher than 20%. The positive yield change with this adaptation is also seen in many studies in the meta-analysis, although the mean change is negative. The cultivar adjustment adaptation benefit range in Challinor et al. (2014) overlaps with the range from iFEED, although iFEED projections indicate that the benefit (upwards of 30%), is on the high side of other studies, therefore medium agreement.
Confidence Assessment: Medium confidence (medium robustness and medium agreement).
3.2. From Calibrated Statements to Country-Level Result Summaries
The next step in the process is to move from calibrated statements to wider-ranging implications statements. Here, we present some examples based on the implications of the yield projections on the household and livelihood social context, crop breeding systems, and crop pest and diseases. See Section 2.3 for more details.
Low market connectivity (incremental adaptation only) with RCP2.6:
• Reductions in yields for cash crops are likely to lead to acute income loss, undermining household resilience and increasing financial vulnerability.
• Reductions in maize yields will likely lead to diversification to alternative staple starch food sources e.g., cassava, potato, rice, wheat etc.
• It can take up to 20 years from initial investment in breeding for new varieties to be available and in farmers' fields. With temperatures expected to be warmer by 1°C by 2050, continued investment in crop breeding is required in order to ensure that the adaptation of crops can keep pace with changing conditions. This may include investments in technologies that speed up the breeding process or alignment of policies that facilitate the movement of genetic material, improve access to new varieties for farmers, and enhance farmer participation in seeds value chain activities (e.g., seeds production and commercialization).
• Under low market efficacy, farmers would not afford to use chemical pesticides and crop pest and disease-resistant crop varieties.
High market connectivity (with new crop varieties) with RCP2.6:
• If markets are inclusive and sustainable, yield increases may raise incomes.
• If markets are not inclusive or sustainable, yield increases have limited impacts on incomes.
• Well connected and efficient markets may be contributing to demand driven investments in crop breeding under this scenario.
• Due to market integration, farmers will have better access to resistant and improved varieties of crops, mechanization, and chemical fertilizers and pesticides. However, pests and pathogens may evolve to overcome the genetic resistance of crops and chemical pesticides, resulting in severe crop failures with detrimental impacts on food availability and nutrition.
These CS and IS are collated (along with statements summarizing other results in the areas of, for example, soil health, land use, food production and nutrition security) in four identified topic areas (see Section 2.3): food production and land use, climate smartness (including emissions and soil health), trade and nutrition security, and climate extremes.
For example, in the low market connectivity and RCP2.6 scenario, food production stagnates by 2050, as described in the food production document. In the high market connectivity and RCP2.6 scenario, food production increases, approximately tripling by 2050, due to a combination of irrigation and crop variety improvements, and crop diversification away from maize.
• Food production summary for low market connectivity and RCP2.6 scenario
• Food production summary for high market connectivity and RCP2.6 scenario
Following this, results are further aggregated to the scenario and country level, and are available to view in the summary documents linked to below. Here, what food production means for nutrition security given the various trade vignettes is described, with key messages highlighted at the top of each document. For example, in the low market connectivity and RCP2.6 scenario: “with a 276% increase in population, low market connectivity and yield reductions will mean that Zambia will not achieve food and nutrition security under all likely trade scenarios; if nutrition security were to be achieved through increased reliance on food trade, 81% of calories would need to be imported.”
In the high market connectivity and RCP2.6 scenario, despite food production increases: “with a 276% increase in population, Zambia will not achieve nutrition security for all nutrients under all likely trade scenarios; if nutrition security were to be achieved through increased reliance on food trade, 43% of calories would need to be imported.”
See here for the scenario summaries in full:
• Scenario summary for low market connectivity and RCP2.6
• Scenario summary for high market connectivity and RCP2.6
The country-level summary then discusses cross-scenario implications. For example, summarizing the nutrition security results and wider implications, ultimately stemming from yield projections, land use allocation, and scenarios of trade:
• Under the scenarios with low market connectivity crop yields are projected to decrease by 2050. Yield losses range from 1% with some autonomous adaptation (reactive individual actions to changes in environmental or social conditions, e.g., changing varieties and/or planting dates), to as much as 10-20%. These yield reductions, coupled with a lack of technological intervention, and a 276% increase in the population by 2050, mean that Zambia is likely to face significant food insecurity, even under low climate risks.
• Under the high market connectivity scenarios (RCP8.5—HT; RCP2.6—HT) incomes are expected to increase through yield increases driven by investment in farm technology and crop varieties, irrigation, etc., regardless of the level of climate risk. However, markets will need to be inclusive and sustainable for these increased incomes to be realized by all farmers. Otherwise, inequalities may be increased as households who cannot afford technologies and improved varieties are left behind. Reducing inequalities should be an important consideration for the Farmer Input Support Programme (FISP). Without market connectivity (RCP8.5–LT; RCP2.6–LT) yield losses will reduce incomes, undermining household resilience and increasing food insecurity.
• Across all the scenarios nutrition security is not achieved for all nutrients by 2050 under all likely trade scenarios. In part this is driven by a projected 276% increase in the size of the population. Market connectivity and functionality has a much more significant impact on nutrition outcomes than does climate risk, with more market connectivity and functionality associated with better nutrition security outcomes. In all but one scenario (RCP8.5—HT) there is a deterioration in nutrient security from the year 2000 baseline, although in RCP2.6—HT vitamin C, B6 and thiamine supplies are adequate and protein supply is marginally adequate. In all scenarios many foods will need to be imported to meet domestic nutrient requirements.
See here for the Zambia summary document in full.
Section 4 contains a detailed discussion of the strengths and limitations of iFEED.
4. Discussion
iFEED is an integrated assessment framework that combines climate-food-emissions modeling with expert input to describe stakeholder-driven scenarios of possible change. The framework addresses several issues for climate change adaptation studies, as highlighted in Challinor et al. (2018); integrated assessment framework issues as highlighted by Webber et al. (2014); and climate-smart agricultural assessment issues as highlighted by van Wijk et al. (2020).
Inevitably, the methodology has limitations and, as with any approach, it is important to assess these limitations in order to aid interpretation of results and suggest future directions for research. Accordingly, a critical review of iFEED, based on the recommendations of Challinor et al. (2018), can be found in Supplementary Section S1.1, with the scores associated with each recommendation listed in Table 4. The following three sections summarize the main outcomes of this process.
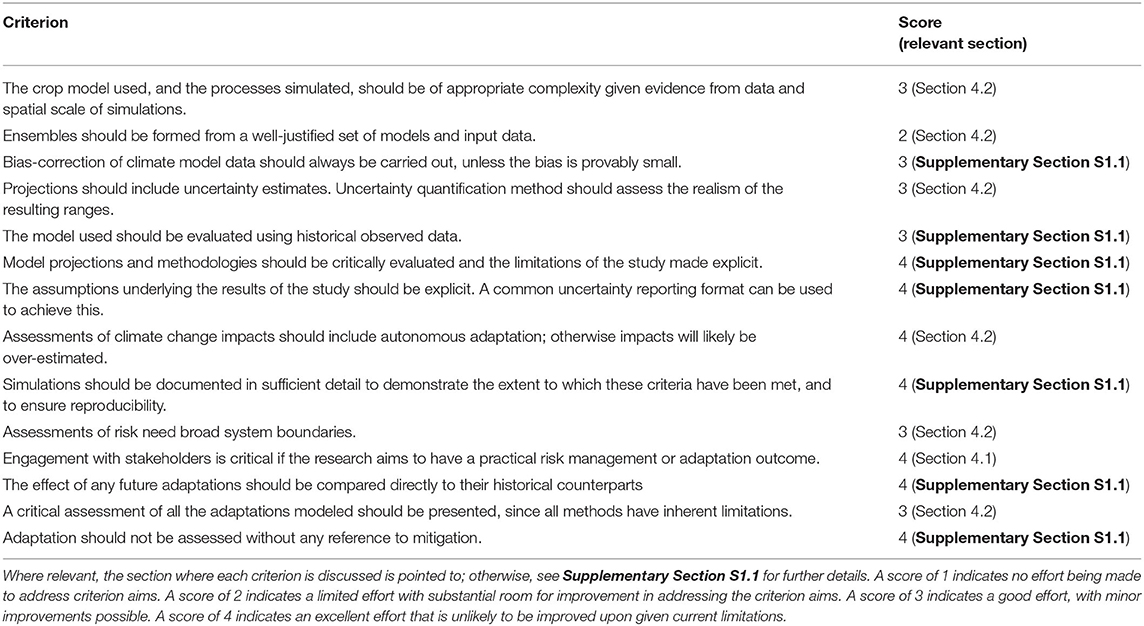
Table 4. Assessment of iFEED against criteria of Challinor et al. (2018). A score out of 4 is given for each criterion.
4.1. Framing and Bounding the Assessment With Stakeholders
The scenario framework that iFEED uses contrasts different possible futures as determined by stakeholder input. These scenarios give the overall framing of the problem by defining the factors that shape the future of the food system and how they might vary in the future. The problem is therefore framed and bound by the scenario process—stakeholders are asked what the key issues are that will shape the food system, and how we might go about addressing the challenges of achieving sustainable agricultural development—i.e., climate-smart nutrition security.
As O'Neill et al. (2020) acknowledge, stakeholders often find reference scenarios of no change unrealistic, although these have an important role to play in scenario analysis. A combination of stakeholder-driven scenarios and pre-defined reference scenarios that explore no change to maximum change is a way of ensuring that stakeholder voices are heard without giving up on the full range of possible outcomes that should, ideally, be explored.
Although the resulting future scenarios are highly uncertain, by comparing results across these uncertain futures conclusions can emerge that are robust to the range of possible outcomes. For example, based on model projections across RCP2.6 and RCP8.5, it is sensible to assume that extreme impacts from climate change will increase in terms of precipitation and temperature patterns, regardless of how global emissions and resulting climatic change evolves. Policies should therefore adapt with increasing frequencies of extremes in mind, regardless of whether a low or high climate risk future occurs.
iFEED incorporates stakeholder and academic expertise to move beyond statements that assume certain adaptations take place with associated assessments of uncertainty, toward narratives of change that set out challenges and pathways to achieving adaptation to climate change. Resilience of the system is also considered—incorporating vulnerability as well as risk—meaning that disadvantaged sections of society are not overlooked. Each scenario explores how such changes can take place, and in-country expertise is crucial for this process.
Much of the stakeholder engagement was conducted online due to the COVID-19 pandemic. This had the benefits of saving time, money, and reducing the emissions from long-distance travel. In-depth conversation and ensuring all voices are heard can be harder online, and can be seen as a limitation, although careful online meeting facilitation made progress possible. How stakeholders are engaged, as well as which stakeholders are engaged, are important considerations.
4.2. Integrated Modeling of Appropriate Complexity
The nature of the problem being addressed determines the appropriate bounding of a study. The iFEED integrated assessment framework is used to explore pathways toward country-level nutrition-secure and climate-smart food systems. Therefore, the study is bounded at the national level, although the broader nature of international trade is also included in the analysis.
Rather than relying on complex partial or general equilibrium economic models as part of the integrated agricultural-economic analysis (e.g., see Nelson et al., 2014), iFEED uses a qualitative international trade analysis that combines future projections of domestic food production with simple plausible scenarios of trade that bound future possibilities. This has the advantage of not having to rely on data for complex model evaluation, and has transparency of inputs and output interpretation.
For modeling future crop production, a gap-filling approach is used, similar to the approach of Müller and Robertson (2014) to infer yields for agricultural commodities that are not directly modeled. The crop model simulates a small range of crops known to be important to the region, and for any crops not explicitly simulated, average projections are used across the C3 photosynthetic pathway crops where relevant, and maize projections used for other C4 crops.
Alternatives to the gap-filling approach include modeling of more crops using processed-based models, statistical models—which are calibrated using observed data for each crop (Lobell and Asseng, 2017)—or modeling of a representative C3 and C4 crop rather than multiple specific crops. Statistical models and simpler process-based options (e.g., C3/C4 representative crop models) have the advantage of being faster to implement and more complete in terms of crops included than process-based models, however they lose the benefits of crop-specific process-based knowledge for crops of particular importance to the region, enabling detailed examination of adaptation benefits and pathways toward possible change.
The majority of crops do not have readily-available and well-tested parameterisations (Ewert et al., 2015), with the majority of process-based crop models focussing on the “big four” crops: maize, wheat, rice and soybean (e.g., Ruane et al., 2018). Even if models were available for the majority of crops, data are lacking to parameterise and evaluate them adequately. Because of this, process-based crop models need to be used in conjunction with gap-filling methods to represent climate change impacts on a full range of crops.
Trade-offs will inevitably exist between computational/human effort and the mechanistic detail of crop modeling output—for example, knowledge of when growing seasons are likely to shorten, or whether adaptation to climatic stresses is needed or possible. The best approach to crop modeling in each study will be context-specific. In this case, given the importance of maize in the region, it was decided to use a partial process-based and gap-filling method, rather than using generic statistical or process-based crop representations. The majority of other crops were not directly modeled due to time constraints. The addition of further process-based crop simulations would change crop-specific projections. However, it is unlikely that these changes would have significant impacts on the conclusions resulting from projections of food production given that factors other than climate change impacts on yields typically contribute more to any changes to food production for explicitly modeled crops such as maize—changes to agricultural area and assumed technological trends are larger determinants of future food production.
GLAM is selected as the processed-based crop model for this study because it has been developed for use in large-scale (several kilometers squared) simulations—at the spatial scale of the input weather-yield relationship (Challinor et al., 2003, 2004). Recent developments in crop modeling suggest simpler and potentially more skilful methods, relying on fewer empirically-derived parameters that would further enhance the simplicity (and therefore utility) of the model (Droutsas et al., 2019).
A common uncertainty reporting format (Wesselink et al., 2015; Challinor et al., 2018) is used to make explicit the assumptions underlying the results of the study and ensure that these assumptions were reflected in the certainty of conclusions. This process culminates in the production of calibrated statements, which enable a more comprehensive assessment of the uncertainty associated with projections than the reporting of model ranges. Rather than simply relying on the uncertainty associated with climate model inputs, each aspect of the modeling is assessed in terms of its robustness to possible changes in model assumptions or parameters, as well as assessing agreement with broader literature. This gives a more complete picture of the realism of results.
The quantification of uncertainty in the crop simulations is limited, since a single crop model is used. This is reflected in relevant confidence assessments, however, thus making this limitation explicit. Quantification of climate uncertainty is more comprehensive: an ensemble of 18 bias-corrected global climate models is used as input into iFEED. For other parts of the iFEED analysis, computational and methodological constraints meant that a subset of 5 models is used. This limitation is also reflected in confidence statements.
Appropriate complexity in representing adaptation is also an important element of climate impacts assessments. Changes to planting dates, crop varieties and irrigation are the only adaptations simulated in iFEED. This is far from being a comprehensive list of adaptation options, as is typical in crop modeling studies (Beveridge et al., 2018). However, these projections are supplemented by expert input at the IS stage to give regional insight into adaptive capacity and local constraints. Therefore, suitable opportunities for adaptation recommendations are informed by both in-country expertise and integrated modeling. In this way both bottom-up knowledge and top-down modeling are combined to deliver realistic pathways toward climate change adaptation strategies.
4.3. Next Steps for Integrated Assessment Frameworks
iFEED provides a platform to bring together scientific and stakeholder expertise, as suggested by Webber et al. (2014). iFEED also makes significant strides in fulfilling the specific recommendations of Challinor et al. (2018) for climate change adaptation studies. As a platform for adaptation studies, iFEED is particularly strong in the areas of stakeholder engagement, nutrition security, comprehensive and relevant reporting of uncertainty, and inclusion of climate change mitigation.
Most adaptation assessments (including iFEED) focus on impacts and adaptation planning, rather than the processes of implementation and evaluation of adaptation actions (Leiter, 2021). Future assessments could consider basing their recommendations on evaluation of successfully implemented adaptation strategies with specific, place-based contexts (Beveridge et al., 2018).
Eleven indicators were included in the monitoring and evaluation framework used to assess iFEED. Of these, six were quantitative indicators measuring iFEED outputs (such as crop modeling and calibrated/implication statements). The remaining five were qualitative indicators mapping outcomes such as the dissemination of outputs in the focal countries and stakeholders reporting to have accessed and used the outputs. Data collection tools included surveys, baseline and endline semi-structured interviews and focus group discussions with the taskforce members and iFEED champions, as well as regular review meetings with stakeholders and the direct project team. Future work could benefit from baseline surveys or focus group discussions among a larger group of end users to map growth in awareness and skill/knowledge development.
van Wijk et al. (2020) review available climate-smart agriculture assessment tools. They find that most assessment tools do not account for sustainability of productivity, and most tools do not have pathways from agricultural production to food security and nutrition security. iFEED represents an effective tool for assessing both nutrition security and the sustainability of productivity increases. van Wijk et al. (2020) also conclude that while most tools account for mitigation, they do not go beyond GHG emissions to analyse environmental sustainability (for example water quality, soil health, ecosystem services), and most often rely on FAO emissions factors which may be less applicable to lower and middle-income countries. iFEED again shows progress on these fronts; both by accounting for NO3 and SOC; and by modeling specifically for sub-Saharan Africa. Lastly, climate change adaptation is considered the pillar of climate-smart agriculture with the weakest representation in the assessment tools reviewed by van Wijk et al. (2020); again, iFEED makes significant strides toward an improved representation of adaptation, as detailed in Table 4.
van Meijl et al. (2020) offer an alternative stakeholder scenario framework for assessing food security, but highlight particular areas for improvement being the utilization aspect of food security. iFEED is particularly strong in quantifying population-level per capita nutrition security.
Next steps for the trade and nutrition security analysis include feedback loops in the production modeling, reducing reliance on international trade to optimize nutrition security; and incorporating extreme production years into the analysis, examining nutrition security in years of severe crop failure in 2050.
Other areas to improve upon include the simulation of a wider array of adaptation options (explicitly linking country-specific practices with simulations), a fuller quantification of uncertainty (taking into account crop model and soil input data uncertainty, and not just climate model uncertainty), and a broader representation of a full range of modeled crops (or crop types)—particularly important for estimates of future nutrition security. These limitations are made less important by the broad way uncertainty is accounted for in iFEED. Adaptation options are discussed rather than simulated; uncertainty is qualified as well as quantified; and crops not explicitly modeled are discussed in terms of impact on confidence in food production projections.
We suggest the following as key principles for integrated assessment framework analysis:
1. Appropriate system complexity: Define the problem in order to choose an appropriate systems boundary (sub-national/national/international), and use modeling of an appropriate complexity for the system. Following selection of models of appropriate complexity, the necessary “beyond modeling” expert knowledge can be established, both to include processes not included in models and to provide comprehensive uncertainty assessment of modeled outcomes.
2. Comprehensive scenario assessment: A combination of stakeholder-driven future scenarios with pre-defined no change/maximum change scenarios will ensure maximum relevance and utility of options explored. Scenarios should explicitly assess the impacts of extreme climate change rather than only focusing on mean changes, as well as account for mitigation alongside adaptation to climate change.
3. Inclusivity of researchers, disciplines and actors for policy-relevant outcomes: It is important to account for contextually-important views and experiences when developing the integrated assessment framework and exploratory scenarios, and when analyzing results. Careful thought needs to also be put into the stakeholders engaged to ensure diverse representation, and to ensure regular communication to keep work policy-relevant. Monitoring and evaluation of stakeholder engagement is crucial to ensure long-term effectiveness of the outputs of integrated assessment frameworks for influencing policy.
Data Availability Statement
The original contributions presented in the study are included in the article/Supplementary Material, further inquiries can be directed to the corresponding author.
Author Contributions
SJ performed the crop modeling, land use allocation and food production analysis, and prepared the manuscript. AC led in designing the iFEED framework, along with contributions from all authors. RK, JM, GH, and HCl performed the trade and nutrition analysis. NF, SV, and PS performed emissions and soil organic carbon simulations. EP, CB, and SC performed climate extremes analysis. SZ, JY, NK, MG, SE, HT, SSai, SK, EL, HG, HS, MMa, HH, and MMu contributed to the implication statements. TB, SM, TM, IM, CC, MN, BN, NMa, PY, PK, AKa, VK, AKi, AS, HCo, CQ, SSal, AD, SWh, BK, NMe, AJ, DK, PM, WM, FK, and SWa contributed to the scenario and integration workshops and result summaries. All authors contributed to the conception and design of the methods, and read and approved the submitted manuscript.
Funding
This work was supported by the Biotechnology and Biological Sciences Research Council through UK Research and Innovation as part of the Global Challenges Research Fund, AFRICAP programme, grant number BB/P027784/1.
Conflict of Interest
DK was employed by Concern Worldwide.
The remaining authors declare that the research was conducted in the absence of any commercial or financial relationships that could be construed as a potential conflict of interest.
The reviewer CG declared a past co-authorship with one of the authors PS to the handling Editor.
Publisher's Note
All claims expressed in this article are solely those of the authors and do not necessarily represent those of their affiliated organizations, or those of the publisher, the editors and the reviewers. Any product that may be evaluated in this article, or claim that may be made by its manufacturer, is not guaranteed or endorsed by the publisher.
Acknowledgments
The authors would like to acknowledge the contributions of Lauren Phillips, who was instrumental in the publicity of iFEED, Alicia Ledo, who was involved in early modeling discussions, Steve Besford, who helped to coordinate the GCRF-Agricultural and Food System Resilience: Increasing Capacity and Advising Policy (AFRICAP) project in which iFEED was developed (see africap.info for more information), Connor Bainbridge, who transcribed notes from the integration workshops, Richard Rigby for technical support, Hafidh Kabanda for his support at the Economic and Social Research Foundation, Tanzania, and Samantha Aspinall and Simbarashe Sibanda, who facilitated the integration workshops. The crop modeling analysis of iFEED was undertaken on ARC3, part of the High- Performance Computing facilities at the University of Leeds, UK. The iFEED website (https://ifeed.leeds.ac.uk) was developed by Chris Symonds, Centre for Environmental Modeling And Computation (CEMAC), University of Leeds.
Supplementary Material
The Supplementary Material for this article can be found online at: https://www.frontiersin.org/articles/10.3389/fsufs.2022.868189/full#supplementary-material
References
Benton, T. G. (2019). Using scenario analyses to address the future of food. EFSA J. 17, e170703. doi: 10.2903/j.efsa.2019.e170703
Bergius, M., Benjaminsen, T. A., Maganga, F., and Buhaug, H. (2020). Green economy, degradation narratives, and land-use conflicts in Tanzania. World Dev. 129, 104850. doi: 10.1016/j.worlddev.2019.104850
Beveridge, L., Whitfield, S., and Challinor, A. (2018). Crop modelling: towards locally relevant and climate-informed adaptation. Clim. Change 147, 475–489. doi: 10.1007/s10584-018-2160-z
Bradbury, N., Whitmore, A., Hart, P., and Jenkinson, D. (1993). Modelling the fate of nitrogen in crop and soil in the years following application of 15N-labelled fertilizer to winter wheat. J. Agric. Sci. 121, 363–379. doi: 10.1017/S0021859600085567
Campbell, B. M., Vermeulen, S. J., Aggarwal, P. K., Corner-Dolloff, C., Girvetz, E., Loboguerrero, A. M., et al. (2016). Reducing risks to food security from climate change. Global Food Security 11, 34–43. doi: 10.1016/j.gfs.2016.06.002
Challinor, A., Muller, C., Asseng, S., Deva, C., Nicklin, K., Wallach, D., et al. (2018). Improving the use of crop models for risk assessment and climate change adaptation. Agric. Syst. 159, 296–306. doi: 10.1016/j.agsy.2017.07.010
Challinor, A., Slingo, J., Wheeler, T., Craufurd, P., and Grimes, D. (2003). Toward a combined seasonal weather and crop productivity forecasting system: determination of the working spatial scale. J. Appl. Meteorol. 42, 175–192. doi: 10.1175/1520-0450(2003)042andlt;0175:TACSWAandgt;2.0.CO;2
Challinor, A., Wheeler, T., Craufurd, P., Slingo, J., and Grimes, D. (2004). Design and optimisation of a large-area process-based model for annual crops. Agric. Forest Meteorol. 124, 99–120. doi: 10.1016/j.agrformet.2004.01.002
Challinor, A. J., Adger, W. N., and Benton, T. G. (2017). Climate risks across borders and scales. Nat. Clim. Chang 7, 621–623. doi: 10.1038/nclimate3380
Challinor, A. J., Osborne, T., Shaffrey, L., Weller, H., Morse, A., Wheeler, T., et al. (2009). Methods and resources for climate impacts research. Bull. Am. Meteorol. Soc. 90, 836–848. doi: 10.1175/2008BAMS2403.1
Challinor, A. J., Watson, J., Lobell, D. B., Howden, S. M., Smith, D. R., and Chhetri, N. (2014). A meta-analysis of crop yield under climate change and adaptation. Nat. Clim. Change 4, 287–291. doi: 10.1038/nclimate2153
Chapman, S., Bacon, J., Birch, C. E., Pope, E., Marsham, J. H., and Msemo, H. (In Press). Climate change impacts on extreme rainfall in Eastern Africa in a convection permitting climate model. J. Clim.
Coleman, K., and Jenkinson, D. S. (1996). “A model for the turnover of carbon in soil,” in Evaluation of Soil Organic Matter Models Using Existing Long-Term Datasets, Vol. 38, eds D. S. Powlson, P. Smith, and J. U. Smith (Berlin: Springer), 237–246.
Doggart, N., Morgan-Brown, T., Lyimo, E., Mbilinyi, B., Meshack, C. K., Sallu, S. M., et al. (2020). Agriculture is the main driver of deforestation in Tanzania. Environ. Res. Lett. 15, 034028. doi: 10.1088/1748-9326/ab6b35
Dondini, M., Richards, M. I., Pogson, M., McCalmont, J., Drewer, J., Marshall, R., et al. (2016). Simulation of greenhouse gases following land-use change to bioenergy crops using the ECOSSE model: a comparison between site measurements and model predictions. Gcb Bioenergy 8, 925–940. doi: 10.1111/gcbb.12298
Droutsas, I., Challinor, A. J., Swiderski, M., and Semenov, M. A. (2019). New modelling technique for improving crop model performance-Application to the GLAM model. Environ. Modell. Softw. 118, 187–200. doi: 10.1016/j.envsoft.2019.05.005
Ewert, F., Rötter, R. P., Bindi, M., Webber, H., Trnka, M., Kersebaum, K. C., et al. (2015). Crop modelling for integrated assessment of risk to food production from climate change. Environ. Modell. Softw. 72, 287–303. doi: 10.1016/j.envsoft.2014.12.003
Famien, A. M., Janicot, S., Ochou, A. D., Vrac, M., Defrance, D., Sultan, B., et al. (2018). A bias-corrected CMIP5 dataset for Africa using the CDF-t method: a contribution to agricultural impact studies. Earth Syst. Dyn. 9, 313–338. doi: 10.5194/esd-9-313-2018
FAO (2020). FAOSTAT, FAO Statistical Databases. Available online at: https://www.fao.org/faostat/en/#home (accessed January 10, 2020).
Funk, C., Peterson, P., Landsfeld, M., Pedreros, D., Verdin, J., Shukla, S., et al. (2015). The climate hazards infrared precipitation with stations–a new environmental record for monitoring extremes. Scientific Data 2, 1–21. doi: 10.1038/sdata.2015.66
GDAL/OGR contributors (2019). GDAL/OGR Geospatial Data Abstraction Software Library. Open Source Geospatial Foundation. Available online at: https://gdal.org doi: 10.5281/zenodo.5884351
Ghalanos, A., and Theussl, S. (2015). Rsolnp: General Non-linear Optimization Using Augmented Lagrange Multiplier Method. R package version 1.16.
Gilleland, E., and Katz, R. W. (2006). “Analyzing seasonal to interannual extreme weather and climate variability with the extremes toolkit,” in 18th Conference on Climate Variability and Change, 86th American Meteorological Society (AMS) Annual Meeting, volume 29 (Atlanta: Citeseer).
Grieser, J., Gommes, R., and Bernardi, M. (2006). The Miami Model of Climatic Net Primary Production of Biomass. FAO of the UN, Italy.
Hamilton, S. H., ElSawah, S., Guillaume, J. H., Jakeman, A. J., and Pierce, S. A. (2015). Integrated assessment and modelling: overview and synthesis of salient dimensions. Environ. Modell. Softw. 64, 215–229. doi: 10.1016/j.envsoft.2014.12.005
Herrero, M., Havlík, P., Valin, H., Notenbaert, A., Rufino, M. C., Thornton, P. K., et al. (2013). Biomass use, production, feed efficiencies, and greenhouse gas emissions from global livestock systems. Proc. Natl. Acad. Sci. U.S.A. 110, 20888–20893. doi: 10.1073/pnas.1308149110
HLPE. (2017). Nutrition and Food Systems. A Report by the High Level Panel of Experts on Food Security and Nutrition of the Committee on World Food Security. Rome: FAO. Available online at: https://www.fao.org/3/i7846e/i7846e.pdf.
Huffman, G. J. (2016). The Transition in Multi-Satellite Products From TRMM to GPM (TMPA to IMERG). Algorithm Information Document. Available online at: https://docserver.gesdisc.eosdis.nasa.gov/public/project/GPM/TMPA-to-IMERG_transition.pdf (accessed November 2, 2021).
Huffman, G. J., Bolvin, D. T., Nelkin, E. J., Wolff, D. B., Adler, R. F., Gu, G., et al. (2007). The TRMM Multisatellite Precipitation Analysis (TMPA): quasi-global, multiyear, combined-sensor precipitation estimates at fine scales. J. Hydrometeorol. 8, 38–55. doi: 10.1175/JHM560.1
Hurtt, G. C., Chini, L. P., Frolking, S., Betts, R. A., Feddema, J., Fischer, G., et al. (2011). Harmonization of land-use scenarios for the period 1500-2100: 600 years of global gridded annual land-use transitions, wood harvest, and resulting secondary lands. Clim. Change 109, 117. doi: 10.1007/s10584-011-0153-2
Jenkinson, D., Hart, P., Rayner, J., and Parry, L. (1987). Modelling the turnover of organic matter in long-term experiments at Rothamsted. INTECOL Bull. 15, 1–8.
Jenkinson, D., and Rayner, J. (1977). The turnover of soil organic matter in some of the Rothamsted classical experiments. Soil Sci. 123, 298–305. doi: 10.1097/00010694-197705000-00005
Jones, C., Giorgi, F., and Asrar, G. (2011). The coordinated regional downscaling experiment: CORDEX-an international downscaling link to CMIP5. CLIVAR Exchanges 16, 34–40.
Kimball, B. A. (2016). Crop responses to elevated CO2 and interactions with H2O, N, and temperature. Curr Opin Plant Biol. 31, 36–43. doi: 10.1016/j.pbi.2016.03.006
Leiter, T. (2021). Do governments track the implementation of national climate change adaptation plans? an evidence-based global stocktake of monitoring and evaluation systems. Environ. Sci. Policy 125, 179–188. doi: 10.1016/j.envsci.2021.08.017
Lieth, H. (1975). “Modeling the primary productivity of the world,” in Primary Productivity of the Biosphere (Springer), 237–263.
Lobell, D. B., and Asseng, S. (2017). Comparing estimates of climate change impacts from process-based and statistical crop models. Environ. Res. Lett. 12, 015001. doi: 10.1088/1748-9326/aa518a
Macdiarmid, J. I., Clark, H., Whybrow, S., De Ruiter, H., and McNeill, G. (2018). Assessing national nutrition security: the UK reliance on imports to meet population energy and nutrient recommendations. PLoS ONE 13, e0192649. doi: 10.1371/journal.pone.0192649
Mach, K. J., Mastrandrea, M. D., Freeman, P. T., and Field, C. B. (2017). Unleashing expert judgment in assessment. Glob. Environ. Change 44, 1–14. doi: 10.1016/j.gloenvcha.2017.02.005
Mastrandrea, M. D., Mach, K. J., Plattner, G.-K., Edenhofer, O., Stocker, T. F., Field, C. B., et al. (2011). The IPCC AR5 guidance note on consistent treatment of uncertainties: a common approach across the working groups. Clim Change 108, 675–691. doi: 10.1007/s10584-011-0178-6
Mbow, H.-O. P., Reisinger, A., Canadell, J., and O'Brien, P. (2017). Special Report on Climate Change, Desertification, Land Degradation, Sustainable Land Management, Food Security, and Greenhouse Gas Fluxes in Terrestrial Ecosystems (SR2). Ginevra: IPCC.
McSweeney, C. F., and Jones, R. G. (2016). How representative is the spread of climate projections from the 5 cmip5 gcms used in isi-mip? Clim. Serv. 1, 24–29. doi: 10.1016/j.cliser.2016.02.001
Monfreda, C., Ramankutty, N., and Foley, J. A. (2008). Farming the planet: 2. Geographic distribution of crop areas, yields, physiological types, and net primary production in the year 2000. Glob. Biogeochem. Cycles 22, 2947. doi: 10.1029/2007GB002947
Msofe, N. K., Sheng, L., Li, Z., and Lyimo, J. (2020). Impact of land use/cover change on ecosystem service values in the kilombero valley floodplain, southeastern tanzania. Forests 11, 109. doi: 10.3390/f11010109
Müller, C., and Robertson, R. D. (2014). Projecting future crop productivity for global economic modeling. Agric. Econ. 45, 37–50. doi: 10.1111/agec.12088
Nelson, G. C., Valin, H., Sands, R. D., Havlík, P., Ahammad, H., Deryng, D., et al. (2014). Climate change effects on agriculture: economic responses to biophysical shocks. Proc. Natl. Acad. Sci. U.S.A. 111, 3274–3279. doi: 10.1073/pnas.1222465110
O'Neill, B. C., Carter, T. R., Ebi, K., Harrison, P. A., Kemp-Benedict, E., Kok, K., et al. (2020). Achievements and needs for the climate change scenario framework. Nat. Clim. Chang 10, 1074–1084. doi: 10.1038/s41558-020-00952-0
Overeem, A., Buishand, T., and Holleman, I. (2009). Extreme rainfall analysis and estimation of depth-duration-frequency curves using weather radar. Water Resour. Res. 45, 7869. doi: 10.1029/2009WR007869
Parkes, B., Challinor, A., and Nicklin, K. (2015). Crop failure rates in a geoengineered climate: impact of climate change and marine cloud brightening. Environ. Res. Lett. 10, 084003. doi: 10.1088/1748-9326/10/8/084003
Portmann, F., Siebert, S., and Döll, P. (2010). MIRCA2000-Global monthly irrigated and rainfed crop areas around the year 2000: a new high-resolution data set for agricultural and hydrological modeling. Global Biogeochem Cycles. 24, 3435. doi: 10.1029/2008G.B.003435
R Core Team (2017). R: A Language and Environment for Statistical Computing. Vienna: R Foundation for Statistical Computing.
Ruane, A. C., Antle, J., Elliott, J., Folberth, C., Hoogenboom, G., Croz, D. M.-D., et al. (2018). Biophysical and economic implications for agriculture of + 1.5 and + 2.0 C global warming using AgMIP coordinated global and regional assessments. Clim. Res. 76, 17–39. doi: 10.3354/cr01520
Ruane, A. C., and McDermid, S. P. (2017). Selection of a representative subset of global climate models that captures the profile of regional changes for integrated climate impacts assessment. Earth Perspect. 4, 1–20. doi: 10.1186/s40322-017-0036-4
Saxton, K., Rawls, W., Romberger, J., and Papendick, R. (1986). Estimating generalized soil-water characteristics from texture. Soil Sci. Soc. Am. J. 50, 1031–1036. doi: 10.2136/sssaj1986.03615995005000040039x
Sinclair, T. R., and Seligman, N. (2000). Criteria for publishing papers on crop modeling. Field Crops Res. 68, 165–172. doi: 10.1016/S0378-4290(00)00105-2
Smith, J., Bradbury, N., and Addiscott, T. (1996). SUNDIAL: a PC-based system for simulating nitrogen dynamics in arable land. Agron J. 88, 38–43. doi: 10.2134/agronj1996.00021962008800010008x
Smith, J., Gottschalk, P., Bellarby, J., Chapman, S., Lilly, A., Towers, W., et al. (2010a). Estimating changes in Scottish soil carbon stocks using ECOSSE. I. Model description and uncertainties. Clim. Res. 45, 179–192. doi: 10.3354/cr00899
Smith, J., Gottschalk, P., Bellarby, J., Chapman, S., Lilly, A., Towers, W., et al. (2010b). Estimating changes in Scottish soil carbon stocks using ECOSSE. II. Application. Clim. Res. 45, 193–205. doi: 10.3354/cr00902
Taylor, K. E., Stouffer, R. J., and Meehl, G. A. (2012). An overview of CMIP5 and the experiment design. Bull. Am. Meteorol. Soc. 93, 485–498. doi: 10.1175/BAMS-D-11-00094.1
Thompson, V., Dunstone, N. J., Scaife, A. A., Smith, D. M., Slingo, J. M., Brown, S., et al. (2017). High risk of unprecedented UK rainfall in the current climate. Nat Commun. 8, 1–6. doi: 10.1038/s,41467-017-00275-3
UNEP-WCMC and IUCNe (2019). Protected Planet: The World Database on Protected Areas (WDPA), Cambridge, UK: UNEP-WCMC and IUCN.
van Meijl, H., Shutes, L., Valin, H., Stehfest, E., van Dijk, M., Kuiper, M., et al. (2020). Modelling alternative futures of global food security: insights from FOODSECURE. Glob. Food Security 25, 100358. doi: 10.1016/j.gfs.2020.100358
van Wijk, M. T., Merbold, L., Hammond, J., and Butterbach-Bahl, K. (2020). Improving assessments of the three pillars of climate smart agriculture: current achievements and ideas for the future. Front. Sustain. Food Syst. 4, 148. doi: 10.3389/fsufs.2020.558483
Vermeulen, S. J., Challinor, A. J., Thornton, P. K., Campbell, B. M., Eriyagama, N., Vervoort, J. M., et al. (2013). Addressing uncertainty in adaptation planning for agriculture. Proc. Natl. Acad. Sci. U.S.A. 110, 8357–8362. doi: 10.1073/pnas.1219441110
Vicente-Serrano, S. M., Beguería, S., and López-Moreno, J. I. (2010). A multiscalar drought index sensitive to global warming: the standardized precipitation evapotranspiration index. J Clim. 23, 1696–1718. doi: 10.1175/2009JCLI2909.1
Webber, H., Gaiser, T., and Ewert, F. (2014). What role can crop models play in supporting climate change adaptation decisions to enhance food security in sub-saharan africa? Agric. Syst. 127, 161–177. doi: 10.1016/j.agsy.2013.12.006
Wesselink, A., Challinor, A. J., Watson, J., Beven, K., Allen, I., Hanlon, H., et al. (2015). Equipped to deal with uncertainty in climate and impacts predictions: lessons from internal peer review. Clim. Change 132, 1–14. doi: 10.1007/s10584-014-1213-1
Wheeler, T., and von Braun, J. (2013). Climate change impacts on global food security. Science 341, 508–513. doi: 10.1126/science.1239402
Whitfield, S., Chapman, S., Mahop, M. T., Deva, C., Masamba, K., and Mwamahonje, A. (2021). Exploring assumptions in crop breeding for climate resilience: opportunities and principles for integrating climate model projections. Clim. Change 164, 1–18. doi: 10.1007/s10584-021-02997-2
Wieder, W., Boehnert, J., Bonan, G., and Langseth, M. (2014). Regridded harmonized world soil database v1. 2. doi: 10.3334/ORNLDAAC/1247
Keywords: nutrition security, climate-smart agriculture, adaptation, mitigation, climate change, sub-Saharan Africa, integrated assessment, scenarios
Citation: Jennings SA, Challinor AJ, Smith P, Macdiarmid JI, Pope E, Chapman S, Bradshaw C, Clark H, Vetter S, Fitton N, King R, Mwamakamba S, Madzivhandila T, Mashingaidze I, Chomba C, Nawiko M, Nyhodo B, Mazibuko N, Yeki P, Kuwali P, Kambwiri A, Kazi V, Kiama A, Songole A, Coskeran H, Quinn C, Sallu S, Dougill A, Whitfield S, Kunin B, Meebelo N, Jamali A, Kantande D, Makundi P, Mbungu W, Kayula F, Walker S, Zimba S, Galani YJH, Kapulu N, Galdos MV, Eze S, Tripathi HG, Sait SM, Kepinski S, Likoya E, Greathead H, Smith HE, Mahop MT, Harwatt H, Muzammil M, Horgan G and Benton T (2022) A New Integrated Assessment Framework for Climate-Smart Nutrition Security in sub-Saharan Africa: The Integrated Future Estimator for Emissions and Diets (iFEED). Front. Sustain. Food Syst. 6:868189. doi: 10.3389/fsufs.2022.868189
Received: 02 February 2022; Accepted: 16 June 2022;
Published: 22 July 2022.
Edited by:
Peter Thorburn, Commonwealth Scientific and Industrial Research Organisation (CSIRO), AustraliaReviewed by:
Ruediger Schaldach, University of Kassel, GermanyCecile Marie Godde, Commonwealth Scientific and Industrial Research Organisation (CSIRO), Australia
Copyright © 2022 Jennings, Challinor, Smith, Macdiarmid, Pope, Chapman, Bradshaw, Clark, Vetter, Fitton, King, Mwamakamba, Madzivhandila, Mashingaidze, Chomba, Nawiko, Nyhodo, Mazibuko, Yeki, Kuwali, Kambwiri, Kazi, Kiama, Songole, Coskeran, Quinn, Sallu, Dougill, Whitfield, Kunin, Meebelo, Jamali, Kantande, Makundi, Mbungu, Kayula, Walker, Zimba, Yamdeu, Kapulu, Galdos, Eze, Tripathi, Sait, Kepinski, Likoya, Greathead, Smith, Mahop, Harwatt, Muzammil, Horgan and Benton. This is an open-access article distributed under the terms of the Creative Commons Attribution License (CC BY). The use, distribution or reproduction in other forums is permitted, provided the original author(s) and the copyright owner(s) are credited and that the original publication in this journal is cited, in accordance with accepted academic practice. No use, distribution or reproduction is permitted which does not comply with these terms.
*Correspondence: Stewart A. Jennings, cy5hLmplbm5pbmdzQGxlZWRzLmFjLnVr