 Olivia M. Smith1,2,3*
 Dowen M. I. Jocson4
 Benjamin W. Lee4
 Robert J. Orpet5
 Joseph M. Taylor2
 Alexandra G. Davis6Cassandra J. Rieser6Abigail E. Clarke5Abigail L. Cohen4Abigail M. Hayes4
 Connor A. Auth4Paul E. Bergeron4Adrian T. Marshall5
 John P. Reganold6
 David W. Crowder4
 Tobin D. Northfield5,7
- 1School of Biological Sciences, Washington State University, Pullman, WA, United States
- 2Department of Entomology, University of Georgia, Athens, GA, United States
- 3Ecology, Evolution, and Behavior Program, Michigan State University, East Lansing, MI, United States
- 4Department of Entomology, Washington State University, Pullman, WA, United States
- 5Department of Entomology, Tree Fruit Research and Extension Center, Washington State University, Wenatchee, WA, United States
- 6Department of Crop and Soil Sciences, Washington State University, Pullman, WA, United States
- 7Centre for Tropical Environmental Sustainability Science, James Cook University, Cairns, QLD, Australia
Sustainable agroecosystems provide adequate food while supporting environmental and human wellbeing and are a key part of the United Nations Sustainable Development Goals (SDGs). Some strategies to promote sustainability include reducing inputs, substituting conventional crops with genetically modified (GM) alternatives, and using organic production. Here, we leveraged global databases covering 121 countries to determine which farming strategies—the amount of inputs per area (fertilizers, pesticides, and irrigation), GM crops, and percent agriculture in organic production—are most correlated with 12 sustainability metrics recognized by the United Nations Food and Agriculture Organization. Using quantile regression, we found that countries with higher Human Development Indices (HDI) (including education, income, and lifespan), higher-income equality, lower food insecurity, and higher cereal yields had the most organic production and inputs. However, input-intensive strategies were associated with greater agricultural greenhouse gas emissions. In contrast, countries with more GM crops were last on track to meeting the SDG of reduced inequalities. Using a longitudinal analysis spanning 2004–2018, we found that countries were generally decreasing inputs and increasing their share of agriculture in organic production. Also, in disentangling correlation vs. causation, we hypothesize that a country's development is more likely to drive changes in agricultural strategies than vice versa. Altogether, our correlative analyses suggest that countries with greater progress toward the SDGs of no poverty, zero hunger, good health and wellbeing, quality education, decent work, economic growth, and reduced inequalities had the highest production of organic agriculture and, to a lesser extent, intensive use of inputs.
Introduction
Agriculture is a large contributor to global biodiversity decline, greenhouse gas emissions, loading of nutrients into the biosphere, use of freshwater, and pesticide pollution (West et al., 2014). Consequently, efforts to develop and promote sustainable food systems that produce sufficient and nutritious food, minimize environmental harm, and improve natural, social, and human capital are core aspects of the United Nations Sustainable Development Goals (SDGs; Pretty et al., 2018; United Nations, 2019, 2020). Additionally, a report by the U.S. National Academy of Sciences found that sustainable farming systems need to support four broad sustainability goals of production: environmental quality, economic viability, and social wellbeing (National Research Counsil, 2010; Reganold et al., 2011). Simultaneous advancement in all the four areas of sustainability is difficult, however, and research has generally focused on balancing production and environmental priorities (e.g., Karp et al., 2018; Smith et al., 2020), while socioeconomic dimensions of agriculture are less studied (Rasmussen et al., 2018). In addition, extensive debate remains as to which systems are most able to achieve the United Nations SDGs (Kremen, 2015; Reganold and Wachter, 2016; Balmford et al., 2018).
Increasing input-intensity (e.g., increasing use of pesticides, fertilizers, and irrigation per area) within conventional systems over the past century has helped to lead to dramatic increases in supplies of food and other products (Ramankutty et al., 2018). However, these gains are often at the expense of the other sustainability aspects, such as environmental degradation, biodiversity loss, and public health problems (Reganold and Wachter, 2016; Ramankutty et al., 2018). Two examples of alternatives to simply increasing input-intensity are genetically modified (GM) cropping systems and organic farming systems, with both becoming more common (Reganold and Wachter, 2016; Wickson et al., 2016; Taheri et al., 2017). However, although organic agriculture better balances multiple sustainability metrics (e.g., promoting biodiversity, soil health, and profitability) than their conventional counterparts (Gattinger et al., 2012; Crowder and Reganold, 2015; Reganold and Wachter, 2016; Seufert and Ramankutty, 2017; Smith et al., 2020), it produces lower yields (Seufert et al., 2012; Ponisio et al., 2015) and often has higher food costs for consumers (Dimitri and Greene, 2002). Additionally, while GM crops can increase yields while reducing insecticide use and irrigation (Wickson et al., 2016; Taheri et al., 2017), the use of herbicide-tolerant GM crops can increase applications of herbicides that contribute to biodiversity loss and harm human health (Fernandez-Cornejo et al., 2014; Klümper and Qaim, 2014). Yet, few studies have assessed whether global associations exist among these farming strategies—input-intensive agriculture, GM, and organic agriculture—and a broad spectrum of sustainability indicators.
The adoption of particular farming methods and resulting sustainability impacts could be associated with socioeconomic factors of different countries (Vanwey et al., 2013). For example, input-intensive agriculture, typical of conventional farming since the Green Revolution, relies on expensive inputs that require training to deploy safely and effectively (Ramankutty et al., 2018; Rasmussen et al., 2018; Mkenda et al., 2020); likewise, GM crop seeds are costly (Klümper and Qaim, 2014), and organic agriculture has price premiums on its products (Crowder and Reganold, 2015). Perhaps intensive use of agricultural inputs, use of GM crops, and adoption of organic agriculture are most viable in developed nations with high incomes and food security. In contrast, less-developed nations with less intensified agriculture may produce insufficient food but cause less environmental harm (Béné et al., 2019b).
Here, to better understand the global drivers of sustainability, we examine associations among three commonly implemented agricultural strategies often argued to contribute to sustainability: agricultural input-intensity (amount of inputs per hectare), percent of cropland in GM crops, and percent of agriculture in organic production. We then assess relationships among the extent of these agricultural practices and 12 sustainability metrics with available global datasets: CO2 equivalent (CO2eq) emissions, Human Development Index (HDI), and its three subcomponent indices (Income Index, Education Index, and Life Expectancy Index), Gross Production Value, income inequality (Gini coefficient), agricultural employment, food supply, food insecurity, agricultural researchers per 100,000 farmers, and cereal yields. Our study leveraged global datasets from the UN Food and Agriculture Organization, PG Economics Limited (Brookes and Barfoot, 2017), the United Nations Human Development Programme, and the World Bank, covering 121 countries across six continents (Supplementary Tables S1, S2).
We organized our analyses around three overarching questions. First, are countries using the three agricultural strategies in congruence, in opposition, or independently of the other agricultural strategies? Second, does the extent of each of the three strategies predict carbon dioxide equivalent (CO2eq) emissions from agriculture? Third, how do socioeconomic and food production indicators relate to input intensity, percent of cropland in GM crops, and percent of agriculture in organic production? Following up on our third question, we examined how a broad socioeconomic indicator, the HDI, predicted the amount and change over time (2004–2018) in the three strategies. The interest in this final analysis resided partially in disentangling the direction of effect; that is, do socioeconomic conditions drive the adoption of certain agricultural strategies, or do agricultural strategies drive the development of a country?
Materials and Methods
Data Collection
We gathered global datasets from the United Nations Food and Agriculture Organization (FAO), PG Economics (Brookes and Barfoot, 2017), the United Nations Human Development Programme, and the World Bank. We collected data pertaining to four aspects of food system sustainability: (i) environment, (ii) economics, (iii) social conditions, and (iv) production. We selected socioeconomic indicators and data sources by referencing a recent review that rigorously assessed food system sustainability indicators based on a literature review and global data availability (Béné et al., 2019a) (see Supplementary Table S1 for full descriptions). We note that the sustainability indicators used in our study do not represent a comprehensive list but were selected due to availability (Béné et al., 2019a). For example, sustainability indicators, such as biodiversity loss, water quality, and erosion, are important to consider but beyond the scope of our study. To classify farming strategies, we collected data from the United Nations FAO, including agricultural area (crops, meadows, pastures, protective cover, farm buildings, and uncultivated areas), cropland area (arable land and permanent crops), agricultural area under organic management (percent agricultural land—both crop and livestock—that is certified organic or transitioning to certified organic), land area equipped for irrigation, pesticide use (insecticides, herbicides, fungicides, plant growth regulators, and rodenticides), nutrient nitrogen use (synthetic nitrogen for crops, livestock, forestry, fisheries, and aquaculture), and nitrogen content from manure application to agricultural soils. Agricultural metrics for each country were divided by area in agriculture to account for differences in the extent of production. Metrics used for analyses were calculated by averaging values across the years 2013–2017 where data were available. We also gathered data on the area of GM crops grown per country using data from Brookes and Barfoot (2017) and then scaled the area of GM crops by cropland area from the United Nations FAO. The GM database we used included the area of GM eggplant, sugar beets, squash, papaya, canola, cotton, maize, and soybeans (Supplementary Table S3).
To quantify the environmental impacts, we gathered data from the United Nations FAO on CO2eq emissions [greenhouse gas emissions scaled to carbon dioxide equivalent from enteric fermentation, manure management, rice cultivation, synthetic fertilizers, manure applied to soils and left on pastures, crop residues, cultivation of organic soil (generally soils with >20% organic matter), burning crop residues, and burning savannah for agricultural purposes] from agricultural production (scaled by agricultural area).
We also collected 10 metrics on socioeconomic sustainability. We gathered the HDI and its three socioeconomic subcomponent indices of income, education, and lifespan from the United Nations Human Development Programme. We gathered two additional economic metrics: (i) agricultural Gross Production Value from the United Nations FAO, which considers both production in physical terms and price at the farm gate, and which we scaled by agricultural area, and (ii) levels of income inequality (Gini coefficient) from the World Bank. We gathered four additional social metrics collected from the United Nations FAO: (i) percent employment in agriculture, (ii) food supply (kCal/capita/day), (iii) prevalence of moderate to severe food insecurity, and (iv) number of agricultural researchers per 100,000 farmers (data only available from low- to middle-income countries). Finally, we collected data on cereal yields from the United Nations FAO. We used cereal yields as an indicator of overall crop yields due to the importance of cereals as staple crops, their widespread production, and a large amount of available data. In alignment with agricultural strategy metrics, socioeconomic metrics were calculated by averaging values across the years 2013–2017 where data were available (Supplementary Table S1).
To better understand potential causation and directions of effects, we conducted longitudinal analyses examining change in agricultural strategies over time (i.e., lag analysis and longitudinal GLMMs). We gathered additional synthetic nitrogen, percent area in GM, share in organic production, and HDI data starting at the earliest year (2004) and ending at the latest year (2018) for which the United Nations databases had data for all four metrics when the analyses were conducted. Data were scaled to the agricultural areas as described above. We used synthetic nitrogen alone rather than a composite principal component (PC) to keep metrics consistent across years.
Statistical Analyses
Because inputs metrics were highly correlated (Supplementary Figure S1), we used PC analysis to create a composite inputs metric using the prcomp function in R version 3.6.3 (R Core Development Team, 2020). We included the prevalence of organic agriculture to assess relationships between the extent of organic agriculture and inputs. However, we did not include the extent of GM crops in the PC analysis due to the preponderance of zeros in the data [96 of the 121 countries used in analyses did not produce GM crops in the date range used (2013–2017)]. Thus, a large number of zeroes in that vector would have greatly hindered the interpretation of the other metrics. To account for the variation in scale among metrics in the PC analysis, we standardized each country's metric value by calculating a z-score [(x – xbar)/sd], where x is the raw data for the country, xbar is the mean value calculated across all countries, and sd is the standard deviation for the metric calculated across all countries. The first four PCs combined accounted for 95.3% of the variation (Supplementary Table S4). Increasing values of PC1 (“input-intensity”) were associated with increased agricultural land equipped for irrigation, synthetic nitrogen input, manure applied to soils, and pesticide use, all scaled by total agricultural area (Figure 1A; Supplementary Table S5; Supplementary Figure S2). Increasing values of PC2 were primarily associated with an increased share of agricultural land in organic production (Figure 1A; Supplementary Table S5; Supplementary Figure S2). These two PCs together represented 73.1% of the variation, and PC3 and PC4 accounted for 13.9 and 8.68%, respectively (Supplementary Table S4; Supplementary Figure S2). We used PC1 in our analyses to represent agricultural input-intensity but used the actual percent organic agriculture in subsequent analyses (note that total inputs also included inputs in GM and organic systems).
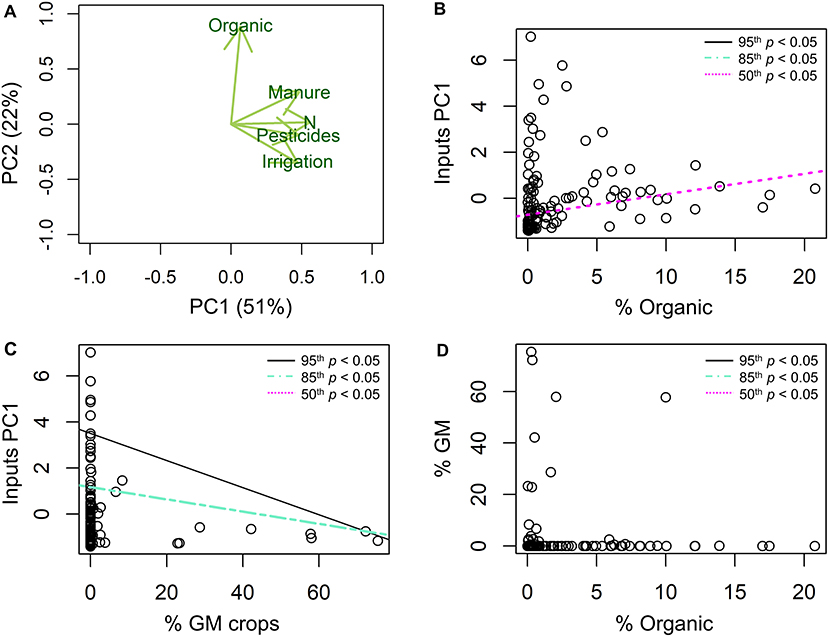
Figure 1. Relationships between agricultural practices. (A) Principal components (PC) 1 and 2 showing variation (shown as % in axis labels) in five agricultural metrics: (i) share of agricultural land in organic production; (ii) share of agricultural land equipped for irrigation; (iii) synthetic nitrogen (N) input; (iv) manure applied to soils; and (v) pesticide use scaled by total agricultural area. (B–D) Quantile regressions showing relationships between agricultural practices at the 50th (pink, dotted line), 85th (teal, dashed line), and 95th (black, solid line) quantiles. (B) Percentage of agriculture in organic vs. inputs PC1, (C) percentage of crops in GM vs. inputs PC1, and (D) percentage of agriculture in organic vs. percentage of crops in GM. Lines with coefficient P > 0.05 are not shown in the figure, but all regression line estimates and errors are given in Supplementary Tables S6–S8.
To evaluate the relationship between the intensity of agricultural inputs (PC1), the prevalence of GM crops, the prevalence of organic agriculture, and various sustainability aspects, we conducted a series of quantile regressions. We did not directly account for synergies and trade-offs of the agricultural strategies on various sustainability metrics. Because the individual countries that had data for different sustainability metrics were inconsistent, this was not feasible with our dataset. We used quantile regression because we often observed triangular patterns in the data (i.e., the variance of the y variable changes as the x variable changes), violating the assumptions of an ordinary least-squares regression (Scharf et al., 1998). The triangular patterns suggest that the predictor variable represents an important limiting factor for the response variable, but that other unknown factors may also influence the ability of a country to reach those maximum values (Scharf et al., 1998). Quantile regression has been used for ecological data when these types of relationships occur, where for example, top predators may limit the maximum number of mesopredators, but the minimum number of mesopredators is presumably determined by unmeasured factors, such as food availability (Johnson and Vanderwal, 2009). For our quantile regressions, we used 50,000 bootstrap iterations to calculate P-values using the rq function in the quantreg package in R version 4.0.3 (Koenker, 2019). We used the 50th, 85th, and 95th quantiles in our analyses to look at how sustainability indicators relate to middle production values and highest production values with the idea that higher levels of sustainability transitions are the goal. That is, we examined how countries' socioeconomic indicators predicted, for example, placement in the upper 5% of organic agricultural production in recent years (average percent from 2013 to 2017). We focused on the 95th quantile as the highest level of current production, rather than the 99th, because the latter is more susceptible to outliers and can produce more unreliable models (Scharf et al., 1998). Because GM crops are only used by 25 countries in our 2013–2017 dataset, we were unable to examine median values because the median was zero. Therefore, we used the 85th quantile because it was the lowest quantile for which percent of GM crops was non-zero. Results were generally qualitatively similar across quantiles (Supplementary Tables S6–S8), so we do not discriminate between quantiles in the main text unless the results differed.
Finally, we conducted a lag analysis and a longitudinal GLMM analysis in an effort to disentangle the direction of effect between socioeconomic conditions and agricultural strategies over time. For this, we assessed the relationship among the HDI and (i) synthetic nitrogen, (ii) the prevalence of GM crops, and (iii) the prevalence of organic agriculture. By evaluating changes in each metric over time, we can evaluate the potential for consistent time lags in effects that help explain the direction of causation. That is, if variable x consistently lags behind variable y, it would suggest that variable y influences change in variable x (e.g., Shackleton, 2000). Here, a negative lag would mean that increases in the HDI typically occur x years before increases in the agricultural metric. In contrast, positive lags would indicate that increases in the HDI follow increases in the agricultural metric (i.e., changes in the agricultural metric could increase the HDI). We ran a cross-correlation analysis for each country separately and kept the strongest lag for each. We focused on positive correlations in the lags because the between-country relationships were typically positive (e.g., higher HDI should increase rather than decrease organic production). We ran the models twice: (1) once on all countries with enough data (114 countries for synthetic nitrogen and percent organic agriculture and 26 countries that had non-zero percent GM crops for at least 1 year from 2004 to 2018) and (2) only included countries with high values (nitrogen/area >25 tons/1,000 ha and >0.5% organic; each of these included 52 countries).
In addition to the lag analysis, we conducted a longitudinal GLMM analysis because we were unable to determine evidence for a lag in either direction, potentially due to data being limited to 15 years. Rather than agricultural strategies and HDI feeding into each other, it may be that different socioeconomic conditions (but not necessarily their changes) determine agricultural strategy use. For our longitudinal GLMMs, we used the glmmTMB package in R (Brooks et al., 2017). Models included a temporal autocorrelation (AR1) term to account for the repeated measures over time. We ran models once with the HDI as a predictor of each of the three farming variables (distributions: synthetic nitrogen = Poisson, %GM crops = beta, %organic = beta) and once with each of the farming system variables as predictors of the HDI (distributions all Gaussian). We selected the best distribution for each by comparing AIC values. We tested for potential interactions with the variables over time by including a year fixed effect. We assessed if variables improved model fit using likelihood ratio tests.
Results and Discussion
Associations Between the Farming Strategies and Their Potential Impacts on CO2eq Emissions
We first explored relationships between the intensity of agricultural inputs (the first PC of our PC analysis; Figure 1A; Supplementary Tables S4, S5; Supplementary Figure S2), the prevalence of GM crops, and the prevalence of organic agriculture. PC analysis suggested that the prevalence of organic farming was generally orthogonal to total pesticide use, fertilizer use, and irrigation scaled by agricultural area, indicating that prevalence of organic agriculture was not strongly linked to those inputs (Figures 1A,B; Supplementary Figure S2). The lack of association between the prevalence of organic agriculture and input intensity in the PC analysis was surprising given that organic systems typically use fewer fertilizer and pesticide inputs than conventional systems (Reganold and Wachter, 2016). However, organic production represented a small share of total production for countries in our study (mean = 2.4%; Figure 2C), suggesting that current levels of organic production are too small to meaningfully impact a country's use of external agricultural inputs. When using quantile regression to examine how the amount of agriculture in organic production predicts the use of inputs, we saw a counterintuitive positive relationship at the 50th quantile (but not 85th and 95th; Figure 1B; Supplementary Tables S6–S8). Perhaps this reflects the current transition to the greater prevalence of organic production in countries with the greatest need to transition into environmentally sustainable practices.
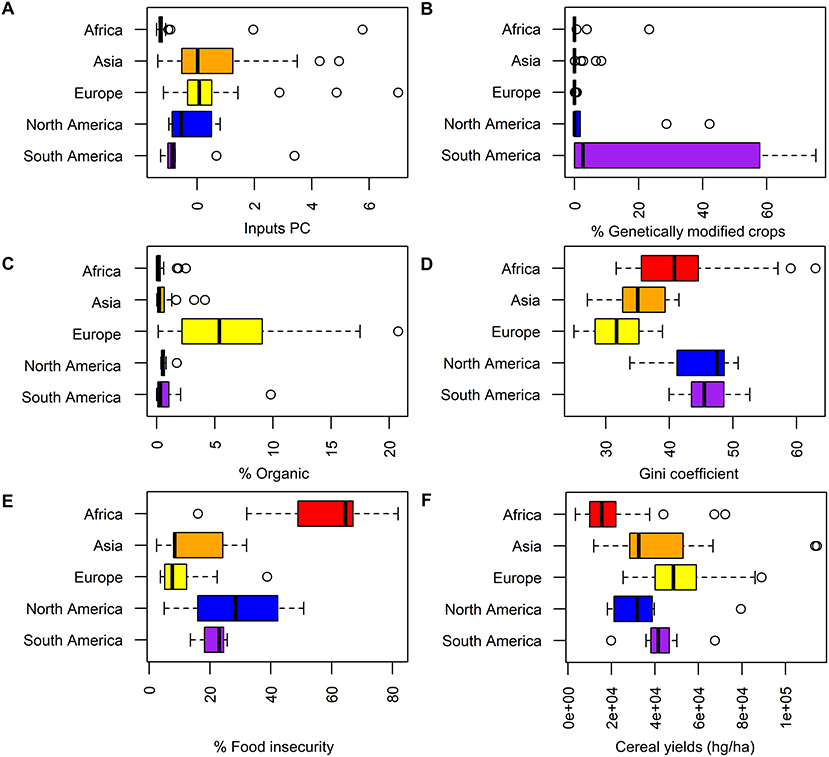
Figure 2. Distribution of production strategies, income inequality, yields, and food insecurity by continent. Boxplots show all continents with over five countries represented in our dataset. (A) Inputs PC, (B) percentage of cropland in genetically modified (GM) crops, (C) percentage of organic agriculture, (D) Gini coefficient of income inequality (0 = perfect equality; 1 = perfect inequality), (E) prevalence of moderate to severe food insecurity, and (F) cereal yield (hg/ha).
In contrast to organic production, the prevalence of cropland in GM was associated with lower agricultural input-intensity (Figure 1C; Supplementary Tables S6–S8; Supplementary Figures S1, S4–S6A,B). Our finding that countries implementing wide-scale substitution with GM crops typically used fewer inputs aligns with other studies that have found that GM crops can reduce insecticide use and irrigation (Wickson et al., 2016; Taheri et al., 2017), as most GM crops are designed to do so. Finally, while certified organic agriculture excludes GM crops, we found no association or disassociation between these two farming systems (Figure 1D; Supplementary Tables S6–S8; Supplementary Figures S1, S4–S6B,C). This suggests that ecological intensification via organic methods and agricultural intensification via technology-based tools like GM crops can exist side-by-side within countries.
We next assessed relationships between the agricultural strategies and CO2eq emissions from agriculture, which is a major contributor to climate change and identified as the greatest challenge to sustainable development in the United Nations SDGs (Tilman et al., 2002; Snyder et al., 2009; United Nations General Assembly, 2015; Ramankutty et al., 2018). Across countries in our study, we found that CO2eq emissions were strongly positively correlated with input-intensity (Supplementary Table S9; Supplementary Figure S7). This is perhaps not surprising, given that the FAO database we used calculates CO2eq emissions from agriculture using enteric fermentation, manure management, rice cultivation, synthetic fertilizers, manure applied to soils and left on pastures, crop residues, cultivation of organic soils (generally soils with >20% organic matter), burning crop residues, and burning savannah for agricultural purposes. Globally, emissions from fertilizers are large contributors to agricultural greenhouse gas emissions (Tilman et al., 2002; Balmford et al., 2018; Ramankutty et al., 2018). In contrast to countries using greater input intensities and having greater CO2eq emissions, countries with a greater prevalence of GM crops had reduced emissions (Supplementary Figure S7), aligning with lower input use in these same countries (Figure 1C). Finally, we saw a counterintuitive increase in CO2eq emissions at the median in countries with a higher prevalence of organic agriculture (Supplementary Figure S7), again aligning with the correlation between organic agriculture and input intensity at the 50th quantile.
Unfortunately, we were unable to obtain data on emissions from machinery, buildings, irrigation pumps, or upstream/downstream factors (e.g., feed production), which are also known to be large contributors to agricultural greenhouse gas emissions (Snyder et al., 2009; Balmford et al., 2018). Consequently, we may have underestimated the associations between input-intensity and environmental impacts. Additionally, we may have underestimated the potential benefits of organic agriculture by failing to account for factors that may limit emissions, such as carbon sequestration (Gattinger et al., 2012; Balmford et al., 2018). Furthermore, our analysis is correlational, and countries may be transitioning to organic agriculture as a consequence of high environmental impacts. Syntheses of studies conducted on small scales show potential climate mitigation benefits of organic agriculture (Gattinger et al., 2012; Rodale Institute, 2020). This suggests that organic systems are not currently deployed widely enough to mitigate emissions from agriculture to aid in globally reducing greenhouse gas emissions to reach the SDG of net zero by 2050 (United Nations, 2020). Shifts toward less input-intensive food production strategies, such as GM crops and organic production, will be necessary to achieve climate mitigation goals through responsible consumption and production.
Relationship Between Farming Strategies, Agricultural Production, and Socioeconomic Indicators
Next, we assessed the relationships among input intensity, the prevalence of GM crops, and the prevalence of organic agriculture with metrics reflecting socioeconomic sustainability (Supplementary Table S1). High levels of the HDI and its three subcomponent indices (income, education, and lifespan) were positively associated with higher maximum values of input-intensity and prevalence of organic agriculture but were not correlated with the prevalence of GM crops (Figure 3; Supplementary Tables S6–S8; Supplementary Figures S6, S8–S11). Thus, our correlative analyses suggested that countries closer to meeting the SDGs of good health and wellbeing, quality education, no poverty, and decent work and economic growth had greater input intensities and prevalence of organic agriculture. Conversely, we detected no relationship between countries' progress toward these goals and the use of GM crops.
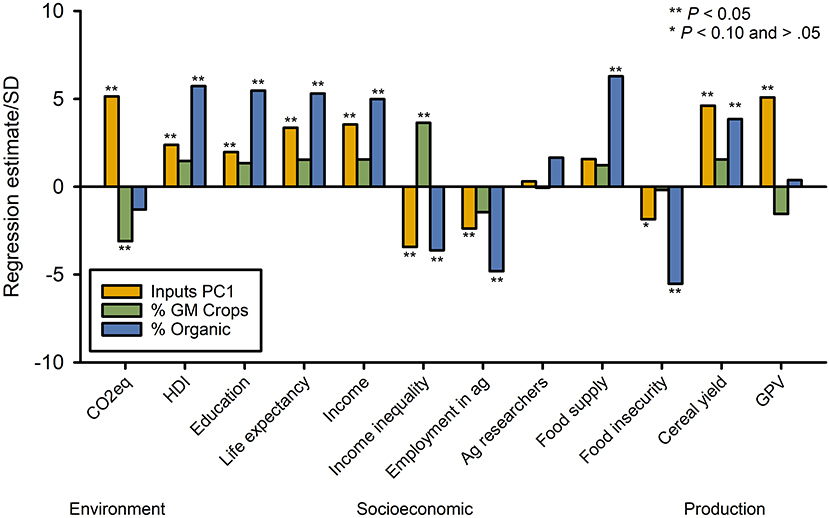
Figure 3. Strength of relationship between sustainability indicators and agricultural practices. The figure displays coefficient estimates divided by the standard deviation from 95th quantile regressions for inputs PC1, percentage of cropland in GM crops, and percentage of agriculture in organic production for 12 metrics of environmental, economic, social, and food and nutrition sustainability (see Supplementary Table S1 for full metric details and Supplementary Table S8 for statistics). **P < 0.05, *P < 0.10.
For economic factors, our correlative analyses suggested that countries with greater income inequality used fewer inputs per area, had a larger percent of cropland in GM, and had a lower prevalence of organic agriculture (Figure 3; Supplementary Tables S6–S8; Supplementary Figures S6, S12). This may be largely driven by political opposition to GM crops in Europe (Herring, 2008), which has the highest levels of income equality (Figure 2D; Supplementary Figure S6), high agricultural inputs per area (Figure 2A), and the highest prevalence of organic production (Figure 2C). Only five European countries grew GM crops during our study period (2013–2017; Figure 2B; Supplementary Figure S6). Altogether, our correlative analyses suggested that the countries most on track to reaching the United Nations SDGs of no poverty and reduced inequalities had higher agricultural input-intensities and greater prevalence of organic agriculture. However, countries with higher use of GM crops were least on track to meeting the SDG of reduced inequalities.
For social metrics, we found that countries with reduced percent employment in agriculture and lower food insecurity had a greater prevalence of organic production and, to a lesser extent, greater input-intensities (Figure 3; Supplementary Tables S6–S8; Supplementary Figures S13, S14). However, neither agricultural employment nor food insecurity was related to the prevalence of GM crops (Figure 3; Supplementary Tables S6–S8; Supplementary Figures S13, S14). The inverse relationship between agricultural employment and the prevalence of organic agriculture was surprising because labor costs are higher (7–13%) in organic compared to conventional farming systems (Crowder and Reganold, 2015). However, agricultural employment was inversely associated with most development indicators (Supplementary Figures S4, S5), which were positively predictive of organic agriculture. Thus, there may be increased “pockets” of agricultural workers on organic farms, but the country-wide workforce in agriculture was generally lower in highly developed countries that tended to have a greater prevalence of organic production. Finally, food supply was positively correlated with organic agriculture, and to a lesser extent input-intensity, but was not associated with the prevalence of GM cropping systems (Figure 3; Supplementary Tables S6–S8; Supplementary Figure S15).
When evaluating the correlations between agricultural production (i.e., cereal yields) and agricultural strategy use, we found that cereal yields were positively associated with input-intensity and prevalence of organic agriculture but were uncorrelated with the prevalence of GM crops (Figure 3; Supplementary Tables S6–S8; Supplementary Figure S16). The positive correlation between cereal yields and organic agriculture was surprising because organic systems generally have lower yields than conventional systems (Seufert et al., 2012; Ponisio et al., 2015), which has led to criticism of the ability of organic systems to feed a growing population (Kirchmann, 2019). The positive correlation between yield and the extent of organic production is likely mediated by other socioeconomic factors (e.g., consumer demand that can be influenced by wealth, social/cultural factors, and education). For example, countries with high yields and food security from more high-yielding systems (Ramankutty et al., 2018) are the same countries that are transitioning into organic production (e.g., European countries; Figure 2C; Supplementary Figure S6). This could compensate for any yield deficiencies of organic systems. Additionally, agricultural Gross Production Value was positively correlated with input-intensity but was neither correlated with the prevalence of GM crops nor organic agriculture (Figure 3; Supplementary Tables S6–S8; Supplementary Figure S17). Practices that can improve Gross Production Value, such as effectively targeted input applications to produce high-quality products, may aid in decreasing poverty among farmers (Ramankutty et al., 2018), which is important to reach the SDG of no poverty (United Nations, 2020).
The number of agricultural researchers per 100,000 farmers in low- to middle-income countries were weakly positively associated with a greater prevalence of organic farming at the 85th quantile, but were not associated with input-intensity or with prevalence of GM crops (Figure 3; Supplementary Tables S6–S8; Supplementary Figure S18). Perhaps increasing access to locally relevant knowledge through research and extension may help farmers more effectively apply inputs, for example, to maximize yields without increased environmental externalities (Ramankutty et al., 2018). Indeed, the SDGs identify improving the productivity of small-scale producers in less-developed nations as a key item to reaching zero hunger by 2030 (United Nations, 2019). Our results indicated that low- to middle-income countries with more agricultural researchers per 100,000 farmers experienced higher yields than countries with fewer researchers (Supplementary Figure S19; 95th quantile: P = 0.039, 50th quantile: P = 0.0009), despite no relationship with input-intensity. Prior work has noted that there is an ongoing shift from using more inputs per area to having greater input efficiency through investments in research and development, but the high cost can slow adoption (Ramankutty et al., 2018). Finally, we note that upward mobility of people into agricultural research and extension positions will likely promote both production and aid in achieving the SDGs of decent work and economic growth.
Altogether, our correlative analyses suggested that countries with the greatest socioeconomic wellbeing had the greatest extent of organic production, followed by high input-intensity. Percent of cropland in GM crops was not related to socioeconomic factors except income inequality (Figure 3; Supplementary Tables S6–S8). We hypothesize that the lack of relationship between GM production and most indicators examined is due to political factors maintaining a low global distribution and devaluing products (Herring, 2008). GM crops may benefit farmers by decreasing overall production costs (Klümper and Qaim, 2014) while reducing inputs and CO2eq emissions (Brookes and Barfoot, 2017; Figure 1C; Supplementary Figure S7). Additionally, our results are correlational, and our finding that organic farming, which has lower yields on average (Seufert et al., 2012; Ponisio et al., 2015), was associated with greater food security is likely because countries with high food security have had a greater transition into organic farming in recent years.
Disentangling Causation and Correlation
Our previously described analyses test socioeconomic and production factors as predictors of agricultural strategies used by countries. That is, we hypothesized that socioeconomic conditions would drive the dominant agricultural strategies employed by countries. However, one could also hypothesize that agricultural strategies may drive feedback into socioeconomic sustainability (Bezner Kerr et al., 2021). For example, based on numerous studies and meta-analyses, organic farming systems better balance multiple sustainability goals at farm and field scales compared to their conventional counterparts (Reganold and Wachter, 2016; Seufert and Ramankutty, 2017).
To assess this limitation, we conducted longitudinal data analyses to examine agricultural strategy changes over time (15 years of data spanning from 2004 to 2018) in relation to a broad socioeconomic indicator, the HDI, which we selected because it was highly correlated with other important sustainability metrics used in our analysis (Supplementary Figures S4, S5). We found no consistent evidence of lags in our lag analysis, hindering our ability to determine causality (Supplementary Table S10; Supplementary Figures S20, S21). Our longitudinal GLMMs, however, suggested clear striation in agricultural strategy use over time by countries with varying HDIs (Figure 4; Supplementary Tables S11, S12). Examining agricultural strategies as predictors of changes in HDI, although statistically significant predictors, showed much less variation and were much less compelling (Supplementary Tables S13, S14; Supplementary Figure S22). Thus, although we cannot exclude agricultural strategies driving the development of countries, we hypothesize that development is more likely on average to drive changes in agricultural strategies. Our longitudinal GLMMs in this direction suggested that across countries there were trends toward greater input efficiency, with decreased synthetic nitrogen inputs over time (Figure 4A; Supplementary Tables S11, S12; Supplementary Figures S23–S34). Countries with the highest HDIs generally used the most synthetic nitrogen, while countries with low HDIs generally had very low synthetic nitrogen inputs. This is consistent with recent environmental policies toward decreased nitrogen inputs (Oenema et al., 2009; Finger, 2012). Our longitudinal GLMMs also suggested that countries with lower HDIs generally have recently been moving toward a greater substitution of conventional crops with GM crops, while countries with greater development have decreased or remained at stable levels (Figure 4B; Supplementary Tables S11, S12; Supplementary Figures S35–S37). Finally, we saw that transitioning into organic agricultural redesign has generally been increasing across countries over the last 15 years, with the greatest adoption in countries with the highest HDIs (Figure 4C; Supplementary Tables S11, S12; Supplementary Figures S38–S49).
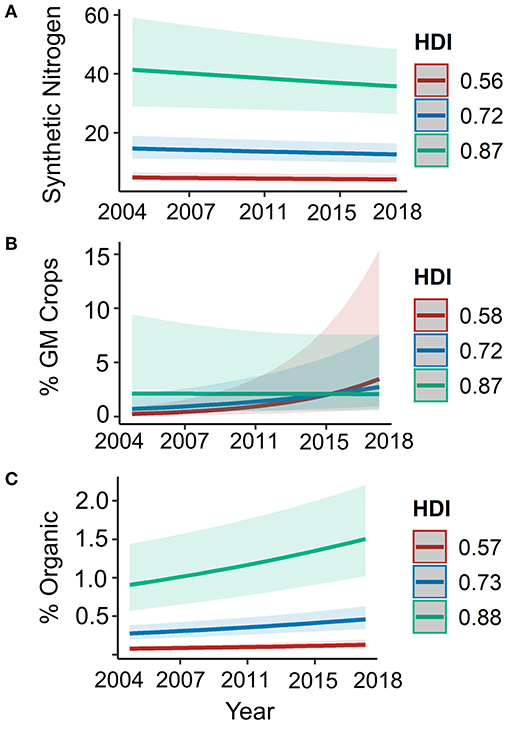
Figure 4. The Human Development Index (HDI) predicts agricultural strategies used. Regressions from longitudinal generalized linear mixed-effects models predict (A) synthetic nitrogen inputs ([tons/1,000 ha]/100), (B) percentage of crops that are genetically modified (GM), and (C) percentage of agricultural production in organic over a 15-year period (2004–2018) at the country level against the HDI. HDI in the figure is divided at the mean value, as well as one standard deviation below and above the mean.
Other Factors Affecting Agricultural Strategies and Sustainability
The level of development of a country may mediate the adoption of farming practices by promoting input availability, access to technology, farm subsidies, and access to extension services or other training (Tilman et al., 2002; Villanueva et al., 2017; Rasmussen et al., 2018; Mkenda et al., 2020). Access to fertilizers and other inputs are often hindered by cost barriers, while climatic conditions in some less-developed countries in tropical zones result in limited access to irrigation water (Rasmussen et al., 2018; Mkenda et al., 2020). It has been suggested that cereal yields in less-developed countries could increase by 45–70% if they had greater access to fertilizers and irrigation (Mueller et al., 2012). In contrast, fertilizers may be overused in some less-developed countries (Supplementary Figure S6), with diminishing returns to yield, underlining the importance of targeted applications (Mueller et al., 2012; Albornoz, 2016).
While access to inputs may limit productivity in some less-developed countries, poor access to extension services and training is likely another barrier to maximizing yields in these countries (Rasmussen et al., 2018; Mkenda et al., 2020). For example, the application of fertilizers and pesticides requires extensive knowledge to deploy effectively across time and space (Mueller et al., 2012; Albornoz, 2016). While an estimated 5.5% of agricultural gross domestic product is spent on agricultural research in highly developed countries, <1% is spent on agricultural research in less-developed countries (Tilman et al., 2002). Most agricultural studies in peer-reviewed literature also occur in developed nations (Rasmussen et al., 2018; Smith et al., 2020); this hinders strategies to improve yields in less-developed and food-insecure regions of the world (Ramankutty et al., 2018; Mkenda et al., 2020). For example, a study conducted in Tanzania found that 70% of farmers had never attended any training related to agriculture and nearly 10% had no access to agricultural information (Mkenda et al., 2020). Farmers in the study noted pesticide labels were primarily written in English, which prevented them from applying pesticides safely and effectively, leading to negative health consequences from practices, such as “taste-testing” (Mkenda et al., 2020). This suggests that the cultivation of knowledge networks in less-developed countries could be the most important step in promoting agricultural production to reach the goals of no poverty, zero hunger, and good health and wellbeing.
Relationships between farming strategies and socioeconomic sustainability may also be affected by consumption patterns and political factors in particular countries (Béné et al., 2019b). For example, greater consumer concern over biodiversity and animal wellbeing in more developed regions, such as Europe, may increase demand for food grown using organic or agri-environmental schemes (Amiot and Bastian, 2015). Additionally, political opposition to GM crops may impact their distribution and the returns farmers receive for their products (Herring, 2008). Furthermore, political factors can disrupt food production and distribution (United Nations General Assembly, 2015). For example, the United Nations Sustainable Development Goals Report in 2019 identified armed conflict as a key driver of food insecurity in sub-Saharan Africa (United Nations, 2019), which we also found to have the lowest food security (Figure 2E; Supplementary Figure S6).
Furthermore, the production of food in a country may not lead to higher food supplies and lower food insecurity, causing breaks in the links between agricultural production and socioeconomic sustainability. That is, food security is complicated by trade, with many wealthy nations purchasing more food than they export, such that the production of sufficient yields in certain countries may not lead to food security (Béné et al., 2019b). Even within particular countries, income inequality can cause high-quality food to be more readily available to affluent individuals at the expense of low-income populations (Béné et al., 2019b). For middle- to high-income countries with considerable income inequality, more equitable income distributions could also increase food security.
Finally, there are likely several other factors and context-specific considerations influencing the extent of agricultural strategies that are either outside of the scope of this study or for which data are not readily available on a global scale (e.g., subsidies, market conditions and demand, environmental suitability for agriculture, and farmer demographics and perceptions of agricultural practices; Ahnström et al., 2009; Villanueva et al., 2017). Additionally, landscape context can mediate the relative benefits and shortfalls of organic or other diversified forms of agriculture (Smith et al., 2020, 2021). However, in light of our findings, further research specifically considering other factors might help provide better context into the complicated, dynamic nature of the factors influencing agricultural strategies, and the socioeconomic drivers and impacts of those strategies (Awokuse and Xie, 2015). This, in turn, could influence the types of sustainable agricultural strategies adopted (Smith et al., 2021).
Conclusion
Our correlative analyses suggest that countries that are most on track to meeting the United Nations SDGs of no poverty, zero hunger, good health and wellbeing, quality education, decent work, and economic growth, and reduced inequalities are currently practicing the highest extents of organic agriculture. In other words, organic production occurs in countries that score high across a variety of sustainability indicators. Countries with the highest agricultural input-intensities were also associated with the same human wellbeing SDGs but to a lesser degree. However, countries with the highest input-intensities also were the least on track to reach climate action goals, while countries with the current highest prevalence of GM production had reduced agricultural emissions. In contrast to the wide range of positive socioeconomic factors that were predictive of countries having greater extents of organic production and agricultural input-intensity, the prevalence of GM crops was scarcely related to socioeconomic practices except that it was correlated with reduced income equality. Interestingly, while certified organic agriculture excludes GM crops, we found no association between these two farming systems, suggesting that ecological intensification via organic methods and agricultural intensification via technology-based tools like GM crops can exist side-by-side within countries. Given the costs and benefits of different agricultural strategies (Figures 1, 3), policymakers could strategically target uptake in different regions, depending on context-specific needs.
Our three farming strategies examined—input-intensive, GM cropping, and organic farming systems—could fit within the three stages proposed by Pretty et al. (2018) in transitioning to sustainable food systems: efficiency (lower input-intensity due to better application), substitution (GM crops), and redesign (organic agriculture). Efficiency focuses on improving the use of resources in existing systems. For example, farmers could better target fertilizers, pesticides, and water inputs to reduce use and minimize externalities. Substitution replaces existing practices, such as classically or genetically breeding new crop varieties, that are more tolerant to drought or resistant to pests. Finally, redesign fundamentally restructures agroecosystems to harness ecosystem services to sustainably produce food and fiber, such as conversion to organic production or conservation agriculture. Redesign is perhaps the biggest challenge of the three because it requires greater knowledge and capacity and brings the most transformative changes across farming systems (Pretty et al., 2018).
Our correlative analyses suggest that countries most on track with meeting the United Nations SDGs are currently having the highest transitions into agricultural redesign, using organic agriculture as the case study here. However, we emphasize that correlation is not necessarily causation. Although practiced in 190 countries, organic agriculture has only a 1.6% share of total agricultural land and, while gaining ground, is not being widely practiced outside of Europe, Australia, and, to a lesser extent, the United States (Willer et al., 2022; Figure 2C; Supplementary Figure S6). Therefore, considerably more widespread deployment of organic agriculture, or at least adoption of some of its agroecological practices, may be needed to have a stronger effect on global environmental sustainability.
Our results also suggest that while developed nations generally experienced higher food production, food security, and socioeconomic wellbeing, they also had the most negative environmental impacts. Conversely, less-developed nations generally had lower environmental impacts per area of production but experienced higher food insecurity and lower socioeconomic wellbeing. Overall, our study suggests that developed nations could have the greatest positive impact on sustainability by working toward broader implementation of environmentally friendly farming practices, including farmer subsidies to encourage such practices (Tilman et al., 2002; Ahnström et al., 2009). Conversely, less-developed nations may need to focus on decreasing implementation barriers of higher-yielding agricultural practices (Ramankutty et al., 2018). Efforts to develop and implement sustainable food systems that produce sufficient food, minimize environmental harms, and improve capital are core aspects of the SDGs (Pretty et al., 2018; United Nations, 2019, 2020). Simultaneous advancement in production, environmental quality, economic viability, and social wellbeing is difficult, and there will be no panacea for achieving the SDGs. However, increasing input-intensity to achieve higher yields in countries with insufficient production and implementing organic agriculture for environmental and economic benefits are two tools that policy makers can target, depending on context-specific needs.
Data Availability Statement
The original contributions presented in the study are included in the article/Supplementary Material, further inquiries can be directed to the corresponding author/s. Previously published data were used for this work fully downloadable from http://www.fao.org/faostat/en/#data; http://hdr.undp.org/en/data; https://data.worldbank.org/indicator/SI.POV.GINI. GM crop data are from Brookes and Barfoot (2017).
Author Contributions
OS and TN analyzed the data. OS created figures and led the writing of the manuscript. DJ, BL, RO, AD, CR, AEC, ALC, CA, AM, JR, DC, and TN contributed sections. All authors collected the data with the largest contribution from OS, DJ, and BL. All authors conceived the work and designed the study. All authors contributed to manuscript revisions, with the greatest contribution from JR, and approved the submission.
Funding
The page charges were funded by start-up money awarded to Tobin Northfield from Washington State University Department of Entomology.
Conflict of Interest
The authors declare that the research was conducted in the absence of any commercial or financial relationships that could be construed as a potential conflict of interest.
Publisher's Note
All claims expressed in this article are solely those of the authors and do not necessarily represent those of their affiliated organizations, or those of the publisher, the editors and the reviewers. Any product that may be evaluated in this article, or claim that may be made by its manufacturer, is not guaranteed or endorsed by the publisher.
Acknowledgments
B. Crusher assisted with project management. M. Jones and J. Hepler contributed to project development. G. Brookes from PG Economics provided the GM crop data. The Statistical Consulting Center at the University of Georgia provided feedback on the longitudinal analyses.
Supplementary Material
The Supplementary Material for this article can be found online at: https://www.frontiersin.org/articles/10.3389/fsufs.2022.882503/full#supplementary-material
References
Ahnström, J., Höckert, J., Bergeå, H. L., Francis, C. A., Skelton, P., and Hallgren, L. (2009). Farmers and nature conservation: what is known about attitudes, context factors and actions affecting conservation? Renew. Agric. Food Syst. 24, 38–47. doi: 10.1017/S1742170508002391
Albornoz, F. (2016). Crop responses to nitrogen overfertilization: a review. Sci. Hortic. 205, 79–83. doi: 10.1016/j.scienta.2016.04.026
Amiot, C. E., and Bastian, B. (2015). Toward a psychology of human - animal relations. Psychol. Bull. 141, 6–47. doi: 10.1037/a0038147
Awokuse, T. O., and Xie, R. (2015). Does agriculture really matter for economic growth in developing countries? Can. J. Agric. Econ. 63, 77–99. doi: 10.1111/cjag.12038
Balmford, A., Amano, T., Bartlett, H., Chadwick, D., Collins, A., Edwards, D., et al. (2018). The environmental costs and benefits of high yield farming. Nat. Sustain. 1, 477–485. doi: 10.1038/s41893-018-0138-5
Béné, C., Prager, S. D., Achicanoy, H. A. E., Toro, P. A., Lamotte, L., Bonilla Cedrez, C., et al. (2019b). Understanding food systems drivers: a critical review of the literature. Glob. Food Sec. 23, 149–159. doi: 10.1016/j.gfs.2019.04.009
Béné, C., Prager, S. D., Achicanoy, H. A. E., Toro, P. A., Lamotte, L., Bonilla, C., et al. (2019a). Global map and indicators of food system sustainability. Sci. Data 6, 1–15. doi: 10.1038/s41597-019-0301-5
Bezner Kerr, R., Madsen, S., Stuber, M., Liebert, J., Enloe, S., Borghino, N., et al. (2021). Can agroecology improve food security and nutrition? A review. Glob. Food Sec. 29:100540. doi: 10.1016/j.gfs.2021.100540
Brookes, G., and Barfoot, P. (2017). Environmental impacts of genetically modified (GM) crop use 1996 - 2015: impacts on pesticide use and carbon emissions. GM Crops Food 8, 117–147. doi: 10.1080/21645698.2017.1309490
Brooks, M. E., Kristensen, K., van Benthem, K. J., Magnusson, A., Berg, C. W., Nielsen, A., et al. (2017). glmmTMB balances speed and flexibility among packages for zero-inflated generalized linear mixed modeling. R J. 9, 378–400. doi: 10.32614/RJ-2017-066
Crowder, D. W., and Reganold, J. P. (2015). Financial competitiveness of organic agriculture on a global scale. Proc. Natl. Acad. Sci. U.S.A. 112, 7611–7616. doi: 10.1073/pnas.1423674112
Dimitri, C., and Greene, C. (2002). Recent Growth Patterns in the U.S. Organic Foods Market. Washington, DC. Available online at: https://www.ers.usda.gov/webdocs/publications/42455/12915_aib777_1_.pdf?v=7197.6
Fernandez-Cornejo, J., Wechsler, S., Livingston, M., and Mitchell, L. (2014). Genetically Engineered Crops in the United States. USDA-ERS, Washington D.C., 162. doi: 10.2139/ssrn.2503388
Finger, R. (2012). Nitrogen use and the effects of nitrogen taxation under consideration of production and price risks. Agric. Syst. 107, 13–20. doi: 10.1016/j.agsy.2011.12.001
Gattinger, A., Muller, A., Haeni, M., Skinner, C., Fliessbach, A., Buchmann, N., et al. (2012). Enhanced top soil carbon stocks under organic farming. Proc. Natl. Acad. Sci. U.S.A. 109, 18226–18231. doi: 10.1073/pnas.1209429109
Herring, R. J. (2008). Opposition to transgenic technologies: ideology, interests and collective action frames. Nat. Rev. Genet. 9, 458–463. doi: 10.1038/nrg2338
Johnson, C. N., and Vanderwal, J. (2009). Evidence that dingoes limit abundance of a mesopredator in eastern Australian forests. J. Appl. Ecol. 46, 641–646. doi: 10.1111/j.1365-2664.2009.01650.x
Karp, D. S., Chaplin-kramer, R., Meehan, T. D., Martin, E. A., Declerck, F., Grab, H., et al. (2018). Crop pests and predators exhibit inconsistent responses to surrounding landscape composition. Proc. Natl. Acad. Sci. U.S.A. 115, 7863–7870. doi: 10.1073/pnas.1800042115
Kirchmann, H. (2019). Why organic farming is not the way forward. Outlook Agric. 48, 22–27. doi: 10.1177/0030727019831702
Klümper, W., and Qaim, M. (2014). A meta-analysis of the impacts of genetically modified crops. PLoS ONE 9:e111629. doi: 10.1371/journal.pone.0111629
Koenker, R. (2019). quantreg: Quantile Regression. Available online at: https://cran.r-project.org/package=quantreg
Kremen, C. (2015). Reframing the land-sparing/land-sharing debate for biodiversity conservation. Ann. N.Y. Acad. Sci. 1355, 52–76. doi: 10.1111/nyas.12845
Mkenda, P. A., Ndakidemi, P. A., Stevenson, P. C., Sarah, E. J., Darbyshire, I., Belmain, S. R., et al. (2020). Knowledge gaps among smallholder farmers hinder adoption of conservation biological control. Biocontrol Sci. Technol. 30, 1–22. doi: 10.1080/09583157.2019.1707169
Mueller, N. D., Gerber, J. S., Johnston, M., Ray, D. K., Ramankutty, N., and Foley, J. A. (2012). Closing yield gaps through nutrient and water management. Nature 490, 254–257. doi: 10.1038/nature11420
National Research Counsil (2010). Toward Sustainable Agricultural Systems in the 21st Century. National Research Counsil. Available online at: https://www.nap.edu/catalog/12832/toward-sustainable-agricultural-systems-in-the-21st-century
Oenema, O., Witzke, H. P., Klimont, Z., Lesschen, J. P., and Velthof, G. L. (2009). Integrated assessment of promising measures to decrease nitrogen losses from agriculture in EU-27. Agric. Ecosyst. Environ. 133, 280–2800. doi: 10.1016/j.agee.2009.04.025
Ponisio, L. C., M'Gonigle, L. K., Mace, K. C., Palomino, J., de Valpine, P., and Kremen, C. (2015). Diversification practices reduce organic to conventional yield gap. Proc. R. Soc. B Biol. Sci. 282:20141396. doi: 10.1098/rspb.2014.1396
Pretty, J., Benton, T. G., Bharucha, Z. P., Dicks, L. V., Flora, C. B., Godfray, H. C. J., et al. (2018). Global assessment of agricultural system redesign for sustainable intensification. Nat. Sustain. 1, 441–446. doi: 10.1038/s41893-018-0114-0
R Core Development Team (2020). R: A Language and Envrionment for Statistical Computing. R Core Development Team.
Ramankutty, N., Mehrabi, Z., Waha, K., Jarvis, L., Kremen, C., Herrero, M., et al. (2018). Trends in global agricultural land use: implications for environmental health and food security. Annu. Rev. Plant Biol. 69, 798–815. doi: 10.1146/annurev-arplant-042817-040256
Rasmussen, L. V., Coolsaet, B., Martin, A., Mertz, O., Pascual, U., Corbera, E., et al. (2018). Social-ecological outcomes of agricultural intensification. Nat. Sustain. 1, 275–282. doi: 10.1038/s41893-018-0070-8
Reganold, J. P., Jackson-Smith, D., Batie, S. S., Harwood, R. R., Kornegay, J. L., Bucks, D., et al. (2011). Transforming U.S. agriculture. Science 332, 670–671. doi: 10.1126/science.1202462
Reganold, J. P., and Wachter, J. M. (2016). Organic agriculture in the twenty-first century. Nat. Plants 2, 1–8. doi: 10.1038/nplants.2015.221
Rodale Institute (2020). Regenerative Organic Agriculture and Climate Change: A Down-to-Earth Solution to Global Warming. Rodale Institute.
Scharf, F. S., Juanes, F., and Sutherland, M. (1998). Inferring ecological relationships from the edges of scatter diagrams: comparison of regression techniques. Ecology 79, 448–460. doi: 10.1890/0012-9658(1998)0790448:IERFTE2.0.CO;2
Seufert, V., and Ramankutty, N. (2017). Many shades of gray-the context-dependent performance of organic agriculture. Sci. Adv. 3:e1602638. doi: 10.1126/sciadv.1602638
Seufert, V., Ramankutty, N., and Foley, J. A. (2012). Comparing the yields of organic and conventional agriculture. Nature 485, 229–232. doi: 10.1038/nature11069
Shackleton, N. J. (2000). The 100,000-year ice-age cycle identified and found to lag temperature, carbon dioxide, and orbital eccentricity. Science 289, 1897–1902. doi: 10.1126/science.289.5486.1897
Smith, O. M., Cohen, A. L., Reganold, J. P., Jones, M. S., Orpet, R. J., Taylor, J. M., et al. (2020). Landscape context affects the sustainability of organic farming systems. Proc. Natl. Acad. Sci. U.S.A. 117, 2870–2878. doi: 10.1073/pnas.1906909117
Smith, O. M., Taylor, J. M., Echeverri, A., Northfield, T., Cornell, K. A., Jones, M. S., et al. (2021). Big wheel keep on turnin': linking grower attitudes, farm management, and delivery of avian ecosystem services. Biol. Conserv. 254:108970. doi: 10.1016/j.biocon.2021.108970
Snyder, C. S., Bruulsema, T. W., Jensen, T. L., and Fixen, P. E. (2009). Review of greenhouse gas emissions from crop production systems and fertilizer management effects. Agric. Ecosyst. Environ. 133, 247–266. doi: 10.1016/j.agee.2009.04.021
Taheri, F., Azadi, H., and Haese, M. D. (2017). A world without hunger: organic or GM crops? Sustainability 9, 1–17. doi: 10.3390/su9040580
Tilman, D., Cassman, K. G., Matson, P. A., Naylor, R., and Polasky, S. (2002). Agricultural sustainability and intensive production practices. Nature 418:671. doi: 10.1038/nature01014
United Nations (2019). The Sustainable Development Goals Report 2019. United Nations. Available online at: https://unstats.un.org/sdgs/report/2019/The-Sustainable-Development-Goals-Report-2019.pdf. doi: 10.18356/5d04ad97-en
United Nations (2020). The Sustainable Development Goals Report 2020. United Nations. Available online at: https://unstats.un.org/sdgs/report/2020/The-Sustainable-Development-Goals-Report-2020.pdf
United Nations General Assembly (2015). Transforming Our World: The 2030 Agenda for Sustainable Development. United Nations General Assembly. Available online at: https://www.refworld.org/docid/57b6e3e44.html
Vanwey, L. K., Spera, S., Sa, R., De M.ahr, D., and Mustard, J. F. (2013). Socioeconomic development and agricultural intensification in Mato Grosso. Philos. Trans. R. Soc. B Biol. Sci. 368:20120168. doi: 10.1098/rstb.2012.0168
Villanueva, A. J., Rodriguez-Entrena, M., Arriaza, M., and Gomez-Limon, J. A. (2017). Heterogeneity of farmers' preferences towards agri-environmental schemes across different agricultural subsystems. J. Environ. Plan Manage. 60, 684–707. doi: 10.1080/09640568.2016.1168289
West, P. C., Gerber, J. S., Engstrom, P. M., Mueller, N. D., Brauman, K. A., Carlson, K. M., et al. (2014). Leverage points for improving global food security and the environment. Science 345, 325–328. doi: 10.1126/science.1246067
Wickson, F., Binimelis, R., and Herrero, A. (2016). Should organic agriculture maintain its opposition to GM? New techniques writing the same old story. Sustainability 8, 1–19. doi: 10.3390/su8111105
Keywords: agriculture, input-intensive, genetically modified crops, organic agriculture, social-ecological systems, Sustainable Development Goals
Citation: Smith OM, Jocson DMI, Lee BW, Orpet RJ, Taylor JM, Davis AG, Rieser CJ, Clarke AE, Cohen AL, Hayes AM, Auth CA, Bergeron PE, Marshall AT, Reganold JP, Crowder DW and Northfield TD (2022) Identifying Farming Strategies Associated With Achieving Global Agricultural Sustainability. Front. Sustain. Food Syst. 6:882503. doi: 10.3389/fsufs.2022.882503
Received: 23 February 2022; Accepted: 06 June 2022;
Published: 07 July 2022.
Edited by:
Ademola Braimoh, World Bank Group, United StatesReviewed by:
Cornelia Butler Flora, Iowa State University, United StatesTherese Mwatitha Gondwe, Independent Researcher, Lilongwe, Malawi
Copyright © 2022 Smith, Jocson, Lee, Orpet, Taylor, Davis, Rieser, Clarke, Cohen, Hayes, Auth, Bergeron, Marshall, Reganold, Crowder and Northfield. This is an open-access article distributed under the terms of the Creative Commons Attribution License (CC BY). The use, distribution or reproduction in other forums is permitted, provided the original author(s) and the copyright owner(s) are credited and that the original publication in this journal is cited, in accordance with accepted academic practice. No use, distribution or reproduction is permitted which does not comply with these terms.
*Correspondence: Olivia M. Smith, c21pdGhvMTdAbXN1LmVkdQ==; b2xpdmlhLm0uc21pdGhAd3N1LmVkdQ==