 Denise Adelaide Gomes Elejalde1*
 André Brugnara Soares2
 José Donizetti de Lima3
 Regis Luis Missio2
 Tangriani Simioni Assmann2
 Wilson Henrique Tatto1
 Felipe Luiz Chiamulera Deifeld1Marcos Antônio de Bortolli1Angela Bernardon1Flávia Levinski-Huf1Marcieli Maccari4Pablo Antonio Beltrán Barriga5Anderson Clayton Rhoden1
- 1Postgraduate Program in Agronomy, Federal Technological University of Paraná (UTFPR), Pato Branco, Brazil
- 2Department of Agricultural Sciences, Federal Technological University of Paraná (UTFPR), Pato Branco, Brazil
- 3Department of Agronomy, Postgraduate Program in Production and Systems Engineering, Federal Technological University of Paraná (UTFPR), Pato Branco, Brazil
- 4University of Western Santa Catarina (UNOESC), Joaçaba, Xanxerê – SC, Brazil
- 5University National of Altiplano, Puno, Peru
Integrated crop-livestock systems (ICLS) are complex production strategies whose main components are soil, plant, and animal. Several studies addressed the interaction among them and conclude on the technical feasibility of these systems, but few studies assess their economic feasibility. The objective of this work was to analyze the economic feasibility of an ICLS, in which nitrogen was applied on the crop phase or onto the pasture phase, combined with two grazing intensities. The study was carried out on a private farm in the municipality of Abelardo Luz—SC, between October 2012 and April 2018. The experimental design was randomized blocks with three replications. The treatments were arranged in a 2x2 factorial scheme, with two sward heights (high and low) and two times of N-fertilization application, or on the cool-season pasture tillering phase either onto cash crop (200 kg of N ha−1 in a single dose). Crop implementation and maintenance costs were surveyed, followed by crop and livestock production calculations, zootechnical indices, and the revenue of each phase (pasture or grain crop) for the entire system. The cash flow analysis was carried out, generating economic indicators of the three dimensions of the expanded multi-index methodology (MMA) for the system and the treatments. In this study, pasture management with low sward canopy height provided the highest net gains per hectare and per hectare/year, regardless of the nitrogen application time. The use of the ICLS is economically viable, regardless of grazing intensities and nitrogen application times.
1. Introduction
Integrated crop-livestock systems (ICLS) are as old as agriculture itself (Carvalho et al., 2014). The FAO—Food Agriculture Organization of the United Nations (2015) defines integrated crop-livestock systems as intentional integration that reflects a synergistic relationship between the components of crops, livestock, crops, and/or trees, which, when properly managed, results in improvements in the social community, economic and environmental sustainability, as well as improved farmers' livelihoods. Area expansion for food production in many regions of the world is no longer possible. According to FAO—Food Agriculture Organization of the United Nations (2010), Brazil is one of the main countries with available arable land, expanding its role as an important global food supplier. The country's potential as a food provider for the growing world population, combined with the beneficial characteristics of the ICLS, places it as the main alternative to meet this demand in a sustainable way FAO—Food Agriculture Organization of the United Nations (2010), without the need to open new areas for the production of foods. “However, the adoption of the system is small, in part due to the greater complexity of the system and the need for high investments in the acquisition of machines and implements” (Vilela et al., 2001). After 20 years, adherence is still low, and it is more common for farmers to start using ICLS than ranchers. Probably, the motivation is the greater ease of adhesion due to the demand for machinery that farmers already own on their properties. Vilela et al. (2001) indicated that a partnership between grain producers and ranchers would be an alternative to promote the ICLS, thus expanding the area cultivated with grains and increasing animal production without the need to open new areas.
Given the importance of ICLS for human and animal food and their contribution to the control of global warming, there is an increasing need for research on the subject. In a recent study on the adoption of ICLS in the state of São Paulo (Vinholis et al., 2020), EMBRAPA interviewed 175 producers. Of these, 85 do not adopt ICLS, 66 integrate agriculture and livestock, and 24 integrate livestock and forestry. According to the data collected in this research, 85% of the producers that did not adopt ICLS are cattle ranchers. Among those who integrate agriculture and livestock, 56% consider themselves ranchers and 44% farmers. Among those who integrate livestock and forestry, 79% consider themselves ranchers and 21% farmers. When asked about the availability of technical information in the region about the ICLS, 39% of those who have adopted the integration replied that it is unavailable, while 60% of those who have not adopted adhered to it. Regarding the availability of information on economic valuation, 36% of producers who have adopted the integration say that there is not and 64% of those who have not adhered think that it is not available.
One of the biggest difficulties in rural areas is for the owner to manage the property as a company, considering all the inflows and outflows of money and making projections for future crops. This entrepreneurial vision of the rural business, which does not depend on the size, is the differential of many properties, having difficulties in measuring costs and revenues. In the case of ICLS, there are many scientific reports on technical and productive feasibility, but few are those that address economic feasibility (Vinholis et al., 2021), which is one of the reasons that keep some farmers from joining the system. Different research groups in Brazil have been dedicated to investigating different lines of research related to the ICLS. However, the economic viability of the system is still little explored. As investment is only valid if there is an economic return, the objective of this study is to verify the economic viability of an ICLS in which there were different nitrogen fertilization strategies, applied only in the crop or in the pasture (system fertilization), combined with grazing intensities in the pasture phase.
2. Material and methods
The Soil-Plant-Animal Interaction Group (GISPA) from UTFPR Campus Pato Branco carried out a series of studies in an experiment for 5 years in a rural property in Abelardo Luz—SC, Southern Brazil (26°31' S, 51°35' W, 850 m high) in 20 hectares submitted to the ICLS using no-tillage since 2012 (Table 1). In total, during the 5 years of studying were defended nine doctoral theses and five master's dissertations on different topics, but always using the same treatments. This work brings together all the crops studied, presenting all the variables per crop (livestock—L and agriculture—A).
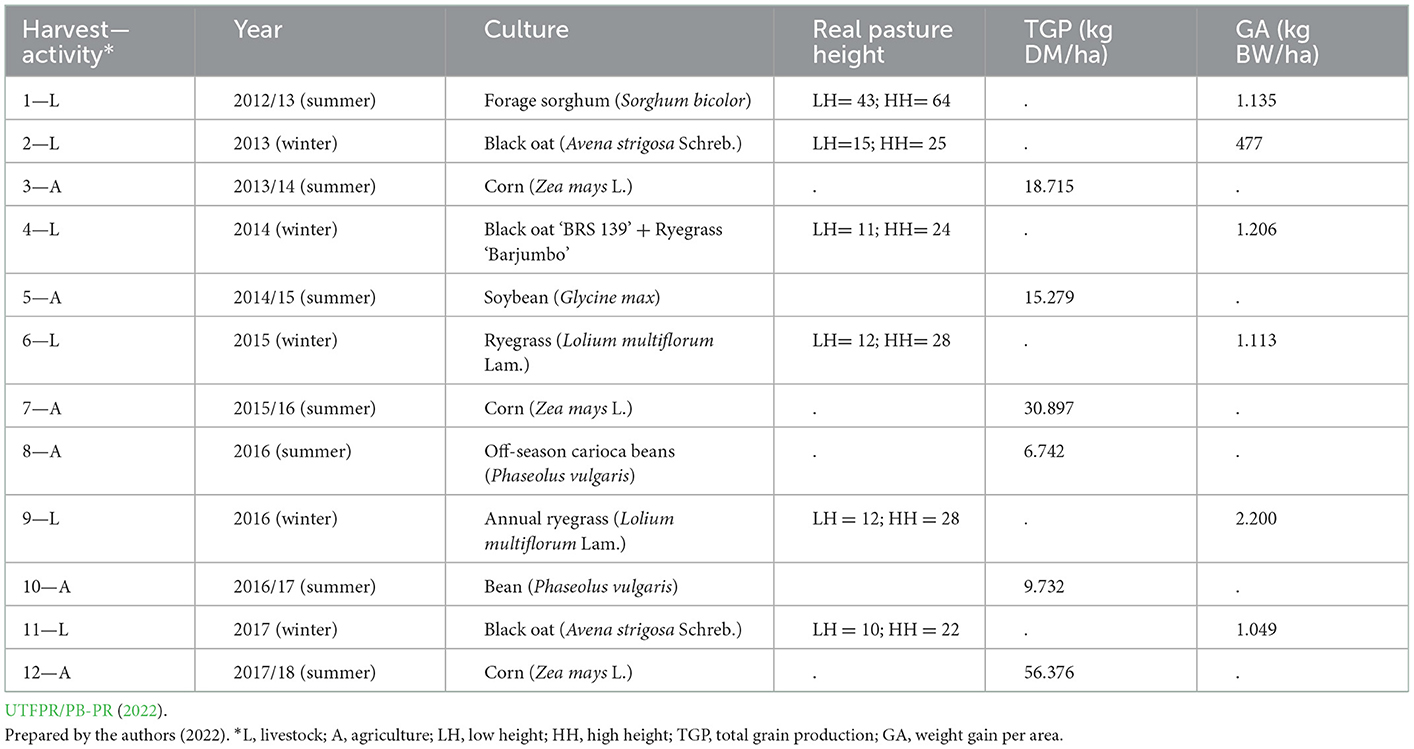
Table 1. Background of cultures used during all years/periods since the implementation of the experiment in Abelardo Luz—SC.
Abelardo Luz is one of the main grain producers in the state of Santa Catarina, with an emphasis on soybean production. The climate of the region is classified as Cfb (humid mesothermal subtropical) with hot summers and cold winters according to the Köppen classification. The average annual precipitation is 2.200 mm, with an average annual temperature of 17°C. The soil is classified as Typical Distroferric Latosol, very clayey texture, with a prominent Horizon A.
The experimental design was randomized blocks with three replications in a 2 × 2 factorial scheme, with two pasture heights—high (HH) and low height (LH)—and two times of topdressing nitrogen application (NP)—when the topdressing nitrogen was applied onto pasture and NG when nitrogen application occurred onto grain crops (agriculture). The application with 200 kg of N ha−1 is fertilization at the system level, being applied in a single dosage (in the form of urea −45% N) in livestock or agriculture, always making the total dose of N per ha over the years the same, only changing the time of application.
During livestock periods, three test animals were used per experimental unit (paddock) plus a variable number of put-and-take animals. The animals were kept in the continuous stocking method with a variable stocking rate (Mott and Lucas, 1952), in which the regulator animals entered and left the paddocks according to the need to adjust the desired pasture height. The height of the pasture varied according to the species used and was chosen based on the literature (Carvalho et al., 2010; Fonseca et al., 2012), choosing a more limiting height and a milder one. The actual heights reached in the pastures are shown in Table 1. Every 15 days, the height of the pasture was measured with a ruler graduated in centimeters at 30 points of the experimental units, based on the average height and whether or not the animal load was adjusted. Animals were weighed every 28 days to determine animal performance variables. The average daily gain (ADG) was obtained through the difference between the final and initial average weights of the test animals, divided by the number of days between the animals' weighing. The stocking rate (SR) consists of the total kg of body weight maintained in the experimental unit during the period. To calculate the weight gain per area (GA), the SR was divided by the average body weight of the test animals and multiplied by their ADG.
During periods of the grain harvest, the species sown followed the planning of the property, which took into account market factors, price of inputs and products, and the need to rotate crops, avoiding monoculture so that all the agronomic advantages of this technique were achieved. The technical indications for no-tillage were followed, as well as specific phytosanitary control for cultivated species. Grain yields and animal production per area in the different harvests are shown in Table 1, which contains the forage and grain species used.
The methodology used to calculate production costs was based on the Institute of Agricultural Economics (IAE) model, which uses the description by Matsunaga et al. (1976) for operating costs. Fixed costs were considered, that is, those that are independent of production: the opportunity cost of land, the depreciation per hectare of machines and facilities, and the opportunity cost of the capital invested in depreciation, so the sum of these consisted of the fixed cost. For the opportunity cost of land use, the lease value of land for soybeans (R$/ha) at the time of each activity was considered with values consulted in CEPA/EPAGRI—Center Socioeconomics and Agricultural Planning (2020). Depreciation of machines and installations is considered the time taken to carry out mechanized operations. The opportunity cost of capital invested in depreciation was calculated by multiplying the depreciation per hectare by the average interest rate on savings and the days of the use of the area. For livestock, grazing days plus 45 days for pasture establishment were considered. The data presented are expressed in national currency (Real), but the values given below are the average values of the dollar exchange rate during the periods of each harvest. Values in order of crops 1–12 are, respectively, US$2.02, US$2.18, US$2.31, US$2.32, US$2.81, US$3.28, US$3.90, US$3.82, US$3.32, US$3.22, US$3.20, and US$3.24.
Variable costs vary according to the production level and are divided into the effective operating cost (EOC) and total operating cost (TOC). For livestock, the following costs were considered for the effective operational cost: the cost of acquiring the animals (R$/animal/ha—considering the value of a calf weighing about 200 kg at the time of each activity according to CEPA/EPAGRI—Center Socioeconomics and Agricultural Planning, 2020) and the cost of labor (R$/animal/ha—considering that a worker takes care of 400 animals). Also, the cost of sanitary treatment of animals (R$/animal/ha), cost of pasture inputs (R$/ha), fuel cost for mechanized operations (R$/ha), and the opportunity cost of invested capital (R$/ha) were considered. The sum of these costs refers to the effective operating cost (EOC). Total operating cost (TOC) is the sum of the EOC and the opportunity cost of invested capital. The opportunity cost of the capital invested is the EOC multiplied by the daily interest rate and the grazing days plus 45 days to establish the pasture. For agriculture, the following costs were considered for EOC and TOC: cost with labor (R$/ha—considering the hours worked with mechanized operations), cost with inputs for agriculture (R$/ha), cost with fuel for mechanized operations (R$/ha), and the opportunity cost of invested capital (R$/ha). Total cost (TC) consists of TOC plus fixed cost.
Livestock and agriculture revenue refers to the sale of cattle and grains, respectively. Gross revenue (GR) for livestock was calculated by the final body weight of the animals multiplied by 55% of carcass yield, divided by 15 (1 @ = 15 kg). The result is multiplied by the sale price/at of the animal product at the time of the activity and by the number of animals per hectare. The gross revenue for agriculture was calculated by the amount produced in kg/ha multiplied by the sales value of the product in R$/kg. Sales values were consulted at the Center for Advanced Studies in Applied Economics—CEPEA/ESALQ—Center Socioeconomics and Agricultural Planning (2020), according to the time of sale of animals and grains (end of each harvest).
To verify the economic viability, the expanded multi-index methodology (EMIM) proposed by Lima et al. (2015), with a deterministic approach considering the dimensions of return, risk, and sensitivity, was used. The economic viability indicators used and their formulas are presented in Table 2.
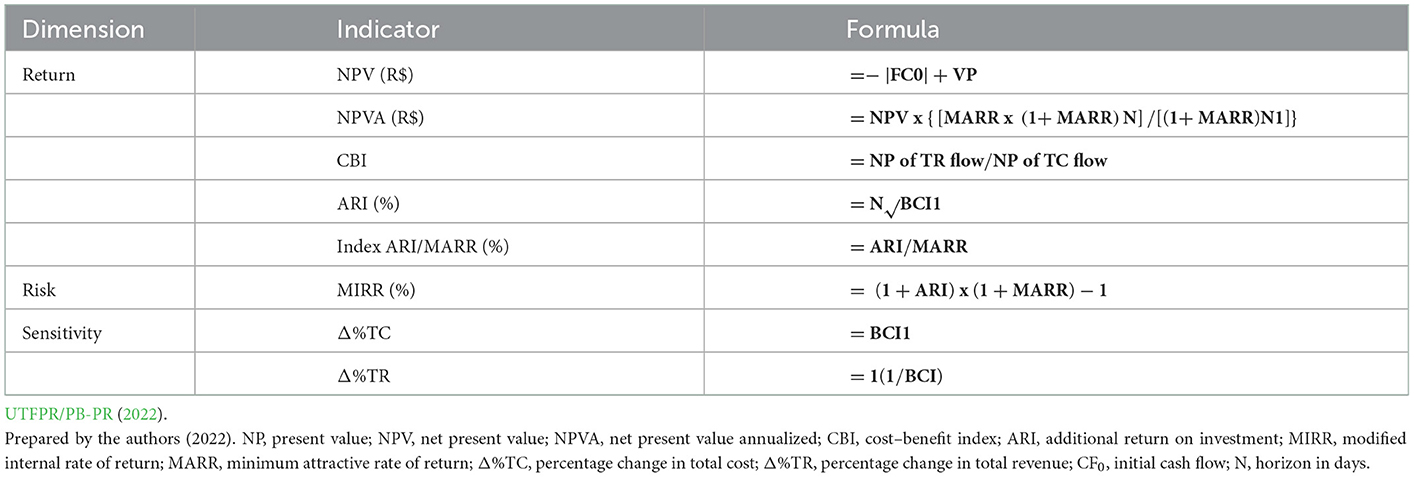
Table 2. Return, risk, and sensitivity indicators used at work.
Cash flow (CF) is the difference between gross revenue and total cost. CF was decapitalized according to a daily minimum attractive rate of return (MARR) of 0.026% and the number of days of activity. This conversion was necessary to adjust different times between activities. Magnabosco et al. (2009) used a MARR of 10% per year (0.026% per day) to assess a horizon of 1,186 days in the ICLS. From the CF and applying the EMIM, the net present value (NPV) was calculated, which indicates the total net gain in 1,820 days, that is, in ~5.5 years (period of duration of the experiment). The net present value annualized (NPVA) was also calculated, which indicates the net gain per year, in addition to the annual MARR of 10%. In addition, indicators were generated: the cost–benefit index (CBI), additional return on investment (ARI), ARI/MARR index, and modified internal rate of return (MIRR).
3. Results
Table 3 shows the cost and total revenue, and CF of the ICLS in each activity carried out during 1,820 days (~5.5 years). In the same way, the TC, TR, and CF are decapitalized to consider the value of money over time. Economic viability indicators are also presented. Through the decapitalized CF, it appears that the total costs in livestock were higher than those in agriculture, on average R$ 4,219.26 and R$ 1,249.11, respectively.
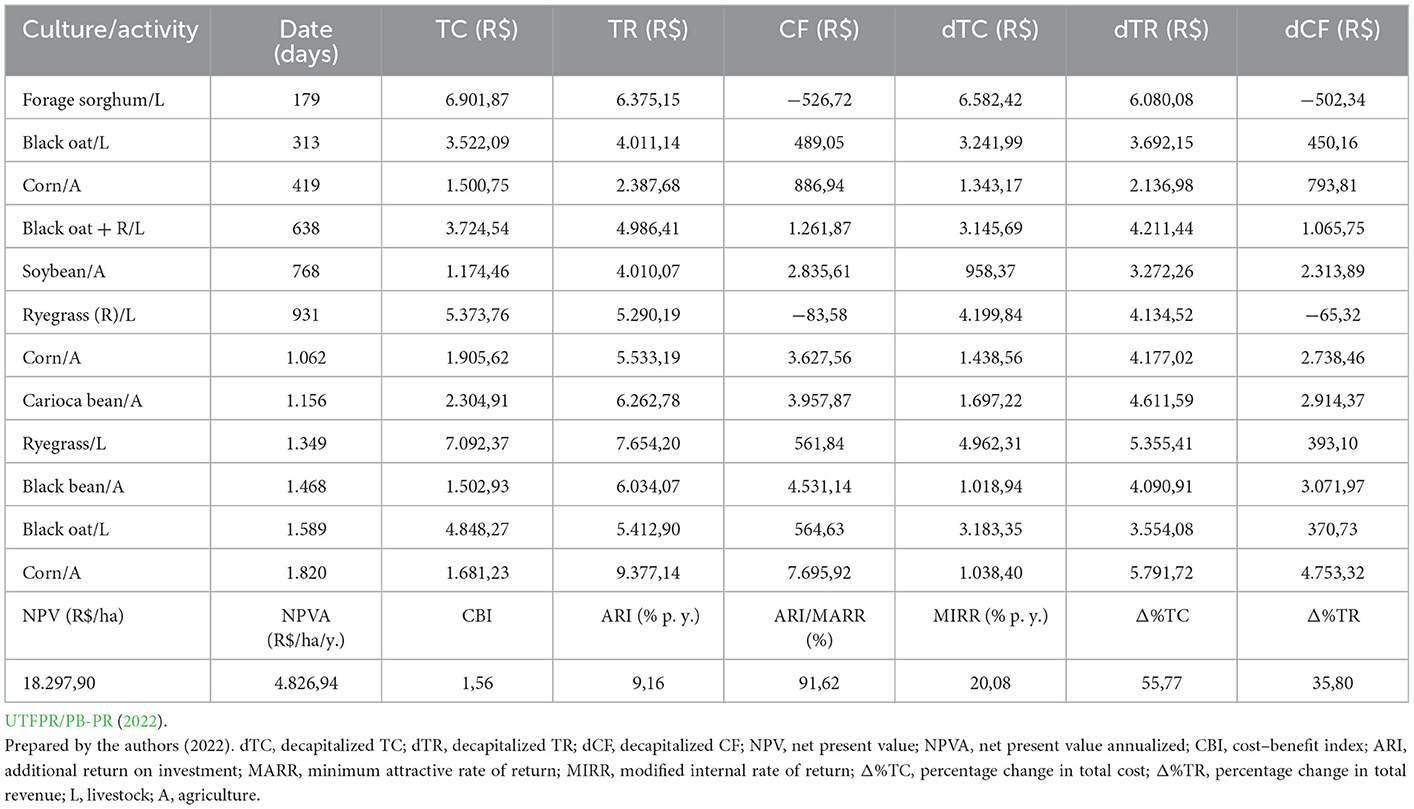
Table 3. Total cost (TC), total revenue (TR), cash flow (CF), and ICLS return, risk, and sensitivity indicators for 5.5 years.
The total revenue of agriculture and livestock had an average of R$ 5,600.82 and R$ 5,621.66, respectively. The highest TR was observed in the corn crop in the year 2017/2018. The CF was negative in two moments in livestock (1st and 6th seasons), in which a TC greater than the TR was observed.
As for the economic viability indicators, presented in Table 3, the NPV and NPVA can be observed, with the total net gain at the end of about 5.5 years of R$ 18,297.90 and R$ 4,826.94 per year per ha, respectively. When evaluating and ranking investment projects, priority should be given to the NPV and NPVA results, which indicate the total net and annual gains. The other indicators are relative; therefore, although relevant, they should not be prioritized but considered complementary in decision-making. The CBI indicates the profitability, in which the value of 1.56 was obtained, indicating that, for every R$1.00 invested at the end of 5.5 years, there was a return of R$1.56 in current monetary values. The MIRR for the ICLS was 20.08% per year. As for the percentage change in total cost (Δ%TC) and total revenue (Δ%TR), it was observed that the total cost can increase up to 55.77%, before making the ICLS unfeasible, as long as revenues remain constant. While maintaining the total cost, the total revenue can reduce by up to 35.80% without making the ICLS unfeasible.
Tables 4, 5 show the total cost, total revenue, and cash flow for the treatments. Table 4 lists treatments that received nitrogen during the cropping period and Table 5 lists those that received nitrogen in the pasture. It can be seen in these tables that the total costs were higher in the treatments in which nitrogen was applied to the pasture.

Table 4. Total cost (TC), total revenue (RT), and cash flow (FC) for treatments that received nitrogen fertilization in the field in the ICLS for 5.5 years.
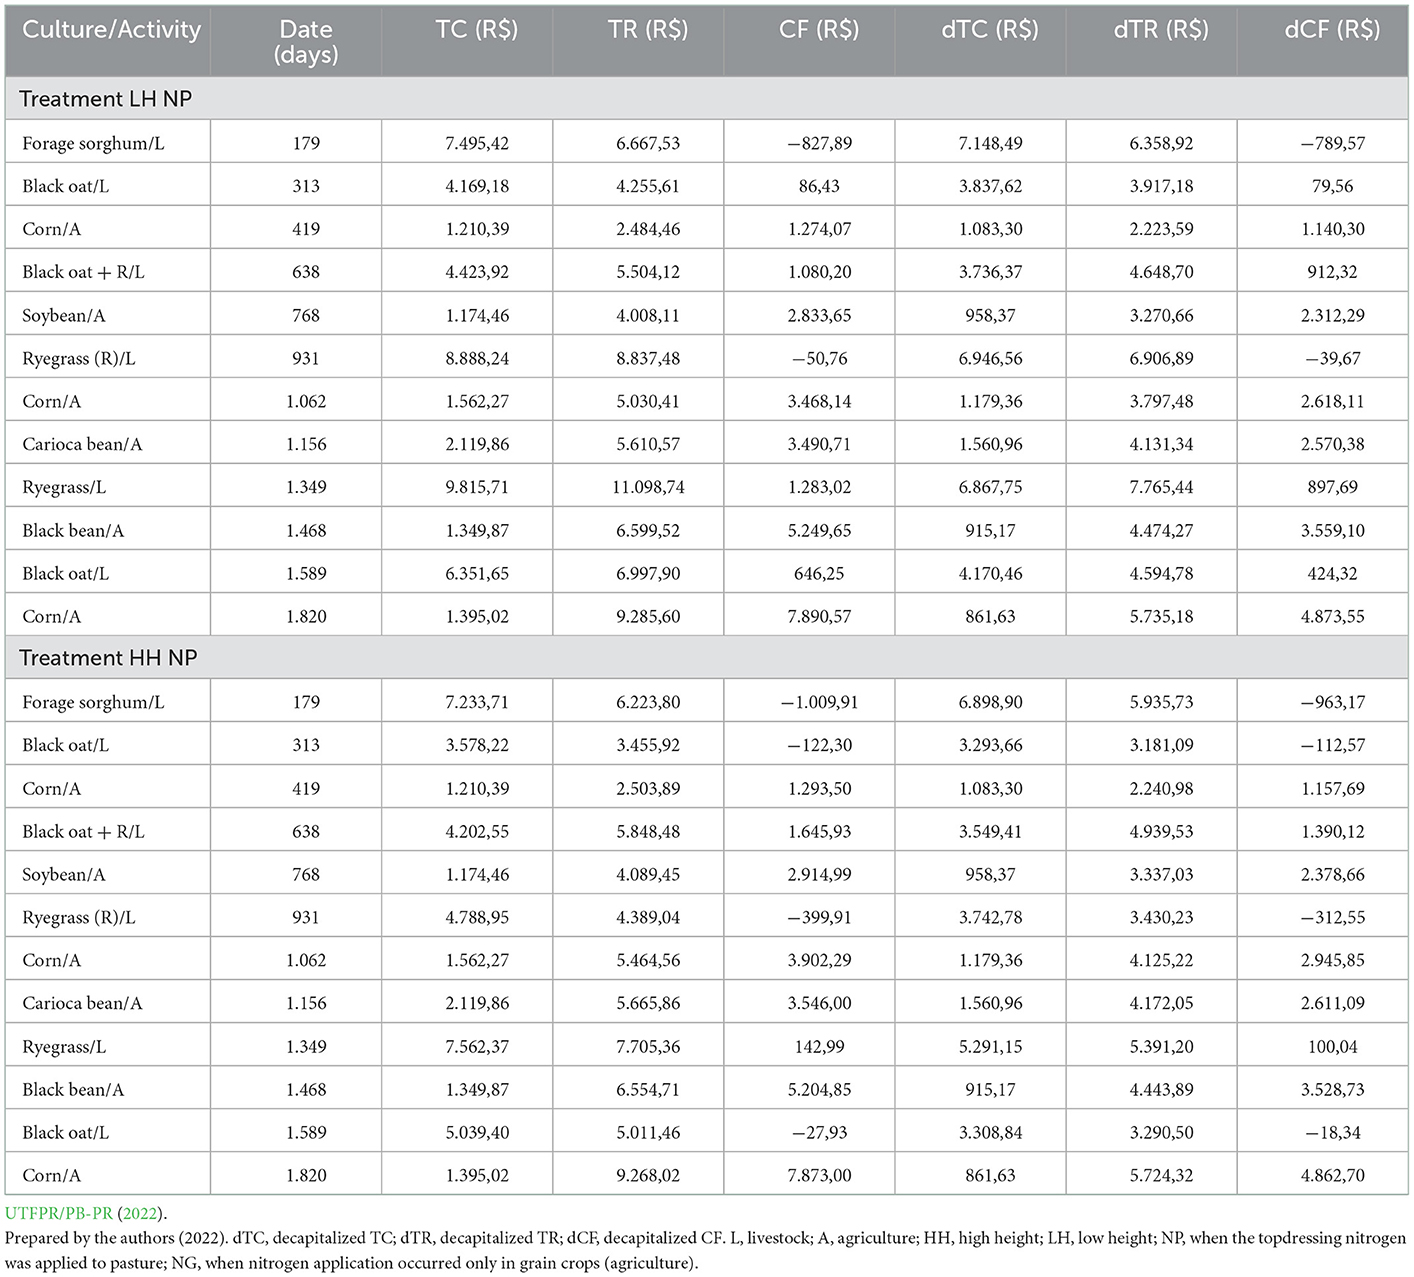
Table 5. Total cost (TC), total revenue (RT), and cash flow (FC) for treatments that received nitrogen fertilization in the pasture in the ICLS for 5.5 years.
Table 6 shows the economic viability indicators for each treatment over 5.5 years. The total net and annual gains were higher in the paddocks managed at low heights in the pasture in the two periods of nitrogen application. The low-height treatment with nitrogen applied in agriculture (LHNG) obtained the highest NPVA (R$ 5,180.06/ha); in addition, it presented excellent values for the other indicators. For each real invested in the LHNG treatment, a return of R$ 1.61 was observed, which is equivalent to a gain of 9.90% per year (additional return on investment [ARI]), in addition to the daily MARR (10% per year—pre-fixed value in the data entry). For this treatment, there is an ARI/MARR index of 99.04%, which represents a high degree of return (>66.66%), according to the adapted scale by Souza and Clemente (2008), and an annual MIRR of 20.89%. As for the sensitivity indicators, it appears that the highest values for the percentage variation of total cost and total revenue are observed for the treatment of higher pasture height and N applied to the crop (AANG), being 63.98 and 39.02%, respectively. Regardless of the treatment used, ICLS is economically viable, with a good margin for variations in total costs and revenues.
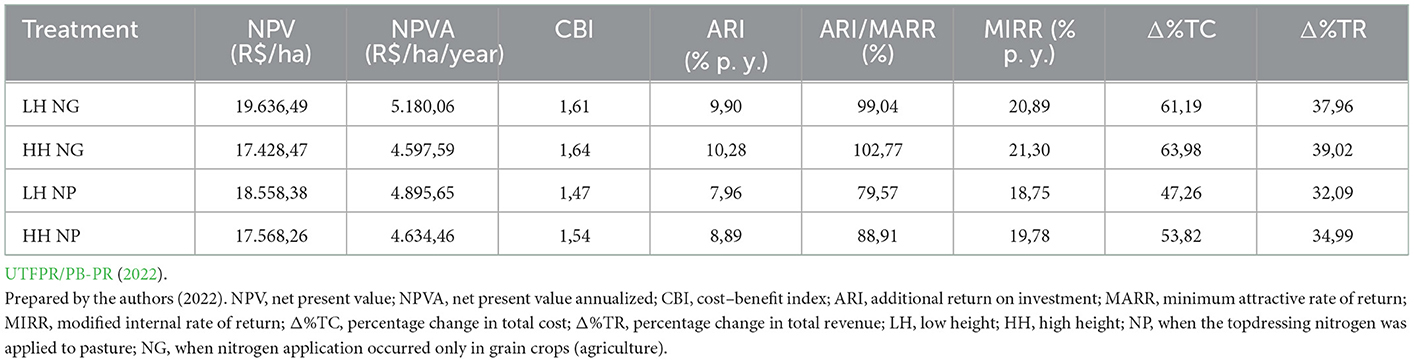
Table 6. Economic viability indicators for ICLS treatments for 5.5 years.
4. Discussion
The total cost of livestock is 3.4 times higher than the cost of agriculture, due to the cost of acquiring the animals, because, in ICLS, it is necessary to buy the animals for fattening in the livestock phase, except when the producer makes a complete cycle. However, this is a rare situation to be observed, of which the most common is that the producer only fattens the animals and, therefore, needs to buy them. In the quest to minimize this cost, Martha Júnior et al. (2009) evaluated different stocking rates with the justification that the high demand for capital for the purchase of animals can generate doubts in the producer as to whether it is more advantageous to minimize this expense, reducing the number of animals to levels below the pasture production potential. The authors observed that the best economic performances occurred at the highest stocking rates; therefore, in addition to not being technically feasible to underuse the productive potential of pastures, it is also not from the point of view of economic viability.
The share of agriculture and livestock in the formation of national agricultural revenue in 2017 was 60.67 and 39.33%, respectively (CONAB—Companhia Nacional de Abastecimento, 2020). According to CONAB, among the products listed, 20 showed an increase in gross revenue, due to income growth, increased production, and higher prices, in addition to four products (garlic, sugar cane, pork, and castor beans) that had an increase in gross revenue only due to the increase in prices. In the present research, the total revenues from agriculture and livestock were not different, each contributing 50% of the total revenue. The highest total revenue was observed in the corn crop in the year 2017/2018, which had a price paid of R$ 39.92 per 60 kg bag and average grain production of 14,094 kg/ha. It is worth noting that the average yield of corn production for Abelardo Luz—SC in this period was 11,400 kg/ha (IBGE—Instituto Brasileiro de Geografia e Estatística, 2018), that is, 19.1% more than the average for the municipality produced in the experiment.
The high costs in forage sorghum (1st crop) are due to the inputs, allied to a low level of animal production mainly motivated by the short grazing period (65 days). As for the inputs, this was the first year of the work, requiring correction fertilization of 530 kg/ha of NPK 8-20-20, as well as the cost to sow 117 kg of seeds/ha (10.80 R$/kg). The high costs for ryegrass in the 6th and 9th harvests are due to the high cost of acquiring 200 kg calves, that is, R$ 1,319.24 and R$ 1,444.58, respectively. In the 6th harvest, the cash flow was negative because, in addition to the high cost of acquiring calves, the weight gain per area (278 kg of body weight/ha) was not enough for the income to exceed the costs, while in the 9th harvest, the weight gain per area was 550 kg BW/ha and paid costs.
When calculating the NPV, all values are brought to date zero. In the NPVA, the cash flow is transformed into a uniform series, so it can be used in projects that have different horizons, thus indicating the value of the net benefit per period offered by the investment (Souza and Clemente, 2008; Souza et al., 2020). In the present study, the NPVA was prioritized because the harvests have different durations; this indicator refers to the annual net gain in addition to the MARR of 10% per year (used at work). The return indicated by the CBI is equivalent to a gain of 9.16% per year (ARI), in addition to the daily MARR (10% per year—pre-fixed value at data entry). Additional return on investment represents the profitability above the gains that would be achieved if the capital had remained invested in low-risk securities, allowing the measurement of the return on the MARR (Souza and Clemente, 2020). Magnabosco et al. (2009), who used long-term data collected in the Cerrado in the Santa Fé System, in modeling research to create an economic feasibility analysis model in SIPA, observed a net gain (NPV) of R$ 31,554.53 to R$ 51,764.04 and CBI from 1.23 to 1.47 per currency unit invested. These authors considered the use of ICLS economically viable. The net gains observed in the present study are smaller than those observed by Magnabosco et al. (2009); however, it is worth mentioning that, in this study, higher values of CBI were obtained.
The ARI/MARR index (Souza and Clemente, 2008) better indicates the financial return, which, in this work, was expressed as 91.62%, framing the ICLS studied as having a high degree of return (>66.66%), according to an adapted financial scale of Souza and Clemente (2008). This scale has been used in several studies on economic viability, including in agribusiness (Guares et al., 2021; Piovesan et al., 2021; Tomazini et al., 2021).
An investment to be considered viable from the internal rate of return or the MIRR perspective must be greater than the daily MARR; however, in this research, it represents two times the MARR. The MIRR is an improvement of the internal rate of return (IRR), as it eliminates the real problems of properties, return and return, as well as divergent financing and financing rates (Kassai et al., 1999) and indicates the internal rate of return and return over time (Brigham et al., 2001). Vinholis et al. (2021) compared the economic viability of the ICLS in relation to livestock only and observed an NPV of R$ 2,782.69 per ha for the ICLS estimated for a MARR of 4.96% per year and annual IRR of 14%. The authors concluded that the ICLS has a higher NPV and IRR than just the use of livestock not integrated to cash crops, therefore greater economic attractiveness. This research does not aim to compare livestock vs. grain crops separately. This approach would not consider all protocooperative relationships between phases, and it is not named an integrated livestock system.
Based on historical research results in the state of Paraná, Lazzarotto et al. (2015) used value at risk (VaR) to analyze the volatility of ICLS economic returns in relation to systems specialized in grain production or beef cattle. The volatility analysis showed that the economic performance of the systems can vary between intervals of an agricultural year. However, in the short term, the ICLS generates better results, and the system with only grain production is the most volatile. Even in the unfavorable market and technical situations, the ICLS, based on the measures of expected return and VaR, presents a more favorable relationship between return and risk. Finally, these authors also conclude that, in economic terms, the combination of agricultural and livestock activities can be advantageous, bringing a reduction in the expected risk/return ratio. In this study, the results of the percentage variation of the cost and total revenue indicate that we can recommend the implementation of the ICLS without the need to use the stochastic approach supported by the Monte Carlo Simulation (MCS). This is because most of the sensitivity indices are 33.33% or higher, characterizing it as low risk (Souza and Clemente, 2008; Souza et al., 2020).
In relation to the treatments, it was observed that the total costs were higher in those that applied nitrogen to the pasture; this is not due to the cost of fertilizer (urea) but due to the aggregation of all costs with the animals, mainly cost to buy steers at the beginning of each pasture phase. The cost of N application in the pasture represents 11 and 13% of the total cost in treatments HH and LH, respectively. While the application of N in grain crops represents 23% of the total cost in treatments of HH and LH. The lowest labor cost occurred in soybean (5th crop), which is the same in all treatments (R$ 1,174.46), as there was no application of nitrogen in any of the treatments. Phosphorus, potassium, and sulfur are the nutrients that soy absorbs most from the soil, so it needs replacement through soil analysis. As for nitrogen, it can be acquired through inoculation. According to Menza et al. (2017), producers rarely apply nitrogen to soybeans, although a small application as a “starter” fertilizer is sometimes applied at the time of sowing.
Martha Júnior et al. (2011) argued that the positive economic performance of the ICLS can be explained by the effect of the economy of scope, that is, the complementarity between grain and forage production generating lower costs. Observing the costs for the treatments, this complementarity is verified, as it can be seen that the costs were lower in the HH treatments when N was applied to the pasture compared with N applied to grain crop treatments. The management with high canopy height presented lower carrying capacity and higher straw mass in the no-till system, which benefits soil conservation and should reduce the phytosanitary cost. The height of pasture management is an important point in ICLS because the same proportionality of height that exists above the ground also has roots below the ground, which contributes to improving the structure of the soil (porosity, water infiltration, and increment of organic matter). Cassol (2003) observed that the increase in water infiltration is directly proportional to the increase in pasture height, evidencing the degradation of soil quality when high grazing pressure is used. According to Garcia et al. (2012), forage intercropping systems with corn do not reduce the grain yield of corn grown without intercropping. These authors also concluded that simultaneous crops have higher gross revenue, higher total operating cost, lower operating profit, and higher profitability index. In another study carried out in Coxilha, RS, evaluating six-grain production systems integrated with annual winter and summer pastures, Santos et al. (2003) concluded that the fattening of animals increases the profitability of the crop.
The feasibility indicators indicate that the LHNG treatment represents the management with the best economic return, followed by LHNP, but the other treatments are also economically viable. In this way, the canopy height target of pasture management and nitrogen fertilization time, agriculture or pasture, must be a technical choice. Consideration should be given to which management brings more benefits to the system since everyone has economic viability. To justify the importance of combining economic viability and technical viability, we use the work of Cassol (2003) who observed that the gross margin for agriculture (soybean cultivation) was linear increasing and the gross margin for livestock was linear decreasing, according to the increase in pasture management height (10, 20, 30, and 40 cm). The gross margin for livestock was negative from 33 cm in height. In this way, he concluded that economically there are no differences between the canopy heights of pasture management and that the choice must be technical, thus indicating that the management must be between 20 and 30 cm in height. According to the author, these heights guarantee safety to the producer and sustainability to the system, enabling positive results in livestock and soybean production. Another point that should be highlighted is the way of calculating gross margin in grazing experiments. Making the product between the animal production per ha and the price of the product (R$/@ of animal product) does not necessarily reflect practical issues, since the animal product marketing is the initial stock that was acquired and added to the gain of kg of live weight obtained while using the pasture. Regardless of whether the animals are destined for slaughter or post-weaning growing, they are destined to be finishers. If we consider that the exchange ratio is currently 2 (FARNEWS—Mercado, 2021), it would mean that the disbursement to acquire the animal load to be placed on the pasture will be double the same kg of live weight at the time of sale. In other words, if the exchange ratio were above 1, the higher the worse, the economic profitability calculations that only consider the commercialization of production would be overestimating the NPV.
According to Wesp et al. (2016), the management of pastures in SIPA with regard to grazing intensity should envisage the construction of a vegetation structure that can optimize, not maximize, the forage harvest by the animals. Kunrath et al. (2015) demonstrated that different grazing intensities influence soybean establishment but do not affect any of the other yield components.
The best result for the LHNG treatment, in terms of economic viability indicators, might be the result of the higher grain production in these paddocks (average of 5,842 kg/ha). Throughout the succession of crops, the bigger amount of biomass cycling by urine and feces must have benefited grain production, and small differences in soil physics, which are not always statistically perceptible, may have promoted grain yield to some degree. According to Maccari et al. (2021) in subtropical areas of Brazil, unlike temperate areas, two or more successive crops can be grown in the same year and nutrients applied in one season can be transported to the next season continuously. These authors verified that the transport of nitrogen (N) from a pasture fertilized with N can be considered a viable strategy to reduce N application in maize without harming crop productivity and soil fertility. In the opposite direction, the transport of N fertilization from a grain crop to a later pasture was not observed in the edaphoclimatic conditions of subtropical Brazil (Bernardon et al., 2020).
5. Conclusion
The results found in the deterministic approach, using the EMIM, indicate the economic viability of the ICLS. In addition, the sensitivity levels achieved in the work do not require the use of the stochastic approach with MCS to recommend the implementation of the ICLS.
In this study, regardless of the time of nitrogen application, pasture management with low height provided the highest net and annual gains. It should be noted that all treatments were economically viable and had very similar values in the different indicators. Therefore, the choice of management must also consider the technical feasibility, that is, choose the management that brings greater benefits to the system.
As this study was carried out over a relatively long term, it contemplates possible variability in grain productivity, animal production, prices of inputs, and marketing of products, in addition to considering the operational cost of labor, inputs, and operations and depreciation of machinery, equipment, and infrastructure. Therefore, economic indicators provide relevant and reliable information regarding the economic feasibility of using the ICLS. However, future studies are suggested to compare the economic viability of ICLS with the exclusive practice of livestock and agriculture.
Data availability statement
The datasets presented in this study can be found in online repositories. The names of the repository/repositories and accession number(s) can be found below: http://repositorio.roca.utfpr.edu.br/jspui/.
Ethics statement
Ethical review and approval was not required to study animals because only animal performance was evaluated, and the animals were not under conditions of food restriction.
Author contributions
DE gathered all the information collected in the experiments, tabulated the data, carried out price research, reviewed the literature, and wrote the manuscript. DE and JL performed the economic feasibility analysis. AS and JL reviewed and corrected the text. RM helped organize and tabulate the data. WT and FD assisted in input calculations. TA, MB, AB, FL-H, MM, PB, and AR were part of the organization, conduction, and data collection in the experiments. All authors contributed to the article and approved the submitted version.
Acknowledgments
We are grateful to the Improvement of Higher Education Personnel/Postdoctoral National Program (CAPES/PNPD) for supporting this study.
Conflict of interest
The authors declare that the research was conducted in the absence of any commercial or financial relationships that could be construed as a potential conflict of interest.
Publisher's note
All claims expressed in this article are solely those of the authors and do not necessarily represent those of their affiliated organizations, or those of the publisher, the editors and the reviewers. Any product that may be evaluated in this article, or claim that may be made by its manufacturer, is not guaranteed or endorsed by the publisher.
References
Bernardon, A., Assmann, T. S., Soares, A. B., Maccari, M., and Bortolli, M. A. (2020). Carryover of N-fertilization from corn to pasture in an integrated crop-livestock system. Arch. Agron. Soil Sci. 1–16. doi: 10.1080/03650340.2020.1749268
Brigham, E. F., Gapenski, L. C., and Ehrhardt, M. C. (2001). Administração financeira: teoria e prática. São Paulo: Atlas.
Carvalho, C.F., Santos, D.T., Gonçalves, E.N., Moraes, A., and Nabinger, C. (2010). “Forrageiras de Clima Temperado,” in Plantas Forrageiras, org. D. M. Fonseca, J. A. Martuscello. Viçosa: UFV, v.1, 494–537. Disponível em: https://www.bibliotecaagptea.org.br/zootecnia/forragens/livros/FORRAGEIRAS%20DE%20CLIMA%20TEMPERADO.pdf (Acesso em 10 out. 2022).
Carvalho, C. F., Moraes, A., Pontes, L. S., Anghinoni, I., Sulc, R. M., Batelo, C., et al (2014). Definições e terminologias para sistema integrado de produção agropecuária. Revista Ciência Agronômica, v.45, (Especial), 1040–1046. Disponível em: http://ccarevista.ufc.br/seer/index.php/ccarevista/article/view/3790/1048 (Acesso em 10 jun. 2021).
Cassol, L. C. (2003). Relação solo-planta-animal num sistema de integração lavoura-pecuária em semeadura direta com calcário na superfície. Porto Alegre, Universidade Federal do Rio Grande do Sul, 157p. (Tese de Doutorado). Disponível em: https://lume.ufrgs.br/bitstream/handle/10183/4243/000398358.pdf?sequence=1andisAllowed=y (Acesso em 7 jun,. 2021).
CEPA/EPAGRI—Center Socioeconomics Agricultural Planning (2020). Planilhas de custo de produção. Disponível em: https://cepa.epagri.sc.gov.br/index.php/produtos/custos-de-producao/ (Acesso em 10 out. de, 2020).
CEPEA/ESALQ—Center Socioeconomics Agricultural Planning (2020). Gestão do negócio agropecuário. Piracicaba. Disponível em: https://www.cepea.esalq.usp.br/br/gestao-do-negocio-agropecuario.aspx (Acesso em 15 out. de 2020).
CONAB—Companhia Nacional de Abastecimento (2020). Receita bruta dos produtores rurais brasileiros. Brasília: Conab, V.10, 1–234. Disponível em: https://www.conab.gov.br/info-agro/precos/receita-bruta-dos-produtos-brasileiros/item/download/33326_f716bfeef8632de9cf8905928973c285 (Acesso em 7 jul,. 2021).
FAO—Food Agriculture Organization of the United Nations (2010). An international consultation on integrated crop-livestock systems for development: The way forward for sustainable production intensification, v.13, 72, 2010. Disponível em: http://www.fao.org/3/i2160e/i2160e.pdf (Acesso em 20 jul,. 2021).
FAO—Food Agriculture Organization of the United Nations (2015). The state of food insecurity in the world 2014, 57p. Disponível em: http://www.fao.org/3/i4030e/i4030e.pdf (Acesso em 20 jul,. 2021).
FARNEWS—Mercado (2021). Dados da relação de troca de bezerros por boi gordo, de 2000 a 2021. Disponível em: https://www.farmnews.com.br/mercado/dados-da-relacao-de-troca-de-bezerros-por-boi-gordo-de-2000-a-2021/ (Acesso em 20 mar. 2022).
Fonseca, L., Mezzalira, J.C., Bremm, C., Filho, R.S.A., Gonda, H.L., and Carvalho, C.F. (2012). Management targets for maximising the short-term herbage intake rate of cattle grazing in Sorghum bicolor. Livestock Science (Print), v.145, 205–211. Disponível em: https://www.sciencedirect.com/science/article/pii/S1871141312000595?via%3Dihub (Acesso em 10 out. 2022).
Garcia, C. M. P., Andreotti, M., Tarsitano, M. A. A., Teixeira Filho, M. C. M., Lima, A. E. S., Buzetti, S., et al (2012). Economic analysis of grain yield of maize intercropped with forage plants of the genera Brachiaria and Panicum in no-tillage system. Revista Ceres, v.59, 157-163. Disponível em: https://www.redalyc.org/pdf/3052/305226823002.pdf (Acesso em set. 09, 2020).
Guares, S. A., de Lima, J. D., and Oliveira, G. A. (2021). Techno-economic model to appraise the use of cattle manure in biodigesters in the generation of electric energy and biofertilizer. Biomass Bioenerg. 150, 1–11. doi: 10.1016/j.biombioe.2021.106107
IBGE—Instituto Brasileiro de Geografia e Estatística (2018). Produção agrícola das cidades Abelardo Luz, SC. Disponível em: https://cidades.ibge.gov.br/brasil/sc/abelardoluz/pesquisa/14/10193?tipo=rankingandano=2018 (Acesso em 05 de ago. de 2020).
Kassai, J. R., Kassai, S., Santos, A., and Assaf Neto, A. (1999). Retorno de investimento: abordagem matemática e contábil do lucro empresarial. São Paulo: Atlas.
Kunrath, T. R., Carvalho, C. F., Cadenazzi, M., Bredemeier, C., and Anghinoni, I. (2015). Grazing management in an integrated crop-livestock system: soybean development and grain yield. Revista Ciência Agronômica, v. 46, 645–653. Disponível em: https://www.scielo.br/j/rca/a/P9pvmFgX5BKgzBYK7CSmvdn/?format=pdfandlang=en (Acesso em 09 de ago. de 2021).
Lazzarotto, J. J., Santos, M. L., Lima, J. E., and Moraes, A. (2015). Volatilidade dos retornos econômicos associados à integração lavoura-pecuária no estado do paraná. Revista De Economia E Agronegócio, v.7. doi: 10.25070/rea.v7i2.152
Lima, J. D., Trentin, M. G., Oliveira, G. A., Batistus, D. R., and Setti, D. A. (2015). systematic approach for the analysis of the economic viability of investment projects. Int. J. Eng. Manag. Econ. 5, 19–34. doi: 10.1504/IJEME.2015.069887
Maccari, M., Assmann, T. S., Bernardon, A., Soares, A. B., Franzluebbers, A., Bortolli, M., et al. (2021). Relationships between N, P, and K in corn biomass for assessing the carryover effects of winter pasture to corn. Eur. J. Agron. 129. doi: 10.1016/j.eja.2021.126317
Magnabosco, C. U., Muniz, L. C., Figueiredo, R. S., Wander, A. E., Trovo, J. B. F., Martha Júnior, G. B., et al (2009). Boletim de Pesquisa e Desenvolvimento 261: Avaliação econômico-financeira e análise de risco em sistema de integração lavoura e pecuária conduzida no estado de Goiás. EMBRAPA, 32p. Disponível em: https://www.infoteca.cnptia.embrapa.br/bitstream/doc/858792/1/bolpd261.pdf (Acesso em 25 jul. de 2021.
Martha Júnior, G. B., Alves, E., and Contini, E. (2011). Dimensão econômica de sistemas de integração lavoura-pecuária. Pesquisa Agropecuária Brasileira, Brasília, v.46, 1117-1126, 2011. Disponível em: https://www.scielo.br/j/pab/a/DmL4DTT8vSqNwMkNrHvnvbc/?lang=ptandformat=pdf (Acesso em 14 jul. de 2021).
Martha Júnior, G. B., Mueller, C. C., Alves, E., and Vilela, L. (2009). Análise ex-ante do desempenho econômico-financeiro de alternativas de integração lavoura-pecuária no Triângulo Mineiro e no Sudoeste Goiano. Planaltina: Embrapa Cerrados, 26p. (Embrapa Cerrados. Boletim de Pesquisa, 262). Disponível em: https://www.infoteca.cnptia.embrapa.br/infoteca/bitstream/doc/1007887/1/bolpd262.pdf (Acesso em 13 jan. de 2022).
Matsunaga, M., Bemelmans, F., Toledo, E. N., Dulley, R. D., Okawa, H., Pedroso, I. A., et al (1976). Metodologia de custo de produção utilizado pelo IEA. Agricultura em São Paulo, São Paulo, v. 23, 123–139. Disponível em: http://www.iea.sp.gov.br/out/verTexto.php?codTexto=11566 (Acesso em 15 de mar. de 2021).
Menza, N. C., Monzon, J. P., Specht, J. E., and Grassini (2017). Is soybean yield limited by nitrogen supply? Field Crops Res.213, 204–212. doi: 10.1016/j.fcr.2017.08.009
Mott, G. O., and Lucas, H. L. (1952). “The design conduct and interpretation of grazing trials on cultivated and improved pastures,” in International Grassland Congress, 6. Proceedings (Pennsylvania: State College Press), 1380–1395.
Piovesan, G. T., de Lima, J. D., and Oliveira, G. A. (2021). Viabilidade econômica da automação de equipamentos: estudo de caso em fábrica de ração suína utilizando a MMIA. Custos e Agronegócio On Line, v. 17, 145–165. Disponível em: http://www.custoseagronegocioonline.com.br/numero1v17/OK%207%20automacao.pdf (Acesso em 05 de ago. de 2021.
Santos, H. P., Fontaneli, R. S., and Ambrosi, I. (2003). Análise econômica de culturas de inverno e verão em sistemas de produção mistos sob plantio direto. Pesquisa Agropecuária Gaúcha, v.9, 121–128. Disponível em: http://www.revistapag.fepagro.rs.gov.br/files/PAG9n1e2.pdf (Acesso em 13 jul. de 2021).
Souza, A., and Clemente, A. (2008). Decisões financeiras e análise de investimentos: fundamentos, técnicas e aplicações. 6. ed. São Paulo: Atlas.
Souza, A., de Oliveira, A. M. M., Fossile, D. K., Óguchi Ogu, E., Dalazen, L. L., da Veiga, C. P., et al. (2020). Business Plan Analysis Using Multi-Index Methodology: Expectations of Return and Perceived Risks, v. 10, 1–15 (Thousand Oaks, CA: SAGE OPEN).
Tomazini, C. E. G., Santos, E. P., Abatti, L., Borsatti, A. C., Tavares, B., Lima, J. D., et al (2021). Análise de viabilidade econômica da produção de physalis em cultivo protegido como opção de renda para a agricultura familiar. Custos e Agronegócio On Line, v. 17, 161–183. http://www.custoseagronegocioonline.com.br/especialv17/OK%207%20phisalis.pdf (Acesso em 29 jan. 2022).
Vilela, L., Barcellos, A. O., and Souza, D. M. G. (2001). Benefícios da integração entre lavoura e pecuária. Doc. Embrapa Cerrados, Planaltina, 1–21. Disponível em: https://www.infoteca.cnptia.embrapa.br/bitstream/doc/567050/1/doc42.pdf (Acesso em 17 fev. 2022).
Vinholis, M. M. B., Souza Filho, H. M., Carrer, M. J., et al (2020). Adoção de sistemas de integração lavoura-pecuária-floresta em São Paulo. São Carlos, SP: Embrapa Pecuária Sudeste, 56 p. (Embrapa Pecuária Sudeste. Boletim de Pesquisa e Desenvolvimento, 47). Disponível em: https://ainfo.cnptia.embrapa.br/digital/bitstream/item/214315/1/AdocaoSistemasIntegracao.pdf (Acesso em 17 jun. 2021).
Vinholis, M. M. B., Souza Filho, H. M., Carrer, M. J., Shimata, I., Oliveira, P. A., Pedroso, A. F., et al (2021). Economic viability of a crop-livestock integration system. Ciência Rural, Santa Maria, v.51, e20190538. Disponível em: https://www.scielo.br/j/cr/a/SJy8VNFWvpB5RzKWh6Hb4rk/?lang=enandformat=pdf (Acesso em 14 jul. 2021).
Wesp, C. L., Carvalho, C. F., Conte, O., Cadenazzi, M., Anghinoni, I., Bremm, C., et al (2016). Steers production in integrated crop-livestock systems: pasture management under different sward heights. Revista Ciência Agronômica, v. 47, 187–194. Disponível em: https://www.redalyc.org/pdf/1953/195350037022.pdf (Acesso em 14 dez. 2021).
Keywords: agriculture, expanded multi-index methodology, livestock, net present value, a net current value per year, system fertilization
Citation: Elejalde DAG, Soares AB, de Lima JD, Missio RL, Assmann TS, Tatto WH, Deifeld FLC, Bortolli MAd, Bernardon A, Levinski-Huf F, Maccari M, Barriga PAB and Rhoden AC (2023) Economic viability in the integrated crop-livestock system with nitrogen fertilization system and sward canopy heights. Front. Sustain. Food Syst. 6:940946. doi: 10.3389/fsufs.2022.940946
Received: 10 May 2022; Accepted: 28 December 2022;
Published: 25 January 2023.
Edited by:
Matteo Balderacchi, Independent Researcher, Piacenza, ItalyReviewed by:
Marcos Weber Canto, State University of Maringá, BrazilWilliam De Souza Filho, Federal University of Rio Grande do Sul, Brazil
Copyright © 2023 Elejalde, Soares, de Lima, Missio, Assmann, Tatto, Deifeld, Bortolli, Bernardon, Levinski-Huf, Maccari, Barriga and Rhoden. This is an open-access article distributed under the terms of the Creative Commons Attribution License (CC BY). The use, distribution or reproduction in other forums is permitted, provided the original author(s) and the copyright owner(s) are credited and that the original publication in this journal is cited, in accordance with accepted academic practice. No use, distribution or reproduction is permitted which does not comply with these terms.
*Correspondence: Denise Adelaide Gomes Elejalde,  ZGVuaXNlLmVsZWphbGRlQGdtYWlsLmNvbQ==