 Javier Atalah
 Pablo Sanchez-Jerez
- Department of Marine Science and Applied Biology, University of Alicante, Alicante, Spain
Seafood and other aquatic food (blue food) are often advocated as sustainable protein sources crucial to meeting global food demand. Consumption choices allow citizens to take actions that reduce the environmental burden of food production and tackle the climate crisis. Here we used a high-resolution Spanish national-level dataset collected from 12,500 households between 1999 and 2021 as a study case to assess trends in blue food consumption concerning sources, types and stressors resulting from their production. By aggregating species groups according to source, we found an overall reduction in the consumption of most wild species. For farmed species, we found a pronounced increase in the consumption of carnivorous fish and an overall decrease in low trophic-level species consumption, such as bivalves. Using published studies, we estimated greenhouse gases, nitrogen, and phosphorus emissions to assess trends in environmental footprint. Low performance was associated with the consumption of high trophic-level species intensively farmed in distant regions, such as carnivorous fish, due to high stressor emissions related to their production and transport. Across all groups, consumption of locally farmed bivalves conduced to the lowest stressor emissions, providing an example of ‘net-zero' blue food. Our analysis identified historical trends in the environmental footprint of blue food consumption and consumers' choices that promote environmentally sustainable diets. It also highlights vast differences in the ecological footprint associated with the consumption of aquaculture-sourced protein. Based on our assessment, we recommend refocusing consumption patterns toward farmed species with small environmental footprints, such as locally produced low trophic-level species, and implementing policies that increase consumers' environmental awareness and minimize food production systems' footprints. Considering global blue food demand is predicted to nearly double by mid-century, consumers' choices can significantly impact sustainable production practices and mitigate climate change.
Introduction
Blue foods (seafood and other aquatic food) play a crucial role in global food security, providing a significant proportion of animal protein to a rapidly growing world population (Naylor et al., 2021a,b; Boyd et al., 2022; Tigchelaar et al., 2022). They are a healthy protein source, rich in essential micronutrients, minerals, and fatty acids (Koehn et al., 2022). Their global consumption is rising (Garlock et al., 2022), with per capita consumption estimated at 20.2 kg in 2020, accounting for 17% of animal protein consumption and reaching over 50% in several countries in Asia and Africa (FAO, 2022). In many countries, blue foods are more accessible and affordable than other animal-sourced proteins (Teh and Sumaila, 2013). Therefore, their production is increasing, and as a result, they are becoming one of the most traded commodities, supporting jobs, livelihoods, and income worldwide (Gephart and Pace, 2015).
However, blue food production has drastically changed in the last decades due to aquaculture's fast expansion and the limited supply of fish from wild fisheries (Sumaila et al., 2016). The share of aquaculture production has nearly overtaken capture fisheries (49.2%, FAO, 2022). In most cases, blue food production systems generally have better environmental performance than other animal-sourced proteins (Gephart et al., 2021; Jones et al., 2022). Sustainable production systems, such as low trophic-level fisheries or bivalve aquaculture, have environmental footprints comparable to that of chicken, one of the most efficient terrestrial animal-sourced proteins (Gephart et al., 2021; Xu et al., 2021). Unfed aquaculture, such as seaweeds and filter-feeding shellfish, can improve water quality through nutrient uptake (Cranford, 2019). However, poorly managed blue foods production systems can have an enormous environmental impact, including habitat degradation, wildlife and biodiversity impacts, nutrient enrichment, and greenhouse gas emissions (Pauly et al., 2002; Naylor et al., 2021a). In addition, many markets rely on imports to meet the national demand for blue foods (Guillen et al., 2019), with transport responsible for a large share of food's final carbon footprint (Ziegler et al., 2013). Therefore, improving production systems and minimizing environmental impacts are vital to sustaining blue food's contribution to food security (Tigchelaar et al., 2022).
Food consumption choices allow citizens to take actions that reduce the environmental burden of food production and tackle the climate crisis. Shifting to balanced, “sustainable healthy diets” has been suggested by Intergovernmental Panel on Climate Change as a significant way of mitigating the worst impacts of climate change (FAO, 2022). Sustainable healthy diets include animal-sourced food produced in resilient, sustainable, and low-emission systems. Reducing the proportion of animal protein in our diets and consuming locally and sustainably produced food can have significant environmental benefits (Tilman and Clark, 2014; Springmann et al., 2016). Therefore, a better understanding of the environmental performance of different types of blue foods from various sources can help promote sustainable diets. Previous analyses of global food balance data (FAO, 2020a) have shown increasing trends in blue food consumption over the last two decades with distinct geographic patterns (Naylor et al., 2021b). However, most analyses have been based on apparent consumption, derived from economic indicators, of blue food aggregated into major species groups, which precludes assessing the relative contribution of different sources, types, and origins.
To understand how changes in consumption trends of fishery and aquaculture products in developed countries with high seafood consumption can help mitigate climate change and environmental impacts, we evaluate the case of Spain. For this purpose, we analyzed a unique 22-year consumption dataset from 12,500 Spanish households, together with trade and environmental performance data. Blue food is a significant part of Spaniard's diet, which has one of the world's highest consumption rates (42 kg per capita in 2019, Figure 1), second in Europe, only behind Portugal (EUMOFA, 2021). The specific objectives of this study case were to assess temporal trends in blue food consumption in relation to (a) type, production source, and species trophic-level and (b) stressors emissions (GHG, nitrogen, phosphorus) resulting from the production of farmed species. Our assessment of historical trends in the environmental performance of blue food consumption aims to guide public policies related to blue food consumption and guide choices that promote environmentally sustainable diets.
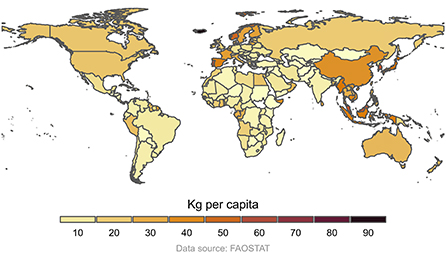
Figure 1. Global blue food annual consumption per capita in 2019.
Methods
Blue food consumption data were extracted from a household food consumption study conducted by the Spanish Ministry of Agriculture, Fisheries and Food www.mapa.gob.es/es/alimentacion/temas/consumo-tendencias/panel-de-consumo-alimentario/series-anuales/. The database comprised monthly data systematically collected between 1999 and 2021 at 12,500 collaborating households, which electronically recorded all purchased food and beverages for home consumption. The survey is stratified at a regional level, with data recorded separately for each of the 17 Spanish autonomous regions. The data do not include food purchases by agents other than households (e.g., companies or tourists) or outside households, such as hospitality establishments, which comprise ca. 20% of the total consumption (APROMAR, 2021). Even though negligible portions may have included wasted food, all purchases were edible. For each food item, price range, volume, consumption, and other economic indicators are provided; however, we focused on per capita consumption in kg as the primary response variable used in subsequent analyses. Details of the methodology used for the surveys can be accessed at www.mapa.gob.es/es/alimentacion/temas/consumo-tendencias/panel-de-consumo-alimentario/metodologia/. All available data (1999–2021) was downloaded and merged, and relevant variables were retained for the analyses, which included time series for 52 unique blue food categories (Supplementary material 1). Data were subjected to extensive quality assurance and exploration, including identifying missing values, checking for questionable values, typos, formatting, and nomenclature consistency. The cleaned regional dataset was then summed at a national level. A range of descriptors was derived for each blue food category, including production source, food type, trophic-level, and stressors emissions associated with their production and transport to Spain. Production source (wild, farmed, or mixed) was derived for each category considered in the analyses based on expert knowledge and existing literature and databases (FAO, 2018; APROMAR, 2021). Most blue food categories were of wild origin, i.e., captured by fishing fleets locally and globally (Supplementary material 1). Farmed species include mussels (Mytilus galloprovincialis), salmon (Salmo salar), European sea bass (Dicentrarchus labrax), rainbow trout (Oncorhynchus mykiss), gilthead seabream (Sparus aurata) and turbot (Psetta maxima) that extensively produced by aquaculture industries. Since wild seabream and seabass account for a negligible proportion of their total consumption (APROMAR, 2021), we considered all consumption of these two species to be farmed. Also, insignificant proportions of consumed salmon were different species from Salmo salar, yet they were not differentiated. A third group referred to as “mixed” included blue foods sourced from a combination of wild fisheries and aquaculture. This group include the categories clams, clams and cockles, cockles, shrimps and prawns, molluscs and crustaceans (except mussels), other fish (tilapia, panga, swordfish, sharks, and blackspot seabream), and other molluscs and crustaceans (Supplementary material 1). Blue foods were further categorized into three product types: fresh, frozen, and preserved. The latter included cooked, tinned, and smoked.
Trophic-level (TL) for each taxon was obtained from FishBase (Froese and Pauly, 2022), accessed through the R library “rfishbase” (Boettiger et al., 2012). TL is defined as the position of a species in the food chain and is calculated as a function of the number, relative contribution to the diet and TL of its prey. It ranges from 1 to 5, where a TL of 2 represents a herbivorous species, while intermediate predators have values around 3.1 and top predators > 4.1 (Stergiou et al., 2009). For taxa identified at a higher level than species, average genus or family level TL values were used. For mixed taxa groups, such as “other molluscs and crustaceans” or “other fish,” average values for taxa in corresponding major groups were used (Supplementary material 1).
To assess trends in the environmental performance of blue foods, standardized estimates of stressors emissions associated with their production were obtained from published sources. Greenhouse gas (GHG), nitrogen and phosphorus emissions were obtained from Gephart et al. (2021), available at (https://github.com/jagephart/FishPrint). These estimates are based on system inventory data (e.g., fuel use, feed use, feed composition, on-farm energy use and yield) from existing life-cycle-assessment studies and literature (Supplementary material 4). Mariculture emissions include those originating upstream (e.g., from finfish feed production), on-farm, and downstream (e.g., transportation). Because nutrient emissions are irrelevant to wild fisheries, we initially calculated GHG emissions associated with the consumption of wild, mixed, and farmed species. These estimates were at the farmgate level, as determining the origin of mixed and wild blue foods can be challenging and, in many cases, uncertain to allow adjusting emissions due to transportation. We use the respective average wild and farmed emissions for the mixed categories. Then we focused on the performance of farmed species only in relation to GHG and nutrient emissions (Supplementary material 5). For this purpose, we adjusted GHG emissions associated with transporting blue food from their respective farming regions. Imported species' GHG emissions were adjusted based on Ziegler et al. (2013), who estimated a 25% increase in emissions associated with salmon production due to transport between Oslo and Paris. Adjustments accounted for differences in distances between the capital of exporting countries and for the proportion of local production. Three of the six farmed species are locally farmed, namely mussels, trout, and turbot; thus, no GHG emission adjustments were required. Salmon is produced in Norway, whereas seabass and seabream are produced locally and in other countries, mainly Greece and Türkiye (APROMAR, 2021). For the latter two species, annual local production proportions were obtained from national aquaculture reports (https://apromar.es/informes/). Average proportions for each species were used for five years where data was unavailable (1999–2012 and 2021). The analysis did not consider other downstream emissions, such as retail, storage, cooking, and waste disposal. Data were processed and analyzed within the R 4.20 programming environment (R Core Team, 2022), using the packages “tidyverse,” “lubridate,” “tsibble,” “fable,” “feasts,” “anomalize.” Monthly per capita consumption data were represented as multivariate time series using the “tsibble” library. Seasonal decomposition models were fitted individually to each time series using the interquartile range method to deseasonalise the data and identify long-term trends. Anomalies in the time series were detected using the generalised extreme studentised deviate method (Paul and Fung, 1991).
Results
Trends of blue foods consumption by source and type
Historically species of mixed sources (farmed and wild) have been the most eaten blue foods by household members, with an average per capita consumption of 1.38 kg (±0.3) per month. The most popular blue food was molluscs and crustaceans (except mussels), particularly fresh, with 0.35 kg (live weight) monthly consumption per capita (Figure 2B). The second most popular mixed blue food group was other fish, which includes tilapia, panga, swordfish, sharks, and blackspot seabream (Figure 2B). The most consumed wild species was hake, with fresh being preferred over frozen hake. This was followed by canned tuna, fresh squid and octopus, anchovies, flounder, and sardines (Figure 2C). Mussels were the most consumed farmed species, mostly fresh, followed by salmon (primarily fresh), seabream, seabass, trout, and turbot (Figure 2A). Monthly total consumption peaked in March 2008 at 3.4 kg per capita and then steadily declined until now, except for a small peak in 2020. Mixed and wild consumption followed a similar pattern to total consumption (Figure 2D). Farmed blue food consumption, while significantly lower than wild and mixed blue foods, almost doubled in the last four decades (Figure 2D).
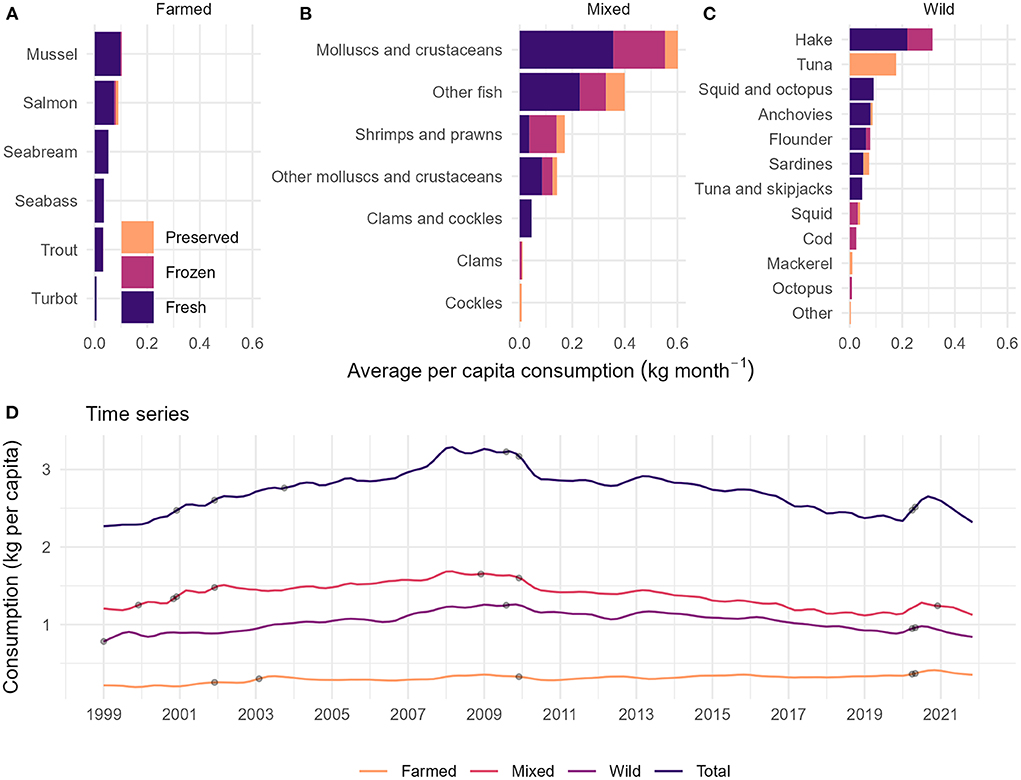
Figure 2. Mean monthly per capita consumption of most consumed blue food groups by production source: (A) farmed, (B) mixed and (C) wild, and by type of food (fresh, frozen, and preserved), and (D) monthly time series deseasonalised temporal trends of per capita consumption. Black dots denote anomalies detected with generalised extreme studentised deviate.
Trends in blue food consumption by type
Fresh blue food was the most consumed type, with a mean monthly consumption of 1.67 kg per capita (±0.26 SD, Figure 3A). Frozen and preserved consumption was comparatively lower (0.64 and 0.42 kg per capita, respectively, Figure 3A). All blue food types showed a strong seasonality with a marked consumption peak in December (Supplementary material 3). There was an upward trend in fresh blue consumption from 1999 to 2008–2009, when it peaked at 2.1 kg, then steadily dropped to levels below 1.5 kg per capita in 2021, with the only exception being a small peak in 2020 (Figure 3B). Frozen and preserved blue foods consumption followed a similar trend to fresh blue foods; however, consumption of preserved blue foods did not decrease after the 2008 peak. Both frozen and preserved foods showed a relatively small rise in consumption during 2020 (Figure 3B).
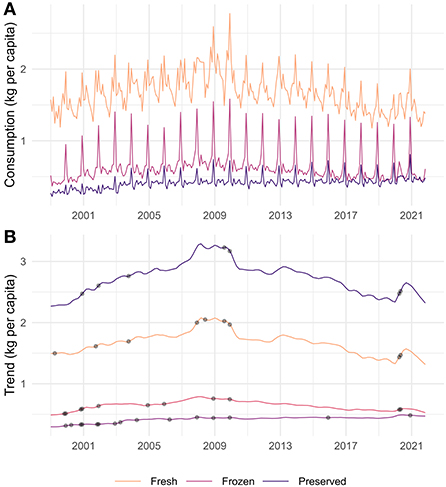
Figure 3. (A) Monthly time series and (B) deseasonalised temporal trends of blue food consumption (kg per capita) between 1999 and 2021 by food type (fresh, frozen, and preserved). Black dots denote anomalies detected with generalised extreme studentised deviate.
Trends in blue food consumption by trophic-level and source
Blue food consumption trends varied between sources and trophic-levels (TL). The consumption of low TL farmed species (mussels) was relatively constant over the study period. However, a decline in consumption was evident from 2010 onwards (Figure 4A). On the contrary, medium TL farmed species (seabream and seabass) consumption rapidly increased from 2002 up to 2009 and then rose from 2014 onwards. Consumption trends of high TL species (salmon, trout, and turbot) were more variable, but a rapid increase in consumption was evident from 2010 onwards (Figure 4). The consumption of low and medium TL mixed farmed species, which included a range of molluscs, crustaceans, and fish (Supplementary material 1), showed similar trends. Their consumption increased up to 2008 and 2009 and markedly decreased afterwards, except for a small peak in 2020 (Figure 4B). Similarly, the consumption of high TL wild species declined from 2010 onwards. Low and medium TL species consumption was less variable, apart from an increase in the consumption of low TL species in 2007 and a small peak in 2020 (Figure 4C).
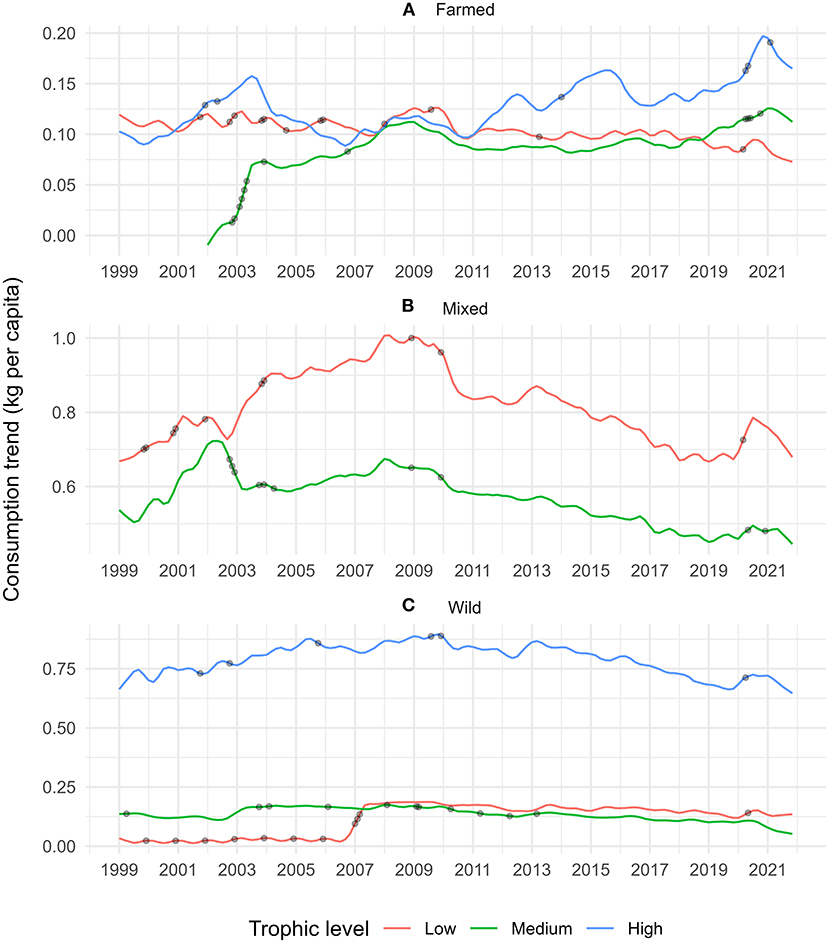
Figure 4. Blue foods monthly consumption (kg per capita) deseasonalised temporal trends (1999–2021) by production source: (A) farmed, (B) mixed, and (C) wild; and trophic-level (low, medium, and high). Black dots denote anomalies detected with generalised extreme studentised deviate.
Trends in stressor emissions associated with blue food consumption
A kilogram of blue food consumed generated an average of 7.5 kg CO2 eq. of GHG emissions, up from 6.9 kg CO2 eq. in 1999. While for farmed blue foods, average emissions increased from 3.7 kg CO2 eq. in 1999 to 6.4 kg CO2 eq. in 2022, wild foods emissions decreased from 8.8 kg CO2 eq. to 7.6 kg CO2 eq. over the same period. Average mixed foods GHG emissions were 8.45 kg CO2 eq. As expected, GHG emissions per capita followed a similar trend to that described for consumption, peaking in 2008 at 26.4 kg CO2 eq. per month per capita, they were then declining until now, except for a small peak in 2020 (Figure 5). While wild and mixed GHG emissions trends resembled that of total emissions, emissions associated with farmed blue food increased four-fold during the study period, peaking in 2021 (Figure 5). However, on average, the GHG footprint of farmed food consumption (1.73 kg CO2 eq. per month per capita) was significantly smaller than that for wild and mixed consumption (7.6 and 12.4 kg CO2 eq. per month per capita, respectively, Figure 5). Across all farmed blue foods, consumption of turbot, mussel and trout generated the lowest emissions levels of all three stressors. Low consumption levels of turbot resulted in low monthly emissions (0.083 ± 0.02 kg CO2 eq. per month per capita, Figure 6A) despite relatively high production-related emissions. In contrast, mussels were responsible for low emissions levels (0.146 ± 0.01 kg CO2 eq. per month per capita) despite relatively high consumption per capita. Most notable, mussel consumption resulted in negative N emissions (−0.013 ± 0.001 kg N eq. per month per capita, Figure 6B) and P (−0.002 ± 0.0002 kg P eq. per month per capita, Figure 6C). A downward trend in mussel consumption resulted in an overall reduction in GHG emissions and a reduction in N and P filtration (i.e., absolute increase) associated with mussel production (Figure 6). Salmon consumption was responsible for emitting 4.4 times more GHG compared to mussels. Similarly, salmon, seabream and seabass consumption were accountable for the highest stressor emissions due to a combination of high per capita consumption and high production footprint. Upward trends in stressors emissions were evident for salmon and seabass, particularly in the last ten years. Contrarily, stressor emissions for seabream were more variable over time and peaked in 2009 (Figure 6). Transport of the three imported farmed species (salmon, sea bream and seabass) accounted for ca. 50% increases in GHG emissions, with local production proportions of seabream and seabass varying between 26.3 and 62.6% and 43.7 and 67.7%, respectively. In all cases, a peak in emissions was evident during 2020.
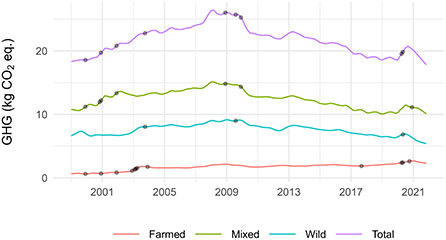
Figure 5. Deseasonalised time series (1999–2021) of farmgate greenhouse gas (GHG) emissions associated with monthly consumption (kg per capita) of farmed, wild, and mixed species. Black dots denote anomalies detected with generalised extreme studentised deviate.
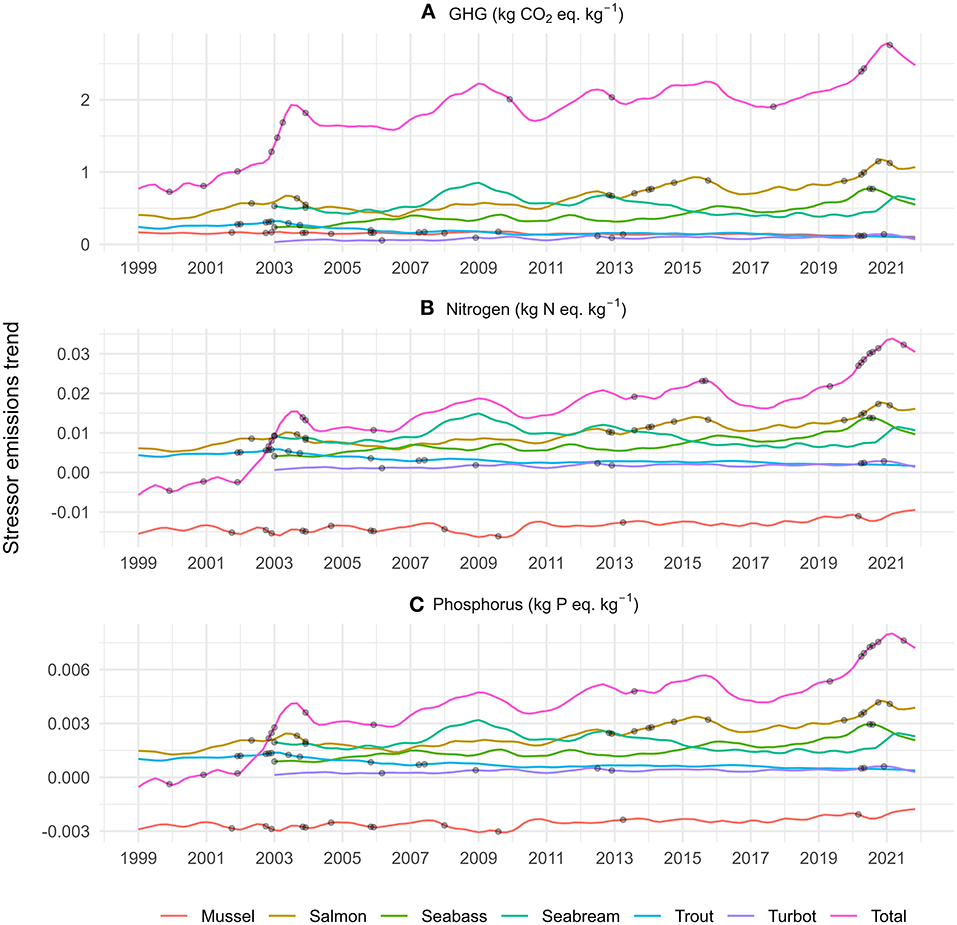
Figure 6. Deseasonalised time series (1999–2021) of stressor emissions: (A) greenhouse gas (GHG), (B) nitrogen, and (C) phosphorus associated with monthly consumption (kg per capita) of farmed species. Black dots denote anomalies detected with generalized extreme studentised deviate.
Discussion
Blue foods are a sustainable source of protein, crucial to meet global food demand. As an essential contributor to food and nutrition security, aquatic food systems must maintain biodiversity and ecosystem services while producing plentiful, nutritious, and safe foods (FAO, 2022). Consumption choices provide an excellent opportunity for citizens to reduce the environmental burden associated with food production systems. Here we used a high-resolution Spanish consumption dataset, spanning 22 years, as a study case to identify long-term consumption trends that translate into distinct patterns of environmental performance due to differences in the ecological footprint of each product. Our analyses evidenced declining trends in the consumption of blue foods from wild and mixed sources in the last two decades. In contrast, for farmed species, there was a pronounced increase in the consumption of carnivorous fish and a decrease in the consumption of mussels. These patterns translate into contrasting stressor emissions, with high trophic-level species responsible for a large share of stressor emissions. The consumption of imported salmon was associated with stressor emissions nearly an order of magnitude higher than the best-performing blue food, mussels. Our results show that consumer choices of blue foods of different sources, species, and origins are associated with disparate environmental footprints. They also evidenced that consumption trends in developed countries, such as Spain, may not be sustainable compared to diets based on the consumption of low trophic-level blue foods, such as bivalves and algae.
Trends in blue food consumption
Global blue food production in 2020 was estimated at 178 million tons, out of which aquaculture accounted for 49.2% of the production and contributed to more than 50% of fish for human consumption (FAO, 2022). At a European level, wild fisheries in 2019 provided a substantially higher proportion (76%) of fish supply (EUMOFA, 2021). Spanish consumption patterns follow a similar pattern, with blue food sourced from a combination of wild fisheries and aquaculture the most consumed, followed by foods obtained exclusively from wild and farmed sources. The most common were fresh molluscs and crustaceans (except mussels), although these estimates might be skewed, given these blue foods' comparatively smaller edible portions. For example, the edible portion of fresh bivalves is only ca. 20%, compared to ca. 60% for fish (Gephart et al., 2021). Consumption of wild blue foods was dominated by hake and tuna. Hake is traditionally the favorite fish of the Spaniards, accounting for 12% of all blue food consumption across the study period. This high demand and the fact that most European hake stocks are over-exploited have triggered a global trade of other hake species, which has caused a significant rise in prices (Asche and Guillen, 2012). This price hike may partly explain the sharp decline in hake consumption over the last two decades. Hake consumption was followed by canned tuna, another central item of the Spanish diet. Tuna consumption has steadily risen over the previous two decades, supporting Spanish tuna canneries that lead European production (68%) and rank second worldwide (García-del-Hoyo et al., 2017). Another essential wild blue food category was small pelagic fish, including anchovies, sardines, and mackerel, to a lesser extent. The consumption of all these low trophic-level species has declined over the years. These species not only represent examples of mostly sustainable fisheries associated with low stressor emissions (Gephart et al., 2021) but also provide the greatest nutritional quality across all forms of aquatic foods (Bianchi et al., 2022; Koehn et al., 2022). Therefore, this shift in consumption trends of wild fish species should significantly affect their ecological footprint and fisheries sustainability.
Regarding farmed species, mussels and salmon were the most popular species, providing specific examples of consumption and production patterns. Mussels are locally produced; salmon is exclusively imported. Mussels are a low trophic-level species extensively farmed that rely on natural resources for food, spat and space; salmon is an intensively farmed high trophic-level species that requires a considerable amount of feed inputs. During the last two decades, mussel consumption has steadily declined, while the consumption of salmon has increased considerably. The introduction and rapid expansion of salmon aquaculture in the mid-1980s have transformed the global blue food market. As a leading consumer, Spain has experienced a significant surge in salmon supply and demand. These changes in the market landscape have led to an increased supply and consequent consumption of salmon in Spain, to the detriment of the consumption of traditional (wild-caught) and farmed species, including mussels (Jaffry et al., 2000). Similarly, the development of seabream and seabass aquaculture helped to shape these changes in the blue food market and consumption patterns. However, the consumption of seabream and seabass has been more variable over time as a reflection of market availability due to fluctuations in production caused by massive escape events, COVID-19, and disease outbreaks (Arechavala-Lopez et al., 2018; Sánchez-Jerez et al., 2022). The consumption of rainbow trout, the only inland blue food locally produced, showed a steady decline over time. Despite that consumption of farmed species was comparatively lower than wild and mixed blue foods, with clear species-dependent trends over the last two decades, it is expected that the overall consumption of farmed species will increase in the foreseeable future as a result of limited wild fisheries supply (Naylor et al., 2021b).
The above-described consumption patterns for farmed species evidenced the “farming-up” effect experienced by the aquaculture industry (Stergiou et al., 2009). The growing demand for medium and high-trophic-level species has sustained an increasing production of carnivorous species, which requires large amounts of animal feed derived from small pelagic fish (Naylor et al., 2000; Naylor and Burke, 2005). The growing demand for carnivorous fish raises ecological and socioeconomic concerns. Large quantities of wild fish suitable for human consumption are turned into animal feed to produce relatively small amounts of fish destined for affluent consumers (Stergiou et al., 2009; Belton et al., 2020). Thus, the role of carnivorous fish aquaculture in food security has been criticized for being a net fish consumer (Naylor and Burke, 2005). However, advances in fish nutrition, genetics, and alternative feed types have significantly reduced the reliance on wild fish for feed formulation in recent years, which has improved the sustainability and the integration of the industry into the global food system (Naylor et al., 2021a). While these new feed sources reduce dependence on wild-caught fish, they also put pressure on terrestrial resources, which face climate change and increasing demand (Blanchard et al., 2017; Cottrell et al., 2018; Zhang et al., 2022). Nevertheless, promoting the consumption of low trophic-level and non-fed farmed species, such as bivalves and seaweeds, can benefit a wide range of food systems, ecosystem services and the overall environmental performance of blue food production.
Contrary, the consumption of wild and mixed seafood notoriously declined over time since 2008, with a change in trend direction that coincided with the 2008 economic recession. Spain was a notorious example of the economic impacts of the 2008 recession, which had cascading effects on food systems and dietary intake (Jenkins et al., 2021). It is typical for low-income consumers often reduce overall food consumption and switch from high- to low-quality starchy staples in response to rising prices and declining purchasing power (Naylor et al., 2021b). This downward trend contradicts the rise in seafood consumption reported for other regions of the world, based on apparent consumption (EUMOFA, 2021) and does not fit with the predicted increase in consumption for most world regions, including Spain, based on economic indicators (Naylor et al., 2021b). These discrepancies highlight the importance of high-resolution national-level data measured by dietary intake instead of apparent consumption deducted from production and trade metrics. It also highlights that other complex and unpredictable factors can drive consumption patterns, such as the COVID-19 pandemic, which coincided with a prominent temporal peak in consumption across most time series during 2020. This increase was most likely the result of closures in the hospitality sector during the pandemic and the consequent increase in “at-home” consumption. The pandemic had widespread consequences not only for aquaculture (Sánchez-Jerez et al., 2022; Sarà et al., 2022) and fisheries production (Bennett et al., 2020; FAO, 2020b; Campbell et al., 2021) but also for seafood consumption patterns (Love et al., 2021; White et al., 2021). The fact that food production systems are already subjected to a multitude of stressors, in most cases modulated by the overarching effects of climate change, underlines the need for more resilient adaptation programs and recovery plans for the industry (Sánchez-Jerez et al., 2022).
Trends in blue food stressor emissions
Food production has an enormous environmental impact. It causes 35% of global GHG emissions (Xu et al., 2021), is responsible for 78% of the worldwide ocean and freshwater eutrophication (Poore and Nemecek, 2018) and uses 70% of global freshwater for agriculture (FAO, 2011). From a conservation perspective, wild-sourced blue foods are rarely sustainable; despite that several ecolabelling schemes to promote their sustainability (Ministerio de Agricultura, 2012), most fisheries are over-exploited and have significant impacts on biodiversity (Pauly et al., 1998, 2002; Thrush et al., 2015). In addition, most contribute significantly to GHG emissions through fuel use Gephart et al., 2021). Although aquaculture is among the most sustainable forms of animal production systems, it still faces considerable challenges that undermine its environmental performance. Here we focused on nutrients and GHG emissions. However, other aquaculture-related stressors include diseases transmission (Naylor and Burke, 2005), antibiotic loads (Schar et al., 2020), habitat destruction (Ahmed and Thompson, 2019), and risks associated with fish escapes (Naylor et al., 2001; Atalah and Sanchez-Jerez, 2020), among others (Naylor and Burke, 2005). Feeding is the most significant contributor to both nutrient emissions and the carbon footprint associated with the production of carnivorous fish. For nutrient emissions, uneaten feed and fish waste (feces and excretions) are additional related sources. Intensive aquaculture is invariably associated with nutrient enrichment, often leading to anoxic and azoic conditions in adjacent habitats (Holmer et al., 2005). Because of the significant feed dependency, greenhouse gas emissions followed a similar pattern. Not surprisingly, the consumption of carnivorous fish raised in sea-pen systems, such as salmon, seabass, and seabream, was associated with high emissions, with salmon emissions displaying a clear upward trend. Although seabream and seabass production is related to higher nutrient emissions than salmon, their relatively lower consumption led to comparably minor emissions. European seabass and seabream cage farms in the Mediterranean typically have feed conversion ratios around 2:1, although they can reach a maximum of 3:1 during winter and spawning times (Sadek et al., 2004). These ratios are very low compared to those for Atlantic salmon and rainbow trout, which can be as high as 1:1 (Fry et al., 2018) and partly explain the differences in production emissions. Although a large proportion of turbot and virtually all trout are raised in land-based systems that use feed more efficiently, which in turn reduces the generation of excess wastes, they still can generate considerable nutrient emissions that, if released in an uncontrolled manner, can impact aquatic ecosystems.
Transport was also a major contributor to greenhouse gas emissions. This contrast with other production systems, where transport typically accounts for less than ca. 5% of GHG emissions (Poore and Nemecek, 2018; Sandström et al., 2018). Aquaculture GHG emissions are modest compared to those for terrestrial livestock production, mainly due to the absence of enteric CH4 and the relatively low feed conversion ratios of finfish and shellfish (MacLeod et al., 2020). Frozen and fresh blue foods' carbon footprints were similar. Frozen foods are more efficient to transport as they do not need ice; hence, more can be loaded per truck or container (Ziegler et al., 2013). In the European Union, there is a decreasing trend in its internal production compared to world growth, mainly due to the low development of aquaculture. This implies the need to import large quantities of aquatic products each year, some 9.4 million tons in 2019 (0.2% more than in 2018) and 3.1% more than the average since 2011. For example, nearly half of all seabass and seabream consumed in Spain over the study period were imported from other countries. In 2020 only 26% of all consumed seabream was locally produced. The reliance on imported produce to satisfy local demand, facilitated by the market globalization of blue foods, highlights the significant impacts on the environmental performance of blue foods (Guillen et al., 2019).
Across all species, consumption of locally farmed bivalves was associated with the lowest stressor emission, providing an example of “net-zero” blue food. Spain is the largest mussel producer in Europe, supplying nearly all the demand for mussels. Shellfish farming provides vital ecosystem services such as sequestering nutrients and suspended particulate matter (Suplicy, 2020). Bivalve filtering converts phytoplankton and particulate organic matter into bivalve tissue (Petersen et al., 2016). Nutrients are then extracted from the coastal environment when mussels are harvested. In addition, higher denitrification rates underneath and near mussel farms contribute to nitrogen loss into the atmosphere (Lindahl, 2011; Petersen et al., 2019). In terms of GHG emissions, despite that shell-formation sequester dissolved inorganic carbon into a particulate form, it also tends to release more CO2 into the atmosphere (Martini et al., 2022). Thus, mussel aquaculture is considered a net source of CO2, with a lower carbon footprint than other local marine products (Iribarren et al., 2010).
Final remarks and recommendations
Blue foods play a vital role in world food security and economic and social development, with a much lower environmental cost and increased benefits than other animal protein sources for human consumption. Given the projected near doubling of global blue food demand by mid-century and the exponential growth in production needed to meet this demand, political consumerism affecting consumers' choices can play a crucial role in ensuring sustainable production practices. For that, lines of political actions that promote the climate empowerment of consumers, in consonance with the recommendation of the United Nations Framework Convention on Climate Change, are required to denote work under Article 6 of the Convention (1992) and Article 12 of the Paris Agreement, related to Action for Climate Empowerment. The most meaningful change people can make to reduce food-related stressor emissions is to consume less animal protein. However, switching to diets based on more sustainable foods could be nearly as effective as going vegetarian (Springmann et al., 2016). For example, carbon emissions associated with wild blue foods are six times lower than beef (Gephart et al., 2021). Moreover, moving from a carnivorous fish diet to a mussel diet could reduce stressor emissions by nearly an order of magnitude. Favoring local over imported seabream and seabass could reduce GHG emissions by a third, while choosing locally produced trout reduced them by two-thirds. Similar gains could be accomplished by favoring sustainable wild-caught blue food, such as anchovies and sardines, over carnivorous fish, shrimps, or prawns. Aquaculture holds the potential to improve the sustainability of diets; however, the vast differences in the environmental performance of various types of farmed species need to be considered for it to reach its full potential. According to consumption and emissions trends, we recommend targeting species and production methods that perform better in nutrition and climate, as well as reducing emissions. For fed finfish aquaculture, this includes sourcing feed and juveniles from local facilities, reducing feed conversion ratios, optimizing feed use to minimize waste, and farm spatial planning that minimizes impacts on blue carbon habitats (Jones et al., 2022). Policy efforts should focus on promoting education and awareness to encourage more sustainable and healthy consumption patterns, food labeling and accreditations schemes to help identify sustainable products (e.g., ISO 14067:2018) and reduce blue food and packaging waste to improve the environmental footprint of citizens' diets. Besides the vast potential of blue foods, future development of production systems must be based on the sustainable use of natural resources that minimize potential environmental impacts and promote climate change mitigation.
Data availability statement
The datasets presented in this study can be found in online repositories. The names of the repository/repositories and accession number(s) can be found below: https://doi.org/10.5281/zenodo.7257689.
Author contributions
JA: conceptualization, investigation, methodology, project administration, formal analysis, visualization, writing—original draft preparation, and writing—reviewing and editing. PS-J: conceptualization, investigation, writing—original draft preparation, and writing—reviewing and editing. Both authors contributed to the article and approved the submitted version.
Funding
Research reported in this publication was supported by a Maria Zambrano Grant awarded to JA, financed by the Spanish Government through the European Union NextGenerationEU fund. This study forms part of the ThinkInAzul programme and was supported by MCIN with funding from European Union NextGenerationEU (PRTR-C17.I1) and by Generalitat Valenciana (THINKINAZUL/2021/044-TOWARDS).
Conflict of interest
The authors declare that the research was conducted in the absence of any commercial or financial relationships that could be construed as a potential conflict of interest.
Publisher's note
All claims expressed in this article are solely those of the authors and do not necessarily represent those of their affiliated organizations, or those of the publisher, the editors and the reviewers. Any product that may be evaluated in this article, or claim that may be made by its manufacturer, is not guaranteed or endorsed by the publisher.
Supplementary material
The Supplementary Material for this article can be found online at: https://www.frontiersin.org/articles/10.3389/fsufs.2022.994840/full#supplementary-material
References
Ahmed, N., and Thompson, S. (2019). The blue dimensions of aquaculture: a global synthesis. Sci. Total Environ. 652, 851–861. doi: 10.1016/j.scitotenv.2018.10.163
APROMAR (2021). Aquaculture in Spain. Ministerio de Agricultura, Alimentación y Medio Ambiente, Gobierno de España, 111. Available online at https://apromar.es/wp-content/uploads/2022/04/Informe_La_Acuicultura_en_Espana_2021_APROMAR.pdf (accessed May 1, 2022).
Arechavala-Lopez, P., Toledo-Guedes, K., Izquierdo-Gomez, D., Šegvi, ć-, Bubić, T, and Sanchez-Jerez, P. (2018). Implications of sea bream and sea bass escapes for sustainable aquaculture management: a review of interactions, risks and consequences. Rev. Fisheries Sci. Aquacult. 26, 214–234. doi: 10.1080/23308249.2017.1384789
Asche, F., and Guillen, J. (2012). The importance of fishing method, gear and origin: the Spanish hake market. Marine Policy 36, 365–369. doi: 10.1016/j.marpol.2011.07.005
Atalah, J., and Sanchez-Jerez, P. (2020). Global assessment of ecological risks associated with farmed fish escapes. Global Ecol. Conserv. 20, e00842. doi: 10.1016/j.gecco.2019.e00842
Belton, B., Little, D. C., Zhang, W., Edwards, P., Skladany, M., and Thilsted, S. H. (2020). Farming fish in the sea will not nourish the world. Nat. Commun. 11, 1–8. doi: 10.1038/s41467-020-19679-9
Bennett, N. J., Finkbeiner, E. M., Ban, N. C., Belhabib, D., Jupiter, S. D., Kittinger, J. N., et al. (2020). The COVID-19 pandemic, small-scale fisheries and coastal fishing communities. Coast. Manage. 48, 336–347. doi: 10.1080/08920753.2020.1766937
Bianchi, M., Hallström, E., Parker, R. W., Mifflin, K., Tyedmers, P., and Ziegler, F. (2022). Assessing seafood nutritional diversity together with climate impacts informs more comprehensive dietary advice. Commun. Earth Environ. 3, 1–12. doi: 10.1038/s43247-022-00516-4
Blanchard, J. L., Watson, R. A., Fulton, E. A., Cottrell, R. S., Nash, K. L., Bryndum-Buchholz, A., et al. (2017). Linked sustainability challenges and trade-offs among fisheries, aquaculture and agriculture. Nat. Ecol. Evol. 1, 1240–1249. doi: 10.1038/s41559-017-0258-8
Boettiger, C., Lang, D. T., and Wainwright, P. (2012). rfishbase: exploring, manipulating and visualizing FishBase data from R. J. Fish Biol. 81, 2030–2039. doi: 10.1111/j.1095-8649.2012.03464.x
Boyd, C. E., McNevin, A. A., and Davis, R. P. (2022). The contribution of fisheries and aquaculture to the global protein supply. Food Secur. 22, 9. doi: 10.1007/s12571-021-01246-9
Campbell, S. J., Jakub, R., Valdivia, A., Setiawan, H., Setiawan, A., Cox, C., et al. (2021). The immediate impact of COVID-19 across tropical small-scale fishing communities. Ocean Coast. Manage. 200, 105485. doi: 10.1016/j.ocecoaman.2020.105485
Cottrell, R. S., Fleming, A., Fulton, E. A., Nash, K. L., Watson, R. A., and Blanchard, J. L. (2018). Considering land-sea interactions and trade-offs for food and biodiversity. Glob. Change Biol. 24, 580–596. doi: 10.1111/gcb.13873
Cranford, P. J. (2019). “Magnitude and extent of water clarification services provided by bivalve suspension feeding,” in Goods and Services of Marine Bivalves, eds Smaal AC, Ferreira JG, Grant J, Petersen JK, Strand Ø. (Cham: Springer International Publishing), pp. 119–141.
EUMOFA (2021). The EU Fish Market. European Commission. European Market Observatory for Fisheries and Aquaculture Products. Available online at: https://www.eumofa.eu/market-analysis#yearly (accessed May 1, 2022).
FAO (2011). The State of the World's Land and Water Resources for Food and Agriculture (SOLAW)—Managing Systems at Risk. London: Food and Agriculture Organization of the United Nations, Rome and Earthscan.
FAO (2018). “Fishery and Aquaculture Statistics. Global aquaculture production 1950-2016 (FishstatJ),” in FAO Fisheries and Aquaculture Department [online]. Rome. Updated (2018). Available online at: http://www.fao.org/faostat/en/#home (accessed May 1, 2022).
FAO (2020a). New Food Balances. Available online at: http://www.fao.org/faostat/en/#data/FBS (accessed May 1, 2022).
FAO (2020b). Summary of the Impacts of the COVID-19 Pandemic on the Fisheries and Aquaculture Sector. FAO Rome, Italy (accessed May 1, 2022).
FAO (2022). The State of World Fisheries and Aquaculture (2022). Towards Blue Transformation. FAO: Rome.
Froese, R., and Pauly, D. (2022). FishBase. London: World Wide Web electronic publication. Available online at: www.fishbase.org (accessed May 1, 2022).
Fry, J. P., Mailloux, N. A., Love, D. C., Milli, M. C., and Cao, L. (2018). Feed conversion efficiency in aquaculture: do we measure it correctly? Environ. Res. Lett. 13, 024017. doi: 10.1088/1748-9326/aaa273
García-del-Hoyo, J. J., Jiménez-Toribio, R., and Guillotreau, P. (2017). A demand analysis of the Spanish canned tuna market. Marine Policy 86, 127–133. doi: 10.1016/j.marpol.2017.09.014
Garlock, T., Asche, F., Anderson, J., Ceballos-Concha, A., Love, D. C., Osmundsen, T. C., et al. (2022). Aquaculture: the missing contributor in the food security agenda. Global Food Secur. 32, 100620. doi: 10.1016/j.gfs.2022.100620
Gephart, J. A., Henriksson, P. J. G., Parker, R. W. R., Shepon, A., Gorospe, K. D., Bergman, K., et al. (2021). Environmental performance of blue foods. Nature 597, 360–365. doi: 10.1038/s41586-021-03889-2
Gephart, J. A., and Pace, M. L. (2015). Structure and evolution of the global seafood trade network. Environ. Res. Lett. 10, 125014. doi: 10.1088/1748-9326/10/12/125014
Guillen, J., Natale, F., Carvalho, N., Casey, J., Hofherr, J., Druon, J.-N., et al. (2019). Global seafood consumption footprint. Ambio 48, 111–122. doi: 10.1007/s13280-018-1060-9
Holmer, M., Wildish, D., and Hargrave, B. (2005). “Organic enrichment from marine finfish aquaculture and effects on sedimentbiogeochemical processes,” in Environmental Effects of Marine Finfish Aquaculture, ed Hargrave, B. T. (Berlin, Heidelberg: Springer Berlin Heidelberg), p. 181–206.
Iribarren, D., Vázquez-Rowe, I., Hospido, A., Moreira, M. T., and Feijoo, G. (2010). Estimation of the carbon footprint of the Galician fishing activity (NW Spain). Sci. Total Environ. 408, 5284–5294. doi: 10.1016/j.scitotenv.2010.07.082
Jaffry, S., Pascoe, S., Taylor, G., and Zabala, U. (2000). Price interactions between salmon and wild-caught fish species on the Spanish market. Aquacult. Econ. Manage. 4, 157–167. doi: 10.1080/13657300009380267
Jenkins, R. H., Vamos, E. P., Taylor-Robinson, D., Millett, C., and Laverty, A. A. (2021). Impacts of the (2008). Great Recession on dietary intake: a systematic review and meta-analysis. Int. J. Behav. Nutri. Physic. Activ. 18, 57. doi: 10.1186/s12966-021-01125-8
Jones, A. R., Alleway, H. K., McAfee, D., Reis-Santos, P., Theuerkauf, S. J., and Jones, R. C. (2022). Climate-friendly seafood: the potential for emissions reduction and carbon capture in marine aquaculture. Bioscience. 72, 123–143. doi: 10.1093/biosci/biab126
Koehn, J. Z., Allison, E. H., Golden, C. D., and Hilborn, R. (2022). The role of seafood in sustainable diets. Environ. Res. Lett. 17, 035003. doi: 10.1088/1748-9326/ac3954
Lindahl, O. (2011). “Mussel farming as a tool for re-eutrophication of coastal waters: experiences from Sweden,” in Shellfish Aquaculture and the Environment, ed Shumway, S. E. (London: John Wiley and Sons), p. 217–237.
Love, D. C., Allison, E. H., Asche, F., Belton, B., Cottrell, R. S., Froehlich, H. E., et al. (2021). Emerging COVID-19 impacts, responses, and lessons for building resilience in the seafood system. Global Food Secur. 28, 100494. doi: 10.1016/j.gfs.2021.100494
MacLeod, M. J., Hasan, M. R., Robb, D. H., and Mamun-Ur-Rashid, M. (2020). Quantifying greenhouse gas emissions from global aquaculture. Scientific Rep. 10, 1–8. doi: 10.1038/s41598-020-68231-8
Martini, A., Calì, M., Capoccioni, F., Martinoli, M., Pulcini, D., Buttazzoni, L., et al. (2022). Environmental performance and shell formation-related carbon flows for mussel farming systems. Sci. Total Environ. 831, 154891. doi: 10.1016/j.scitotenv.2022.154891
Ministerio de Agricultura, A. M. A. (2012). Guía de requerimientos en las certificaciones en el sector pesquero. Madrid. 21 pp. Available online at: https://www.mapa.gob.es/es/pesca/temas/calidad-seguridad-alimentaria/10-Guia_Certif-Pesquero_tcm7-248624_tcm30-285795.pdf (accessed May 1, 2022).
Naylor, R., and Burke, M. (2005). Aquaculture and ocean resources: raising tigers of the sea. Ann. Rev. Environ. Resour. 30, 185–218. doi: 10.1146/annurev.energy.30.081804.121034
Naylor, R. L., Goldburg, R. J., Primavera, J. H., Kautsky, N., Beveridge, M. C., Clay, J., et al. (2000). Effect of aquaculture on world fish supplies. Nature 405, 1017. doi: 10.1038/35016500
Naylor, R. L., Hardy, R. W., Buschmann, A. H., Bush, S. R., Cao, L., Klinger, D. H., et al. (2021a). A 20-year retrospective review of global aquaculture. Nature 591, 551–563. doi: 10.1038/s41586-021-03308-6
Naylor, R. L., Kishore, A., Sumaila, U. R., Issifu, I., Hunter, B. P., Belton, B., et al. (2021b). Blue food demand across geographic and temporal scales. Nat. Commun. 12, 5413. doi: 10.1038/s41467-021-26063-8
Naylor, R. L., Williams, S. L., and Strong, D. R. (2001). Aquaculture—a gateway for exotic species. Science 294, 1655–1656. doi: 10.1126/science.1064875
Paul, S. R., and Fung, K. Y. (1991). A generalized extreme studentized residual multiple-outlier-detection procedure in linear regression. Technometrics 33, 339–348. doi: 10.1080/00401706.1991.10484839
Pauly, D., Christensen, V., Dalsgaard, J., Froese, R., and Torres, F. (1998). Fishing down marine food webs. Science 279, 860–863. doi: 10.1126/science.279.5352.860
Pauly, D., Christensen, V., Guénette, S., Pitcher, T. J., Sumaila, U. R., Walters, C. J., et al. (2002). Towards sustainability in world fisheries. Nature 418, 689–695. doi: 10.1038/nature01017
Petersen, J. K., Holmer, M., Termansen, M., and Hasler, B. (2019). “Nutrient extraction through bivalves,” in Goods and Services of Marine Bivalves, eds Smaal, A. C., Ferreira, J. G., Grant, J., Petersen, J. K., Strand, Ø. (Cham: Springer), pp. 179–208.
Petersen, J. K., Saurel, C., Nielsen, P., and Timmermann, K. (2016). The use of shellfish for eutrophication control. Aquacult. Int. 24, 857–878. doi: 10.1007/s10499-015-9953-0
Poore, J., and Nemecek, T. (2018). Reducing food's environmental impacts through producers and consumers. Science 360, 987–992. doi: 10.1126/science.aaq0216
R Core Team. (2022). R: A Language and Environment for Statistical Computing. R Foundation for Statistical Computing, Vienna, Austria. Available online at: https://www.R-project.org/
Sadek, S., Osman, M. F., and Mansour, M. A. (2004). Growth, survival and feed conversion rates of sea bream (Sparus aurata) cultured in earthen brackish water ponds fed different feed types. Aquacult. Int. 12, 409–421. doi: 10.1023/B:AQUI.0000042131.29346.93
Sánchez-Jerez, P., Babarro, J. M. F., Padin, X. A., Longa Portabales, A., Martinez-Llorens, S., Ballester-Berman, J. D., et al. (2022). Cumulative climatic stressors strangles marine aquaculture: ancillary effects of COVID 19 on Spanish mariculture. Aquaculture 549, 737749. doi: 10.1016/j.aquaculture.2021.737749
Sandström, V., Valin, H., Krisztin, T., Havlík, P., Herrero, M., and Kastner, T. (2018). The role of trade in the greenhouse gas footprints of EU diets. Global Food Secur. 19, 48–55. doi: 10.1016/j.gfs.2018.08.007
Sarà, G., Mangano, M. C., Berlino, M., Corbari, L., Lucchese, M., Milisenda, G., et al. (2022). The synergistic impacts of anthropogenic stressors and COVID-19 on aquaculture: a current global perspective. Rev. Fisheries Sci. Aquacult. 30, 123–135. doi: 10.1080/23308249.2021.1876633
Schar, D., Klein, E. Y., Laxminarayan, R., Gilbert, M. P. T, and Van, B. (2020). Global trends in antimicrobial use in aquaculture. Scientific Rep. 10, 21878. doi: 10.1038/s41598-020-78849-3
Springmann, M., Godfray, H. C. J., Rayner, M., and Scarborough, P. (2016). Analysis and valuation of the health and climate change cobenefits of dietary change. Proceed. Nat. Acad. Sci. 113, 4146–4151. doi: 10.1073/pnas.1523119113
Stergiou, K. I., Tsikliras, A. C., and Pauly, D. (2009). Farming up Mediterranean food webs. Conserv. Biol. 23, 230–232. doi: 10.1111/j.1523-1739.2008.01077.x
Sumaila, U. R., Bellmann, C., and Tipping, A. (2016). Fishing for the future: an overview of challenges and opportunities. Marine Policy 69, 173–180. doi: 10.1016/j.marpol.2016.01.003
Suplicy, F. M. (2020). A review of the multiple benefits of mussel farming. Rev. Aquacult. 12:204–223. doi: 10.1111/raq.12313
Teh, L. C. L., and Sumaila, U. R. (2013). Contribution of marine fisheries to worldwide employment. Fish Fisher. 14, 77–88. doi: 10.1111/j.1467-2979.2011.00450.x
Thrush, S. F., Ellingsen, K. E., and Davis, K. (2015). Implications of fisheries impacts to seabed biodiversity and ecosystem-based management. ICES J. Marine Sci. 73, i44–i50. doi: 10.1093/icesjms/fsv114
Tigchelaar, M., Leape, J., Micheli, F., Allison, E. H., Basurto, X., Bennett, A., et al. (2022). The vital roles of blue foods in the global food system. Global Food Secur. 33, 100637. doi: 10.1016/j.gfs.2022.100637
Tilman, D., and Clark, M. (2014). Global diets link environmental sustainability and human health. Nature 515, 518–522. doi: 10.1038/nature13959
White, E. R., Froehlich, H. E., Gephart, J. A., Cottrell, R. S., Branch, T. A., Agrawal Bejarano, R., et al. (2021). Early effects of COVID-19 on US fisheries and seafood consumption. Fish Fisher. 22, 232–239. doi: 10.1111/faf.12525
Xu, X., Sharma, P., Shu, S., Lin, T.-S., Ciais, P., Tubiello, F. N., et al. (2021). Global greenhouse gas emissions from animal-based foods are twice those of plant-based foods. Nat. Food 2, 724–732. doi: 10.1038/s43016-021-00358-x
Zhang, W., Belton, B., Edwards, P., Henriksson, P. J., Little, D. C., Newton, R., et al. (2022). Aquaculture will continue to depend more on land than sea. Nature. 603, E2–E4. doi: 10.1038/s41586-021-04331-3
Keywords: farmed seafood, seafood consumption, multiple stressors, aquaculture sustainability, climate change, Spain
Citation: Atalah J and Sanchez-Jerez P (2022) On the wrong track: Sustainable and low-emission blue food diets to mitigate climate change. Front. Sustain. Food Syst. 6:994840. doi: 10.3389/fsufs.2022.994840
Received: 15 July 2022; Accepted: 21 October 2022;
Published: 11 November 2022.
Edited by:
Erick Ochieng Ogello, Maseno University, KenyaReviewed by:
Stuart W. Bunting, Independent Researcher, Sudbury, United KingdomMichelle Tigchelaar, Stanford University, United States
Copyright © 2022 Atalah and Sanchez-Jerez. This is an open-access article distributed under the terms of the Creative Commons Attribution License (CC BY). The use, distribution or reproduction in other forums is permitted, provided the original author(s) and the copyright owner(s) are credited and that the original publication in this journal is cited, in accordance with accepted academic practice. No use, distribution or reproduction is permitted which does not comply with these terms.
*Correspondence: Javier Atalah, ai5hdGFsYWhAdWEuZXM=