Abstract
In the last few decades, the deficiency of sulfur (S) has been noticed in the agricultural soils of India. Meanwhile, researchers reported that S plays a significant role in the productivity of the rice-wheat cropping system (RWCS). For the quantification of S response, a long-term field experiment was started at the Indian Council of Agricultural Research-Indian Institute of Farming Systems Research (ICAR-IIFSR), Modipuram, India. In total, 7 nutrient supply options were applied, i.e., organic, mineral fertilizer in the combination of integrated plant nutrition system (IPNS), and IPNS + berseem (B)/IPNS + cowpea (C) in the S availability of the soil in the RWCS. The results showed that the highest contribution in S availability by the total S (39%) is followed by the organic S (35%), sodium bicarbonate extractable sulfur (NaHCO3-ES; 7%), heat-soluble sulfur (SS; 7%), water-soluble sulfur (WSS; 4%), available S (4%), and inorganic S (4%) under different long-term nutrient supply options of RWCS. The continuous application of organic fertilizer and various IPNS options, such as the inclusion of pulses, significantly improved all S fractions in the soil and also offers an additional benefit in terms of sustainability of production and soil health as compared to the inorganic fertilizer fields. Overall, the results showed that IPNS showed its superiority over the rest of the treatment. The results also supported that the inclusion of pulses gives a further gain in terms of sulfur availability in soil systems under RWCS.
Graphical representation of soil sulphur availability impacted by different nutrient supply options.

Introduction
To attain UN Sustainable Development Goals (UNSDGs) globally, all nations have adopted these targets. To feed the rapidly growing global population, a sustainable food production system is required for confirming the overall development of society (Woolston, 2020). Similarly, sustainable management of the agroecosystem plays a significant role in attaining nutrition security (Singh et al., 2020; Dubey et al., 2021; Rakshit et al., 2022). Sustainable agriculture is also a decisive factor for society in developing nations (www.fao.org). Meanwhile, some of the agricultural activities are negatively affected, such as indiscriminate input use, intensive tillage, and puddled transplanted rice (Eisenstein, 2020).
Nowadays, researchers are giving more emphasis to higher productivity to feed the population with limited resources (Elferink and Schierhorn, 2016). As reported by the Food and Agricultural Organization of the United Nations (FAO), food production must be doubled by the year 2050 to feed a global population (http://www.fao.org) (Food and Agricultural Organization of the United Nations (FAO), 2009). Judicious application of S plays a major role in the growth and development of crops (Figure 1).
Figure 1

Sulfur availability in soils: (i) soil organic matter quantity and quality, (ii) crop selection and cropping system design, (iii) and (iv) biological and biochemical mineralization rates. In addition to soil test S concentrations, these factors should be considered when making fertility recommendations.
Many researchers reported that the S has a significant role in crop production (Jamal et al., 2010; Nazar et al., 2011; Sahota, 2012; Kopriva et al., 2019; Zenda et al., 2021). Sulfur is gaining considerable importance for enhancing crop yields and quality of production in the context of Indian agriculture. Tiwari and Gupta (2006) reported a large gap between the removal (≈1.26 Mt/year) and replacement (0.76 Mt/year) of sulfur in India. Continued depletion of native reserves of S during post-green revolution period has led to its deficiency in many regions of the country. Since the last two decades, S deficiency has been reported globally (Scherer, 2009; Sahota, 2012; Kopriva et al., 2019). Approximately 46% of agricultural soils of India observed S deficiency, and out of them, 30% of soils are potentially deficient (Satyanarayana and Tewatia, 2009).
Worldwide long-term field experiments have been considered as valuable devices for providing information on productivity, profitability, and soil sustainability (Singh et al., 2000; Borase et al., 2020; Sandhu et al., 2020; Dhawan et al., 2021; Singh and Saini, 2021). Nevertheless, knowledge of various forms of S is of much relevance in assessing its long-run use under field conditions.
The supposition set for our study was that the accumulation of different fractions of sulfur might be affected by the various integrated plant nutrition system (IPNS) options in the rice-wheat cropping system (RWCS). To test this hypothesis, the aims of this study were (i) to quantify the IPNS and soil depths on sulfur pools and (ii) to assess the best nutrient supply options and quantitative sulfur status and relationship as compared to unfertilized plot in the long-run under RWCS.
Materials and methods
Site descriptions
The ongoing long-term field experiment (starting year 1998) site of the Indian Council of Agricultural Research-Indian Institute of Farming Systems Research (ICAR-IIFSR) (29°4'N, 77°46'E, 237 m above sea level) was selected (Figure 2). The average monthly minimum (7.2°C) and maximum (20.1°C) temperatures in January and corresponding minimum (24.2°C) and maximum (39.8°C) temperatures in May with an annual rainfall of 823 mm.
Figure 2
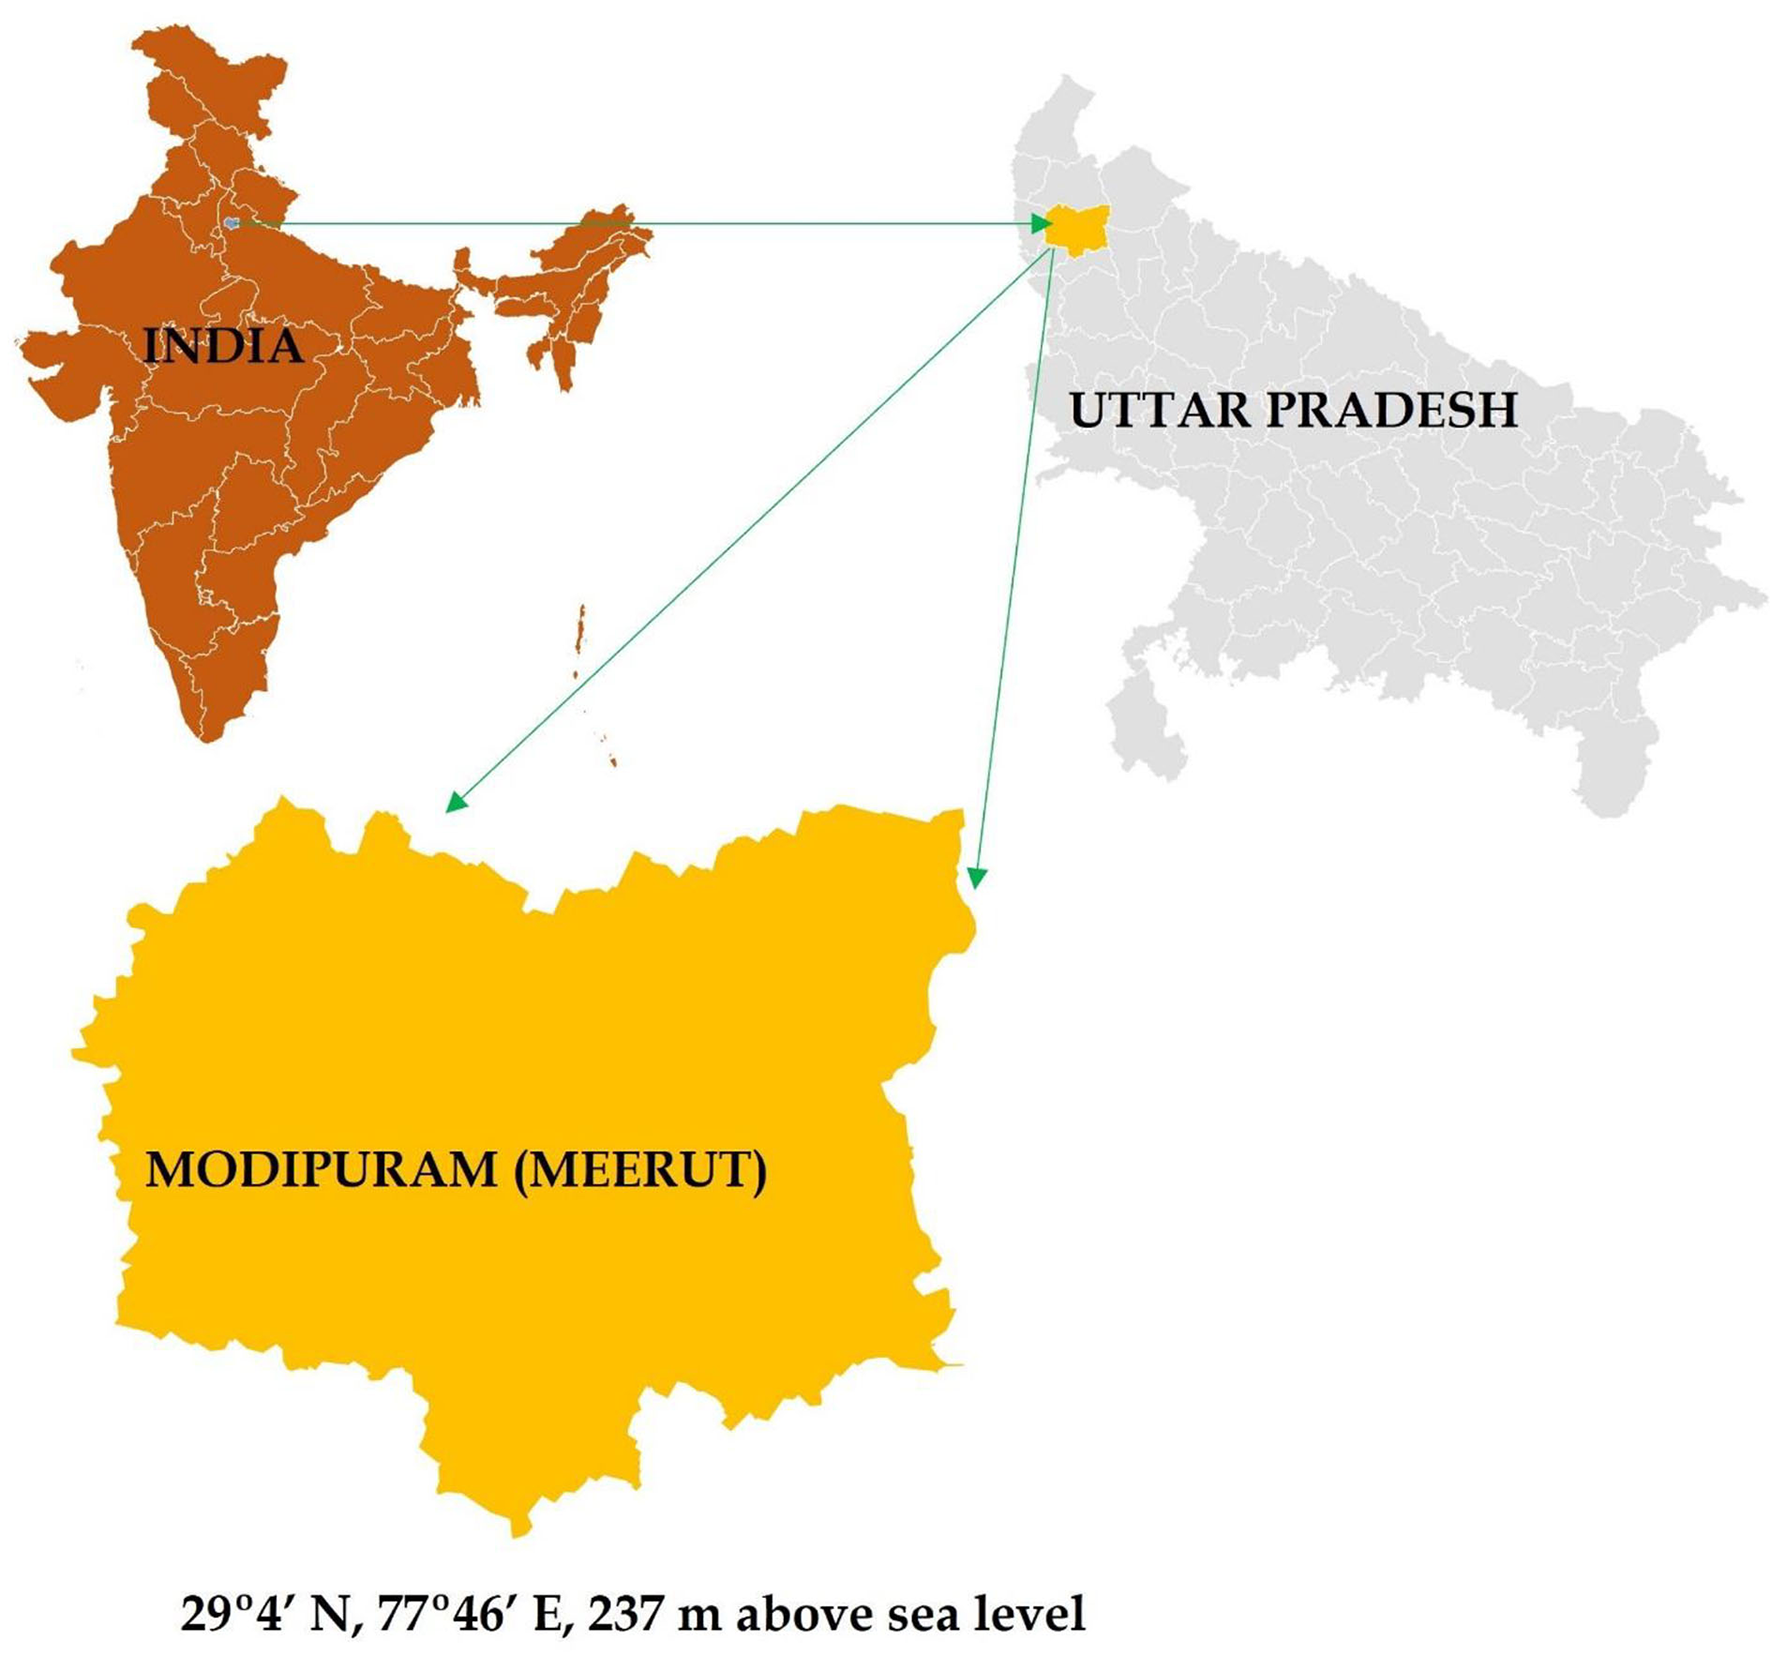
Experimental site of long-term rice-wheat cropping system (RWCS).
Treatments and experimental design
The long-term cropping system experiment involving different nutrient supply options under RWCS is shown in Table 1. The experiment was conducted in large plots (individual plot area 1,000 m2). All treatments were a randomized block design (RBD) and had four replications (Meena et al., 2022). A total of seven nutrient supply option treatments were imposed in the long-term cropping system experiment as T1: control, i.e., no chemical fertilizer or organic manure; T2: recommended fertilizer dose to rice and wheat; T3: soil-test-based fertilizer application in both crops; T4: 75% of recommended N, P, and K through fertilizers + 25% substitution of recommended N through farmyard manure (FYM) in rice and recommended dose of fertilizer (RDF) in wheat crop; T5: 75% of recommended N, P, and K through fertilizers + 25% substitution of recommended N through FYM + every third wheat substituted with berseem (B) for rice and RDF for the wheat crop; T6: 75% of recommended N, P, and K through fertilizers + 25% substitution of recommended N through FYM + every third rice substituted with cowpea (C) for rice and RDF for the wheat crop; and T7: 100% of recommended N, P, and K through organic manures (FYM) in both crops.
Table 1
| Treatment | Treatment details | ||
|---|---|---|---|
| Code | Kharif (rice) | Rabi (wheat) | |
| T1 | Control | Not applied | Not applied |
| T2 | NPK | RDF through fertilizer | RDF through fertilizers |
| T3 | STCR | Fertilizer application based on soil testing results | Fertilizer application based on soil testing results |
| T4 | IPNS | 75% RDF + 25% substitution of recommended N through FYM | RDF through fertilizer |
| T5 | IPNS+B | 75% RDF + 25% substitution of RDN through FYM + every third rabi crop substituted with berseem | RDF through fertilizer |
| T6 | IPNS+C | 75% RDF + 25% substitution of recommended N through FYM + every third kharif crop substituted with cowpea | RDF through fertilizer |
| T7 | OF | 100% RDF through organic manure | 100% RDF through organic manure |
Experimental setup and treatments details for different nutrient supply options.
Soil and data analysis
Soil available and water-soluble sulfur were determined using CaCl2 and NaCl methods, respectively (Chesnin and Yien, 1950; Williams and Steinbergs, 1959). Heat soluble sulfur was determined with 1% NaCl (Williams and Steinbergs, 1959). Sodium bicarbonate extractable sulfur (NaHCO3-ES) was determined with 0.5 M NaHCO3 at a pH of 8.5 (Kilmer and Nearpass, 1960), inorganic and organic S was determined with 0.01 M CaCl2 (Williams and Steinbergs, 1959), and total S concentration was determined by Tabatabai and Bremner (1972), followed by the turbidimetric method of Chesnin and Yien (1950) at 420 nm wavelength by spectrophotometer.
Statistical analysis
The generated data were processed for analysis of variance (ANOVA), and Duncan's multiple range test (DMRT) was used to compare the differences between the means using as applicable to RBD to assess differences among the treatment means as described by Gomez and Gomez (1984). Correlation coefficients were computed using the SPSS program (SPSS version 16) (SPSS 1990).
Results and discussion
Impact on soil available sulfur
The results revealed that the available S significantly varied among the different treatment combinations over the RWCS (Figure 3). It varied from 8.80 to 29.40 and 6.60 to 16.10 mg S kg−1 in the 0–15 and 15–30 cm soil depths, respectively. A significantly greater amount of available S in the surface and subsurface soil (0–15 and 15–30 cm) was maintained with organic farming (OF) management over the rest of the treatment combination (Figure 3). The build-up values of available S in the 0–15 and 15–30 cm depths were 29.10 and 16.10 mg S kg−1 in plots' OF management practices, respectively, against 8.80 and 6.60 mg S kg−1 in both soil test crop response (STCR)- and nitrogen, phosphorous, potassium (NPK)-treated plots, respectively. The available S was increased by ≈30 and 41% in the 0–15 and 15–30 cm soil depths in plots receiving OF management practices, respectively, over the STCR and NPK plots. The available S in the 0–15 cm depth was recorded in the following order: OF (29.40 mg S kg−1) > IPNS (24.10 mg S kg−1) > IPNS + C (22.60 mg S kg−1) > IPNS + B (21.20 mg S kg−1) > control (9.10 mg S kg−1) > STCR (8.80 mg S kg−1) ≥ NPK (8.80 mg S kg−1), and a similar trend was also observed in subsurface soils (Figure 3). The results clearly specify that the integrated use of nutrients has a constructive effect on soil available sulfur, which corresponds to the results presented by other authors (Soaud et al., 2011; Turan et al., 2013; Shi et al., 2016).
Figure 3
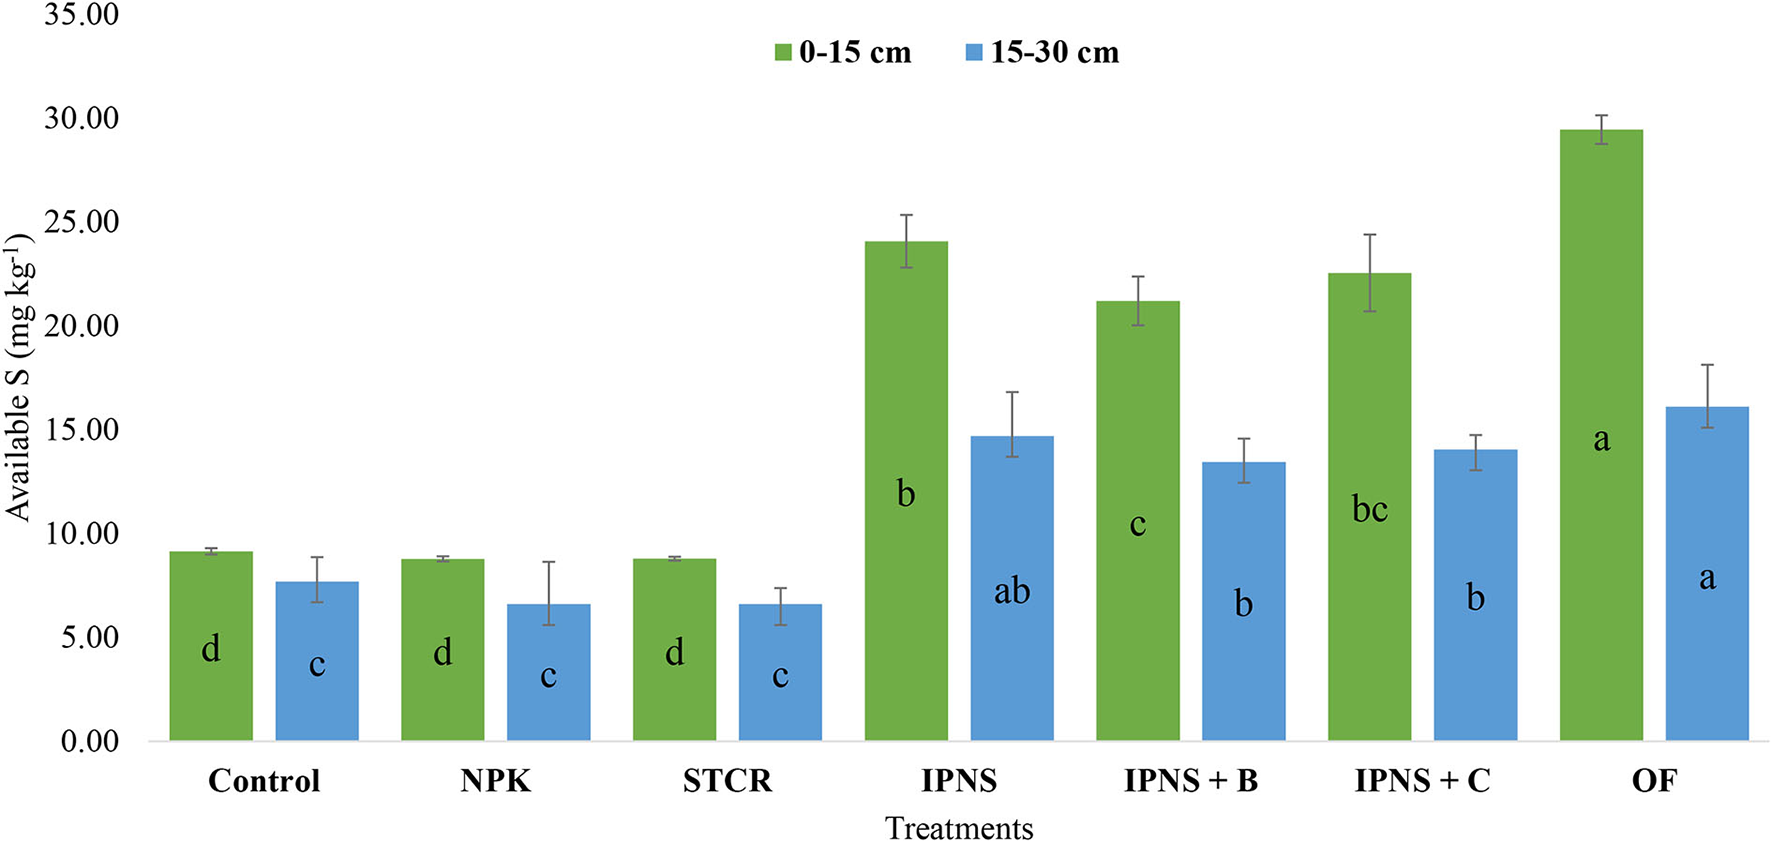
Effect of long-term fertilization on soil available S in the 0–15 and 15–30 cm soil layer of rice-wheat cropping system (RWCS). Means of different treatments followed by the different lower-case letters (a–d) are significantly different at p < 0.05 levels of significance according to Duncan's multiple range test (DMRT).
Impact on water-soluble sulfur
The results indicated that the concentration of WSS significantly varied among the different treatment combinations (Tables 2, 3). Significantly highest WSS was witnessed in plots receiving OF 29.36 (0–15 cm) and 24.11 mg S kg−1 (15–30 cm) soil depths. It was ≈36 and 44% significantly higher as compared to unfertilized control plots under both 0–15 and 15–30 cm soil depths, respectively. In the case of surface soil (0–15 cm soil depth), WSS ranged from 10.60 to 29.36 mg S kg−1 under different long-term nutrient supply options in the RWCS. The maximum WSS was recorded with OF-treated plots (29.36 mg S kg−1) followed by the IPNS + C (24.13 mg S kg−1), IPNS + B (23.94 mg S kg−1), IPNS (19.63 mg S kg−1), STCR (15.98 mg S kg−1), and NPK (15.12 mg S kg−1) plots, and the lowest WSS (10.64 mg S kg−1) was recorded with unfertilized control plots.
Table 2
| Treatment | WSS | Heat SS | NaHCO3 -ES | Total S | Inorganic S | Organic S |
|---|---|---|---|---|---|---|
| ———————————————–mg S kg−1———————————————– | ||||||
| Control | 10.64 ± 0.44f | 20.93 ± 0.65f | 27.91 ± 0.72g | 150.84 ± 4.45f | 9.77 ± 0.61g | 141.07 ± 4.97f |
| NPK | 15.12 ± 0.12e | 31.47 ± 1.94e | 28.72 ± 0.56f | 162.98 ± 3.74e | 12.97 ± 0.26e | 150.01 ± 3.92e |
| STCR | 15.98 ± 0.07d | 32.85 ± 1.66e | 29.66 ± 0.60e | 167.00 ± 7.00e | 12.10 ± 0.19f | 150.68 ± 4.84e |
| IPNS | 19.63 ± 0.09c | 37.87 ± 0.75d | 32.33 ± 0.60d | 179.00 ± 4.88d | 17.41 ± 0.12d | 162.03 ± 4.22d |
| IPNS + B | 23.94 ± 0.05b | 40.41 ± 1.64c | 33.13 ± 0.28c | 195.01 ± 4.10c | 22.10 ± 0.38c | 172.61 ± 4.03c |
| IPNS + C | 24.13 ± 0.11b | 42.74 ± 1.82b | 36.85 ± 0.64b | 208.00 ± 4.01b | 22.98 ± 0.21b | 185.25 ± 7.15b |
| OF | 29.36 ± 0.25a | 45.75 ± 0.58a | 39.69 ± 0.57a | 220.04 ± 6.90a | 25.98 ± 0.23a | 194.07 ± 6.86a |
Impact of long-term integrated plant nutrition system (IPNS) options on soil sulfur fractions in the 0–15 cm soil layer of rice-wheat cropping system (RWCS).
Means of different treatments followed by the different lower-case letters (a–g) are significantly different at p < 0.05 level of significance according to Duncan's multiple range test (DMRT).
Table 3
| Treatment | WSS | Heat SS | NaHCO3 -ES | Total S | Inorganic S | Organic S |
|---|---|---|---|---|---|---|
| ———————————————–mg S kg−1———————————————– | ||||||
| Control | 10.67 ± 1.17d | 29.03 ± 1.69f | 27.08 ± 2.45e | 119.80 ± 2.31e | 8.97 ± 0.63e | 110.83 ± 2.91e |
| NPK | 13.85 ± 2.04c | 32.56 ± 1.54e | 28.93 ± 1.20de | 121.81 ± 2.17e | 11.51 ± 0.94de | 110.30 ± 3.06e |
| STCR | 15.30 ± 0.78c | 34.90 ± 1.05d | 29.50 ± 0.50cd | 126.00 ± 8.30e | 12.10 ± 2.90d | 112.47 ± 3.16e |
| IPNS | 19.60 ± 2.12b | 38.50 ± 1.23c | 31.26 ± 1.64c | 143.01 ± 3.34d | 15.00 ± 1.46c | 128.02 ± 3.47d |
| IPNS + B | 20.44 ± 1.12b | 40.71 ± 1.62b | 31.01 ± 1.59cd | 156.00 ± 2.99c | 19.50 ± 1.69b | 136.71 ± 5.60c |
| IPNS + C | 20.66 ± 0.69b | 42.25 ± 1.41b | 34.76 ± 1.17b | 176.29 ± 4.67b | 21.72 ± 2.03ab | 154.57 ± 5.39b |
| OF | 24.11 ± 2.03a | 48.26 ± 1.61a | 36.89 ± 1.31a | 193.11 ± 9.21a | 24.39 ± 2.50a | 168.72 ± 7.10a |
Impact of long-term integrated plant nutrition system (IPNS) options on soil sulfur fractions in the 15–30 cm soil layers of rice-wheat system.
Means of different treatments followed by the different lower-case letters (a–f) are significantly different at p < 0.05 level of significance according to Duncan's multiple range test (DMRT).
Nevertheless, in the case of subsurface soil (15–30 cm soil depth), it ranged from 10.67 to 24.11 mg S kg−1 among the different nutrient management practices. The amount of WSS in the 15–30 cm soil layer was ~8% lower as compared to surface soil. Significantly highest amount of WSS was recorded in the OF (24.11 mg S kg−1) and the rest of the treatment combination was observed in the following order: IPNS + C (20.66 mg S kg−1), IPNS + B (20.44 mg S kg−1), IPNS (19.60 mg S kg−1), STCR (15.30 mg S kg−1), NPK (13.85 mg S kg−1), and control (10.67 mg S kg−1) plots (Tables 2, 3). The significantly higher content of water-soluble sulfur fraction with the integrated use of fertilizer and manure may be attributed to higher microorganisms in different treatment combinations that resulted in mineralization of organic sulfur to available sulfur (Dutta et al., 2013). Correspondingly, the integrated use of mineral fertilizers might have improved soil nutrient availability (Latare et al., 2014).
Impact on heat soluble sulfur
The results showed that the heat SS content of the soil under different treatments varied from 20.93 to 45.75 mg S kg−1 in surface soil and from 29.03 to 48.26 mg S kg−1 in sub-surface soil (Tables 2, 3). OF maintained higher heat SS (45.75 mg S kg−1) followed by IPNS + C (42.74 mg S kg−1), IPNS + B (40.41 mg S kg−1), IPNS (37.87 mg S kg−1), STCR (32.85 mg S kg−1), NPK (31.47 mg S kg−1), and unfertilized control (20.93 mg S kg−1) plots in surface soil (0–15 cm). Meanwhile, in case of subsurface soil (15–30 cm), significant highest heat SS was reported with OF (48.26 mg S kg−1) followed by IPNS + C (42.25 mg S kg−1), IPNS + B (40.71 mg S kg−1), IPNS (38.50 mg S kg−1), STCR (34.90 mg S kg−1), NPK (32.56 mg S kg−1), and unfertilized control (29.03 mg S kg−1). The plot receiving OF management practices showed its significant superiority by ~ 54 and 40% as compared to control plot. Nevertheless, the levels of heat SS content were lower in surface than subsurface soils (Tables 2, 3). Application of IPNS increased heat soluble sulfur fraction as compared to control (no fertilizer application), which was released with heat treatment (Bediger et al., 1985; Dutta et al., 2013).
Impact on NaHCO3-ES
Data revealed that the NaHCO3-ES concentration was significantly highest under OF at 39.69 and 36.89 mg S kg−1 in the 0–15 and 15–30 cm soil depths, respectively (Tables 2, 3). The significant variation among different treatments was also noticed in both soil depths. In surface soil, the concentration of NaHCO3-ES was observed in following order: OF (39.69 mg S kg−1) > IPNS + C (36.85 mg S kg−1) > IPNS + B (33.13 mg S kg−1) > IPNS (32.33 mg S kg−1) > STCR (29.66 mg S kg−1) > NPK (28.72 mg S kg−1) > unfertilized control (27.91 mg S kg−1) under RWCS over the period. Similarly, the 15–30 cm soil depth significantly varied from 27.08 to 36.89 mg S kg−1 among different treatment combinations (Tables 2, 3). The maximum NaHCO3-ES was recorded in OF-treated plots (36.89 mg S kg−1) followed by IPNS + C (34.76 mg S kg−1) > IPNS (31.26 mg S kg−1) > IPNS + B (31.01 mg S kg−1) > STCR (29.50 mg S kg−1) > NPK (28.93 mg S kg−1) > unfertilized control (27.08 mg S kg−1) treatments. Both soil depth treatments with OF showed significant superiority over the rest of the treatment combinations under RWCS over the period (Tables 2, 3). The significantly higher concentrations of NaHCO3-ES were found in the treated plot as compared to the unfertilized plot (Dutta et al., 2013).
Impact on inorganic sulfur
A significantly greater amount of inorganic S was maintained in OF treatment over the rest of the treatment combination in both surface and subsurface soil layers (Tables 2, 3). The build-up of inorganic S ranged from 25.98 to 24.39 mg S kg−1 in plots receiving OF against 9.77 and 8.97 mg S kg−1 in unfertilized control plots in surface (0–15 cm) and subsurface (15–30 cm) soil depths, respectively. The inorganic S was increased by ~33 and 37% in plots receiving OF in the 0–15 and 15–30 cm soil depths, respectively, over unfertilized plots. In the case of surface soil (0–15 cm soil depth), inorganic S ranged from 9.77 to 25.98 mg S kg−1 under different nutrient supply options in the RWCS over the periods. The maximum inorganic S was recorded with OF-treated plots (25.98 mg S kg−1) followed by the IPNS + C (22.98 mg S kg−1), IPNS + B (22.10 mg S kg−1), IPNS (17.41 mg S kg−1), NPK (12.97 mg S kg−1), and STCR (12.10 mg S kg−1), and the lowest inorganic S (9.77 mg S kg−1) was recorded with unfertilized control plot (Tables 2, 3).
Nevertheless, in case of subsurface soil (15–30 cm soil depth), it ranged from 8.97 to 24.39 mg S kg−1 among IPNS options. The amount of inorganic S in the 15–30 cm soil layer was ~10% lower as compared to surface soil. The significantly highest amount of inorganic S was recorded in the OF (24.39 mg S kg−1), and the rest of the treatment combination was observed in the following order: IPNS + C > IPNS + B > IPNS > STCR > NPK > unfertilized control plots under RWCS over the periods (Tables 2, 3). A similar trend like WSS was reported in the case of inorganic sulfur, and it might be due to the long-term effect of nutrient supply options that contribute to total sulfur, and in the form of mineralization, it will be available to crops. Kumar et al. (2011) also reported that higher inorganic sulfur was reported in IPNS as compared to control.
Impact on organic sulfur
Organic S is the second largest fraction contribution among all sulfur pools after total sulfur (Tables 2, 3). The results revealed that the concentration of organic S significantly varied among the different treatment options over the periods. It ranged from 141.07 to 194.07 mg S kg−1. It was also observed that the organic S was significantly influenced by different nutrient supply options over the periods, and it was reported in following order: OF (197.07 mg S kg−1) > IPNS + C (185.25 mg S kg−1) > IPNS + B (172.61 mg S kg−1) > IPNS (162.03 mg S kg−1) > STCR (150.68 mg S kg−1) > NPK (150.01 mg S kg−1) > unfertilized control (141.07 mg S kg−1) plots. Similarly, the 15–30 cm soil depth significantly varied from 110.83 to 168.72 mg S kg−1 among different treatment combinations (Tables 2, 3). A similar trend was observed in the subsurface (15–30 cm) soil depth. However, the levels of organic S content were lower (−12%) in the subsurface than in the surface soil layer. The organic sulfur is the largest pool among the different pools of sulfur, which accounted for ~90–95% of total sulfur. The lower quantity of organic sulfur in the unfertilized plots might be due to its mining to meet the RWCS supplies (Rongzhong et al., 2010; Dutta et al., 2013).
Impact on total sulfur
The plot with OF indicated its significant superiority over the rest of the treatment combination (Tables 2, 3). Data indicated that the total S significantly highest 0–15 cm (220.04 mg S kg−1) and 15–30 cm (193.11 mg S kg−1) was observed in OF-receiving plot. Total S fractions significantly varied from 150.84 to 220.04 mg S kg−1 among different IPNS options in surface soil. Data affirmed that in surface soil (0–15 cm depth), total S fraction was observed in the following order: OF (220.04 mg S kg−1) > IPNS + C (208 mg S kg−1) > IPNS + B (195.01 mg S kg−1) > IPNS (179 mg S kg−1) > STCR (167 mg S kg−1) > NPK (162.98 mg S kg−1) > unfertilized control (150.84 mg S kg−1).
Nevertheless, in the case of the subsurface soil (15–30 cm depth) layer, the concentration of total S considerably varied from 119.80 to 193.11 mg S kg−1 among different IPNS options over the periods (Tables 2, 3). A significantly higher total S content was recorded with OF observed by the IPNS + C, IPNS + B, IPNS, STCR, NPK, and unfertilized control plots. A plot with OF indicated its significant superiority over the rest of the treatment combinations. The improvement in total soil S may be due to the integrated nutrient supply options (Dutta et al., 2013).
Impact on sulfur fractions contribution
Organic and total sulfur were the dominant fractions of sulfur in both soil layers over the periods (Figures 4, 5). For both soil layers and different treatment combinations, total sulfur contributed the highest 41% in control followed by NPK and STCR 40% each and 38% each in IPNS + B, IPNS + C, and OF (Figure 4). Meanwhile, in the case of 15–30 cm soil layer, the results showed that highest 38% each total sulfur in control, IPNS + C, and OF followed by 37% each total sulfur in NPK, STCR, and IPNS + B, and the lowest total sulfur concentration 36% was reported in IPNS (Figure 5).
Figure 4

Effect of long-term nutrient supply on soil sulfur fractions contribution in the 0–15 cm soil layer of rice-wheat cropping system (RWCS).
Figure 5

Effect of long-term nutrient supply on soil sulfur fractions contribution in the 15–30 cm soil layer of rice-wheat cropping system (RWCS).
Data showed that cumulative results of different sulfur fractions varied in both soil layers among the treatments. Maximum fraction contributions in total S (39%) were followed by the organic S (35%), NaHCO3-ES (7%), heat SS (7%), and 4% each of WSS, available S, and inorganic S in the 0–15 cm soil layer. Nevertheless, in the case of 15–30 cm soil layers, they were reported in the following order: total S > organic S > heat SS > NaHCO3-ES > WSS ≥ inorganic S and available S under different nutrient management practices (Figure 6). IPNS options improve nutrient availabilities (Urkurkar et al., 2010; Subehia et al., 2013).
Figure 6

Effects of long-term nutrient supply on soil sulfur fraction contributions in the 0–15 and 15–30 cm soil layers of rice-wheat cropping system (RWCS).
Relationship between sulfur pools
The relationship between different S pools was significantly influenced by different IPNS options (Table 4). The results showed the positive correlation of available S with WSS (r = 0.905**), heat SS (r = 0.858*), NaHCO3-ES (r = 0.907**), total S (r = 0.892**), inorganic S (r = 0.920**), and (r = 0.897**). In case of WSS, it was significantly correlated with heat SS (r = 0.965**), NaHCO3-ES (r = 0.955**), total S (r = 0.985**), inorganic S (r = 0.985**), and organic S (r = 0.977**). Similarly, heat SS was also positively correlated with NaHCO3-ES (r = 0.898**), total S (r = 0.944**), inorganic S (r = 0.939**), and organic S (r = 0.932**). This remark is in close pact with Borkotoki and Das (2008).
Table 4
| Properties | WSS | Heat SS | NaHCO3-ES | Total S | Inorganic S | Organic S |
|---|---|---|---|---|---|---|
| Available S | 0.905** | 0.858* | 0.907** | 0.892** | 0.920** | 0.897** |
| WSS | 1 | 0.965** | 0.955** | 0.985** | 0.985** | 0.977** |
| Heat SS | 1 | 0.898** | 0.944** | 0.939** | 0.932** | |
| NaHCO3-ES | 1 | 0.983** | 0.954** | 0.988** | ||
| Total S | 1 | 0.986** | 0.998** | |||
| Inorganic S | 1 | 0.983** |
Relationship (r-values) between S-fractions of rice-wheat cropping system.
**Correlation is significant at the 0.01 level (2-tailed).
*Correlation is significant at the 0.05 level (2-tailed).
NS, Non-significant.
Conclusion
Sulfur mining due to the indiscriminate use of mineral fertilizers and manure has encouraged the occurrence of deficiency. The results of this long-run field experiment revealed that the integrated use of nutrients has significantly increased different sulfur pools under RWCS as compared to the unfertilized control plots. They indicated that different treatment combinations had a significant correlation with different pools of sulfur. Significantly, the highest sulfur fraction contributions as total S (39%) followed by the organic S (35%), NaHCO3-ES (7%), heat SS (7%), 4% each of WSS, available S, and inorganic S (4%), meanwhile total S > organic S > heat SS > NaHCO3-ES > WSS ≥ inorganic S and available S under 0–15 and 15–30 cm soil layer, respectively. We recommend that OF treatment combination contributed the highest in different sulfur pools, followed by IPNS treatment under long-run use of RWCS.
Publisher's note
All claims expressed in this article are solely those of the authors and do not necessarily represent those of their affiliated organizations, or those of the publisher, the editors and the reviewers. Any product that may be evaluated in this article, or claim that may be made by its manufacturer, is not guaranteed or endorsed by the publisher.
Statements
Data availability statement
The raw data supporting the conclusions of this article will be made available by the authors, without undue reservation.
Author contributions
SM: investigation, data curation, writing—original draft, and visualization. BD and SD: conceptualization, investigation, and supervision. MM: software, review, editing, and supervision. VS: conceptualization, investigation, methodology, and supervision. RM: methodology, investigation, data curation, and maintenance. DC: methodology, investigation, review, editing, and supervision. AD: software, formal and data analysis, and editing. VM: data curation, writing, review, visualization, and editing. All authors have read and agreed to the published version of the manuscript.
Acknowledgments
The authors thank ICAR-IIFSR, Modipuram for sharing the ongoing long-term experiment.
Conflict of interest
The authors declare that the research was conducted in the absence of any commercial or financial relationships that could be construed as a potential conflict of interest.
- IPNS
integrated plant nutrition system
- IPNS + B
IPNS + berseem
- IPNS + C
IPNS + cowpea
- STCR
soil test crop response
- RDF
recommended dose of fertilizer
- OF
organic farming
- NPK, nitrogen, phosphorous
potassium
- S
sulfur
- UNSDG
UN Sustainable Development Goals
- RBD
Randomized Block Design
- FYM
farmyard manure
- WSS
water-soluble sulfur
- Heat SS
heat soluble sulfur
- NaHCO3-ES
sodium bicarbonate extractable sulfur
- inorganic S
inorganic sulfur
- organic S
organic sulfur
- total S
total sulfur.
Abbreviations
References
1
BedigerM. K.MichaelR.JayaramN.ShivrajB. (1985). Studies on some aspects of soil sulphur and response to sunflower to sulphur application. J. Ind. Soc. Soil Sci.33, 73–77.
2
BoraseD. N.MurugeasnS.NathC. P.HazraK. K.SinghS. S.KumarN.et al. (2020). Long-term impact of grain legumes and nutrient management practices on soil microbial activity and biochemical properties. Arch. Agron. Soil Sci. 14, 2015–2032. 10.1016/j.ecolind.2020.106322
3
BorkotokiB.DasK. N. (2008). Forms of sulphur and their relationship with soil properties in entisols, inceptisols and alfisols of Assam. J. Indian Soc. Soil Sci. 56, 186–191.
4
ChesninL.YienC. H. (1950). Turbidimetric determination of sulphur. Soil Sci. Soc. Am. Pro. 15, 134–136. 10.2136/sssaj1951.036159950015000C0032x
5
DhawanG.DheriG. S.GillA. A. S. (2021). Nitrogen budgeting of rice-wheat cropping system under long-term nutrient management in an inceptisol of north India. Eur. J. Agron. 130, 126376. 10.1016/j.eja.2021.126376
6
DubeyP. K.SinghA.RaghubanshiA.AbhilashP. C. (2021). Steering the restoration of degraded agroecosystems during the United Nations decade on ecosystem restoration. J. Environ. Manag. 280, 111798. 10.1016/j.jenvman.2020.111798
7
DuttaJ.SankhyanN. K.SharmaS. P.SharmaG. D.SharmaS. K. (2013). Sulphur fractions in acid soil continuously fertilized with chemical fertilizers and amendments under maize-wheat system. J. Ind. Soc. Soil Sci. 61, 195–201.
8
EisensteinM. (2020). Natural solutions for agricultural productivity. Nature588, S58–S59. 10.1038/d41586-020-03445-4
9
ElferinkM.SchierhornF. (2016). Global demand for food is rising. Can we meet it. Harv. Bus. Rev. 7, 2–5. Available online at: https://hbr.org/2016/04/global-demand-for-food-is-rising-can-we-meet-it
10
Food Agricultural Organization of the United Nations (FAO) (2009). UNESCO. Global Agriculture Towards Available online at: www.fao.org.
11
GomezK. A.GomezA. A. (1984). Statistical Procedures for Agricultural Research. New York, NY: John Wiley and Sons, 680.
12
JamalA.MoonY.AbdinM. Z. (2010). Sulphur-A general overview and interaction with nitrogen. Aust. J. Crop Sci. 4, 523–529. Available online at: http://www.cropj.com/jamal_4_7_2010_523_529.pdf
13
KilmerV. J.NearpassD. C. (1960). The determination of available sulphur in soils. Proc. Soil Sci. Soc. Am. 24, 337–340. 10.2136/sssaj1960.03615995002400050011x
14
KoprivaS.MalagoliM.TakahashiH. (2019). Sulfur nutrition: impacts on plant development, metabolism, and stress responses. J. Exp. Bot. 70, 4069–4073. 10.1093/jxb/erz319
15
KumarV.PandeyA. K.PrasadR. K.PrasadB. (2011). Long-term influence of organic and inorganic sulphur and fertility levels on yields, distribution and build-up of sulphur under rice-wheat cropping system in Calciorthents. J. Ind. Soc. Soil Sci. 59, 278–282.
16
LatareA. M.KumarO.SinghS. K.GuptaA. (2014). Direct and residual effect of sewage sludge on yield, heavy metals content and soil fertility under rice–wheat system. Ecol. Eng.69, 17–24. 10.1016/j.ecoleng.2014.03.066
17
MeenaS. K.DwivediB. S.MeenaM. C.DattaS. P.SinghV. K.MishraR. P.et al. (2022). Long-term nutrient supply options: strategies to improve soil phosphorus availability in the rice-wheat system. Sustainability14, 8629. 10.3390/su14148629
18
NazarR.IqbalN.MasoodA.SyeedS.KhanN. A. (2011). Understanding the significance of sulphur in improving salinity tolerance in plants. Environ. Exp. Bot. 70, 80–87. 10.1016/j.envexpbot.2010.09.011
19
RakshitA.MeenaV. S.ChakrabortyS.SarkarB.GhoshS. (2022). Editorial: adaptive farming sustainability practices: fundamentals to advances. Front. Sustain. Food Syst. 6, 823437. 10.3389/fsufs.2022.823437
20
RongzhongY.WrightA. L.OremW. H.McCrayJ. M. (2010). Sulfur distribution and transformations in everglades agricultural area soil as influenced by sulfur amendment. Soil Sci. 175, 263–269. 10.1097/SS.0b013e3181e16168
21
SahotaT. S. (2012). Importance of sulphur in crop production. Ont. Farmer Northwest Link46, 11–12.
22
SandhuP. S.WaliaS. S.GillR. S.DheriG. S. (2020). Thirty-one years study of integrated nutrient management on physico-chemical properties of soil under rice-wheat cropping system. Commun. Soil Sci. Plant Anal.51, 1641–1657. 10.1080/00103624.2020.1791156
23
SatyanarayanaT.TewatiaR. K. (2009). “State wise approaches to crop nutrient balances in India,” in Proceedings of the IPI-OUAT-IPNI International Symposium on Potassium Role and Benefits in Improving Nutrient Management for Food Production, Quality and Reduced Environmental Damages.Bhubaneswar, 467–485.
24
SchererH. W. (2009). Sulfur in soils. J. Plant Nutr. Soil Sci.172, 326–335. 10.1002/jpln.200900037
25
ShiJ.ChenH.ArocenaaJ. M.WhitcombeT.ThringR. W.MemiaghJ. N. (2016). Elemental sulfur amendment decreases bio-available Cr-VI in soils impacted by leather tanneries. Environ. Pollut. 212, 57–6410.1016/j.envpol.2016.01.045
26
SinghA.DubeyR. K.BundelaA. K.AbhilashP. C. (2020). The trilogy of wild crops, traditional agronomic practices, and UN-sustainable development goals. Agronomy10, 648. 10.3390/agronomy10050648
27
SinghA. K.AmgainL. P.SharmaS. K. (2000). Root characteristics, soil physical properties and yield of rice (Oryza sativa) as influenced by integrated nutrient management in ricewheat (Triticum aestivum) system. Ind. J. Agron. 45, 217–222.
28
SinghP.SainiS. P. (2021). Micronutrients availability in soil-plant system as influenced by long-term integrated nutrient management under rice-wheat cropping. J. Plant Nutr. 45, 457–470. 10.1080/01904167.2021.1943680
29
SoaudA. A.Al DarwishF. H.SalehM. E.El-TarabilyK. A.Sofian-AzirunM.RahmanM. M. (2011). Effects of elemental sulfur, phosphorus, micronutrients and Paracoccus versutus on nutrient availability of calcareous soils. Aust. J. Crop. Sci.5, 554–561. Available online at: http://cropj.com/rahman_5_5_2011_554_561.pdf
30
SubehiaS. K.SepehyaS.RanaS. S.NegiS. C.SharmaS. K. (2013). Long-term effect of organic and inorganic fertilizers on rice (Oryza sativa L.)-wheat (Triticum aestivum L.) yield, and chemical properties of an acidic soil in the western Himalayas. Expl. Agric. 49, 382–394. 10.1017/S0014479713000173
31
TabatabaiM. A.BremnerJ. M. (1972). Distribution of total and available sulphur in selected soils and soil profiles. Agron. J.64, 40–44. 10.2134/agronj1972.00021962006400010013x
32
TiwariK. N.GuptaB. R. (2006). Sulphur for sustainable high yield agriculture in Uttar Pradesh. Indian J. Fertil. 1, 37–52.
33
TuranM. A.TabanS.KatkatA. V.KucukyumukZ. (2013). The evaluation of the elemental sulfur and gypsum effect on soil pH, EC, SO4-S and available Mn content. J. Food Agric. Environ. 11, 572–575.
34
UrkurkarJ. S.TiwariA.ChitaleS.BajpaiR. K. (2010). Influence of long-term use of inorganic and organic manures on soil fertility and sustainable productivity of rice (Oryza sativa) and wheat (Triticum aestivum) in Inceptisols. Indian J. Agric. Sci.80, 208–212.
35
WilliamsC. H.SteinbergsA. (1959). Soil sulphur fractions as chemical indices of available sulphur in some Australian soils. Aust. J. Agric. Res. 10, 340–352. 10.1071/AR9590340
36
WoolstonC. (2020). Healthy people, healthy planet. Nature588, S54–S56. 10.1038/d41586-020-03443-6
37
ZendaT.LiuS.DongA.DuanH. (2021). Revisiting sulphur-the once neglected nutrient: it's roles in plant growth, metabolism, stress tolerance and crop production. Agriculture11, 626. 10.3390/agriculture11070626
Summary
Keywords
nutrient supply options, sulfur, nutrient availability, mineral fertilizer, organic manure
Citation
Meena SK, Dwivedi BS, Meena MC, Datta SP, Singh VK, Mishra RP, Chakraborty D, Dey A and Meena VS (2022) Long-term nutrient management in an intensive rice-wheat cropping system improves the quantities, qualities, and availability of soil sulfur. Front. Sustain. Food Syst. 6:997269. doi: 10.3389/fsufs.2022.997269
Received
18 July 2022
Accepted
23 August 2022
Published
16 September 2022
Volume
6 - 2022
Edited by
Franz-Theo Gottwald, Humboldt University of Berlin, Germany
Reviewed by
Akbar Hossain, Bangladesh Wheat and Maize Research Institute, Bangladesh; Eman A. Mahmoud, Damietta University, Egypt
Updates
Copyright
© 2022 Meena, Dwivedi, Meena, Datta, Singh, Mishra, Chakraborty, Dey and Meena.
This is an open-access article distributed under the terms of the Creative Commons Attribution License (CC BY). The use, distribution or reproduction in other forums is permitted, provided the original author(s) and the copyright owner(s) are credited and that the original publication in this journal is cited, in accordance with accepted academic practice. No use, distribution or reproduction is permitted which does not comply with these terms.
*Correspondence: Vijay Singh Meena vijayssac.bhu@gmail.com
This article was submitted to Land, Livelihoods and Food Security, a section of the journal Frontiers in Sustainable Food Systems
Disclaimer
All claims expressed in this article are solely those of the authors and do not necessarily represent those of their affiliated organizations, or those of the publisher, the editors and the reviewers. Any product that may be evaluated in this article or claim that may be made by its manufacturer is not guaranteed or endorsed by the publisher.