 Honghong Liu
 Shucheng Zhang
 Yongtong Mu
 Yugui Zhu
- 1Key Laboratory of Mariculture (Ministry of Education), Fisheries College, Ocean University of China, Qingdao, China
- 2Qingdao Hisense TransTech Co., Ltd., Qingdao, China
- 3Southern Marine Science and Engineering Guangdong Laboratory, Guangzhou, China
In this study, a complex network method was employed to quantify the changing role of countries in fish trade and the dynamic characteristics of fish globalization. Based on the United Nations Comtrade Database, the International Trade Network for Fish and Fish Products (ITN-Fish) was constructed as a series of weighted-directed networks for each year from 1990 to 2018. Almost all countries and territories worldwide have participated in the fish trade. In 2018, the network identified 229 fish traders. The share of developing countries in imports and exports has increased. Traders actively establish new trade relations, which improve network connectivity. However, these relations only account for a small part of the fish trade. The high connectivity allows risks to spread rapidly in the world through hubs such as the United States and China, which raises concerns about the robustness of these weak links in the Sino-US trade conflict and the outbreak of COVID-19. However, we have optimistic expectations on this issue. The dynamic of network topology property shows that the globalization of fish trade flourished between 1990 and 2018. Although, due to the financial crisis and its subsequent impact, the total amount of fish trade declined in 2009 and 2015, the network structure was not seriously affected, and the trend of topology property remained unchanged. Based on the construction of the international trade network, its node attribute, and its structural attribute, fish trade maintains the trend of globalization. Countries should actively adhere to trade globalization to promote the development of the fish trade.
1. Introduction
Fisheries and aquaculture have contributed outstandingly to vital global issues such as ensuring global food security, maintaining stable employment, and promoting ecological civilization (Allison, 2011; Ogello and Munguti, 2016). In recent decades, the global fishery and aquaculture industry has expanded rapidly, the global fishery economy has developed rapidly, and the international trade of fishery and aquaculture products has increased significantly (Subasinghe et al., 2009). According to data reported by Food and Agriculture Organization (FAO), in 2018, nearly 38% of fish caught or farmed globally was traded between countries, and 221 countries and territories reported fish trade activities (FAO, 2020a). Under cross-regional cooperation in fishery production, processing, fresh-keeping, packaging, and other economic activities, a complex global aquatic product trade relationship has been formed (Maluck and Donner, 2015; Ivanov and Dolgui, 2020). The process of fisheries globalization is intertwined with the economic structure of fisheries, with trade playing a central role in facilitating exchanges between countries (Crona et al., 2016). Therefore, quantifying the global aquatic product trade relationship is of great significance for understanding the development law of the global aquatic product trade system and formulating reasonable trade policies.
The international trade network (ITN), also known as the world trade network (WTN), refers to a network constructed based on bilateral national trade data that can reflect the mutual trade relations between different countries. The nodes in the network refer to the countries participating in trade, and the links represent the relationship between the two countries. The link weight measures the trade volume between countries (De Benedictis and Tajoli, 2011; Almog et al., 2017). In recent years, there have been many empirical studies on international trade issues from the perspective of complex networks (Li et al., 2003; Serrano and Boguñá, 2003; Garlaschelli and Loffredo, 2005), constructing national trade networks based on bilateral trade data between countries and exploring network topology characteristics and patterns of trade development among countries (Almog et al., 2015; García-Pérez et al., 2016). Based on the aforementioned empirical research, the following points can be drawn. First, the international trade network has the characteristics of scale-free and small-world attributes and a high clustering coefficient. Second, the trade flow carried by the link is related to the scale of the economy. Large economies establish connections, and the opportunities are better than those of small economies. Therefore, in international trade network research, node degree, minimum path, and clustering correlation coefficient are usually used to explore the network evolution law (He and Deem, 2010).
Fisheries have transformed from a local, vital food resource to an increasingly regionalized, market-oriented one. In the study of Gephart and Pace, the global seafood trade network constructed from 1994 to 2012 shows that seafood is increasingly globalized and trade is expanding (Gephart and Pace, 2015). In addition, the influence of East Asian countries in the global seafood trade network has been verified (Yamao, 2006; Asche, 2014), and the status of developing countries in the trade network has increased, especially China and Thailand (Aksoy and Beghin, 2004; Gephart and Pace, 2015). Furthermore, the trade expansion is mainly attributed to the growth of aquatic product production and the improvement of reprocessing capacity (Natale et al., 2015).
Nowadays, fish and fish products are among the most traded food commodities in the world, and their globalization brings benefits and risks to global food security (D'odorico et al., 2014). International trade can improve food security by coordinating fish supplies. For example, based on the production of aquatic products, low-income countries have eliminated poverty and ensured food security by exporting high-value aquatic products and domestic sales of low-value aquatic products (Jaunky, 2011; Watson et al., 2017). However, the dependence on international trade also exposes countries to the risk of external instability. For example, after the financial crisis, the upper-body trend of international trade in fish and fish products has generally slowed down (FAO, 2020a). Countries with lower economic levels are more vulnerable to external shocks in international trade networks (Gephart et al., 2016).
After sorting out the existing research on the international trade of aquatic products, there is still room for improvement. In terms of database selection, not all fish and fishery products were included in the networks constructed by previous studies. This may be because the Food and Agriculture Organization's FishstatJ (FAO, 2020b), a frequently used ocean trade database covering all fish and fish products, only contains total imports and total exports, not bilateral trade information. Although bilateral trade information is provided in the trade matrix, seafood is not included (Gephart and Pace, 2015), and it has become one of the most traded foods in the world (UNCTAD, 2017). In addition, indicators that can quantify the dynamic characteristics of the fish globalization process, such as network connectivity and small-world attributes, are ignored. Previous studies have paid more attention to food security and trade flows, such as the role of marine product trade in global food security (Asche, 2014) and the net flow of seafood from the global south to the global north (Smith et al., 2010). Although the aforementioned studies provide essential information for global fish trade, they need more information on the evolution of the trade network structure.
This study builds an international trade network of fish and fisheries products based on the bilateral trade data between countries and regions. It explores opportunities to promote the healthy development of aquatic product trade by analyzing the evolution characteristics and structure of the trade. The specific implementation process is as follows: First, match the FAO classification criteria for fish products with the HS and SITC codes used in the United Nations Comtrade Database to ensure that the data obtained from the UN Comtrade covered the full range of fish and fish products. Second, the International Trade Network for Fish and Fish Products (ITN-Fish) is constructed, its share of the trade value weights the links between countries. In addition to covering more fish products than Gephart and Pace (2015), we also extended the time range of the network from 1994–2012 to 1990–2018. Topological properties such as density, stability, and small-world index were further used to quantify the dynamics of fish globalization. In addition, this work has laid a foundation for studying the impact of the US–China trade conflict and the COVID-19 pandemic on the global fish trade system, which is explored in a separate article.
2. Methods
2.1. Network construction
2.1.1. Data
The data on bilateral trade flows are taken from the UN Comtrade based on HS and SITC codes (Appendix 1). The UN Comtrade database records bilateral trade data for a year or month reported to the UN Statistics Division (UNSD) by countries and territories (traders) around the world, with merchandise classified by HS or SITC codes (UNSD, 2020). As the Republic of China (Taiwan Province of China) is classified as “Other Asia, not elsewhere specified” in the database, its trade data are obtained from the Bureau of International Trade (https://www.trade.gov.tw/).
In this study, fish and fish products refer to all of the commodities under “Fish, crustaceans and mollusks” and “Other aq. animals and products” of “Yearbook/SOFIA selection of commodities” in FishstatJ. In Appendix 1, we list the HS and SITC codes required to obtain bilateral trade data for these commodities from the UN Comtrade database and the correspondence between the two codes. As the classification of HS is more detailed, its codes are chosen when data classified by HS and SITC codes are both available.
2.1.2. Reconciliation of bilateral trade flows
In a given year, two trade values can correspond to a trade flow (υi→j) from exporter i to importer : and reported by i and j respectively. However, bilateral asymmetries in trade data () are a well-known phenomenon in official statistics (UNSD, 2019). The importer's value is generally more reliable than the exporter's due to the taxes to which imports are subject (García-Pérez et al., 2016), so , whenever is available, or else . This method of reconciling bilateral trade flows ensures that the total imports are equal to the total exports. Countries involved in fish trade but have not reported their activities to UNSD can be identified in the network only if their partners report trade activities with them. Self-trade and trade with unspecified areas (such as “Antarctica,” “Other Asia, not elsewhere specified,” etc.) are considered invalid trade flows and are eliminated. Two hundred thirty-nine traders were identified as participating in the fish trade during 1990–2018. Each year, every trader in the network is identified by numeric and three-letter codes (Appendix 2).
2.1.3. Construction of ITN-Fish
ITN-Fish, a time sequence of weighted and directed networks, is constructed. The N nodes are traders participating in the fish trade, and directed links represent the trade flows of fishery commodities each year (t = 1990, 1991, ... , 2018). As this study focuses on the evolution of the topology properties rather than total trade value, the trade flows are rescaled by the total value of trade for fishery commodities in each given year to ensure comparability of topological properties across years. Therefore, the directed link from country i to j in year t is weighted by , and .
2.2. Network properties
2.2.1. Degree
In a directed network, in-degree () and out-degree () are the numbers of incoming and outgoing trade flows of a given country (i.e., the numbers of import and export partners), and as the trade flows have been reconciled. Undirected degree (ki), an undirected property that measures the number of trade partners of a given country, is introduced to this study to calculate the undirected density (2.2.4) and small-world index (2.2.6). The undirected edge i−j can represent both links i→j and j→i, so .
Once the degrees for all nodes have been estimated, degree distribution can be measured to determine if there are hubs in ITN-Fish. Many real-world networks, including ITN (Bhattacharya et al., 2007; Serrano et al., 2007; Konar et al., 2011; Carr et al., 2012), are characterized by scale-free distributions (P(degree = k) ~ k−λ, with its complementary cumulative distribution ), and exponential distributions [P(degree = k)~e−λk, with its complementary cumulative distribution ]. In two distribution forms, λ, a positive scaling constant, defines the rate of decay in the probability of finding a node with increasing k. Higher values of λ indicate a steep slope in the distributions (i.e., a lower probability of finding highly connected nodes). Moreover, the decay rate in scale-free distributions is slower than in exponential distributions, meaning that the probability of finding nodes with larger k is higher in scale-free distributions (Fornito et al., 2016a).
2.2.2. Strength
A precise assessment of the country's role in ITN-Fish cannot neglect the magnitude of the flux carried by each trade flow. This information can be retrieved by summing up all the weights of the incoming or outgoing links (Serrano et al., 2007), which gives us the shares of import and export values of a given country in total global trade. In the network literature, these two variables are called in-strength and out-strength and are denoted by and (Barrat et al., 2004). The shares of net and total values of a given country in total global trade, i.e., net-strength and tot-strength, can be computed as and , respectively.
To measure the imbalance in the fish trade, we propose two metrics—the Average Net-strength Ratio (ANR) and Total Net-strength Ratio (TNR):
ANR reflects the average ratio of each country's net trade to its total trade, while TNR is a weighted average of the ratios scaled by total trade. As the trade flow has been reconciled, and .
2.2.3. Centrality
Centrality analysis determines the importance of nodes in a network based on their connectivity within the network structure (Dwyer et al., 2006). Many measures of node centrality are suggested for different networks and research purposes (Koschützki et al., 2005; Dwyer et al., 2006). To quantify the status of nodes in ITN-Fish, we employ eigenvector centrality, in which the centralities or statuses of positions are recursively related to the centralities or statuses of the positions to which they are connected (Wasserman and Faust, 1994). The eigenvector centrality (xi) suited to the weighted directed network is composed of endogenous and exogenous components, and the endogenous component is a function of the status of the nodes to which the given node is connected (Bonacich and Lloyd, 2001). Let x be a vector of centrality scores and let e be a vector of exogenous sources of status or information. The equation of i's centrality score is as follows:
where wij measures i contributes to j's status, and the parameter α reflects the relative importance of endogenous versus exogenous factors in the determination of centrality.
However, problems emerged in the application of Equation 3 in ITN-Fish. (I) There is a single relation between a pair of nodes in Equation 3, while a pair of countries often have dual trade relations (i → jandj → i). (II) The imbalance in fish trade (Figures 3F–G) implies a given country's different import and export trade statuses. A solution to the problems is to measure the import and export centralities separately. Being chosen by a popular importer indicates a higher status for the exporter; similarly, establishing a trade relationship with a famous exporter will raise the status of the importer. Therefore, the endogenous component of () is a linear function of other nodes' export (import) status. Letting strength (S) reflect the exogenous status and setting α = 1, Equation 3 is replaced by new equations:
where weight (w) measures the contribution of other nodes to the given node's status. As we set α = 1 in Equations 4.1 and 4.2, the relative importance of endogenous versus exogenous factors mainly depends on the quantitative relationship between S and w (Bonacich and Lloyd, 2001).
2.2.4. Density
The density of a network is equal to the proportion of links present in the network. Equations 5.1 and 5.2 apply to undirected and directed networks, respectively.
2.2.5. Stability
The network stability which reflects the relative overlap between two states is quantified by the auto-correlation function (Palla et al., 2007):
where |A(t1) ∩ A(t2)| is the number of common links in t1 and t2, and |A(t1) ∪ A(t2)| is the union of A(t1) and A(t2). The measure of stability is extended to weighted properties:
where |min(wi(t1), wi(t2))| is the overlap of a given link's weight in t1 and t2, and |max(Ai(t1), Ai(t2))| is the union of wi(t1) and wi(t2). In this study, base period stability (t1 = t0 = 1990, 2000, 2010; t2 = t > t0) and adjacent stability (t1 = tt−1; t2 = t) are both measured over the years.
2.2.6. Small world
Small-world networks are interposed between regular and random graphs, showing high clustering and low average path length (Watts and Strogatz, 1998; Fornito et al., 2016b). In a small-world network, most nodes are not neighbors of one another but can be connected by a small number of links. We introduce this property together with the clustering coefficient and average path length, both necessary for calculating the property (Neal, 2017), to quantify the network structure characteristics defined by the existence and strength of trade relationships between countries. In this part, these bilateral relations are represented by the aggregate of bilateral trade flows. Thus, ITN-Fish is converted to undirected networks, and the directed links between a pair of nodes are merged into an undirected edge (i → j and j → i ⇒ i − j), where the direction is ignored while the weight is aggregated (wij = wi→j + wj→ i).
2.2.6.1. Clustering
The clustering coefficient quantifies the abundance of connected triangles in a network (Masuda et al., 2018). For an unweighted network, the local clustering coefficient of node i is defined by:
where ti is the number of connected triangles including node i, and is the number of triangles that can be formed by i and its neighbors. The global clustering coefficient is the average of Ci over all nodes,
For the weighted network, the local clustering coefficient, proposed by Saramäki et al. (2005), is written as
where ŵij = wij/max(w). The corresponding global clustering coefficient, denoted by Cw, is given by the average of over all nodes.
2.2.6.2. Shortest path
The shortest path between two nodes is one in which the sum of the lengths of its constituent edges is minimized (Fornito et al., 2016b). For example, in unweighted networks, the distance between a pair of connected nodes equals one, so the path length is the number of edges in the shortest path (Watts and Strogatz, 1998). Moreover, the average path length is as follows:
The distance between a pair of connected nodes is a function of the edge weight in weighted networks. Therefore, for networks like ITN-Fish with wij ∈ (0, 1) and negative correlation between distance and weight (i.e., the more significant the trade flow, the closer relationship), we can map weights to distances (Goñi et al., 2014):
The corresponding average path length, denoted by Lw is given by the average of over all pairs of nodes.
2.2.6.3. Small-world index
The small world is quantified by comparing the clustering and path length values in ITN-Fish to comparable values computed, respectively, appropriately randomized control networks and lattice networks. A small-world index, ω, proposed by Telesford et al. (2011), is defined as:
where L and C are the average path length and average clustering coefficient of ITN-Fish. Lrand is the path length averaged across an equivalent random network; and Clatt is the clustering coefficient averaged over an equivalent lattice network. The ω index ranges between−1 and 1. Values near zero indicate small-world networks, positive values suggest more random characteristics, and negative values indicate a lattice-like structure (Telesford et al., 2011; Fornito et al., 2016c,d; Neal, 2017).
3. Results
3.1. Network construction
The total value of reconstructed bilateral trade flows matched the corresponding total imports in FishstatJ (Figure 1B). At the same time, the number of nodes in ITN-Fish was consistently higher than the numbers of reporters in the UN Comtrade and traders recorded in FAO FishstatJ (Figure 1A), which indicated that ITN-Fish was able to identify economies involved in fish trade that did not report trade data to the UNSD or FAO. The number of nodes in ITN-Fish had fluctuated over the years, as some countries had merged or dissolved, and some entered or exited the fish trade. The number increased from 193 in 1990 to 227 in 2000, mainly due to the dissolution of the former Soviet Union and the Southern African Customs Union, and has remained around that value since 2000 (Figure 1A).
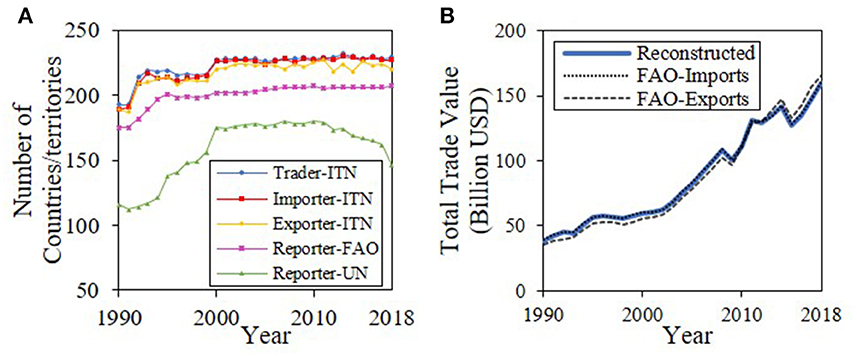
Figure 1. The validation of reconstructed bilateral trade flows. (A) Comparison of the total values of reconstructed bilateral trade flows with the values of total fish imports and exports from FAO's Fishstat database. (B) Comparison of the numbers of traders, importers, and exporters identified by ITN-Fish with the numbers of traders recorded in the Fishstat database and reporters recorded in the UN Comtrade database.
Figure 2 shows the trend in ITN-Fish of developing countries (including other developing countries, ODC and least developed countries, LDC) and developed countries (DC) in 1990, 2000, 2010, and 2018. Developing countries (ODCandLDC) have increased their share of fish trade from 43% to 52% of global export value and from 10% to 31% of import value from 1990 to 2018 (see Supplementary material). The share of trade within “other developing countries” (ODC → ODC) has increased and it is in the range of 13%−18%, while the share of trade within developed countries (DC → DC) has decreased and it is in the range of 15%−37%. Moreover, in terms of trade shares, developed countries have expanded their exports to developing countries, while developing countries have contracted their exports to developed countries (Figure 2).
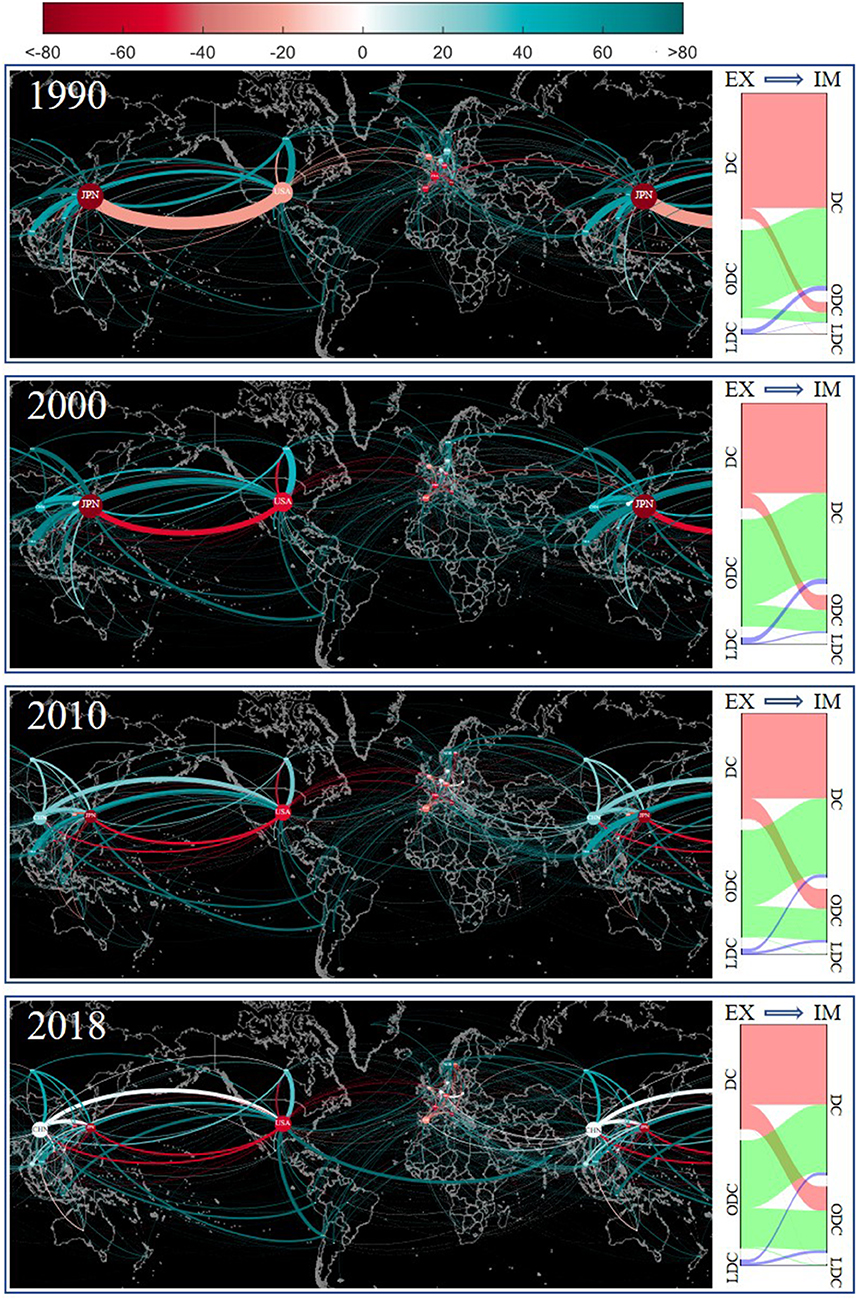
Figure 2. Maps of ITN-Fish for 1990, 2000, 2010, and 2018. (Left) All nodes are displayed on the maps, while only edges with weights greater than 0.0001 are displayed. The size of the nodes is proportional to the tot-strengths; the thickness of the edges is proportional to their weights. The nodes are colored according to the percentage of the net-strength to the tot-strength. The color of the edges is consistent with the color of the exporters. See Supplementary Table S1, for the country associated with each acronym. (Right) Trade flows among developed countries (DC), other developing countries (ODC), and least developed countries (LDC).
3.2. Node degree, strength, and centrality
Figure 3 shows the network nodes' static properties in 2018 and the dynamic properties from 1990 to 2018. Nodes with higher kin generally had higher kout (Figure 3A). Average in-degree 〈kin〉, out-degree 〈kout〉, and undirected-degree 〈k〉 were increasing (Figure 3B), implying that participants in the fish trade had been actively establishing trade connections with more traders during 1990–2018. The probability of finding a more significant degree decayed exponentially (Figure 3C), which indicates that most nodes had low degrees and a small number of edges were connected to them. In contrast, the few nodes with higher degrees were the hubs of ITN-Fish. In 2018, the λ of in-degree distribution was higher than that of out-degree distribution (Figure 3A). The λ of in-degree remained stable, while the λ of out-degree showed a decreasing trend, indicating the heterogeneity in the distribution of fish export channels diminishing from 1990 to 2018.
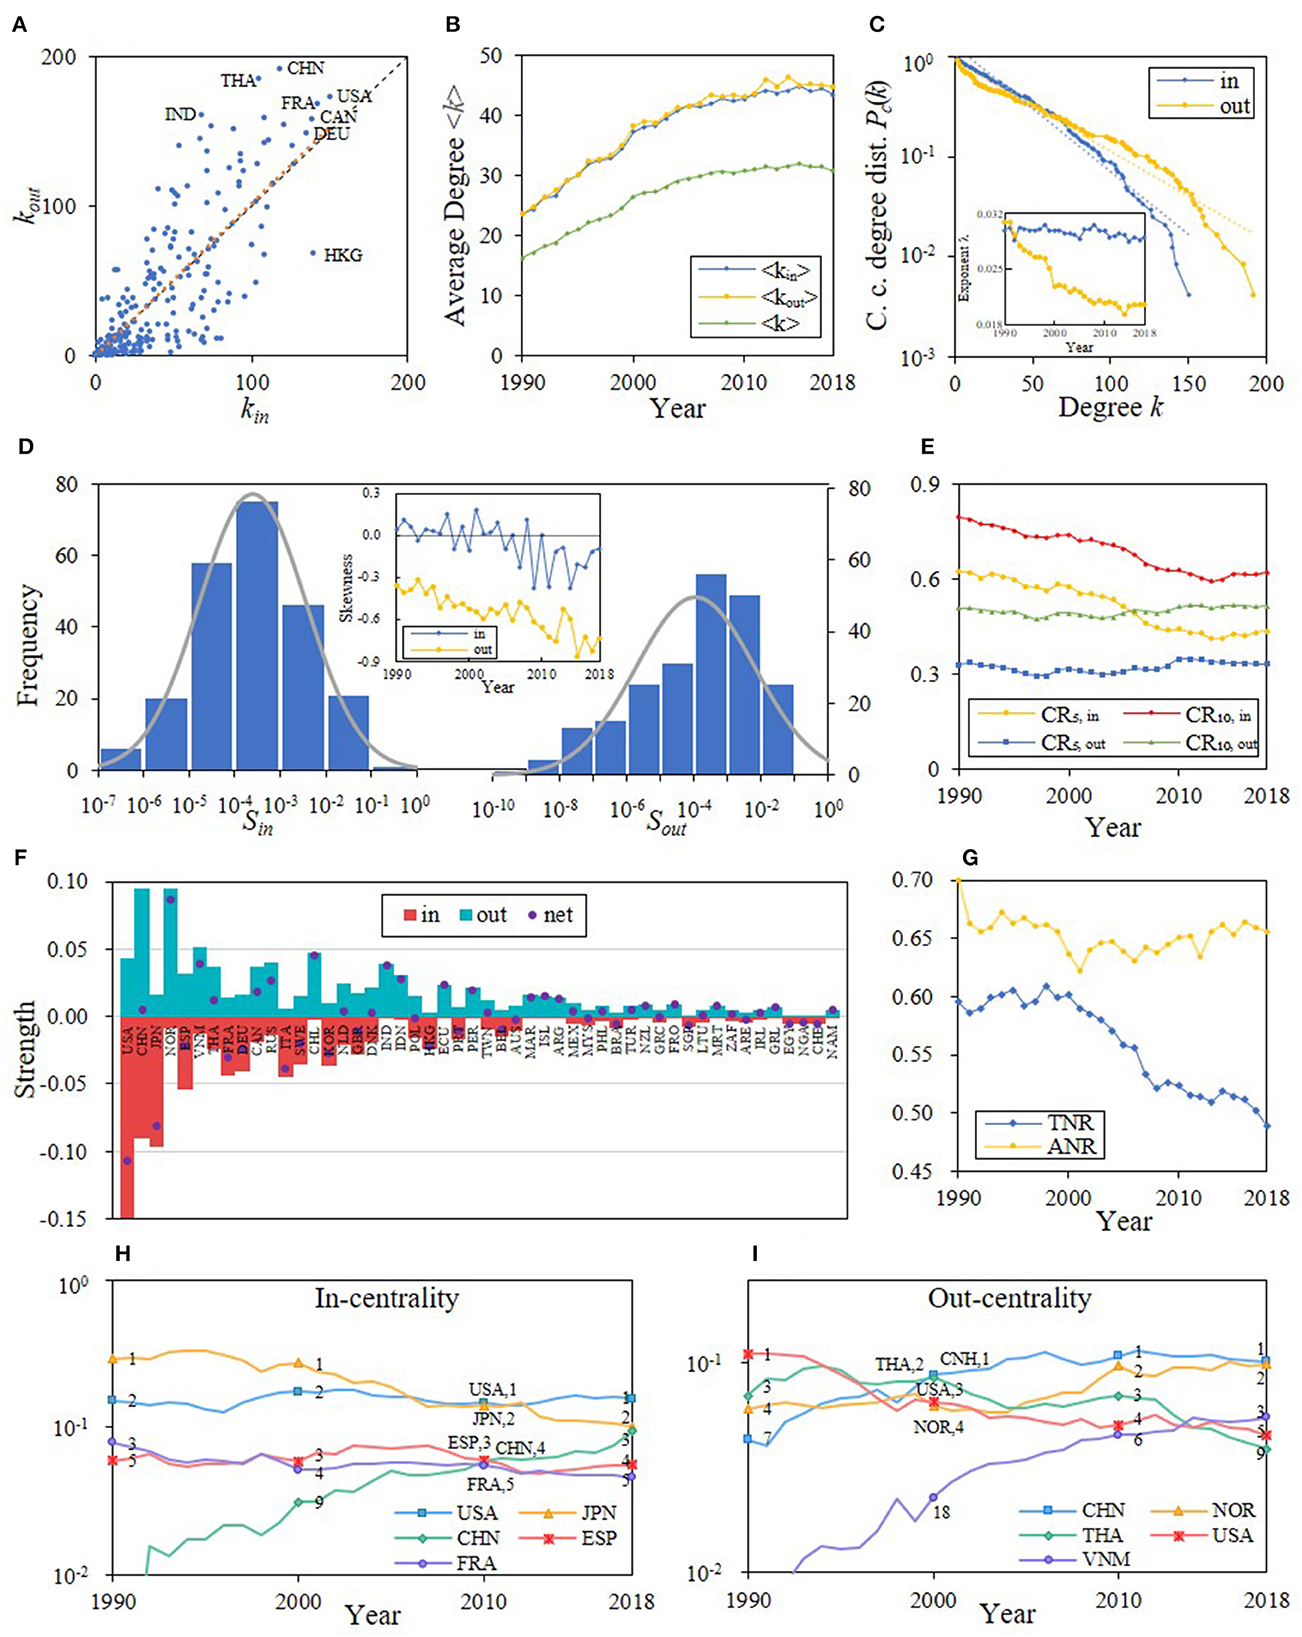
Figure 3. Network node properties. (A) Scattered plot of out-degree versus in-degree for the year 2018, with the orange dashed line as the asymptote and the black dashed line as the diagonal. (B) Dynamics of average in-, out-, and undirected degrees. (C) Complementary cumulative in- and out-degree distributions for 2018, with dashed lines as the asymptotes; and λ of exponential distributions of time (inset). (D) In- and out-strength distributions for 2018; and skewness of lognormal distributions of time (inset). (E) The sums of in- (out-) strengths of 5 and 10 largest importers (exporters), e.g., the shares of the 5 and 10 largest importers (exporters) in total fish trade value. (F) The in-, out-, and net-strength of the top 50 traders in tot-strength in 2018. (G) Dynamics of average net-strength ratio (ANR) and total net-strength ratio (TNR). (H, I) In- (out-) centrality dynamics of the top five central importers (exporters) in the 2010's over the period 1990–2018.
In-strength and out-strength distributions approximate a lognormal (Figure 3D). The lognormal distribution of out-strength was left skewed, and the negative skewness was decreased. In contrast, the skewness of in-strength lognormal distribution fluctuated around zero. The concentration of exports remained stable, with the top five exporters accounting for about 30% of total exports and the top 10 accounting for approximately 50%; the concentration of imports was declining but still higher than that of exports (Figure 3E). An important reason for the decline of import concentration is the dispersion of import share. In other words, the share of major importing countries tends to decline. Exporting countries are exporting aquatic products to more countries, rather than concentrating on the original major importing countries, such as the US, Japan, and Spain, which indicates the expansion of trade relations. However, this decentralized imagination has not yet been reflected in exports, and export concentration has remained stable.
Figure 3F shows the in, out, and net strength of the top 50 nodes sorted by tot-strength in 2018. The US was the largest fish trader, the largest importer, and the largest net importer; China (CHN), the largest exporter and third largest importer, had almost equal imports and exports in 2018, after becoming a net exporter in 1990, 2000, and 2010 (Figure 2); Japan was the second largest importer and the second largest net importer in 2018; and Norway was the second largest exporter and the largest net exporter in 2018. Among the major players in the fish trade, only a few have almost balanced fish trade (imports equal exports), such as China, Netherlands (NLD), Denmark (DNK), and Poland (POL), yet fish trade was unbalanced in most economies.
In 2018, the gap as a share of total trade (TNR) was 49%, a percentage that had declined since 2000 (Figure 3G); while the average of each trader's gap as a share of their respective total trade (ANR) had remained ~65%. Since TNR is a weighted form of ANR and major traders hold most of the trade weights, that is, a few countries have most of the trade value, while most countries have only a small amount of trade value. Based on this, we can infer that the fish trade imbalance of small traders is higher than that of large traders. In addition, the imbalance of large traders is decreasing.
Additionally, both in- and out-degree distributions showed extended tails, so exponentially truncated power-law degree distributions could characterize the degree distributions more precisely (Achard and Bullmore, 2007; Fornito et al., 2016a). However, as fewer nodes are in the tails, the corresponding functions were not fitted in this study.
Figures 3H, I show the in-centrality and out-centrality of the top five nodes ranked by the mean of in-centrality and out-centrality during 2010–2018, respectively, as well as their ranking in 1990, 2000, 2010, and 2018 (see Supplementary material for the centrality and ranking of all nodes in each year). In terms of in-centrality, the US and Japan had been in the top two positions; while China's in-centrality had proliferated and jumped to the third. As for out-centrality, China and Norway had been in the top two positions since 2005; Vietnam's out-centrality had grown rapidly and had jumped to the third position.
3.3. Density and stability
The directed and undirected densities of ITN-Fish were increasing (Figure 4A), indicating that the connectivity of the network had been improved. The increasing densities also indicated that traders were actively establishing new trade relations, consistent with the trend reflected in the average degrees (Figure 3B).
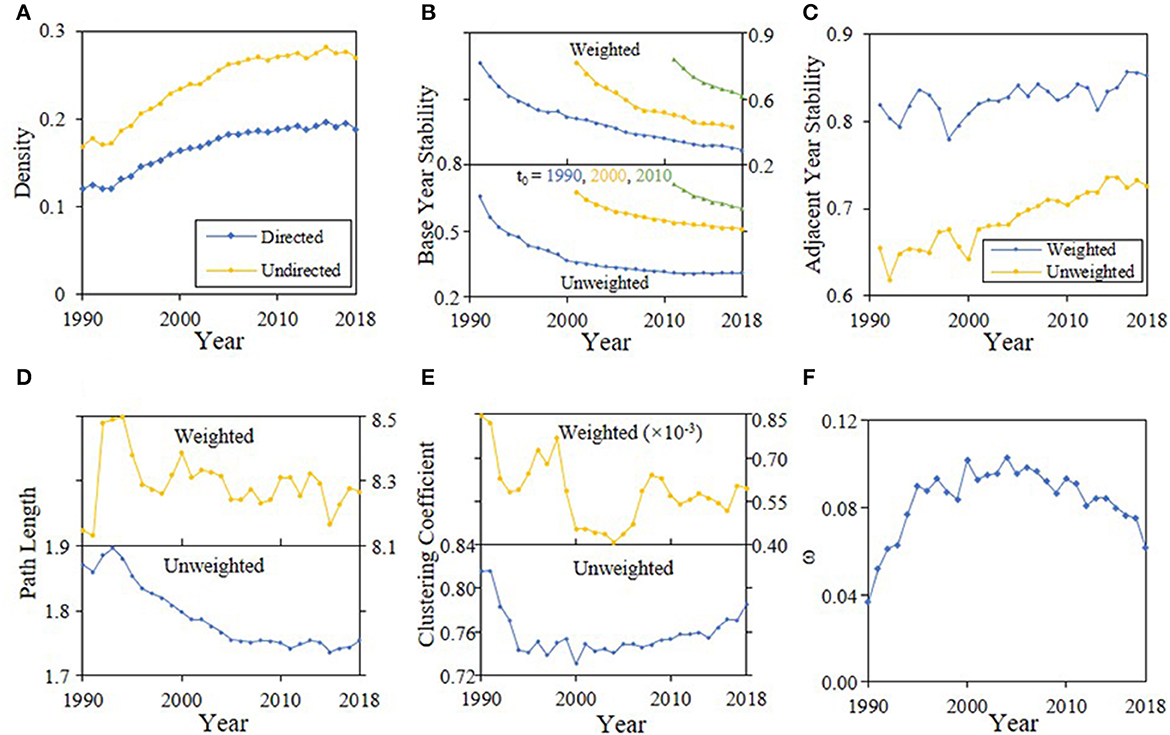
Figure 4. Network structure dynamics of ITN-Fish in 1990–2018. (A) Directed and undirected network densities. Weighted and unweighted (B) base period stability (base year t0 = 1990, 2000, 2010), (C) adjacent stability, (D) shortest path length, (E) clustering coefficient, and (F) small-world index.
The evolution of the network was moderate and continuous. Although only 18% of links and 29% of weights overlapped in the 1990 and 2018 networks (Figure 4B), 62–74% of links and 78–86% of weights overlap in two adjacent years (i.e., 26–38% of links and 14–22% of weights changed each year) (Figure 4C). Furthermore, in the weighted or unweighted network, the stability of ITN-Fish was improving, in other words, the variability of the network was slowing down.
3.4. Shortest path, clustering coefficient, and small-world index
Due to the number of nodes in the network caused by the dissolution of the former Soviet Union, the path length increased in the initial years. Then, it showed a decreasing trend, especially the unweighted path length, which had declined steadily since 1993 (Figure 4D). In 2018, the unweighted path length was 1.75, meaning that any two fish traders, on average, needed only 1.75 steps (or 0.75 extra traders as mediator) to be connected. Moreover, the mediators were always the hubs (Fornito et al., 2016a), such as the US and China, that had connections with most traders (Figure 3A) and were at the center of the network (Figures 3H, I).
The network was highly clustered. The unweighted clustering coefficient decreased during 1990–2000. It had increased since 2000 (Figure 4E). But even at the lowest point in 2000, the coefficient was as high as 0.73, i.e., there was a 73% probability that was also a trade relation between any two trade partners of a trader. The trend of the weighted clustering coefficients was not stable and differed from that of the unweighted in some periods (Figure 4E). For example, during 1993–1998, the weighted increased while the unweighted was stable, and during 2004–2016, the weighted increased and then decreased, with a peak in 2009, while the unweighted slowly increased.
The small-world index was close to zero, so ITN-Fish was a small-world network. The index increased in 1990–2000 and decreased in 2004–2018 (Figure 4F). But the shift in the index trends did not imply a reversal of fish globalization.
In 1990, the network was highly clustered, i.e., there was a high probability that there was also a trade relationship between any two trade partners of a trader. Despite the sparse links between traders, and hubs, such as the US and Japan, they still allowed the network to achieve connectivity, with an unweighted path length of only 1.87. Thus, the small-world index, derived from the unweighted clustering coefficient and the unweighted path length, was close to zero, implying trade groups' presence (Palla et al., 2007). Within these groups, nodes and groups were connected through hubs, forming a small-world network.
During 1990–2000, the network density was increasing, and path length was decreasing, while the clustering coefficient was decreasing, i.e., the newly established trade relations made it less likely that two trade partners of a trader also had a trade relation. This indicated that these new relations were established between nodes from different trading groups rather than within the original groups. As a result, the small-world index increased, and the network showed some random characteristics in this period.
During 2004–2018, the continuously increasing density and decreasing path length indicated higher connectivity, while the clustering coefficient and small-world index shifted to increase, which indicated that most of the new relations were established within the groups. In the previous period, nodes within the original group had been connected and then were connected to out-group nodes, which led to a decrease in the clustering coefficient. Therefore, in this period, the groups were merging, as the out-group nodes were connected to more nodes within the original groups and were integrated into the groups, which led to an increase in the clustering coefficient and decreasing small-world index.
Therefore, from a network topology perspective, the globalization of fish trade thrived during 1990–2018, and the globalization process was characterized by different patterns in periods 1990–2000 and 2004–2018, with 2001–2003 as a transition period.
4. Discussion
Trade is crucial to the development of the global fisheries and aquaculture industry. Based on the constructed international trade network of fish and fisheries products, this study explored the trend of international fish trade from the perspectives of the overall situation of the international trade network, the development mode of trade among countries or territories, and the evolution of the trade network structure, and provides the scientific basis for the future development path of fish trade.
4.1. The number of countries involved in ITN-Fish
The international trade network constructed in this study, ITN-Fish, contains more traders than those reported in FAO and UN trade data. That is, ITN-Fish identifies those economies that do not report trade data at FAO and the United Nations, and the problem of missing fish and fisheries product trade data in the study of Gephart and Pace is improved (Gephart and Pace, 2015). To sum up, most countries and territories in the world are involved in the fish trade. The number of traders participating in the international trade network has been relatively stable in recent years. In 2018, ITN-Fish identified 229 traders and trade links increased.
4.2. Trade flows of countries involved in ITN-Fish
In terms of import influence, since 2010, the US, Japan, China, Spain, and France have been imported trade hubs, and China's import centrality has been rapidly increasing. In terms of export influence, China, Norway, Thailand, the US, and Vietnam are export trade hubs, and the export centrality of China and Vietnam has increased rapidly. In general, the proportion of imports and exports of developing countries in the corresponding global share continues to rise. The above research results are consistent with the following published research. Yamao's 2006 research results show that Japan, the European Union, the US, and East Asia are the four major consumer markets in the global fish market (Yamao, 2006). In the study published by Gephart and Pace in 2015, the global ocean trade network from 1994 to 2012 was constructed, and the results showed that the trade influence of developing countries increased (Gephart and Pace, 2015). The observed changes in international trade flows may be the combined effect of increased production and reprocessing capacity (Natale et al., 2015). Taking China as an example, China increasingly absorbs imported fish and fish products from all over the world, some of which are consumed domestically and some are reprocessed for export (Zhang, 2014), which has driven neighboring countries to develop a large number of fish and fisheries products for export (Wilkinson and Rocha, 2009; Golub and Varma, 2014) and trade enhancement.
4.3. The trade structure of ITN-Fish
During the period 1990–2000, the network density increased, the path length between countries decreased, indicating that new trade links were established between countries, and the clustering coefficient of the network decreased, indicating that this connection crossed the boundaries within the group. From 2004 to 2018, new trade links were also established between the countries. The difference is that the external links of the group are gradually integrated into the internal links, and the various groups tend to integrate—the transformation of the development model—in the process of globalization mentioned above. The global fish trade helps consumers access natural resources across borders (Berkes et al., 2006). Based on the import, export, and net strength results of our study, fish trade is likely to be more balanced in most economies, with smaller traders more unbalanced than large traders. Further to the findings of Gephart et al. (2016) countries with lower per capita GDP are vulnerable to external shocks from the global fish trade network. Thus, the process of globalization eliminates imbalances and promotes sustainable development.
4.4. Globalization of fish and fisheries products
Comprehensive node and network structure evolution, this study shows that ITN-Fish is becoming increasingly tight, and the globalization of trade in fish and fisheries products will continue. Based on this, research on food security issues and sustainable development of aquatic products should be based on a global rather than a local perspective (Oosterveer and Sonnenfeld, 2012). Taking economically underdeveloped countries as an example, the contradictions mainly focus on export-oriented fishing behavior for economic benefits, which brings about domestic protein supply risks. The decline of fisheries in Ghana and West Africa stems from this (Atta-Mills et al., 2004). In addition, external turbulent factors such as trade disputes will affect a more expansive area through the international trade network (Maggi and Staiger, 2018; Wessells and Wallström, 2019). Considering this, aquatic product trade may need to incorporate a broader socio-environmental perspective.
5. Conclusion
Globalization is still an irreversible trend in fishery production and aquatic products trade. Based on the relatively stable number of traders during the study period (1990–2018), the global fish trade network showed a trend of increasing network density by establishing new trade relations. Therefore, aquatic product trade participants should actively embrace globalization, encourage the establishment of more trade relations, improve the stability of the trade structure, and resist various risks affecting the trade security of aquatic products. In addition, the aquatic products trade of developing countries is playing an increasingly important role in the world, and its proportion in the export volume has increased significantly. As a dual-center country for the import and export of aquatic products, China should continue to integrate into the global fisheries division and firmly support the globalization of the aquatic products trade.
Data availability statement
The original contributions presented in the study are included in the article/Supplementary material, further inquiries can be directed to the corresponding author.
Author contributions
HL organized the database and wrote the first draft of the manuscript. SZ performed the statistical analysis. HL, SZ, YM, and YZ wrote parts of the manuscript. All authors contributed to the conception and design of the study, participated in the revision of the manuscript, read, and approved the submitted version.
Funding
This study was supported by the Chinese Arctic and Antarctic Program (JDB20210211) and the Key Special Project for Introduced Talents Team of Southern Marine Science and Engineering Guangdong Laboratory (Guangzhou) (GML2019ZD0402).
Conflict of interest
SZ was employed by Qingdao Hisense TransTech Co., Ltd., China.
The remaining authors declare that the research was conducted in the absence of any commercial or financial relationships that could be construed as a potential conflict of interest.
Publisher's note
All claims expressed in this article are solely those of the authors and do not necessarily represent those of their affiliated organizations, or those of the publisher, the editors and the reviewers. Any product that may be evaluated in this article, or claim that may be made by its manufacturer, is not guaranteed or endorsed by the publisher.
Supplementary material
The Supplementary Material for this article can be found online at: https://www.frontiersin.org/articles/10.3389/fsufs.2023.1134687/full#supplementary-material
References
Achard, S., and Bullmore, E. (2007). Efficiency and cost of economical brain functional networks. PLoS Comput. Biol. 3, e17. doi: 10.1371/journal.pcbi.0030017
Aksoy, M. A., and Beghin, J. C. (Eds.). (2004). Global Agricultural Trade and Developing Countries. Washington: World Bank Publications.
Almog, A., Squartini, T., and Garlaschelli, D. (2015). A GDP-driven model for the binary and weighted structure of the International Trade Network. New J. Physics 17, 13009. doi: 10.1088/1367-2630/17/1/013009
Almog, A., Squartini, T., and Garlaschelli, D. (2017). The double role of GDP in shaping the structure of the International Trade Network. Int. J. Comput. Econ. Econ. 7, 381–398. doi: 10.1504/IJCEE.2017.086875
Asche, F. (2014). Exchange rates and the seafood trade. Globefish Res. Programme 113, 43. Available online at: https://www.fao.org/3/bb216e/bb216e.pdf
Atta-Mills, J., Alder, J., and Rashid Sumaila, U. (2004). “The decline of a regional fishing nation: the case of Ghana and West Africa,” in Natural Resources Forum (Oxford, UK: Blackwell Publishing Ltd) (Vol. 28, No. 1, 13–21.).
Barrat, A., Barthelemy, M., Pastor-Satorras, R., and Vespignani, A. (2004). The architecture of complex weighted networks. Proceed. Nat. Acad. Sci. 101, 3747–3752. doi: 10.1073/pnas.0400087101
Berkes, F., Hughes, T. P., Steneck, R. S., Wilson, J. A., Bellwood, D. R., Crona, B., et al. (2006). Globalization, roving bandits, and marine resources. Science 311, 1557–1558. doi: 10.1126/science.1122804
Bhattacharya, K., Mukherjee, G., and Manna, S. (2007). The international trade network. Proceed. Econophys-Kolkata 41, 139–147. doi: 10.1007/978-88-470-0665-2_10
Bonacich, P., and Lloyd, P. (2001). Eigenvector-like measures of centrality for asymmetric relations. Soc. Networks 23, 191–201. doi: 10.1016/S0378-8733(01)00038-7
Carr, J. A., D'Odorico, P., Laio, F., and Ridolfi, L. (2012). On the temporal variability of the virtual water network. Geophysical Res. Lett. 39, L06404. doi: 10.1029/2012gl051247
Crona, B. I., Basurto, X., Squires, D., Gelcich, S., Daw, T. M., Khan, A., et al. (2016). Towards a typology of interactions between small-scale fisheries and global seafood trade. Marine Policy 65, 1–10. doi: 10.1016/j.marpol.2015.11.016
De Benedictis and Tajoli L.. (2011). The world trade network. World Econ. 34, 1417–1454. doi: 10.1111/j.1467-9701.2011.01360.x
D'odorico, P., Carr, J. A., Laio, F., Ridolfi, L., and Vandoni, S. (2014). Feeding humanity through global food trade. Earth's Fut. 2, 458–469.
Dwyer, T., Hong, S., Koschützki, D., Schreiber, F., and Xu, K. (2006). Visual Analysis of Network Centralities. Tokyo, Japan: Asia-Pacific Symposium on Information Visualisation.
FAO (2020b). Fishery and Aquaculture Statistics. Global Fisheries commodities production and trade 1976–2018 (FishstatJ). Rome: FAO Fisheries Division. Available online at: www.fao.org/fishery/statistics/software/fishstatj/en
Fornito, A., Zalesky, A., and Bullmore, E. T. (2016a). Chapter 4 - Node Degree and Strength Fundamentals of Brain Network Analysis (115–136). Amsterdam: Academic Press.
Fornito, A., Zalesky, A., and Bullmore, E. T. (2016b). Chapter 7 - Paths, Diffusion, and Navigation Fundamentals of Brain Network Analysis (207-255). Amsterdam: Academic Press. doi: 10.1016./B978-0-12-407908-3.00007-8
Fornito, A., Zalesky, A., and Bullmore, E. T. (2016c). Chapter 8 - Motifs, Small Worlds, and Network Economy Fundamentals of Brain Network Analysis (257-301). Amsterdam: Academic Press. doi: 10.1016./B978-0-12-407908-3.00008-X
Fornito, A., Zalesky, A., and Bullmore, E. T. (2016d). Chapter 10 - Null Models Fundamentals of Brain Network Analysis (355-381). Amsterdam: Academic Press. doi: 10.1016./B978-0-12-407908-3.00010-8
García-Pérez, G., Boguñá, M., Allard, A., and Serrano, M. (2016). The hidden hyperbolic geometry of international trade: world Trade Atlas 1870–2013. Scient. Reports, 6, 33441. doi: 10.1038/srep33441
Garlaschelli, D., and Loffredo, M. I. (2005). Structure and evolution of the world trade network. Physica A: Stat. Mech. Appl. 355, 138–144.
Gephart, J. A., and Pace, M. L. (2015). Structure and evolution of the global seafood trade network. Environ. Res. Lett. 10, 125014. doi: 10.1088/1748-9326/10/12/125014
Gephart, J. A., Rovenskaya, E., Dieckmann, U., Pace, M. L., and Brännström, Å. (2016). Vulnerability to shocks in the global seafood trade network. Environ. Res. Lett. 11, 35008. doi: 10.1088/1748-9326/11/3/035008
Golub, S., and Varma, A. (2014). Fishing exports and economic development of least developed countries. Bangladesh, Cambodia, Comoros, Sierra Leone and Uganda. UNCTAD. Swarthmore College.
Goñi, J., van den Heuvel, M. P., Avena-Koenigsberger, A., Velez De Mendizabal, N., Betzel, R. F., Griffa, A., et al. (2014). Resting-brain functional connectivity predicted by analytic measures of network communication. Proceed. Nat. Acad. Sci. 111, 833. doi: 10.1073/pnas.1315529111
He, J., and Deem, M. W. (2010). Structure and response in the world trade network. Phys. Rev. Lett. 105, 198701. doi: 10.1103/PhysRevLett.105.198701
Ivanov, D., and Dolgui, A. (2020). Viability of intertwined supply networks: extending the supply chain resilience angles towards survivability. A position paper motivated by COVID-19 outbreak. Int.l J. Prod. Res. 58, 2904–2915. doi: 10.1080/00207543.2020.1750727
Jaunky, V. C. (2011). Fish exports and economic growth: the case of SIDS. Coastal Manag. 39, 377–395. doi: 10.1080/08920753.2011.589210
Konar, M., Dalin, C., Suweis, S., Hanasaki, N., Rinaldo, A., Rodriguez-Iturbe, I., et al. (2011). Water for food: the global virtual water trade network. Water Res. Res. 47, 307. doi: 10.1029./2010wr010307
Koschützki, D., Lehmann, K. A., Peeters, L., Richter, S., Tenfelde-Podehl, D., Zlotowski, O., et al. (2005). “Centrality indices,” in Network Analysis: Methodological Foundations, eds U. Brandes and T. Erlebach (16-61). Springer Berlin Heidelberg.
Li, X., Ying Jin, Y., and Chen, G. (2003). Complexity and synchronization of the world trade web. Physica A Stat. Mech. Appl. 328, 287–296. doi: 10.1016/s0378-4371(03)00567-3
Maggi, G., and Staiger, R. W. (2018). Trade disputes and settlement. Int. Econ. Rev. 59, 19–50. doi: 10.1111/iere.12261
Maluck, J., and Donner, R. V. (2015). A network of networks perspective on global trade. PLoS ONE 7, e133310. doi: 10.1371/journal.pone.0133310
Masuda, N., Sakaki, M., Ezaki, T., and Watanabe, T. (2018). Clustering coefficients for correlation networks. Front. Neuroinform. 12, 7. doi: 10.3389./fninf.2018.00007
Natale, F., Borrello, A., and Motova, A. (2015). (2015). Analysis of the determinants of international seafood trade using a gravity model. Marine Policy, 60, 98–106. doi: 10.1016/j.marpol05016
Neal, Z. P. (2017). How small is it? Comparing indices of small worldliness. Network Sci. 5, 30–44. doi: 10.1017/nws.2017.5
Ogello, E. O., and Munguti, J. M. (2016). Aquaculture: a promising solution for food insecurity, poverty and malnutrition in Kenya. Af. J. Food Agricult. Nutrit. Develop. 16, 11331–11350. doi: 10.18697/ajfand.76.15900
Oosterveer, P., and Sonnenfeld, D. A. (2012). Food, Globalization and Sustainability. London; New York: Routledge.
Palla, G., Barabási, A., and Vicsek, T. (2007). Quantifying social group evolution. Nature 446, 664–667. doi: 10.1038/nature05670
Saramäki, J., Kertész, J., Kaski, K., and Onnela, J. (2005). Intensity and coherence of motifs in weighted complex networks. Phys. Rev. E. 71, 65103. doi: 10.1103/PhysRevE.71.065103
Serrano, M., and Boguñá, M. (2003). Topology of the world trade web. Phys. Rev. E, Statist. Nonlinear Soft Matter Physics 68, 15101. doi: 10.1103/PhysRevE.68.015101
Serrano, M. Á., Boguñá, M., and Vespignani, A. (2007). Patterns of dominant flows in the world trade web. J. Econ. Interact. Coord. 2, 111–124. doi: 10.1007/s11403-007-0026-y
Smith, M. D., Roheim, C. A., Crowder, L. B., Halpern, B. S., Turnipseed, M., Anderson, J. L., et al. (2010). Sustainability and global seafood. Science 327, 784–786. doi: 10.1126/science.1185345
Subasinghe, R., Soto, D., and Jia, J. (2009). Global aquaculture and its role in sustainable development. Rev. Aquacult. 1, 2–9. doi: 10.1111/j.1753-5131.2008.01002.x
Telesford, Q. K., Joyce, K. E., Hayasaka, S., Burdette, J. H., and Laurienti, P. J. (2011). The ubiquity of small-world networks. Brain Connect. 1, 367–375. doi: 10.1089/brain.2011.0038
UNCTAD (2017). Information economy report 2017. Digitalization, Trade and Development. UNCTAD. Available online at: http://unctad.org/en/PublicationsLibrary/ier2017_overview_en.pdf
UNSD (2019). IMTS Bilateral asymmetries – how to measure, analyze, reduce and way forward. Available online at: http://unstats.un.org/unsd/tradekb/Attachment441.aspx?AttachmentType=1 (accessed February 15, 2023).
UNSD (2020). The United Nations Commodity Trade Statistics Database. Available online at: https://comtrade.un.org/data (accessed February 15, 2023).
Wasserman, S., and Faust, K. (1994). Centrality and Prestige Social Network Analysis: Methods and Applications (169-219). Cambridge: Cambridge University Press. doi: 10.1017./CBO9780511815478.006
Watson, R. A., Nichols, R., Lam, V. W. Y., and Sumaila, U. R. (2017). Global seafood trade flows and developing economies: insights from linking trade and production. Marine Policy, 82, 41–49. doi: 10.1016/j.marpol.04017
Watts, D. J., and Strogatz, S. H. (1998). Collective dynamics of “small-world” networks. Nature 393, 440–442. doi: 10.1038/30918
Wessells, C. R., and Wallström, P. (2019). “New dimensions in world fisheries: Implications for US and EC trade in seafood,” in Agricultural Trade Conflicts and GATT. Routledge. (pp. 515-535).
Wilkinson, J., and Rocha, R. (2009). :Agro-industry trends, patterns and development impacts,: in Agro-Industries for Development. Wallingford UK: CABI (pp. 46-91).
Yamao, M. (2006). Rapid growth of fish consumption market in East Asia: globalization and regionalization of fisheries trade. Jap. J. Fisher. Econ. 3, 85.
Keywords: complex network, globalization, fish trade, network connectivity, network topology, trade balance
Citation: Liu H, Zhang S, Mu Y and Zhu Y (2023) Topology and evolution of international trade network for fish and fish products. Front. Sustain. Food Syst. 7:1134687. doi: 10.3389/fsufs.2023.1134687
Received: 30 December 2022; Accepted: 20 March 2023;
Published: 24 April 2023.
Edited by:
Roberto Anedda, Porto Conte Ricerche, Parco Scientifico e Tecnologico della Sardegna, ItalyReviewed by:
Justice Gameli Djokoto, Central University, GhanaRong Ma, China Agricultural University, China
Chao Zhang, Institute of Geographic Sciences and Natural Resources Research (CAS), China
Copyright © 2023 Liu, Zhang, Mu and Zhu. This is an open-access article distributed under the terms of the Creative Commons Attribution License (CC BY). The use, distribution or reproduction in other forums is permitted, provided the original author(s) and the copyright owner(s) are credited and that the original publication in this journal is cited, in accordance with accepted academic practice. No use, distribution or reproduction is permitted which does not comply with these terms.
*Correspondence: Yugui Zhu, emh1eXVndWlAb3VjLmVkdS5jbg==
†These authors have contributed equally to this work and share first authorship