 Elahe Banaie
 Seyed Mojtaba Mojaverian1
 Abbas Mirzaei
- 1Department of Agricultural Economics, Sari Agricultural Sciences and Natural Resources University, Sari, Iran
- 2Department of Agricultural Economics, Agricultural Sciences and Natural Resources University of Khuzestan, Mollasani, Iran
Concerns about household food security of developing countries has been greatly intensified with rising food prices derives from various causes, such as market failure, climate change, political instability, the presence of poor financial institutions, and emerging challenges. It is very important, the development and evaluation of required policy responses such as income compensation policy to cope with foodstuff price increases. It is necessary to pay attention to different household groups regarding income, occupation, and urban/rural conditions in order to evaluate the effects of shocks and policies according to the different responses of households. This paper employes a multimarket equilibrium simulation model and evaluates the effect of price hikes with/without households' nominal income compensation policy on the calorie intake of different household groups. To this end, Iranian households that have suffered from severe food inflation and their nominal income compensation policy has always been the focus of government officials were investigated. First, we noticed that poor rural households with government occupations bear the brunt of ensuing the price hike of foodstuffs. Second, we found that households food security is highly reliant on the price of livestock products compared to other foodstuffs. Finally, we concluded that income compensation policy plays the role of a threat to food security for some households and a driver for others. Therefore, based on the different responses of households to foodstuff price and income increase, we recommended the design of more precise interventions in the market of foodstuff in a more targeted and efficient manner.
1. Introduction
Food security has allocated a specific position in political and economic processes to itself since the 16th century (Abdelhedi and Zouari, 2020). According to the definition of the World Food Programme in 1996, food security is realized when family members can meet their minimum needs through physical and economic access to adequate, healthy, and nutritive food (Brinkman et al., 2020). Food security measurement is highly complex (Barrett, 2010) and has extended from focusing on food supply at national, regional, and global levels to analyzing food demand and access at individual and household scales (Leroy et al., 2015; Nébié et al., 2021).
Despite the surge in agricultural production between 1995 and 2016, the indices of food price and malnutrition have been increasing sharply in the world (FAO, 2022), such that the Food Price Index (FPI) reached 135.7 units in November 2022 (FAO, 2022). The unexpected global ascent of foodstuff prices derives from various causes, such as market failure (Timmer, 2017), climate change (Kalkuhl et al., 2016), political instability (Minot, 2014), the presence of poor financial institutions (Bora et al., 2011), and emerging challenges, like Covid-19 (Devereux et al., 2020; Rad et al., 2021). Of course, sanctions are also among the reasons for unexpected (sudden) changes in prices in Iran (Hejazi and Emamgholipour, 2022).
With respect to the rise of foodstuff prices, the concerns about the food security vulnerability of households, especially in developing countries like Iran, have increased extensively (Sheriff et al., 2020). Households consuming crops and food products tend to apply strategies to respond to various price and income shocks in a way that allows them to maintain their ordinary consumption levels (Nébié et al., 2021). However, the effects of shocks and the necessary coping strategies are significantly different among various groups (Lawlor et al., 2019).
The unexpected price hikes of foodstuffs may influence food security variously depending on the wealth level and revenue performance of households and their contributions to foodstuff production (Amolegbe et al., 2021). Engel's law indicates that the surge of income reduces the share of food in households' budgets, and this reduction is bolder for the less-privileged than high-privileged households (Engel, 1895; Deaton and Muellbauer, 1980; Deaton, 1989). Amolegbe et al. (2021) showed that the sharp rise in the price of main foodstuffs reduced households' purchasing power and raised the food expenditure share in the budget of less-privileged households more than their rich counterparts. On the other hand, according to Bennett's law, rich households' regimens are more diverse than that of underprivileged households (Bennett, 1941). This means that regimens first improve quantitatively with the rise in income and then qualitatively with the further surge of incomes. Hence, demand elasticity for high-quality food is higher among the rich than the poor and makes the regimen diversity of the underprivileged less vulnerable to price hike shocks (Hoddinott et al., 2018; Amolegbe et al., 2021). Thus, reactions to price shocks differ depending on the characteristics of households and foodstuffs. In this respect, it is extremely imperative to evaluate food security separately by the changes in various foodstuff prices and the reactions of different household groups to these changes.
According to the Statistical Center of Iran's prediction, the country's population has increased by 5.5% in 2021 relative to 2016. Besides, based on the most optimistic scenario estimated by demographers, Iran's population will annually increase by 1.6% in the next two decades (Statistical Center of Iran., 2021). This growth of population will raise the demand for foodstuffs and supply of deficits through imports, change consumption patterns, and erode natural resources. The average consumption of households in Iranian cities and villages in income expenditure estimation of the Statistical Center of Iran reveals that; for example, the consumption rate of meat was reduced by 4.3 kg in urban households and 5.3 kg in rural households in 2017. In particular, the per capita milk consumption was 127 liters in 2011 while reduced to 110 liters in 2021. The degressive consumption of different meat types and dairy products in recent years can be a serious threat to food security in Iran. Another report of this center shows that the annual inflation rate in December 2022 equaled 45% for urban households and increased by 1% compared to the earlier month. The annual inflation rate is 44.3 and 48.6% for urban and rural households and has increased by 1% for urban households and 1.2% for rural households (Statistical Center of Iran., 2022). For example, the price of chicken meat, as a chief product in households' food baskets in Iran, has experienced excessive growth since 2017, such that per kilogram of it has increased from 74,000 (current LCU) in 2,017 to 130,000 (current LCU) in 2,019 and 600,000 (current LCU) in 2022 (Statistical Center of Iran., 2022).
On the other hand, Iran suffers from an inappropriate nutritional pattern, which can worsen due to the effects of variations in prices and incomes. For example, according to the data released by the Statistical Center of Iran (2018), the per capita consumption of (red and white) meat equals 37 kg in the world food security basket, while this rate is about 36 kg in Iran. The per capita milk consumption is 70 kg in Iran, while the average milk consumption equals 190 kg in the world and 300–450 kg in European countries. This statistic amounts to 500 kg in some developed countries of the world. The per capita egg consumption equals 190 eggs in Iran, and the global average amounts to 250 eggs. This is while the per capita consumption of sugar is 21–24 kg in Iran, and the determined global average consumption in the food security basket is just 14 kg (Statistical Center of Iran, 2018).
In addition, the consumption rate of foodstuffs differs in Iranian urban and rural households from the first to the tenth decile. For example, the per capita cereal consumption equals 23 and 78 kg in the first and tenth deciles of rural households and 39 and 57 kg in the first and tenth deciles of urban households (Statistical Center of Iran, 2018). Due to the different cereal consumption rates, the degree and severity of the effects of shocks also vary per decile of urban and rural households. Hence, the establishment of food security in Iran has changed into a basic concern for decision-makers and challenged food security in different household groups in the country more than ever.
Review studies evaluating food security can be classified into two groups. The first group analyzes the effect of different factors, such as climate change and various market crises and policies, on the price and production of foodstuffs and food security in societies (Van Campenhout et al., 2018; Sheriff et al., 2020; Amolegbe et al., 2021; Kansiime et al., 2021; Nébié et al., 2021; Sileshi and Gebeyehu, 2021; Lin et al., 2022; Louie et al., 2022). For example, Kansiime et al. (2021) and Louie et al. (2022) investigated the effect of Covid-19 on foodstuff prices and production. Nébié et al. (2021) recognized climate change as a main factor and assessed its impacts on foodstuff prices and production. Sileshi and Gebeyehu (2021) investigated the effects of emerging plant diseases on foodstuff price and production. Amolegbe et al. (2021) found that trade policies and changes in the imported rice price reduced food diversity and raised the food share in households' budgets. This group of studies has evaluated effective factors in food security indices by not considering the market of products and simulating the behavior of consumers and foodstuff suppliers but exploiting econometric or macroeconomic models. The second group involves studies that have simulated the market, evaluated consumption/supply changes due to price or inventory variations in the market by identifying the consumer/supplier behavior and market supply/demand functions, and analyzed food security and welfare in society (Haggblade et al., 2017; Thome et al., 2017; Dick and Wilson, 2018; Brizmohun, 2019; Sheriff et al., 2020; Yu and Kim, 2020; Fathi and Bakhshoodeh, 2021). For example, by identifying supply and demand functions and a multimarket equilibrium model, Haggblade et al. (2017) examined the effects of global price and production shocks on households' calorie intake as a food security index. The results showed that a 20% decline in cereal production decreased the calorie intake of poor rural households by 15%, which was almost four times higher compared to other income groups. Furthermore, a 50% surge in the global rice price has hurt underprivileged urban households more intensely and reduced their calorie intake by 8%. Fathi and Bakhshoodeh (2021) investigated the effects of the targeted policies of energy subsidies in the Iranian meat market on economic welfare. The authors of this study employed a multimarket equilibrium model to evaluate the economic welfare of players, including producers, consumers, and government, and concluded that eliminating the energy subsidy and redistributing the resulting income for the technological promotion of producers could be a suitable approach to improving the economic welfare of the entire society and enhancing production and consumption conditions in the meat market and food security.
Thus, simulating the market and analyzing the behavior of foodstuff consumers and suppliers are reckoned as effective steps toward accurately measuring food security changes relative to variations in different factors, especially foodstuff prices. However, the effects of changes in commodity price and production on the food security of household groups can vary (Haggblade et al., 2017; Wossen et al., 2018). Van Campenhout et al. (2018) discovered that the welfare of poor rural households increased in high foodstuff prices, while Haggblade et al. (2017) reported that the decreased calorie reception of underprivileged urban and rural households resulted from the decreased production and increased global price of rice. Hence, this difference in findings highlights the need for considering various household groups in analyzing food security, such that in a review study, Akbari et al. (2022) found that investigating the evaluative indices and techniques of food security and identifying high-risk groups should be prioritized. Although analyzing the effect of households' reactions to negative shocks on food security, e.g., price hikes, has been addressed in the topic literature, a few studies have tackled the relationship between nominal income compensation and responses to these shocks (Wood, 2011; Lawlor et al., 2019).
Hence, the present study aimed to evaluate the effects of the price hike of various foodstuffs and nominal income compensation policy on the food security of different households in Iran. To this end, we employed a multimarket equilibrium model to simulate the market of various foodstuffs and evaluated the effect of price hikes with/without households' nominal income compensation on the food security of different household groups regarding income, occupation, and urban/rural conditions. The review of the topic literature shows that this study is sufficiently original due to considering numerous foodstuffs of the household basket and detailed information and classifying households into different groups. Therefore, it can identify vulnerable households to food security accurately and assess the contribution of nominal income rise to these households. This study, which evaluated the effects of the price hikes of different foodstuffs in Iran on the food security of various household groups, can be attractive to other countries that possess similar conditions to Iran and suffer from foodstuff inflations and present reliable findings at the international level. In the end, this study seeks to answer the following two questions:
What are the effects of the price hike of different foodstuffs on the food security of various household groups? In other words, which households are the most vulnerable, and what are the most sensitive foodstuffs in households' food baskets?
Can the surge of nominal income moderate the negative effects of the price hike of different foodstuff groups on the food security of various household groups?
What is the consumption pattern of different household groups?
2. Materials and methods
2.1. Multimarket equilibrium model
Unimarket partial equilibrium and general equilibrium models are typically employed to investigate the effects of economic shocks in different studies. However, Unimarket models neglect the substitutive and supplementary possibilities of foodstuffs due to disregarding other related markets in the foodstuff spectrum. On the other hand, general equilibrium models fail to present reliable outcomes for examining the effects of production, income, and price shocks on various household groups due to regarding numerous constraints for the response parameters of consumers (Haggblade et al., 2017). It is expected that the multimarket equilibrium simulation model is a suitable model for the purpose of the present research. It is worth mentioning that the multimarket equilibrium model in this study has been adapted from Haggblade et al. (2017) study. This model considers all effective variables in the consumption and food security of various household groups, e.g., imports, exports, domestic production and supply, domestic and foreign prices of products, the income of households, price and income elasticities of households' demands, and the interrelationships of different markets. On the other hand, concerning the reviewed literature, the present study employed the calorie intake derived from the consumption of the examined foodstuffs as the food security index (Hoddinott and Yohannes, 2002). The multimarket equilibrium model encompasses relations tied to domestic supply and production (Eqs 1, 2), household income and demand (Equations 3 and 4), foreign trade involving exports and imports (Eqs 5–10), market equilibrium (Eq 11), and the maximization of calorie intake objective function (Eq 12) (Table 1). Table 2 also presents the definitions of the sets, parameters, and variables used in the model.
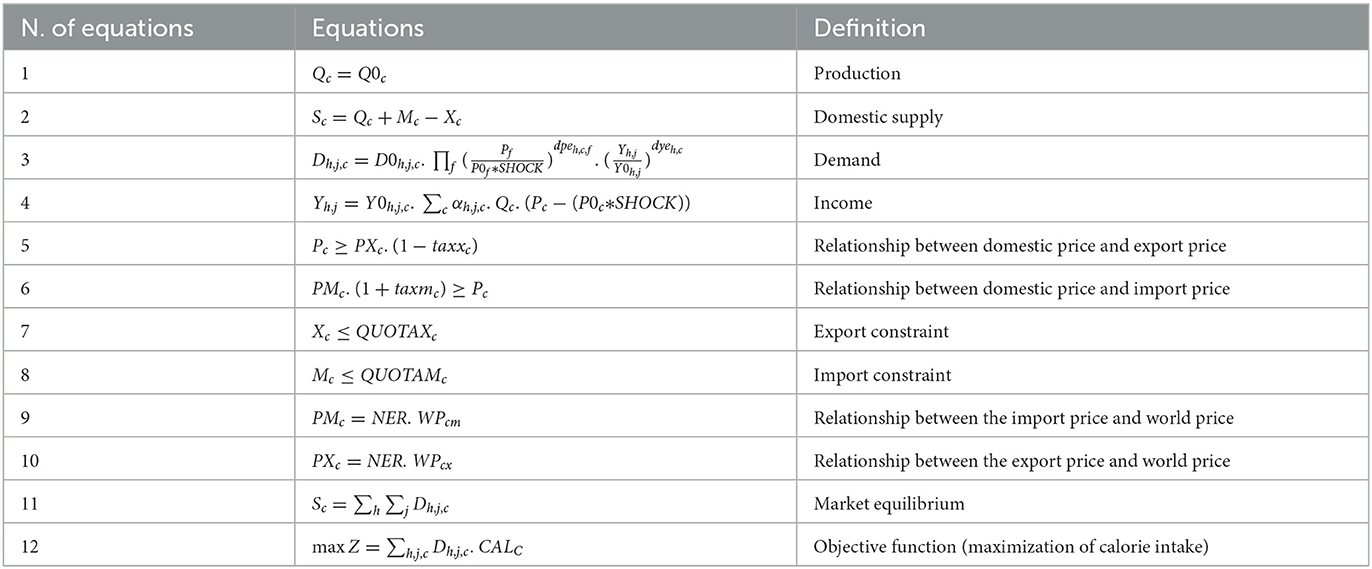
Table 1. Equations of the multimarket equilibrium model.
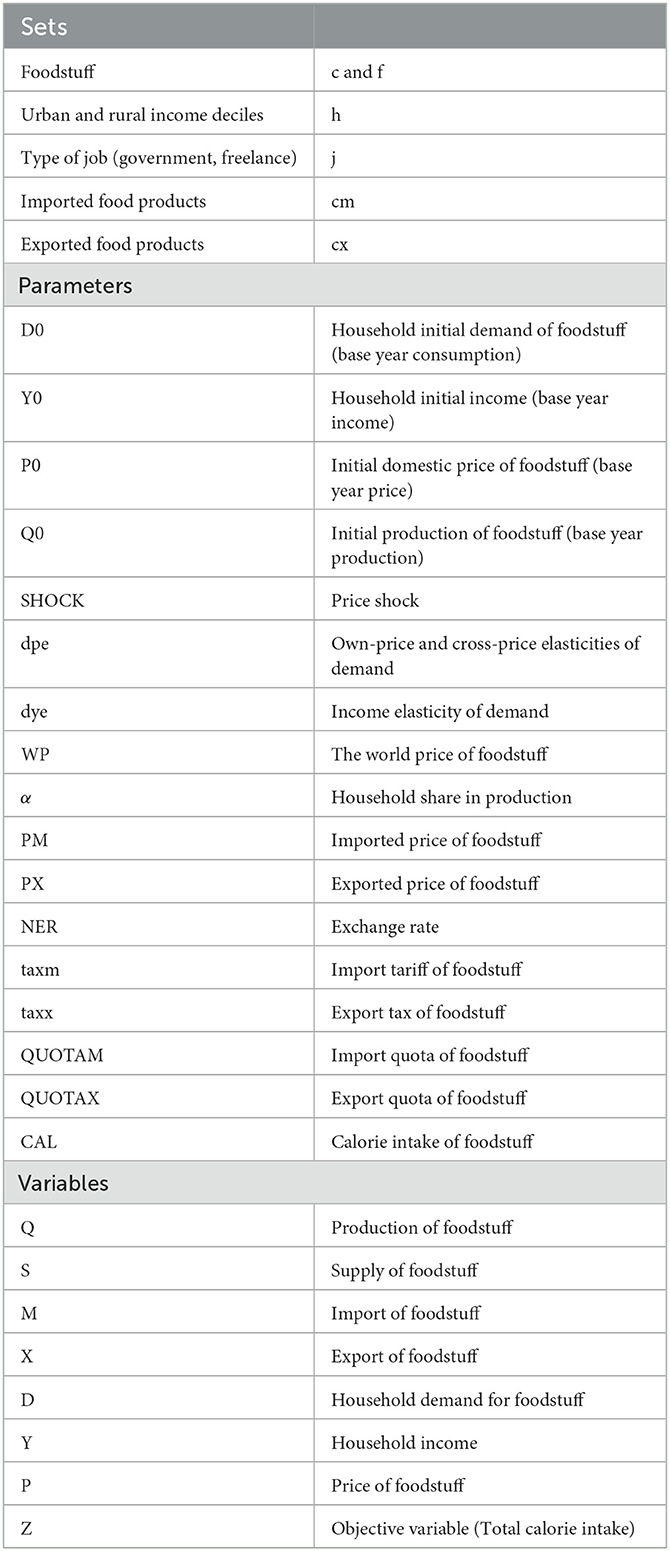
Table 2. Definitions of sets, parameters, and variables of the multimarket equilibrium model.
2.2. Data collection
The examined foodstuffs were considered within four groups of basic commodities lying on top of the table of food security as the main food products. The examined groups were cereal products (bread, rice, and macaroni), livestock products (red meat, white meat, dairy, and egg), agricultural products (potato, vegetables, fruit, and grains), and other basic foodstuffs (sugar and oil). We extracted the data on urban and rural households' expenditures and incomes in the 2008–2018 period from the Statistics Center of Iran, the data of production, consumption, and domestic prices from the Iranian Ministry of Agriculture, the data on import and export quota from the Islamic Republic of Iran Customs Administration, and the data on the exchange rate from the Central Bank of the Islamic Republic of Iran. The research area was at the national level, and the cross-sectional data were collected from the base year (2018). The Quadratic Almost Ideal Demand System (QUAIDS) was used to estimate different demand elasticities from the data on price and households' consumption, expenditure, and incomes during the 2008–2018 period, extracted from the Statistics Center of Iran. The multimarket equilibrium model was solved in the GAMS software, and the F and T statistics in the SPSS software were used to compare the means. The data on the calorie intake degree from various products were obtained from the book entitled the Iranian Foodstuff Ingredients Table and the Health Journal website. After collecting the data and solving the base model (without applying price shocks), we evaluated the effects of applying price and income shocks on households' calorie intake separately for urban and rural income deciles with governmental and freelance jobs. The income data of different household deciles were extracted from the Statistics Center of Iran, and all deciles were analyzed thoroughly. However, to sum up the results, we considered the first three deciles as the poor, the four central deciles as the middle-income, and the last three deciles as the rich communities to present a thorough and perceivable analysis of the results.
3. Results and discussion
At first, it is necessary to extract the scenarios associated with the price shock of food products with regard to the price change trends. Based on the average price change of the selected products in households' food baskets in the past 10 years (from 2008 to 2018), we considered the 30% price hike scenario separately for the examined foodstuff groups. Furthermore, to define the scenario of households' nominal income compensation policy, we investigated the average nominal income change of government employees and freelancers in the 2008–2018 period and thus considered a 14% rise in the nominal income of government employees and a 20% surge in the nominal income of freelancers as households' nominal income compensation policy (Table 3).

Table 3. Defining price shock scenarios with/without nominal income compensation policies.
3.1. Outcomes of price hike scenarios
Table 4 display that the price hike of cereal products is not counted as a serious threat to food security since all calorie intake variations are below 4%. The biggest threat due to the increase in the price of cereal products is directed at poor households with government jobs, such that a 30% increase in the price of these products decreases the calorie intake of the mentioned households by 3.51%. According to the results of Table 5, a 30% price hike in livestock products considerably impacts the calorie intake of various household groups, though poor rural households are the most vulnerable group in this respect. A 30% surge in the price of these products brings about a 50.59% reduction in the calorie intake of these households. The severe vulnerability of poor rural households' food security to the price hike of livestock products is rooted in their highly low incomes (for not possessing livestock) and their sharply reduced purchasing powers. Furthermore, the food security vulnerability of rich urban households can be due to the high share of livestock products in their consumed food baskets besides their low contributions to producing these products. With respect to the variations in the calorie intake of various households, we cannot recognize the price hike of agricultural products as a serious threat to the food security of households. As shown by the Table 6, poor households with government jobs are the most vulnerable group to the price hike of agricultural products. A 7.42% decline in the calorie intake of these households due to the 30% hike in crop prices is the proof of this outcome. The food security vulnerability of poor households with governmental occupations to increased crop prices is rooted in the very low income of these households. The variations in the calorie intake of different household groups reveal that a 30% increase in the price of other basic products (sugar and oil) does not cause a serious threat to food security since the bulk of calorie intake variations is below 1%, and this value is slightly above 1% only for poor households with government jobs (Table 7). The results indicate that middle-income households, especially the rural freelance group, will enjoy food security during the price hike of different foodstuff groups. The reason for the surge in the calorie intake of middle-income households due to the price hike of different foodstuff groups can lie in the high contribution of these households to producing agricultural products. Finally, Table 8 presents the effects of the price shocks of different product groups on variations in the calorie intake of households.
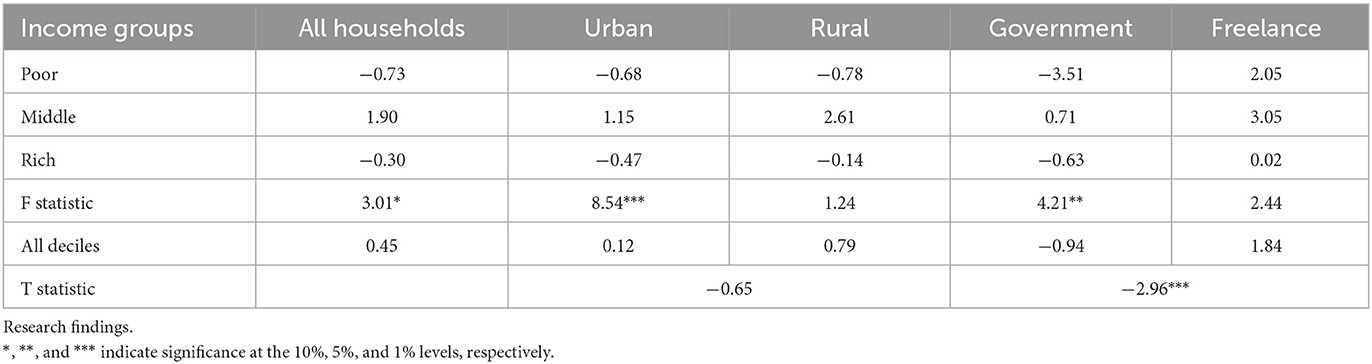
Table 4. Variations in calorie intake of different household groups due to applying scenario 1.
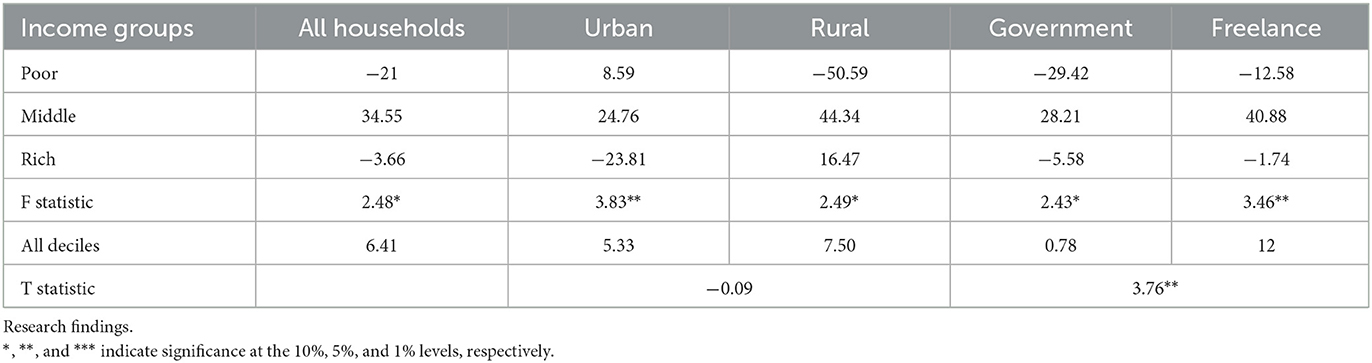
Table 5. Variations in calorie intake of different household groups due to applying scenario 2.
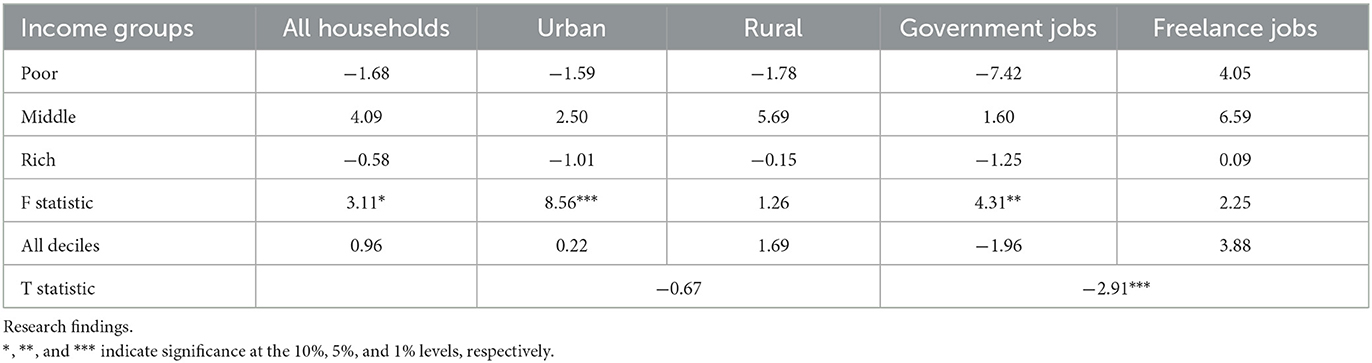
Table 6. Variations in calorie intake of different household groups due to applying scenario 3.
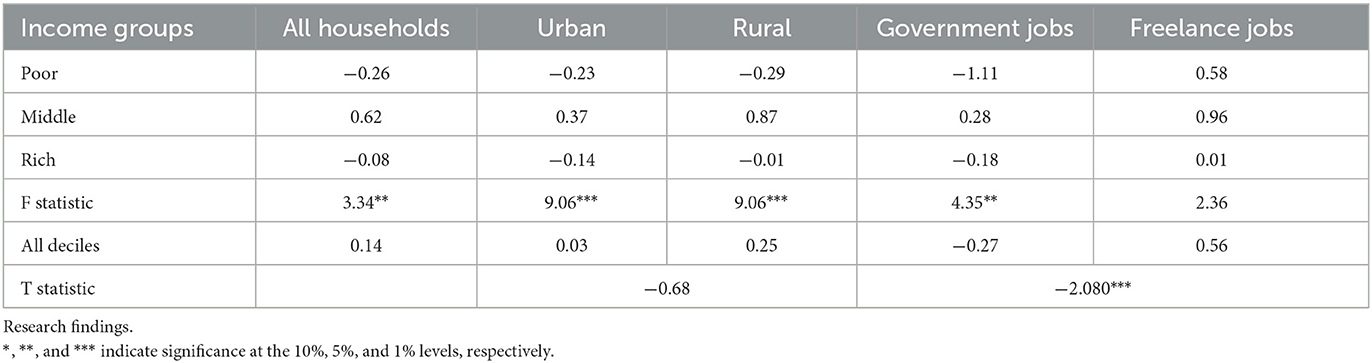
Table 7. Variations in calorie intake of different household groups due to applying scenario 4.
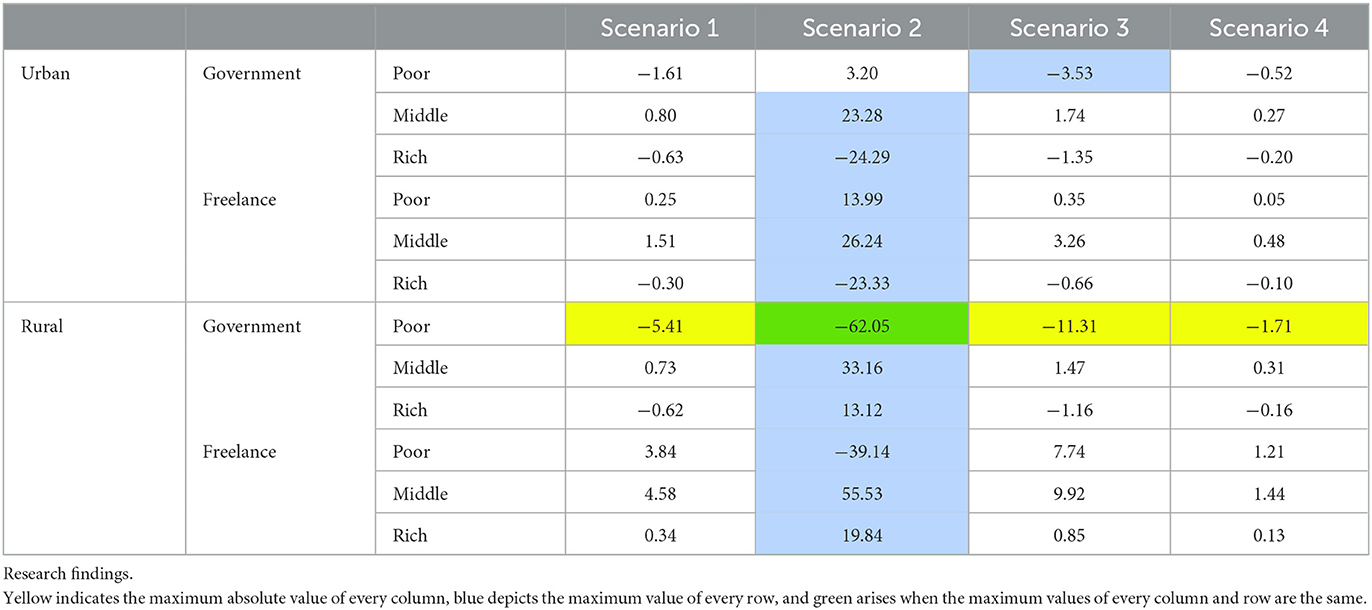
Table 8. Effects of price shocks of different product groups on households' food security.
As Table 8 shows, the maximum absolute value of every column is highlighted in yellow and indicates the most vulnerable household in food security terms for the considered scenario. The maximum absolute value in every row is highlighted in blue and denotes the most sensitive product for the respective household given the food security dimension. The green color arises when the most vulnerable household per scenario has a similar value to the most sensitive product per household, and the maximum absolute values are the same in the column and row of the table. Hence, by taking a columnar glance at Table 8 and considering the maximal number of colored cells and the green color in every row, we can discover that government-employed poor rural households are the most vulnerable group to the price hikes of foodstuffs. This finding reflects the fact that poverty and government careers are the two main criteria for individuals' vulnerability to price shocks. It is a proven fact that the urban and rural poor in most societies bear the most severe pressures during food crises (Haggblade et al., 2017). Also, Meanwhile, different results have been proven for some societies. In those societies, poor households have a high share in agricultural production, and increasing the price of these products can improve the purchasing power of these households and guarantee their food security (Van Campenhout et al., 2018).
On the other hand, by looking at the rows of Table 8, we conclude that the food security of all household groups, except for the urban poor with government occupations, depends on the price of livestock products. This is while the food security of poor urban households with government occupations is more dependent on the price of agricultural products than other product groups. Thus, with respect to the high number of colored cells and the green color in every cell, we can perceive that the price of livestock products is more sensitive, and price shocks to this group of products can lead to extreme variations in the food security of society. Nonetheless, this price hike becomes a serious threat to some households and a food security-improving driver for others. For example, the surge in the price of livestock products is counted as a serious threat to the food security of poor rural and rich urban households since poor rural households lose the capacity to purchase and consume cheaper livestock products desirably due to their lower incomes and reduced purchasing power resultant from the price hike of these products. Therefore, the food security of this group of households is enfeebled. Likewise, we can attribute rich urban households' food security vulnerability to the high share of livestock products in the consumed food baskets of these households and the low contribution of rich urban households to their production. However, the price hike of livestock products is an excellent driver for some other households, such as middle-income households with freelance jobs to improve their food security. The reason for the increased calorie intake of these households, especially those with freelance jobs, due to the price hike of livestock products is their high contribution to producing these products.
3.2. Outcomes of the nominal income compensation scenario
Table 9 presents the effects of the rise of nominal incomes to compensate for households reduced purchasing power derived from the increased price of various foodstuffs.
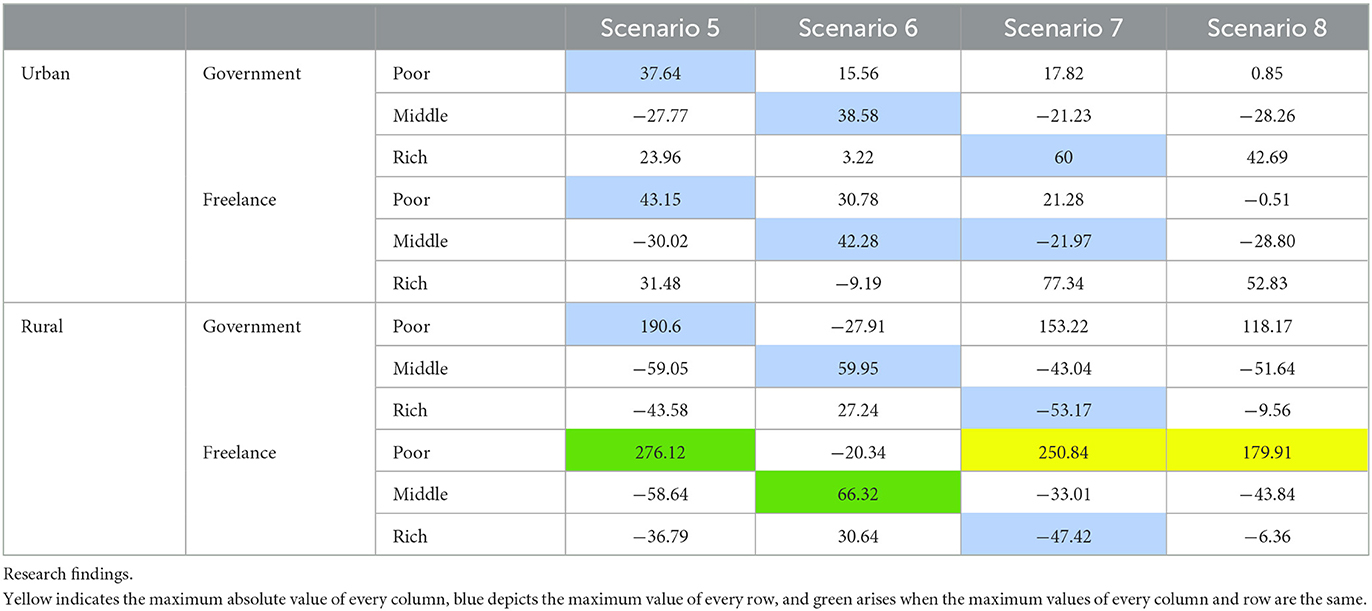
Table 9. Effects of income shocks with price of various product groups on households' food security.
With regard to the status of the blue and green colors in Table 9, we can deduce that scenarios 5, 6, and 7 maximally impact the calorie intake of poor, middle-income, and rich households, respectively. That is to say, if the price of cereal products rises, it will be highly influential and efficient to adopt a nominal income change policy toward the food security of underprivileged households. This is while the nominal income change is useful for rich and middle-income households when applied to compensate for the price hike of livestock and agricultural products.
Considering the yellow and green cells in Table 9, we can conclude that the most sensitive households to the surge of nominal incomes are poor rural households with freelance jobs. Thus, if the price of food products goes up, the government can play a significant role in preventing the food security withdrawal of poor households, especially the rural poor with freelance jobs, in society by raising nominal incomes.
The results also show that the calorie intake of poor (especially rural) severely increases and middle-income households (urban and rural) decreases, by raising incomes and the price of cereals, crops, and other basic products (sugar and oil). This result stems from the consumption pattern of the households of these two groups. Concerning the consumption pattern, we can reason that the surge of incomes firstly steers poor households to consume livestock products more; of course, if the price of these products remains constant. Secondly, it directs middle-income households to consume agricultural products more even if their prices hike. In study of Lawlor et al. (2019), it has been proven that the food security of poor rural households is greatly improved due to the increase in cash income. Fathi and Bakhshoodeh (2021) argued that the compensatory policy in the form of redistribution of the income obtained from eliminating energy subsidy carriers in the production process can result in the improvement of economic wellbeing.
In the end, we can conclude that the policy of increasing nominal incomes to compensate for the price hikes of livestock products can radically change the food security of society compared to other products. Likewise, this shock plays the role of a threat to food security for some households and a driver for others. Hence, changing nominal incomes when the price of livestock products increases is reckoned as an effective and, at the same time, risky approach for policy-makers.
4. Conclusion and suggestions
Today, the price hikes of foodstuffs have increased the concerns about the foodstuff security of households, especially in developing countries. Depending on households' wealth levels, consumption patterns, and contribution to foodstuff production, the expensiveness of foodstuffs can differently impact their food security. Thus, accurately identifying households vulnerable to the expensiveness of various foodstuffs can provide policy-makers with an inclusive map to determine efficient compensation policies toward guaranteeing food security at different social levels. The present study attempted to examine the effects of the price hikes of various foodstuffs on the food security of households accurately by classifying them from different aspects, including incomes (various income deciles), occupations (government and freelance jobs), and residences (urban and rural), to guide policy-makers in adopting proper political approaches.
For this purpose, Iran, a developing country always facing foodstuff inflation, was considered as the examined region. At first, products with high shares in households' food baskets were selected and classified into four groups, including cereal products (bread, rice, and macaroni), livestock products (red meat, white meat, dairy, and egg), agricultural products (potato, vegetables, fruit, and grains), and other basic foodstuffs (sugar and oil). Furthermore, we defined scenarios for a 10% hike in the price of foodstuffs and 14 and 20% surges in the incomes of households with government and freelance jobs considering the trend of variations in the selected foodstuff prices in the past 10 years (from 2008 to 2018). Then, we estimated the demand function of the selected foodstuffs with high shares in households' food baskets using the Quadratic Almost Ideal Demand System (QUAIDS) and calculated demand elasticities separately for various household groups. Afterward, the multimarket equilibrium model was employed to evaluate the degree of variations in the calorie intake of different urban and rural households with government and freelance jobs as a result of applying hikes in foodstuffs' prices and households' incomes.
The results showed that the food security of society was more sensitive to the price of livestock products than other foodstuffs. On the other hand, poor rural households with government occupations were the most vulnerable community to the price hike of various foodstuffs. Moreover, poor households, in general, and poor rural households, in particular, were more sensitive and reactive to the increase in nominal incomes. Therefore, we can introduce the income rise of this household group as an efficient tool for improving food security. Lastly, it was confirmed that the consumption patterns of households in various income groups differed, and the reactions to the price hikes of various foodstuffs were extensively variable, such that the surge in incomes led poor households to consume livestock products more if their prices remained constant and middle-income households to consume agricultural products more despite the rise in their prices. Therefore, we cannot evaluate all households together as a whole unit when analyzing the food security of a society and need to assess the effects of different scenarios on separate households.
Data availability statement
The original contributions presented in the study are included in the article/supplementary material, further inquiries can be directed to the corresponding author.
Ethics statement
Data obtained from each organization were kept confidential, and all organizations participated in the study were acknowledged. The consent form has been read to me and voluntarily I agree to participate in this study.
Author contributions
All authors participated in data collection, supervision, analysis, description, and drafted the manuscript.
Funding
This work was supported by Sari Agricultural Sciences and Natural Resources University.
Conflict of interest
The authors declare that the research was conducted in the absence of any commercial or financial relationships that could be construed as a potential conflict of interest.
Publisher's note
All claims expressed in this article are solely those of the authors and do not necessarily represent those of their affiliated organizations, or those of the publisher, the editors and the reviewers. Any product that may be evaluated in this article, or claim that may be made by its manufacturer, is not guaranteed or endorsed by the publisher.
References
Abdelhedi, I. T., and Zouari, S. Z. (2020). Agriculture and food security in North Africa: a theoretical and empirical approach. J. Knowl. Econ. 11, 193–210. doi: 10.1007/s13132-018-0528-y
Akbari, M., Foroudi, P., Shahmoradi, M., Padash, H., Parizi, Z. S., Khosravani, A., and Cuomo, M. T. (2022). The evolution of food security: where are we now, where should we go next? Sustainability 14, 3634. doi: 10.3390/su14063634
Amolegbe, K. B., Upton, J., Bageant, E., and Blom, S. (2021). Food price volatility and household food security: evidence from Nigeria. Food Policy 102, 102061. doi: 10.1016/j.foodpol.2021.102061
Barrett, C. B. (2010). Measuring food insecurity. Science 327, 825–828. doi: 10.1126/science.1182768
Bennett, M. K. (1941). International contrasts in food consumption. Geograph. Rev. 31, 365–376. doi: 10.2307/210172
Brinkman, M., Levin-Koopman, J., Wicke, B., Shutes, L., Kuiper, M., Faaij, A., et al. (2020). The distribution of food security impacts of biofuels, a Ghana case study. Biomass Bioenergy 141, 105695. doi: 10.1016/j.biombioe.2020.105695
Brizmohun, R. (2019). “Impact of climate change on food security of small islands: the case of Mauritius,” in Natural Resources Forum, Vol. 43, No. 3. (Oxford, UK: Blackwell Publishing Ltd.), p. 154–163. doi: 10.1111/1477-8947.12172
Deaton, A. (1989). Rice prices and income distribution in Thailand: a non-parametric analysis. Econ. J. 99, 1–37. doi: 10.2307/2234068
Deaton, A., and Muellbauer, J. (1980). Economics and Consumer Behavior. Cambridge: Cambridge University Press. doi: 10.1017/CBO9780511805653
Devereux, S., Béné, C., and Hoddinott, J. (2020). Conceptualising COVID-19's impacts on household food security. Food Security 12, 769–772. doi: 10.1007/s12571-020-01085-0
Dick, N. A., and Wilson, P. (2018). Analysis of the inherent energy-food dilemma of the Nigerian biofuels policy using partial equilibrium model: the Nigerian energy-food model (NEFM). Renew. Sustain. Energy Rev. 98, 500–514. doi: 10.1016/j.rser.2018.09.043
FAO (2022). FAO Food Price Index. Available online at: https://www.fao.org/worldfoodsituation/foodpricesindex/en/ (accessed 2022).
Fathi, F., and Bakhshoodeh, M. (2021). Economic and environmental strategies against targeting energy subsidy in Iranian meat market: a game theory approach. Energy Policy 150, 112153. doi: 10.1016/j.enpol.2021.112153
Haggblade, S., Me-Nsope, N. M., and Staatz, J. M. (2017). Food security implications of staple food substitution in Sahelian West Africa. Food Policy 71, 27–38. doi: 10.1016/j.foodpol.2017.06.003
Hejazi, J., and Emamgholipour, S. (2022). The effects of the re-imposition of US sanctions on food security in Iran. Int. J. Health Policy Manage. 11, 651. doi: 10.34172/ijhpm.2020.207
Hoddinott, J., Sandström, S., and Upton, J. (2018). The impact of cash and food transfers: evidence from a randomized intervention in Niger. Am. J. Agricult. Econ. 100, 1032–1049. doi: 10.1093/ajae/aay019
Hoddinott, J., and Yohannes, Y. (2002). Dietary Diversity as a Food Security Indicator (No. 583-2016-39532).
Kalkuhl, M., Von Braun, J., and Torero, M. (2016). Food Price Volatility and its Implications for Food Security and Policy (Berlin: Springer Nature), p. 626. doi: 10.1007/978-3-319-28201-5
Kansiime, M. K., Tambo, J. A., Mugambi, I., Bundi, M., Kara, A., Owuor, C., et al. (2021). COVID-19 implications on household income and food security in Kenya and Uganda: Findings from a rapid assessment. World Develop. 137, 105199. doi: 10.1016/j.worlddev.2020.105199
Lawlor, K., Handa, S., Seidenfeld, D., and Zambia Cash Transfer Evaluation Team. (2019). Cash transfers enable households to cope with agricultural production and price shocks: evidence from Zambia. J. Develop. Stud. 55, 209–226. doi: 10.1080/00220388.2017.1393519
Leroy, J. L., Ruel, M., Frongillo, E. A., Harris, J., and Ballard, T. J. (2015). Measuring the food access dimension of food security: a critical review and mapping of indicators. Food Nutr Bull. 36, 167–195. doi: 10.1177/0379572115587274
Lin, H. I., Yu, Y. Y., Wen, F. I., and Liu, P. T. (2022). Status of food security in East and Southeast Asia and challenges of climate change. Climate, 10, 40. doi: 10.3390/cli10030040
Louie, S., Shi, Y., and Allman-Farinelli, M. (2022). The effects of the COVID-19 pandemic on food security in Australia: a scoping review. Nutr. Dietetics, 79, 28–47. doi: 10.1111/1747-0080.12720
Minot, N. (2014). Food price volatility in sub-Saharan Africa: has it really increased?. Food Policy, 45, 45–56. doi: 10.1016/j.foodpol.2013.12.008
Nébié, E. K. I., Ba, D., and Giannini, A. (2021). Food security and climate shocks in Senegal: who and where are the most vulnerable households?. Global Food Secur. 29, 100513. doi: 10.1016/j.gfs.2021.100513
Rad, A. K., Shamshiri, R. R., Azarm, H., Balasundram, S. K., and Sultan, M. (2021). Effects of the COVID-19 pandemic on food security and agriculture in Iran: a survey. Sustainability 13, 10103. doi: 10.3390/su131810103
Sheriff, M. A., Lakoh, K. A., Conteh, B. K., and Nkunzimana, T. (2020). Market and welfare effects of food security policies on smallholder rice farmers and consumers in sierra leone. J. Agricult. Sci. 12, 6. doi: 10.5539/jas.v12n6p76
Sileshi, G. W., and Gebeyehu, S. (2021). Emerging infectious diseases threatening food security and economies in Africa. Global Food Secur. 28, 100479. doi: 10.1016/j.gfs.2020.100479
Statistical Center of Iran (2018). Summary of the Results of the Cost and Income Statistics Project of Urban and Rural Households.
Statistical Center of Iran. (2021). Population Estimates, Population and Household Forecast by Urban and Rural Areas, Province and City- year 2021. Available online at: https://www.amar.org.ir/english (accessed 2022).
Statistical Center of Iran. (2022). Consumer Price Index. Publication date of December 2022. Available online at: https://amar.org.ir/Portals/0/News/1401/shg019.pdf?ver=YXYs4R_2tJ6SbAJMJR51TQ%3d%3d (accessed 2022).
Thome, K., Meade, B., Rosen, S., and Beghin, J. C. (2017). “Assessing Food Security in Ethiopia,” in World Agricultural Resources and Food Security (Bingley: Emerald Publishing Limited), p. 207–19. doi: 10.1108/S1574-871520170000017014
Timmer, C. P. (2017). Food security, structural transformation, markets and government policy. Asia Pacific Policy Stud. 4, 4–19. doi: 10.1002/app5.161
Van Campenhout, B., Pauw, K., and Minot, N. (2018). The impact of food price shocks in Uganda: first-order effects versus general-equilibrium consequences. Europ. Rev. Agricult. Econ. 45, 783–807. doi: 10.1093/erae/jby013
Wood, R. G. (2011). Is There a Role for Cash Transfers in Climate Change Adaptation? Paper Presented at the International Conference on Social Protection for Social Justice (UK, Institute of Development Studies). doi: 10.1111/j.1759-5436.2011.00277.x
Wossen, T., Berger, T., Haile, M. G., and Troost, C. (2018). Impacts of climate variability and food price volatility on household income and food security of farm households in East and West Africa. Agricult. Syst. 163, 7–15. doi: 10.1016/j.agsy.2017.02.006
Keywords: foodstuff price hikes, income policy, multimarket simulation model, calorie intake, categories of households, Iran
Citation: Banaie E, Mojaverian SM and Mirzaei A (2023) Determining vulnerable households and food groups sensitive to price and income increase from the perspective of food security: Evidence from Iran. Front. Sustain. Food Syst. 7:1161040. doi: 10.3389/fsufs.2023.1161040
Received: 07 February 2023; Accepted: 06 March 2023;
Published: 22 March 2023.
Edited by:
Naser Valizadeh, Shiraz University, IranReviewed by:
Farideh Tabatabaei Yazdi, Ferdowsi University of Mashhad, IranMehdi Kazemnejad, Planning Research Institute, Iran
Fatemeh Rastegaripour, University of Torbat Heydarieh, Iran
Copyright © 2023 Banaie, Mojaverian and Mirzaei. This is an open-access article distributed under the terms of the Creative Commons Attribution License (CC BY). The use, distribution or reproduction in other forums is permitted, provided the original author(s) and the copyright owner(s) are credited and that the original publication in this journal is cited, in accordance with accepted academic practice. No use, distribution or reproduction is permitted which does not comply with these terms.
*Correspondence: Abbas Mirzaei, YW1pcnphZWlAYXNucnVraC5hYy5pcg==