 Ubair Nisar
 Zhixin Zhang
 Zhaocai Cui1
 Yongtong Mu
 Hongzhi Zhang
- 1School of Economics, Shandong University of Technology, Zibo, China
- 2Department of Fisheries Economics and Management, Ocean University of China, Qingdao, China
- 3Shandong Foreign Trade Vocational College, Qingdao, China
For China's fish and crustacean trade globally, the COVID-19 pandemic outbreak in 2020 has posed previously unprecedented challenges. This study investigates these concerns by analyzing China's fish and crustacean export activities and correlating the shift in trade throughout the pre-pandemic and pandemic phases. Despite the numerous factors for the changing trade, this research attempts to explain those related to the pandemic and coping mechanisms. The investigation is supported by and linked to a conceptual framework for the resilience of the perishable agricultural food system by China during the pandemic. The results indicated that fish and crustacean exports from China decreased as the incidence of infections increased both globally and within the country. Trade with important markets including Japan, Korea, and the United States was badly affected by the outbreak. While shipments to Korea saw the fastest growth throughout the pandemic, the monthly growth rate of fish exports to the USA was the lowest. However, China's fish and crustacean trade recovered well after the epidemic, with faster growth rates and lower instability. The pandemic even resulted in a decrease in the unit value realized for all fish and crustacean commodities. The government's long-term efforts to ensure food security and prompt policy responses during the outbreak have demonstrated that China's food system can endure and rebound from perturbations. China's “green route” for perishable agricultural goods in the domestic market and prohibition on illegal obstructions serve as examples of how to maintain supply flow during an outbreak.
1. Introduction
The exports of seafood from China are diverse and include a broad spectrum of species and product categories. From raw seafood such as frozen whole fish to value-added processed seafood like fish filets, crustaceans and mollusks. In recent decades, trade patterns have changed, with varying growth rates among different product forms. It has been noted that China is at the forefront of a trend in the seafood industry, where comparative advantage determines processing locations and advanced freezing technology has made it possible to separate processing from landing points (Asche et al., 2016). This has led to China becoming the largest importer of various species from different sources such as Norwegian frozen cod (Asche et al., 2018), US frozen salmon, and Alaska pollock (Roheim and Zhang, 2018), as well as a significant exporter of value-added frozen seafood like filets (Asche et al., 2018).
The COVID-19 pandemic had far-reaching effects on all aspects of society and the food industry was no exception. The first quarter of 2020 saw a 6.8% decline in China's economy, according to the China National Bureau of Statistics (NBS, 2020). The pandemic had a significant impact on food security, food safety, and sustainability in the food industry (Galanakis, 2020). The pandemic has led to increased concerns about international food security (FSIN, 2020) and the global economy declined by 4.9% in 2020, worse than the 2008–2009 financial crisis, according to the IMF's June report (IMF, 2020). Governments had to close significant parts of their economies to curb the spread of the virus, including businesses, restaurants, and schools, leading to a rise in poverty rates (Sumner et al., 2020). The food crisis is expected to follow (Conti et al., 2020; World Food Programme, 2020). The entire food system, including primary supply, processing, trade, logistics, and demand, has been impacted by the pandemic, disrupting the food system at multiple levels and supply chains (Devereux et al., 2020; Hobbs, 2020; Chenarides et al., 2021). Examining the effects of the pandemic on the food system highlights areas of vulnerability, and provides insights into how governments, non-government organizations, businesses, local actors, and civil society can respond and prepare for future shocks.
Seafood encompasses a range of species and production and distribution methods, making it one of the most widely traded food commodities globally and regionally (Gephart and Pace, 2015; Bellon et al., 2018). The first reported cases of COVID-19 were linked to a seafood market in Wuhan, and subsequent outbreaks in other cities in China, such as Beijing, Dalian, and Qingdao, were traced back to similar markets, processing facilities, and imported frozen seafood (Han et al., 2020; Jalava, 2020; Djekic et al., 2021). The pandemic has had a significant and unanticipated impact on the fish production and supply chains in China, which is the largest producer and consumer of shellfish globally (Peng et al., 2019, 2021; FAO, 2020a,b). The closure of some fisheries, market disruptions, and heightened health hazards for coastal communities, increased vulnerability among disadvantaged groups, and an uptick in illegal fishing have all had detrimental effects on the fishing industry (Bennett et al., 2020). Although COVID-19 does not infect aquatic species (Godoy et al., 2021), it has been found on packaging materials and in storage settings (Han et al., 2020), and the virus has been isolated from the surface of an imported frozen seafood container. These widely reported incidents have raised questions about the safety of seafood, including shellfish, making it harder for supply chain players to survive the pandemic (Perillo et al., 2021). Some early analysis suggests short- to medium-term concerns for the fish market, such as delayed production, import restrictions and heightened inspections, delayed transportation, decreased prices, and reduced consumption (Globefish, 2020; Haas et al., 2021; Love et al., 2021).
China leads the World fish market with a trade volume of $39.36 billion in 2019 (China Agriculture Press, 2020). The country's imports and exports account for 9% and 14% of the global fish trade, respectively (FAO, 2020c). Over the past six years, imports have shown rapid growth, while exports have remained stable since 2013, exceeding $20 billion (Zhang et al., 2021). The export of fish and crustaceans to the World market has also fluctuated, experiencing a significant decline in 2020 due to the pandemic.
China and India play a major role in the World's exports, as their fish capture and production are showing a steady increase annually (Nisar et al., 2021). However, after the pandemic, trade has improved in both value and quantity (Figure 1). The pandemic also resulted in a decline in global fish production in 2020, but by 2021, production levels had recovered thanks to the ongoing economic recovery in most countries. The Omicron surge at the end of 2021 temporarily delayed this recovery, but it has since resumed as fishing vessels, fish farmers, and the downstream supply chain industries are returning to normal levels of operation with easing workplace restrictions, easier access to labor, and improving logistics (FAO, 2022).
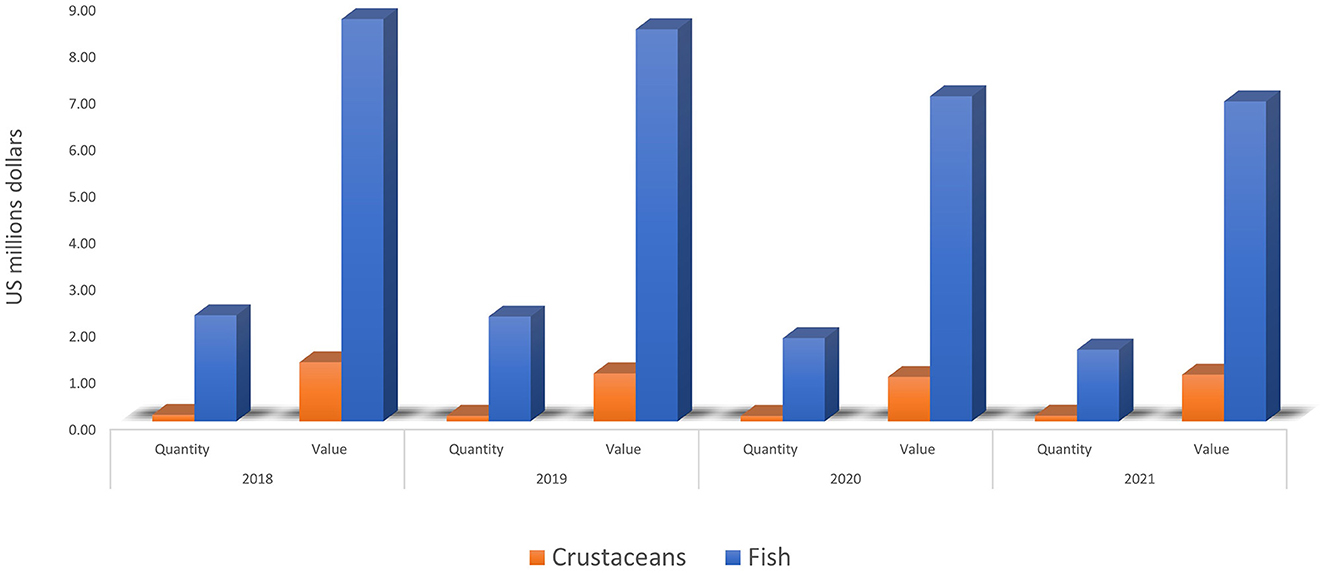
Figure 1. Performance of China's fish and crustacean export to the World (2019–2021).
The purpose of this study was to assess the effects of the COVID-19 pandemic on China's exports of fish and crustaceans. The research evaluates the fluctuations in China's fish trade in correlation to monthly COVID-19 cases in China and globally, from 2020. The examination of China's seafood trade recovery has been divided into three phases: pre-pandemic (2019), pandemic (2020), and the year after (2021) to provide a clearer understanding of trade shifts. Additionally, the study examines the changes in the global market share of fish and crustaceans during these three phases. China's seafood exports have a wide range of markets. In 2020, Japan was the largest market for seafood, accounting for 14.5% of total exports, followed by South Korea (12.3%) and the United States (11.6%) (China's Fishery Report, 2021). Japan, South Korea, and the United States being the major markets for China's seafood exports, it is essential to understand the impact of COVID-19 on these markets. To this end, the study analyzes China's exports of fish and crustaceans to these key markets in the years 2019, 2020, and 2021, providing insight into the changes in exports during the pandemic and recovery period.
There is no single, agreed-upon definition of resilience. Instead, its meaning varies widely across different fields of study and is highly dependent on the context, including policy environments and institutional objectives (Tendall et al., 2015). The Intergovernmental Panel on Climate Change (IPCC) defines resilience as “the ability of social, economic, and environmental systems to withstand and recover from adverse events or trends, while maintaining their essential functions, identity, and structure, as well as their capacity for adaptation, learning, and transformation” (Field and Barros, 2014; Panel, 2020). The Food and Agriculture Organization (FAO) describes resilience as “the ability to prevent, withstand, and recover from disasters and crises in a timely, efficient, and sustainable manner” (FAO, 2018).
2. Methodology
Data for COVID-19 cases in China were collected from National Health Commission of the People's Republic of China (NHC, 2022). Data for infections in other countries were collected from the World Health Organization (WHO, 2022). Policies and market information were collected from news articles relevant to COVID-19 pandemic from December 2019 to December 2021. Data on China's fish and crustacean exports for the years 2019, 2020, and 2021 were obtained from the UN's statistical databases UNCOMTRADE.COM and trademap.org (TRADE MAP, 2018). To account for exchange rate fluctuations, all export values have been expressed in US dollars.
The share of exports of individual items of fish and crustacean products from China to World were calculated using the equation
Unit realized per kilogram of product has been estimated using unit value realization by connoting total exported value to exported quantity of fish and crustaceans from China to World.
2.1. Growth analysis
Compounded monthly rate of growth was used to measure the trends in the exports of China's fish and crustaceans to the World during the period of 2019, 2020, and 2021. If yt is the study variable at time period t, then the mathematical expression employed for computation of compound growth rate (CGR) r is conventionally given by
In general, after a multiplicative error ε is assumed in the above equation, natural logarithmic transformation is done throughout to make it a linear statistical model. That is,
The above model can be rewritten as
Applying the logarithmic property of exponents (ln(a∧b) = b * ln(a)):
Now, considering the multiplicative error term ε, we introduce it into the equation:
The above model can be rewritten as
Where, A = ln Yo, B = ln(1+ r), ε' = ln ε
Unknown parameters A and B have been estimated by method of Ordinary Least Square. Thus, once B is estimated the CMGR estimate is given by
2.2. Instability index
Instability in export is expected to hamper the process of economic development. This analysis was used to find out the fluctuations in the export of China's fish and crustacean exports to World markets. To study the export instability we have taken into account Cuddy Della Valle Index (CDVI) (Cuddy and Valle, 1978) that uses trend present in the time series data and gives the modified (Coefficient of variation)
Where,
Ix = Cuddy Della Valle index of instability,
CV = coefficient of variation and
adjusted coefficient of multiple determination.
2.3. Revealed comparative advantage ratios
The concept of RCA was first developed by Balassa (1965) RCA indices can be measured by the relative export share of a country in the World export of the individual commodity. It was used to study the comparative advantage of Chinese fish and crustacean export to the World market for the period 2019, 2020 and 2021.
If RCA > 1, Country has revealed comparative advantage in that commodity.
If RCA < 1, Country has revealed comparative advantage in that commodity.
If RCA=1, Comparative neutrality.
2.4. Analytical framework
The examination of China's fish and crustacean imports and exports provides insight into the changes in the fish trade industry. The monthly import and export data for fish and crustaceans during 2020 (the pandemic period), 2019 (the pre-pandemic period), and 2021 (the recovery period) were analyzed and compared. The study is divided into two parts. The first part focuses on the relationship between the COVID-19 pandemic and the changes in the fish trade, in relation to the rise and fall of infections in China and globally. The second part analyzes China's export performance of fish and crustaceans in the pre-pandemic, pandemic, and recovery periods. The term “fish trade” refers to products classified under codes 0301 (live fish), 0302 (fresh or chilled fish), 0303 (frozen fish), 0304 (fish filets and other fish meat), and 0305 (dried, salted, or brined fish, and fish meal fit for human consumption). The term “crustacean trade” refers to products classified under code 0306 (crustaceans, live, fresh, chilled, frozen, dried, salted, or brined; crustaceans, cooked by steaming or boiling in water, chilled or not, frozen, dried, salted, or brined). The fish trade and crustacean trade is classified under specific codes within the Harmonized System (HS) for international trade.
3. Results
3.1. Impact on fish exports during the COVID-19 pandemic infections in China
The COVID-19 pandemic, with its epicenter in Wuhan, China, spread globally. According to UN COMTRADE, the total exports of fish and crustaceans from China in 2020 amounted to $6968.48 million and $951.62 million, respectively. In a year-over-year comparison, the fish export decreased by 17.09% and the crustacean export decreased by 7.46%. During 2020, the imports of crustaceans and fish decreased by 16% and 30.65% respectively.
When analyzing the changes in fish exports from 2020 to 2019, it was observed that the export initially decreased by −19.50% in January, when there were 10,986 new COVID-19 cases. The number of cases increased dramatically in February, resulting in the lowest export fluctuation of almost −38%. As the number of new cases decreased, the export percentage also decreased, albeit more slowly than in January and February, as shown in Figure 2A. The month of September 2020 saw the smallest change in exports, and by the end of December, the value had dropped to −18.44%. The average change in fish exports from 2019 to 2020 was −17.80%, highlighting the impact of the pandemic on the fish trade.
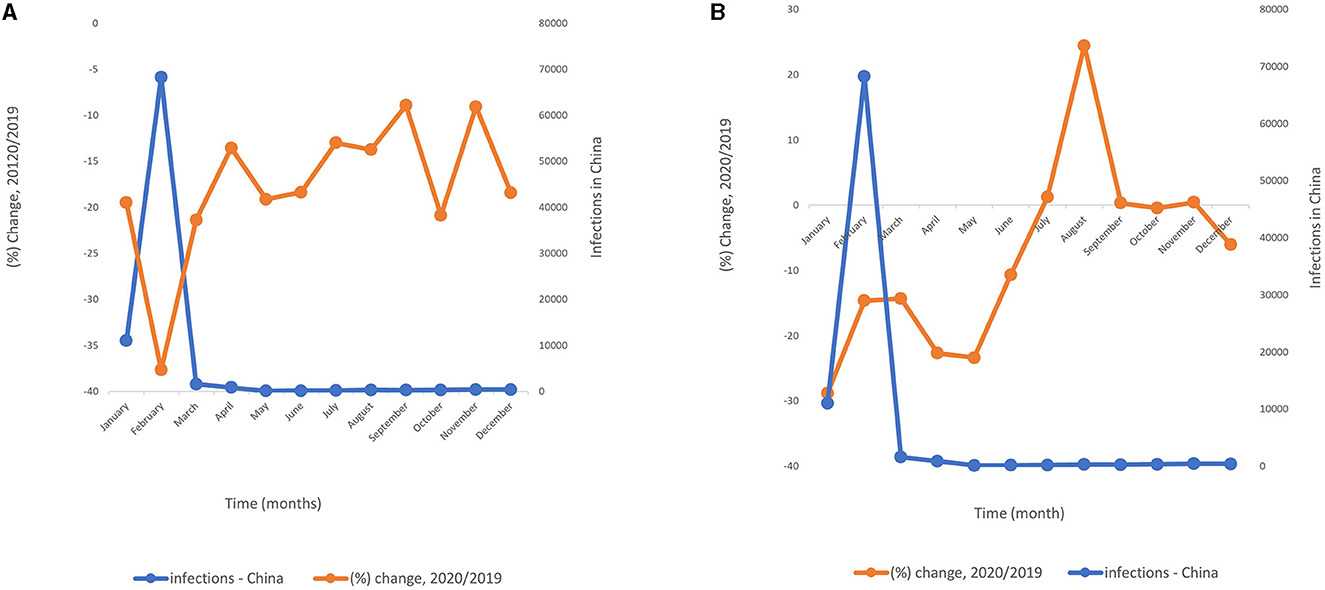
Figure 2. (A) Association of new COVID-19 infections in China from January to December 2020 with China's fish exports in 2020/2019. (B) Association of new COVID-19 infections in China from January to December 2020 vs China's crustacean exports in 2020/2019.
Similarly, for the crustacean export changes from 2020 to 2019, the lowest percentage change was found in January (−28.83%) followed by May (−23.40%) and April (−22.71%). The trade started to recover strongly after June and showed positive developments. The average change in the crustacean export in 2020 was −7.89%, which was less than half the change in the fish export over the same period, as shown in Figure 2B.
In our analysis, we investigated the relationship between the total fish export and the monthly COVID-19 cases for the year 2020. The regression model exhibited a strong fit to the data, with a Multiple R value of 0.8119, indicating a robust positive linear relationship between the variables. We found that ~65.93% of the variability in the total fish export could be explained by the model, as reflected by the R-squared value of 0.6593. The Adjusted R-squared value of 0.6252, which considers the number of predictors, further underscored the model's ability to explain variability.
Our analysis of variance (ANOVA) yielded a significant F-statistic (F = 19.352, p = 0.00134), providing compelling evidence for the overall significance of the regression model. The coefficients shed light on the relationship between the variables: The intercept, representing the expected total fish export when the monthly COVID-19 cases are zero, was estimated at 708.4884. The coefficient for the monthly COVID-19 cases variable was −0.00603. This coefficient signifies that, on average, for each unit increase in monthly COVID-19 cases, there was a decrease of about 0.00603 units in the total fish export. Both coefficients exhibited statistical significance (p < 0.05). The intercept displayed a t-statistic of 25.8977, while the monthly COVID-19 cases variable demonstrated a t-statistic of −4.3991.
3.2. Impact on fish exports during the COVID-19 pandemic infections in World
As shown in Figures 3A, B, we compared the export patterns of fish and crustaceans from January to September in 2020/2019 with the global COVID-19 infections. As new infections rose, the fish export trade improved until April, when it started to gradually decrease. The trade regained momentum in June and showed an upward trend until September. The critical period for China's fish export was from April to June, during which the trade dropped by 17.03%. When looking at the export trend of crustaceans, it was found that as the global COVID-19 cases increased, the export also increased until March, when the export share started to decrease with the rising infections, lasting until May. Later, as new infections continued to rise, the crustacean trade began to improve and continued to do so until September.
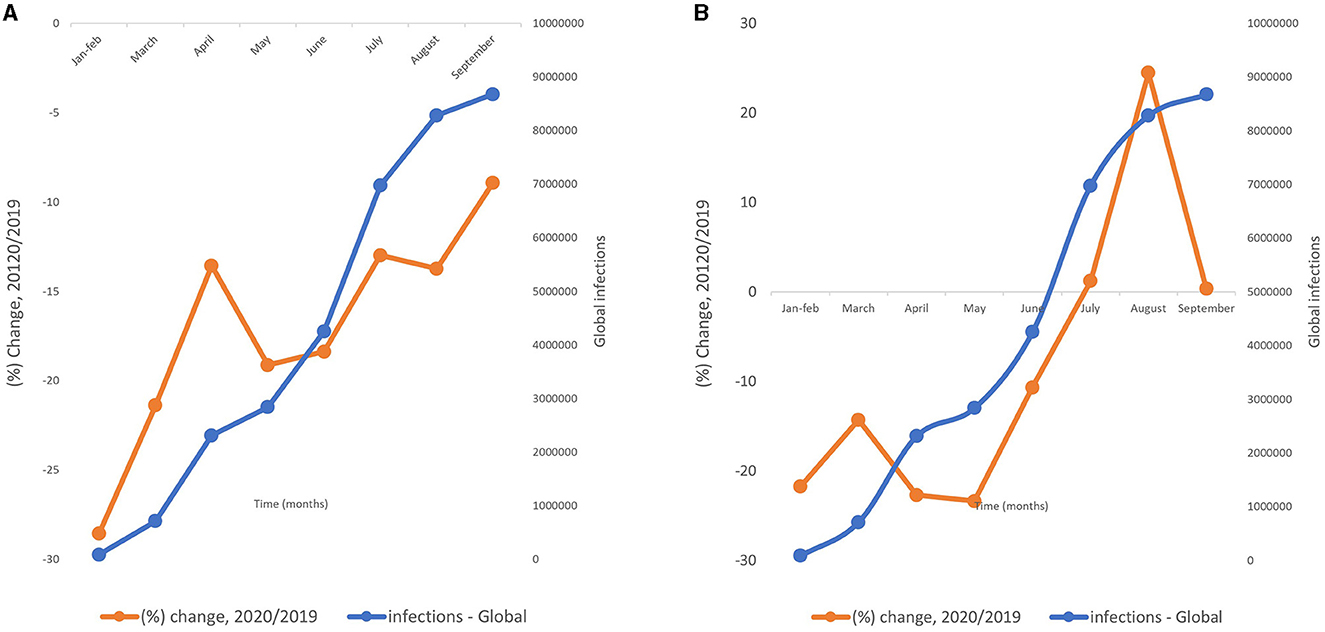
Figure 3. (A) Association of new COVID-19 infections globally from January to December 2020 vs China's fish exports in 2020/2019. (B) Association of new COVID-19 infections globally from January to December 2020 vs China's crustacean exports in 2020/2019.
3.3. Export of fish and crustaceans to major export markets
The export of fish from China to Japan, Korea, and the United States is presented in Tables 1–3 respectively. It was observed that during the time of pandemic the fish trade with Japan showed a steep decrease until April, followed by a gradual decline until August. However, the trade rebounded in September with a 49.60% increase and then gradually decreased again until the end of the year. The export of fish to Korea, on the other hand, decreased until April before starting to rise from May. The export finally started to decline again from September to December. The fish trade in the United States improved in June and then declined until the end of the year. Due to the COVID-19 outbreak, China's fish trade was greatly affected, causing losses in its primary export markets. Similar patterns were observed for China's exports of crustaceans to these countries (Tables 4–6). Comparative trade fluctuations to these countries during the period from 2018–2022 for the fish and crustaceans are presented in Figures 4, 5 respectively.
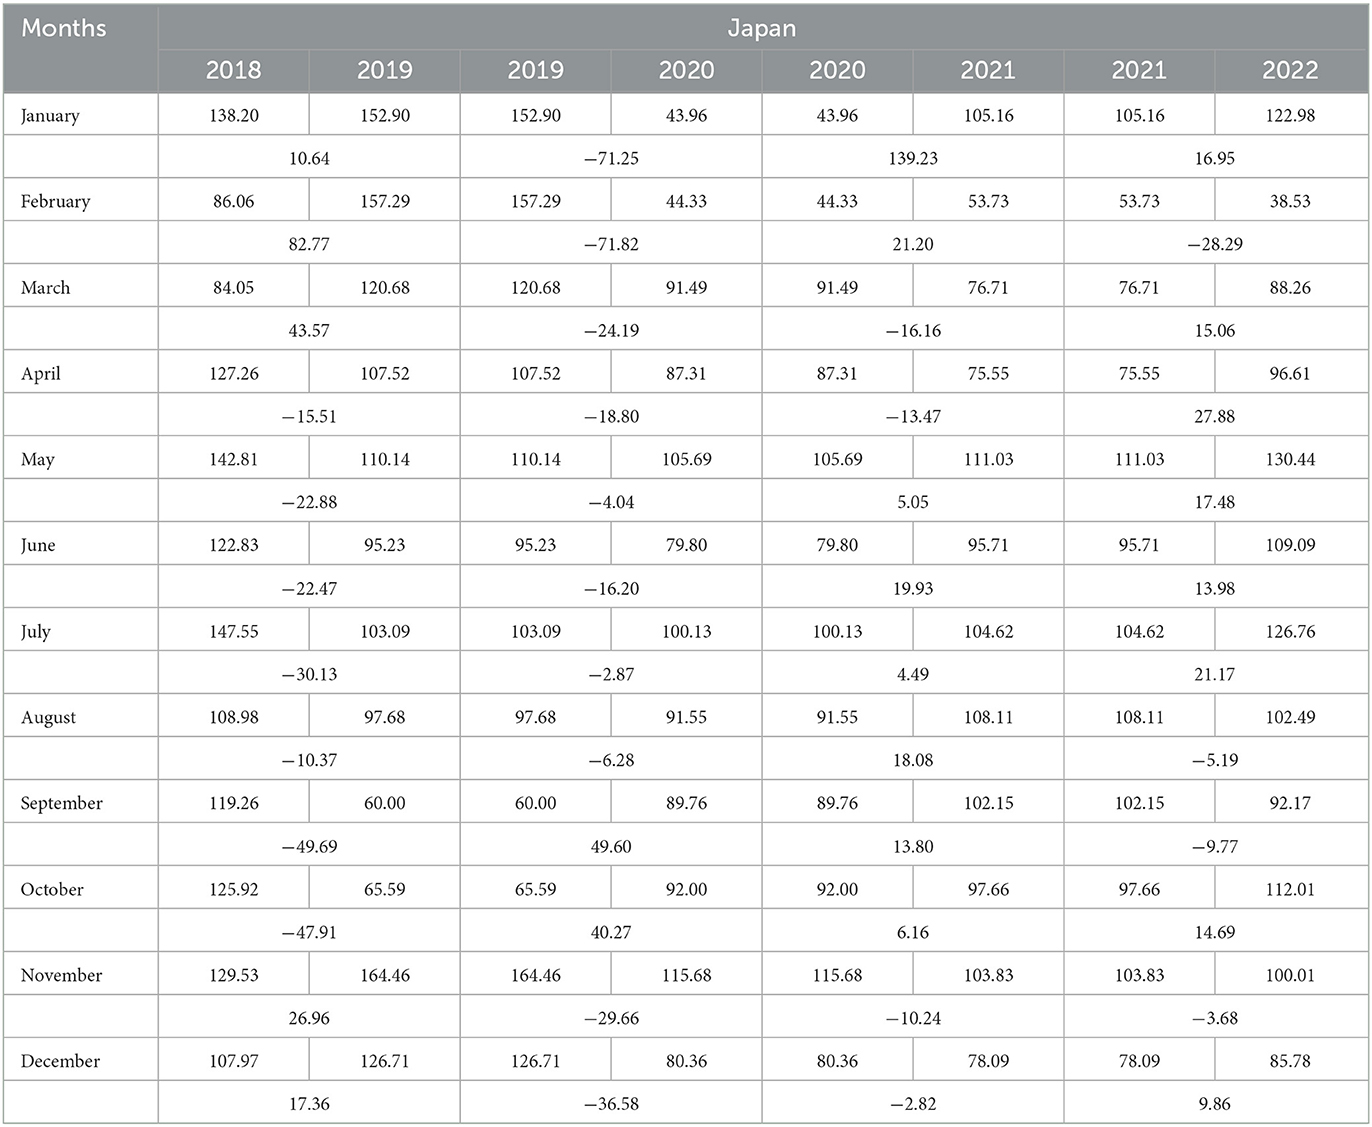
Table 1. China's fish export to Japan from 2018 to 2022.
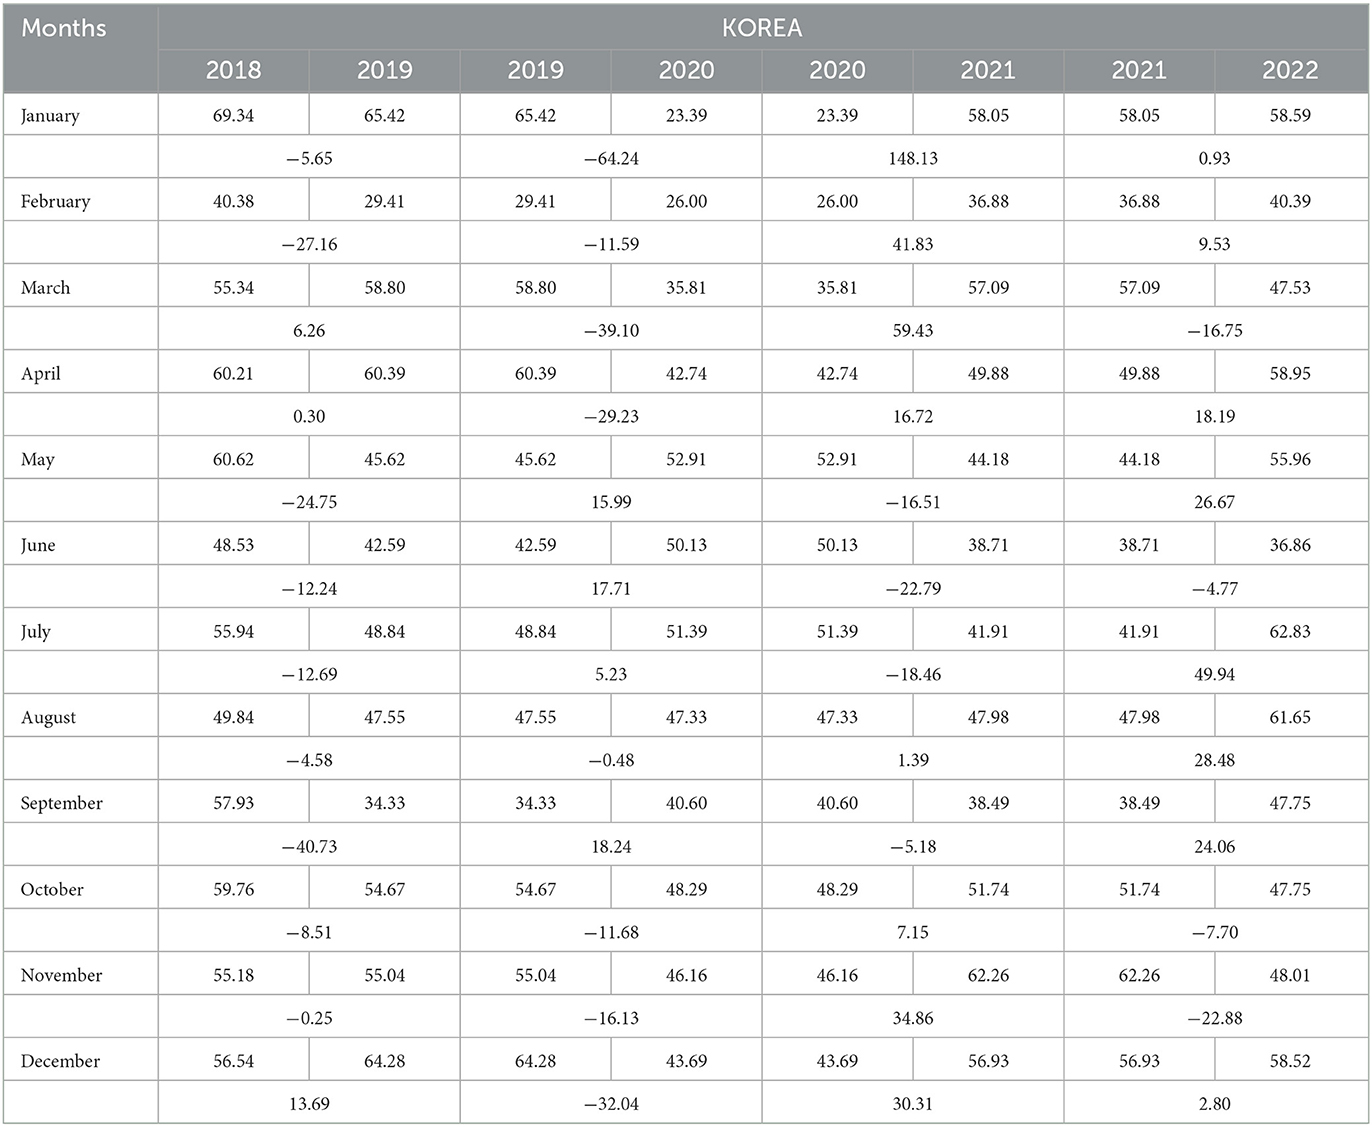
Table 2. China's fish export to Korea from 2018 to 2022.
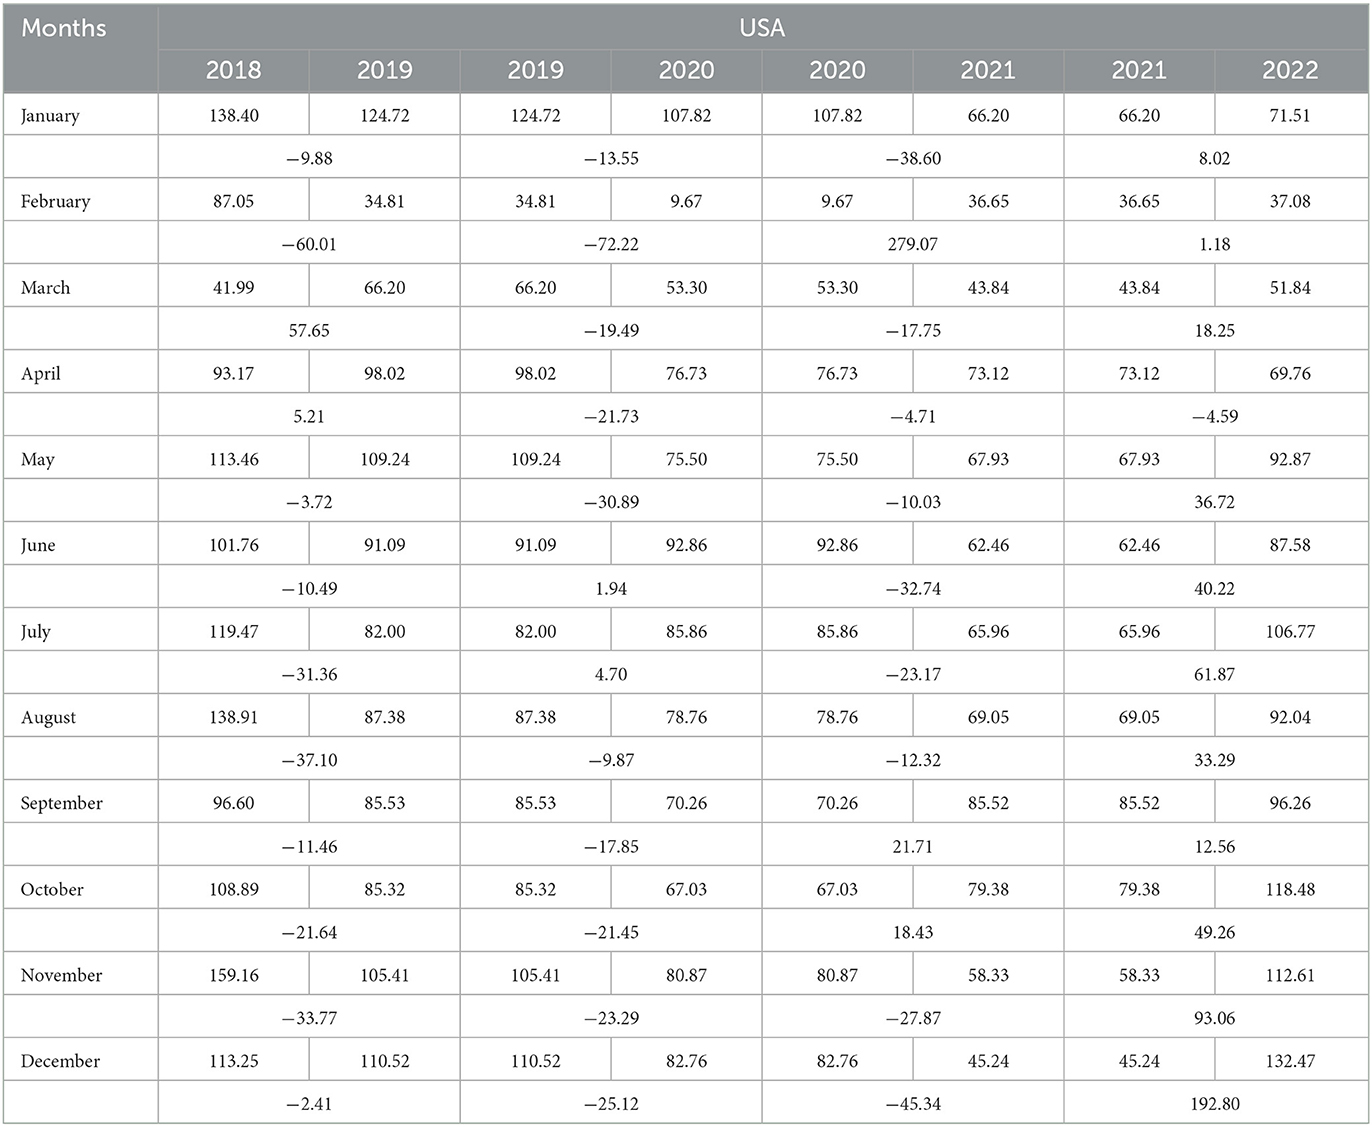
Table 3. China's fish export to USA from 2018 to 2022.
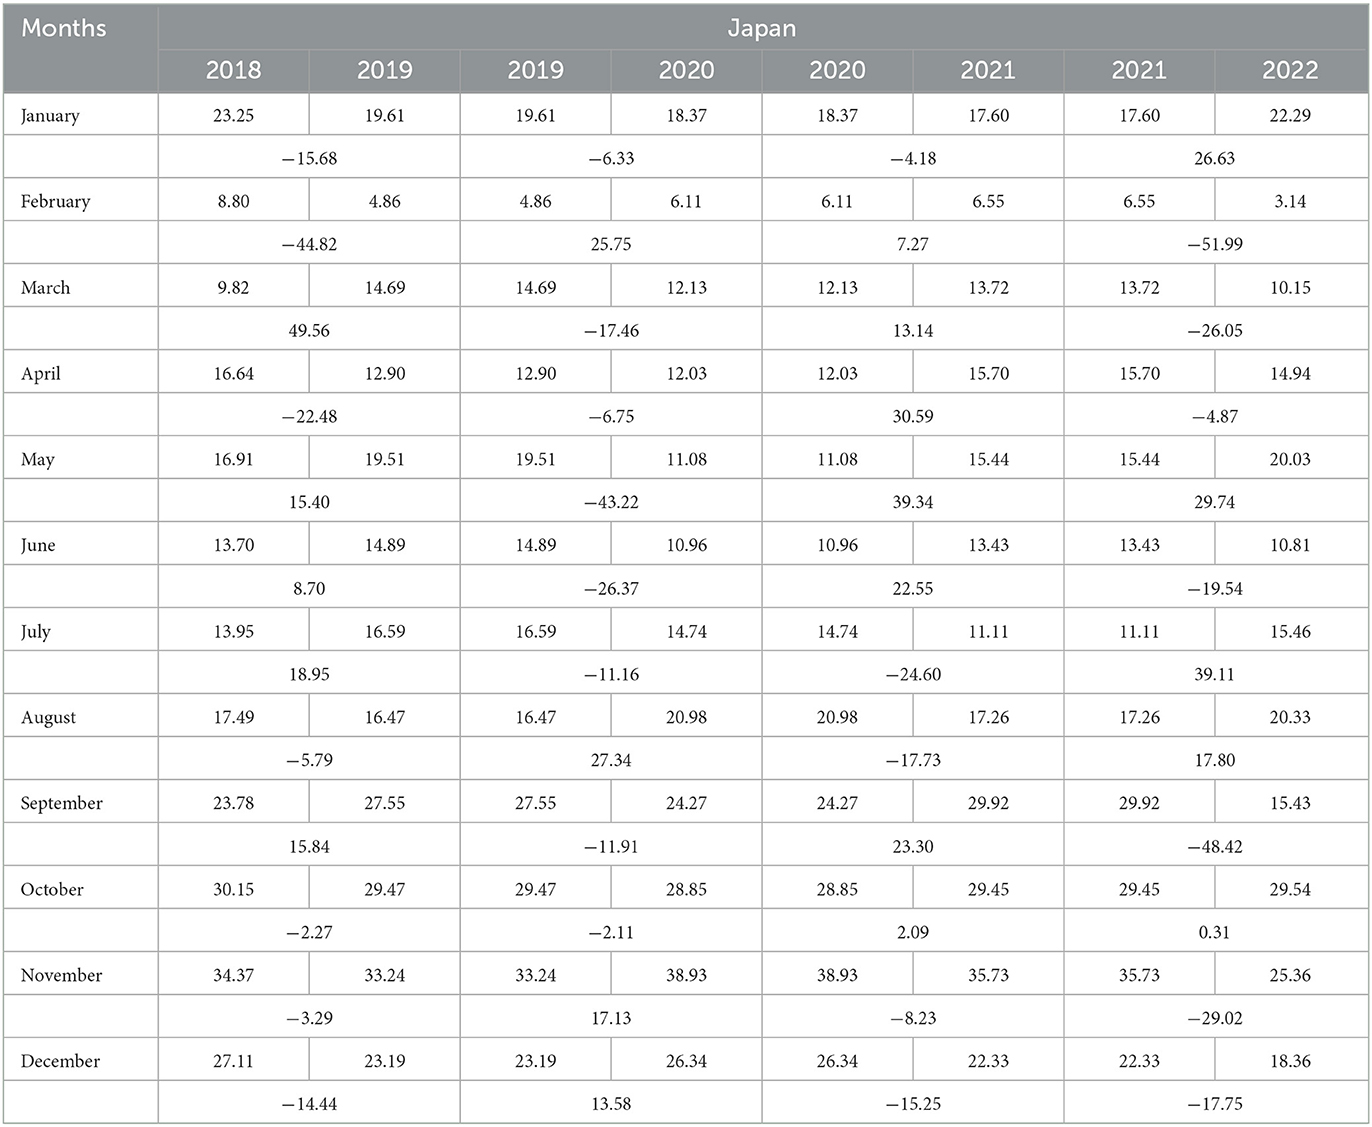
Table 4. China's crustacean export to Japan from 2018 to 2022.
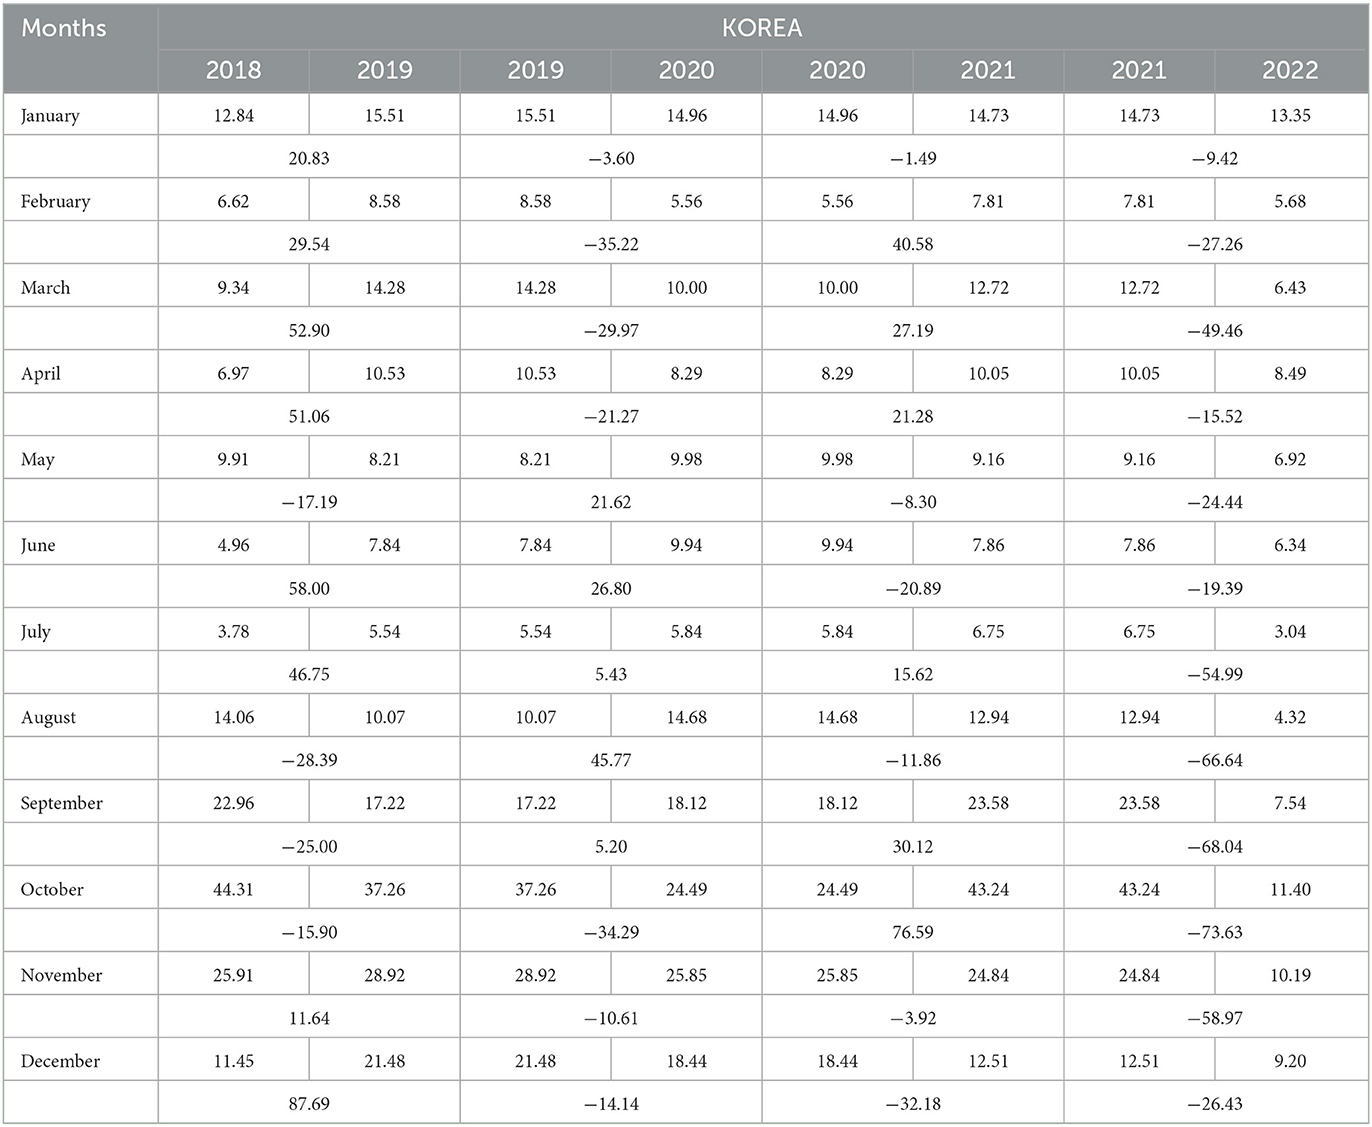
Table 5. China's crustacean export to Korea from 2018 to 2022.
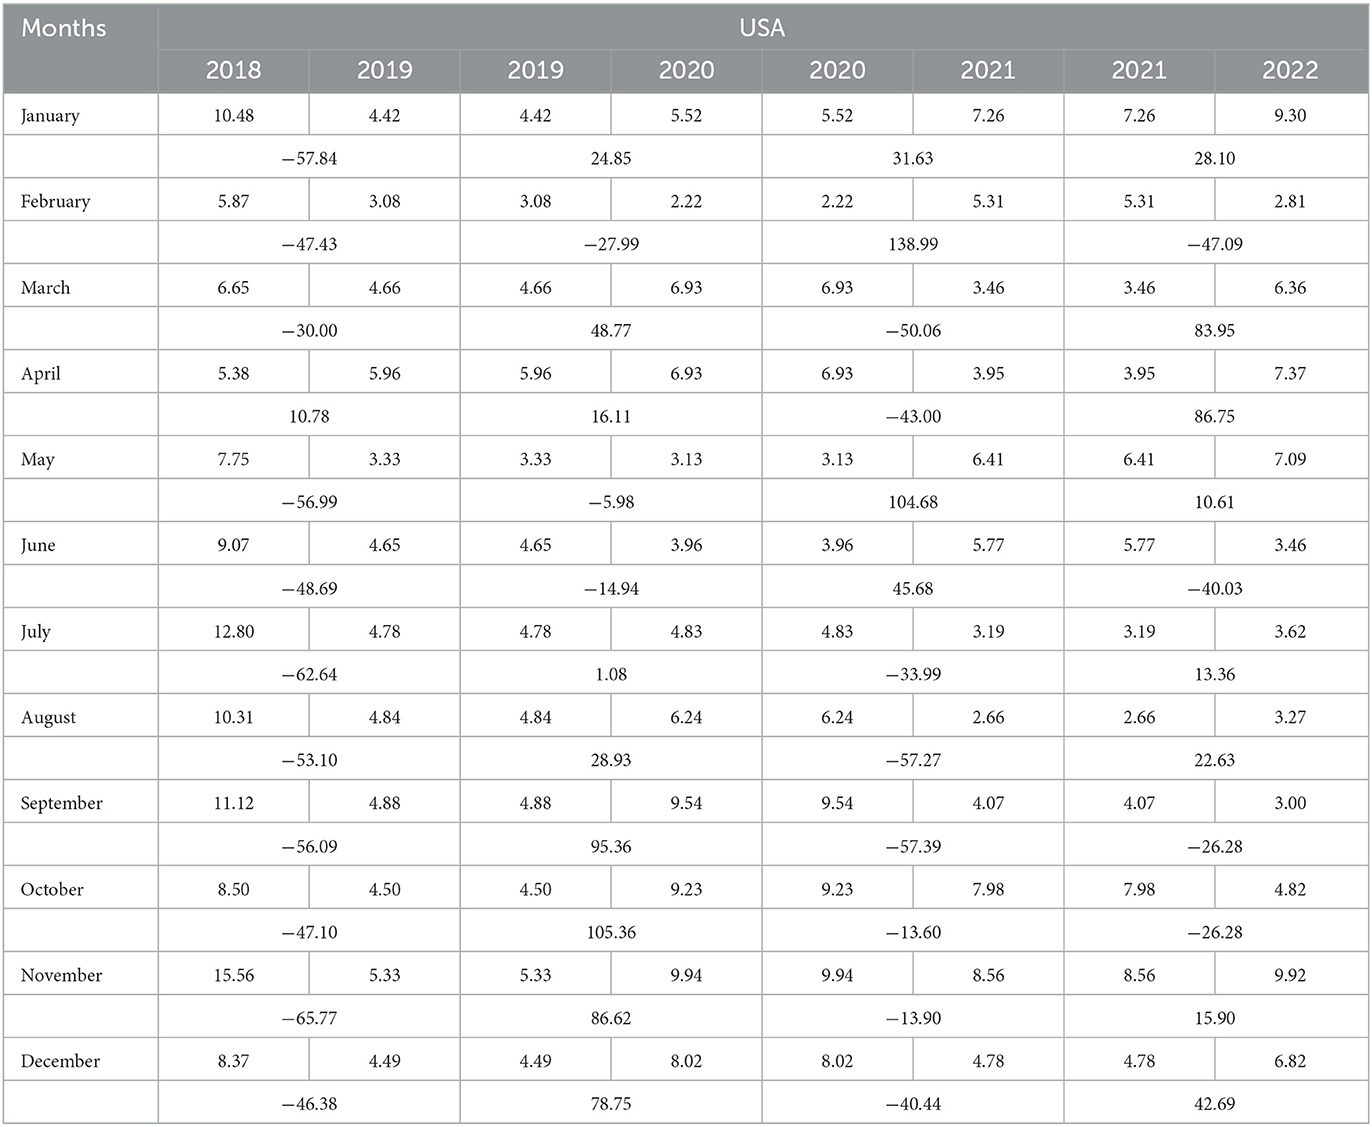
Table 6. China's crustacean export to USA from 2018 to 2022.
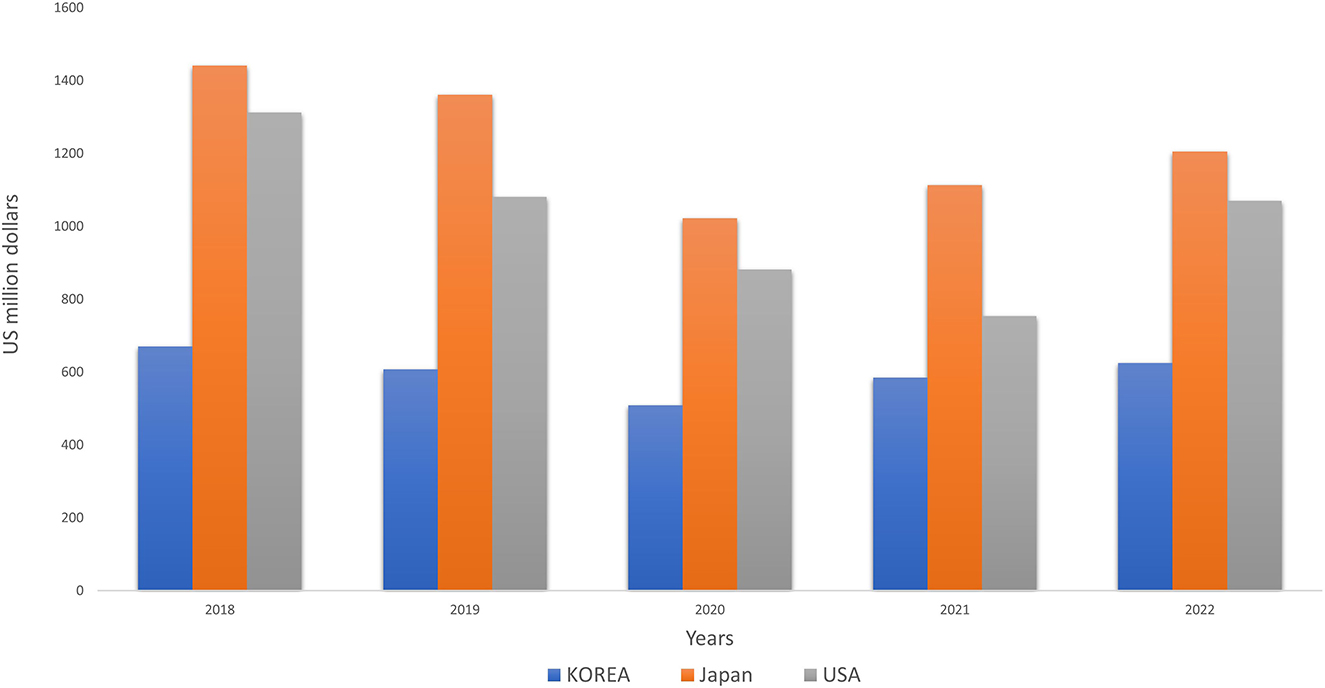
Figure 4. Comparison of China's fish exports to major markets for the period 2018-2022.
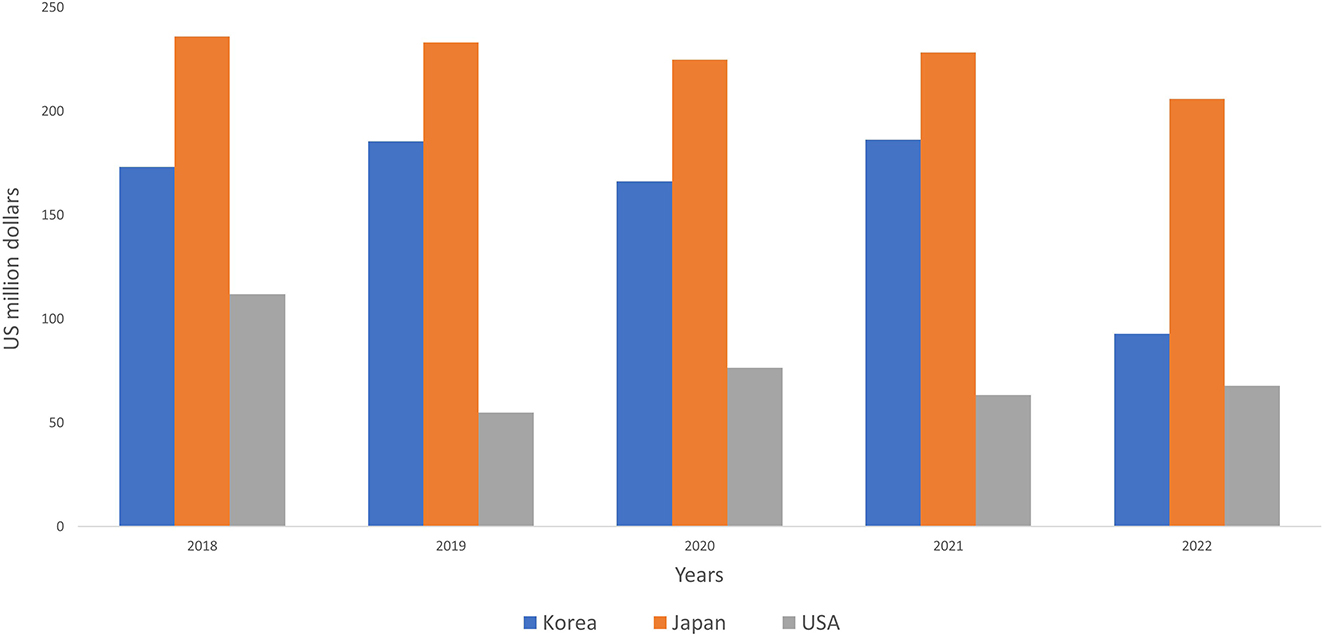
Figure 5. Changes in Chinese crustacean exports to major markets for the period 2018-2022.
3.4. Composition of different fish species in total fish exported from China to World during pre-pandemic, and pandemic period
The export of fish and crustaceans from China has declined after 2019. The export of fish and crustaceans in 2019 was valued at $8405.07 million and $1028.44 million, respectively, and was exported in quantities totaling about 2363.14 million tons. However, during the COVID-19 pandemic, the total fish exports decreased to $6968.49 million and crustacean exports to $951.62 million, with a decrease in total export amount to 1898.09 million tons. The export of fish and crustaceans declined further after the pandemic with a decrease of 1.57% for fish ($6859.01 million) and an increase of 4.7% for crustaceans ($999.70 million) in 2021.
To understand the export composition changes, the exports have been grouped into live fish, fried chilled fish, frozen fish, frozen filet meat mince, fish cured smoked fish meal and crustaceans. In 2019, fish filets and other fish meal accounted for 45% of the value of exports, followed by frozen fish (30%), crustaceans (11%), and live fish (7%) as shown in Figure 6. During the COVID-19, the export of fish filets and other fish meal declined to 42%, while the export of live fish and crustaceans increased to 8% and 12%, respectively. In the recovery phase (2021), the export of fish filets and other fish meal declined further to 40%, while the export of live fish and crustaceans increased to 9% and 13%, respectively.
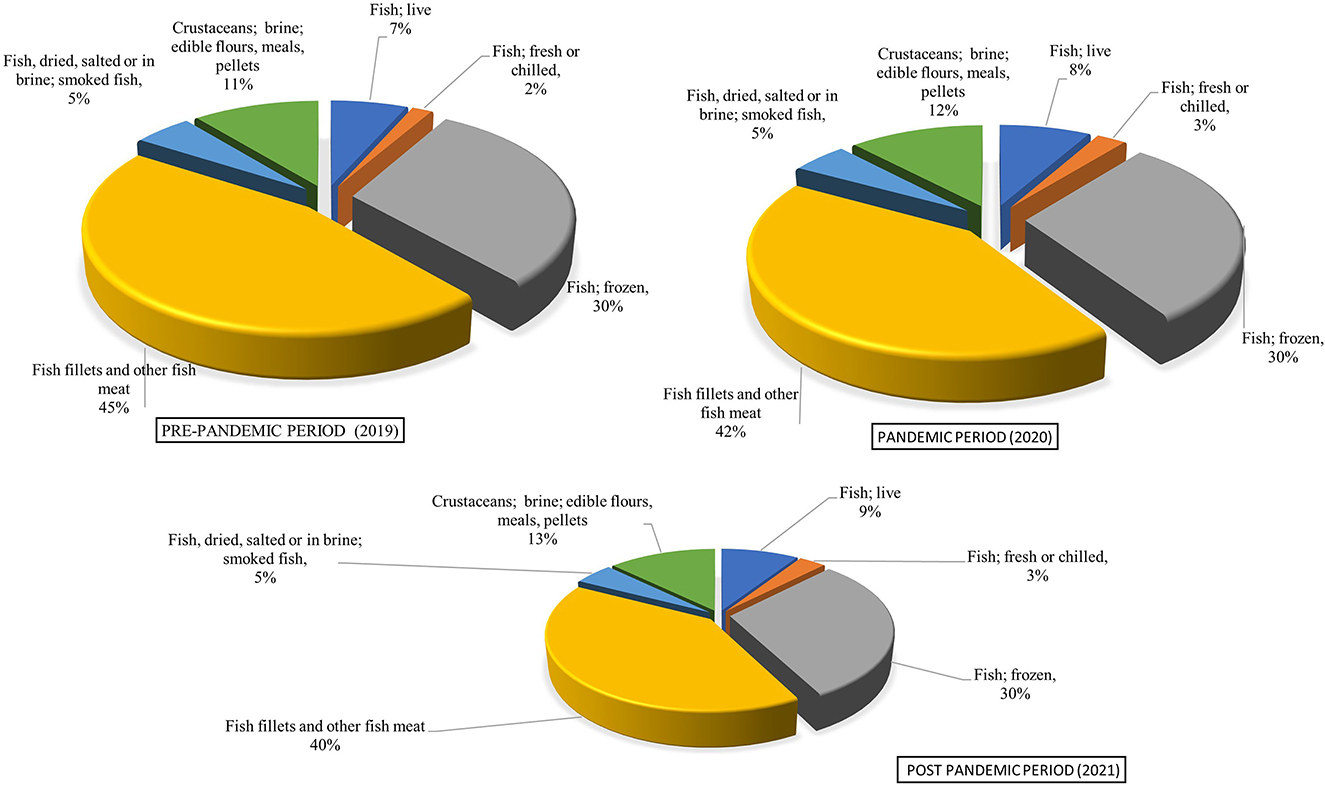
Figure 6. Chinese fish and crustacean composition change in market share to the World during pre-pandemic pandemic and recovery phase.
Overall, the COVID-19 pandemic has greatly impacted the export of fish and crustaceans from China. The total value and quantity of exports have decreased, and there has been a shift in the composition of exports. In particular, there has been a decrease in the export of fish filets and other fish meal, while the export of live fish and crustaceans has increased. Despite the overall decline in exports, the export of crustaceans has recovered well during the recovery phase.
To improve the export performance of fish and crustaceans, China can focus on increasing the competitiveness of its products and expanding its market reach. This can be achieved through product differentiation, improving product quality, and developing new market segments. Additionally, China can focus on reducing the impact of any future pandemics by improving its supply chain management, strengthening its logistics networks, and increasing its ability to respond quickly to changes in the market. In conclusion, the export of fish and crustaceans from China has been affected by the COVID-19 pandemic, but the recovery has been positive, particularly for crustaceans. To maintain and improve the competitiveness of its exports, China must focus on product differentiation, market expansion, and supply chain management.
3.5. Growth and instability in trade during pre-pandemic, pandemic and recovery periods
Amid the tumultuous backdrop of the pandemic, the export growth rate of Chinese fish and crustaceans was monitored using the Compound Monthly Growth Rate (CMGR) approach, as opposed to the traditional Compound Annual Growth Rate, due to the shorter yearly timeframe. The top three importers of Chinese seafood—Japan, Korea, and the United States—were the focus of the evaluation. Despite a decrease in the overall export volume, the data reveals a remarkable improvement in the monthly growth rate during the pandemic compared to pre-COVID times.
The highest growth rate was recorded for fish exports to Korea (5.84%), followed by Japan (5.64%) and crustacean exports to the United States (3.46%). Conversely, the lowest growth rate during the same period was observed for fish exports to the United States (-2.38%), followed by exports to the World (−0.78%) as shown in Table 7. Understanding the fluctuations in trade in the recovery period is crucial to gain a comprehensive understanding of the current trade scenario. The analysis indicates that both fish and crustacean exports have improved in the recovery era, with fish exports growing at a rate of −0.12% and crustaceans at 0.83%.
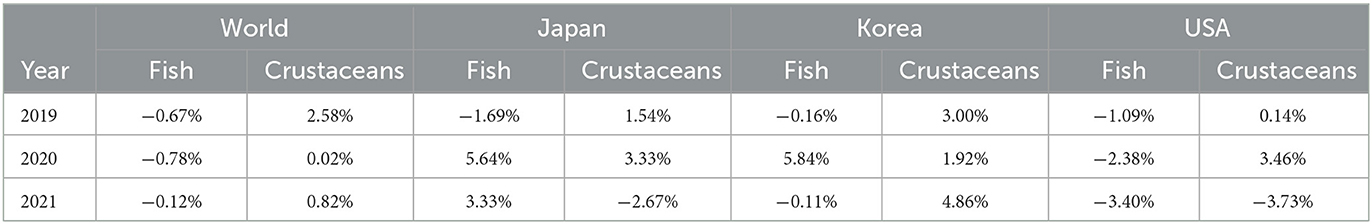
Table 7. Compound Monthly Growth Rate (CMGR) of China's fish and crustacean export to world and major exporting countries.
In the realm of fish and crustacean exports, instability is a key factor that must be closely monitored. A low level of commodity instability is crucial for the sustainable development of fish trade, as it is often associated with high export growth. To evaluate the instability in the monthly export trade of these commodities throughout the pre-pandemic, pandemic, and recovery eras, we employed the Cuddy Della Valle Index (CDVI). This index takes the trend in the data series into account when calculating instability. Table 8 presents the CDVI values, which indicate that in the pre-pandemic phase of 2019, exports of fish to Japan experienced the highest level of instability (29.19), followed by exports to the United States (26.36), while exports of fish to the World had the lowest levels of instability (19.19). For crustacean exports, the highest instability was recorded in exports to Korea (36.32), followed by exports to Japan (28.63).
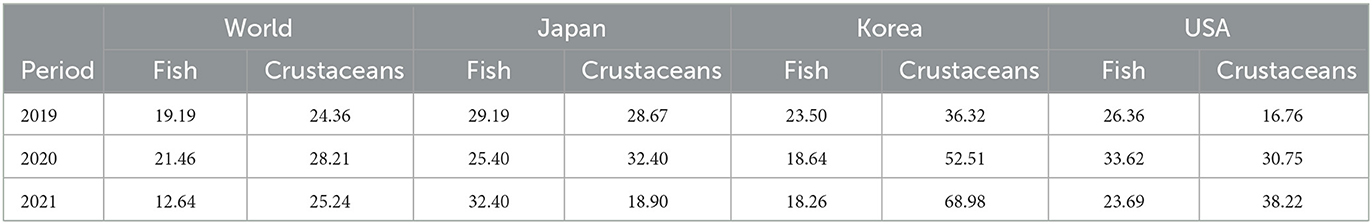
Table 8. Trade instability in terms of Cuddy Della Valle Index (CDI) of China's fish and crustacean to world and major exporting countries.
During the COVID-19 pandemic in 2020, exports to the United States demonstrated the highest level of instability (33.62), followed by exports to Japan (25.40), while exports to Korea experienced the lowest level of instability (18.64). The highest instability in crustacean exports was recorded in exports to Korea (52.51), followed by exports to the United States (33.62), and exports to Japan (32.40). The stability of Chinese fish exports to the wWorld increased by 21.46 in 2020, compared to the pre-pandemic period (19.19). Similarly, the export of crustaceans to the World in 2020 demonstrated greater unpredictability.
The higher trade instability during the COVID-19 pandemic (2020) can be attributed to the lower growth rates during the period. During the recovery phase (2021), the instability of total fish and crustacean exports to theWorld has decreased to 12.64 and 25.324, respectively. This decrease in instability demonstrates that the trade has been more stable in the recovery period.
3.6. Commodity wise unit value realization of exports
Unit value realization (UVR) measures the value composition of exports and is a key indicator of a commodity's economic worth. Understanding the impact of the pandemic on the UVR of a specific fish commodity is crucial. During the COVID-19 period, there were significant changes in both the quantity and value of fish and crustacean exports. The UVR of a commodity changes based on market price fluctuations resulting from changes in export performance. A higher market price leads to a higher UVR for a given period. In general, all fish commodities saw a decrease in UVR during the pandemic, which improved in the recovery period of 2021 (Table 9). The highest UVR in this period was recorded for crustaceans ($8.34/kg), followed by live fish ($7.24/kg) and fresh or chilled fish ($6.95/kg). It should be noted that fish filets and other fish meal made up the majority of fish exports during pre-pandemic, pandemic, and recovery periods, but their UVR was low due to limited value addition, leading to lower demand and a lower realized value.
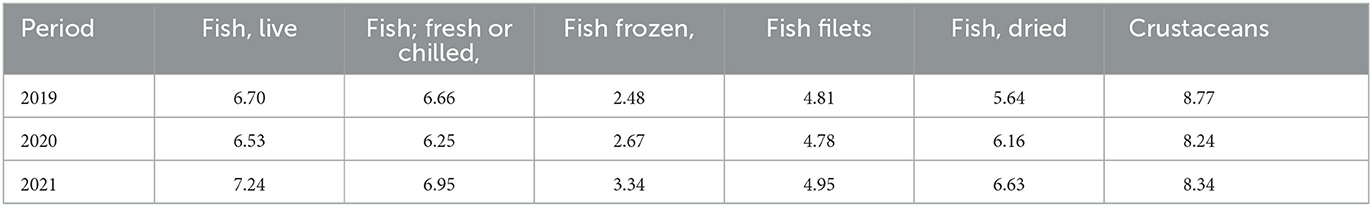
Table 9. Commodity wise Unit Value Realization (UVR) of Chinese fish and crustacean export to world.
3.7. Comparative advantage of fish and crustaceans exported from China during pre-pandemic, pandemic and recovery period
The comparative advantage of a country's exports is usually assessed using a Revealed Comparative Advantage (RCA) index calculated from trade data. Table 10 shows the RCA of China's fish and crustacean exports to the World for the pre-pandemic, pandemic, and recovery periods. It was found that in 2019, live fish had the highest RCA of 2.26, followed by fish filets (1.30) and frozen fish (0.91). Similar trends were observed in 2020 and 2021. However, during the COVID-19 period, the RCA values declined for all fish and crustacean products, except live fish, which increased from 2.26 in 2019 to 2.44 in 2020. Live fish exports have consistently had an RCA value greater than unity, indicating China's comparative advantage in this area. Conversely, China does not have a comparative advantage in exporting fresh or chilled fish and crustaceans. Despite the recovery in 2021, the RCA values for these products have continued to decline substantially.
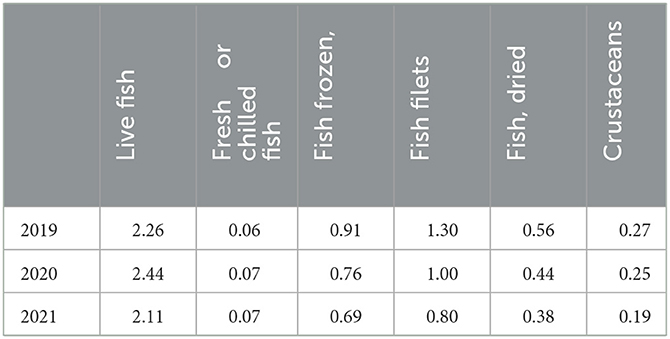
Table 10. Revealed Comparative Advantage (RCA) of Chinese fish and crustacean export to world.
4. Discussion
A comprehensive examination of the COVID-19 pandemic's impact on China's fish and crustacean trade has been conducted, incorporating the analysis of both domestic and worldwide infections. The study highlights the crucial need for comprehending the fluctuations in the trade, as a surge in monthly infections led to a decrease in the quantity and value of exports. A categorization of exports was carried out, including live fish, fresh chilled fish, frozen fish, frozen filet meat mince, fish cured smoked fish meal, and crustaceans, to gauge the contribution of each to the overall export. The study delves into the perplexing collapse and subsequent resurgence of China's fish and crustacean exports to the World. It contrasts the export competitiveness, trade instability, and revealed comparative advantage across the pre-pandemic, pandemic, and recovery eras. The results are striking—the pandemic wrought havoc on China's fish and crustacean industry, with exports plummeting more significantly for fish than crustaceans. Major destinations, such as Japan, Korea, and the US, were hard-hit. Yet, as the recovery period dawned, trade rebounded with remarkable growth rates and stability. The pandemic dealt a devastating blow to exports of fish and crustaceans to the World, with trade disrupted, redirected, or suspended due to unprecedented changes in supply and demand and mobility restrictions. The ban on live animal imports by China in January 2020 had far-reaching implications, affecting trade with numerous nations and causing port quarantines, cargo rerouting, and supply cancellations. Logistical challenges arose from canceled passenger flights, driving up air freight costs for perishable seafood products like farmed Atlantic salmon (Huffman, 2020). Producers and distributors were left without a market or with a shortage of freezer space, forcing some to redirect trade to more resilient marketplaces.
The Chinese government plays a crucial role in striking a balance between control and trading efficiency, and exploring new markets to mitigate the risks posed by delayed supplies and shrinking consumer demand. However, this strategy was not equally effective for all export destinations. Japan and Korea saw growth rates increase during the pandemic but then decline in the recovery period. The impact of COVID-19 was even more pronounced in the US, where growth rates decreased during the pandemic and further declined in the 2021, exacerbating the trade imbalance. The significance of having alternative markets and the ability to adapt to changing demands in fish exports is emphasized by China's experience during the pandemic. Diversified trade partners allowed businesses to better manage risk in the face of unpredictable market fluctuations, leading to a reduction in instability. The major exporting commodity during all three pandemic periods was fish filet and other fish meal, though its percentage share declined from 42% in 2020 to 40% in 2021. On the other hand, trade of live fish and crustaceans, particularly high-nutrient, low-fat shrimps and lobsters, experienced a 2% growth each from pre-pandemic to recovey period.
Unit value realization (UVR) was crucial in determining the value of a commodity in the global market, with crustaceans having the highest UVR during all pandemic periods. The COVID-19 pandemic led to a decrease in UVR values, but a significant increase was observed in the recovery period (2021). Similar fluctuations were noted for other fish products. As China's annual shrimp production increases, there is a need for both promoting shrimp exports and adding value to them to boost their capacity for commanding higher prices in international markets. The government should provide financial incentives for market expansion and export promotion to support the industry. The COVID-19 pandemic has had a significant impact on China's exports of fish and crustaceans. The expansion of processed tilapia exports, due to increased demand for dining at home, was offset by trade interruptions caused by COVID-19 screening measures. The suspension of seafood trading with several countries, such as Brazil, Chile, Ecuador, Indonesia, India, the Netherlands, and Russia, was due to the discovery of the virus on packaging. Despite the low risk of infection from food (Rizou et al., 2020), a risk-averse attitude toward food safety has led to an excessive rejection of suspicious products.
Lockdowns and reduced manpower in the fish supply chains, along with lower incomes and increased unemployment, have also impacted China's export of fish and crustaceans. The reduction in industrial fishing operations by 40% to 50% in the first quarter of 2020 compared to 2019 in China, Spain, France, and Italy (Clavelle, 2020) has hindered production, with farmers uncertain about restocking in light of the uncertain market. Shrimp producers in Southeast Asia faced difficulty importing broodstock, leading to a lag in supply decreases (UN FAO, 2020). Species with long growth cycles, such as shellfish and salmon, can be kept in the water until markets improve, but not indefinitely without financial consequences. To address these challenges, governments, the fish industry, and consumers have adopted various strategies throughout the supply chain.
The article underscores the intricate connection between China's fish and crustacean exports and its strategic pursuit of food security. While the export data was analyzed primarily, the rationale for this approach is rooted in the interdependence of export and import dynamics in ensuring a stable food supply. China's export of fish and crustaceans contributes significantly to its foreign exchange earnings. These earnings are crucial in facilitating the country's capacity to import essential food commodities, including grains, to meet domestic consumption demands. A robust export sector enhances China's financial resources, which can be utilized to support import activities that bolster food security. As China seeks to diversify its food sources to enhance resilience, the export-oriented nature of its fish and crustacean industry becomes pivotal. By engaging in international trade, China not only secures its own supply but also contributes to global food security by supplying these vital protein sources to other nations. China's participation in the global fish and crustacean market allows for increased market access and trade relationships. This fosters mutual cooperation with other countries in the field of food security, leading to more stable supply chains and reduced vulnerability to disruptions in food trade. Analyzing China's export-oriented fish and crustacean sector provides insights into the allocation of resources, technology, and policies toward food production. These insights indirectly impact domestic food security by highlighting the strategies adopted to maintain sustainable production levels.
4.1. Through China's lens: the resilience of the COVID-19 pandemic
The COVID-19 crisis dealt a severe blow to China's agriculture sector, from inputs to food processing, retail, wholesale, and food services. However, the government's persistent efforts to maintain food security and swift policy actions have given rise to a guarded optimism that China's food system has demonstrated resilience and the ability to bounce back from disruptions. The outbreak impacted both imports and exports, with indirect disruptions to imports due to lockdown measures and social distancing. Upon confirmation of the potential infectious disease outbreak on 21 January 2020, the government promptly activated an emergency response mechanism through the establishment of the Joint Prevention and Control Mechanism (JPCM), a hierarchical structure under the State Council (Figure 7). Most provinces were placed under lockdown procedures under the highest Level I emergency, with quarantines in districts confirming infectious cases. Although the virus caused varying impacts across businesses and nations, official pandemic responses such as curfews, travel bans, and lockdowns were largely similar. While the effects of these measures on government-ensured food system functionality varied, China's comprehensive policy responses could offer insights for other nations striving to build food systems that can withstand the challenges posed by the COVID-19 pandemic and beyond.
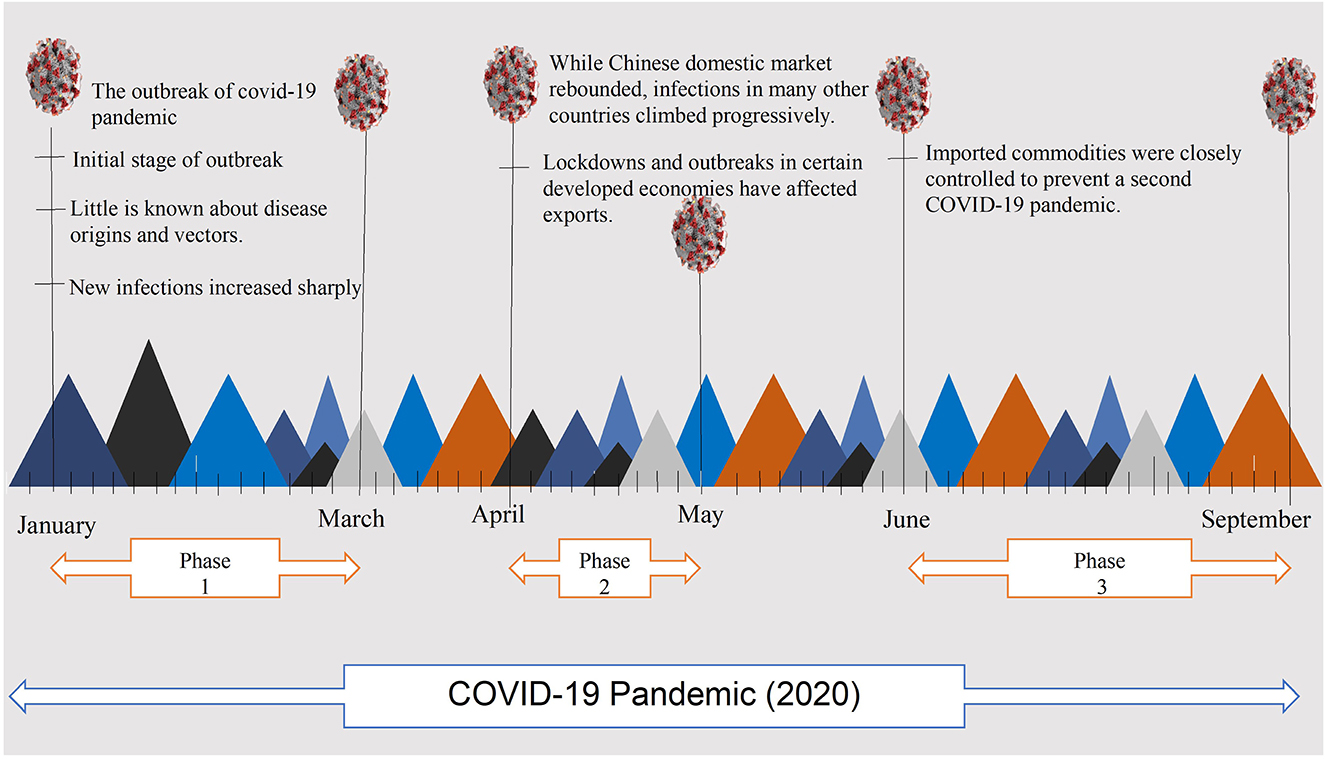
Figure 7. China's food system resilience framework during COVID-19 pandemic.
China serves as a model for maintaining the flow of food during a crisis through its provision of a “green channel” for fresh agriculture products and ban on unauthorized barriers. Online platforms and e-commerce businesses were instrumental in all parts of China's food supply chain, implementing innovative techniques and aiding the government in monitoring and disseminating market information through big data techniques. ICT innovations like livestreaming and social media were used to provide farmers with production-related services, while local governments, trade organizations, and farmers used online stores and events to promote sales. Contactless delivery services by delivery companies addressed the growing demand for home grocery deliveries while alleviating safety concerns. The government recognizes the importance of these new models and the potential for long-term digitalization of the food supply chain.
The Chinese government is taking measures to ensure the stability of its food supply and support its agro-food sector amidst the COVID-19 pandemic. With a focus on tax reductions, fee exemptions, financial aid, cost reductions, and subsidies, the government is working to keep the food supply steady and prevent disruptions to the market. However, the affordability of food, especially for vulnerable populations, may still be a concern. The government is addressing this through investment in social welfare and health and nutrition programs to ensure food security for all. China has also prioritized “food security” as a key development objective and has been working toward it through various initiatives. Over the years, China has invested heavily in its agricultural sector, leading to a fast growth in agricultural expenditure and improvement in food production. The country's efforts to increase self-sufficiency in food and ensure absolute security of staple food has led to the establishment of a farmland protection system, responsible use of farms policy, and the application of innovative agricultural technology. Additionally, the food storage facilities in China have become sophisticated and its logistics capacity has grown significantly, facilitating the transportation of food through an integrated multimodal transport network.
5. Conclusion
The COVID-19 pandemic had a negative impact on China's exports of fish and crustaceans to key markets such as Japan, Korea, and the United States, with Japan being the hardest hit. The proportion of exports of crustaceans and fish decreased during the pandemic. However, exports of fish and crustaceans to the World overall rose slightly in the years following the pandemic. The highest growth rate in fish exports was to Korea, while the USA had the lowest growth rate. Trade instability in fish and crustaceans was highest during the pandemic, but later declined as recovery improved. The pandemic period also saw a decline in the unit value realization for all fish commodities, which improved during recovery phase. Crustaceans had the highest unit value realization, followed by live fish, fresh fish, and chilled fish.
Data availability statement
The original contributions presented in the study are included in the article/supplementary material, further inquiries can be directed to the corresponding authors.
Author contributions
The study's conception and design were skillfully crafted by the collaborative efforts of UN, ZZ, and YM. ZC proficiency in database organization was instrumental to the study's success. HZ expert statistical analysis provided invaluable insights. UN erudition and finesse were reflected in the first draft of the manuscript. The manuscript's excellence was further enhanced by the contributions of UN and ZZ, who meticulously crafted their respective sections. All authors' extensive contributions to manuscript revision resulted in a final product that was deemed worthy of submission.
Acknowledgments
The authors would like to thank all contributors to this paper. This paper was supported under Shandong Province Social Science Planning Project: Research on Digital Transformation and Realization Path of Shandong Agriculture under the Construction of Digital Province (Project No.: 22CJJ33).
Conflict of interest
The authors declare that the research was conducted in the absence of any commercial or financial relationships that could be construed as a potential conflict of interest.
Publisher's note
All claims expressed in this article are solely those of the authors and do not necessarily represent those of their affiliated organizations, or those of the publisher, the editors and the reviewers. Any product that may be evaluated in this article, or claim that may be made by its manufacturer, is not guaranteed or endorsed by the publisher.
References
Asche, F., Garlock, T. M., Anderson, J. L., Bush, S. R., Smith, M. D., Anderson, C. M., et al. (2018). Three pillars of sustainability in fisheries. Proceed. Nat. Acad. Sci. 115, 11221–11225. doi: 10.1073/pnas.1807677115
Asche, F., Roheim, C. A., and Smith, M. D. (2016). Trade intervention: not a silver bullet to address environmental externalities in global aquaculture. Marine Policy 69, 194–201. doi: 10.1016/j.marpol.2015.06.021
Balassa, B. (1965). Trade liberalisation and revealed comparative advantage. The Manchester Sch. 33, 99–123. doi: 10.1111/j.1467-9957.1965.tb00050.x
Bellon, B., Bush, S. R., and Little, D. C. (2018). Not just for the wealthy: rethinking farmed fish consumption in the Global South. Glob. Food Sec. 16, 85–92. doi: 10.1016/j.gfs.2017.10.005
Bennett, N. J., Finkbeiner, E. M., Ban, N. C., Belhabib, D., Jupiter, S. D., Kittinger, J. N., et al. (2020). The COVID-19 pandemic, small-scale fisheries and coastal fishing communities. Coast. Manag. 48, 336–347. doi: 10.1080/08920753.2020.1766937
Chenarides, L., Manfredo, M., and Richards, T. J. (2021). COVID-19 and food supply chains. Appl. Econ. Perspect. Policy 43, 270–279. doi: 10.1002/aepp.13085
China Agriculture Press (2020). The fisheries administration of the ministry of agricultural and rural affairs and china society of fisheries. China Fishery and Aquaculture Statistical Yearbook. Beijing: China Statistics Press.
China's Fishery Report (2021). United States Department of Agriculture, Foreign Agricultural Service. Available online at: (https://apps.fas.usda.gov/newgainapi/api/Report/DownloadReportByFileName?fileName=2021%20China%27s%20Fishery%20Report_Beijing_China%20-%20People%27s%20Republic%20of_12-17-2021) (accessed October 29, 2022).
Clavelle, T. (2020). Global Fishing Watch, editor. Available online at: https://globalfishingwatch.org/data-blog/global-fisheries-during-covid-19/.
Conti, V., Cafiero, C., and Sánchez, M. V. (2020). Simulating Rising Undernourishment During the COVID-19 Pandemic Economic Downturn. Roma: FAO.
Cuddy, J. D., and Valle, P. D. (1978). Measuring the instability of time series data. Oxf. Bull. Econ. Stat. 40, 79–85. doi: 10.1111/j.1468-0084.1978.mp40001006.x
Devereux, S., Béné, C., and Hoddinott, J. (2020). Conceptualising COVID-19′s impacts on household food security. Food Sec. 12, 769–772. doi: 10.1007/s12571-020-01085-0
Djekic, I., Nikolić, A., Uzunović, M., Marijke, A., Liu, A., Han, J., et al. (2021). Covid-19 pandemic effects on food safety-Multi-country survey study. Food Cont. 122, 107800. doi: 10.1016/j.foodcont.2020.107800
FAO (2018). Food and Agriculture Organization of the United Nations. The State of Food Security and Nutrition in the World 2018: Building Climate Resilience for Food Security and Nutrition. FAO, Rome. Available online at: http://www.fao.org/publications (accessed August 13, 2022).
FAO (2020b). The Impact of COVID-19 on Fisheries and Aquaculture—A Global Assessment from the Perspective of Regional Fishery Bodies, 2020. Available online at: http://www.fao.org/3/ca9279en/ca9279en.pdf (accessed September 15, 2020).
FAO (2020c). FishStatJ—Software for Fishery and Aquaculture Statistical Time Series. Rome: FAO Fisheries Division. Available online at: http://www.fao.org/fishery/
FAO (2022). Food and Agriculture Organization of the United Nations. Impact of the COVID-19 Pandemic on Food Security and Food Systems. Available online at: http://www.fao.org/3/nd059en/ND059EN.pdf (accessed August 14, 2022).
Field, C. B., and Barros, V. R., (eds.). (2014). Climate Change 2014: Impacts, Adaptation, and Vulnerability. Part B: Regional Aspects. Contribution of Working Group II to the Fifth Assessment Report of the Intergovernmental Panel on Climate Change. Cambridge University Press, Cambridge, United Kingdom and New York, NY, USA. Available online at: http://www.cambridge.org (accessed October 17 ,2022).
FSIN (2020). Food Security Information Network, Global Report on Food Crises 2020. Available online at: https://www.fsinplatform.org/global-report-food-crises-2020 (accessed September 17, 2022).
Galanakis, C. M. (2020). The food systems in the era of the coronavirus (COVID-19) pandemic crisis. Foods 9, 523. doi: 10.3390/foods9040523
Gephart, J. A., and Pace, M. L. (2015). Structure and evolution of the global seafood trade network. Environ. Res. Let. 10, 125014. doi: 10.1088/1748-9326/10/12/125014
Globefish (2020). COVID-19 Special Feature. Available online at: https://issuu.com/globefish/stacks (accessed October 23, 2020).
Godoy, M. G., Kibenge, M. J., and Kibenge, F. S. (2021). SARS-CoV-2 transmission via aquatic food animal species or their products: a review. Aquaculture 536, 736460. doi: 10.1016/j.aquaculture.2021.736460
Haas, B., Davis, R., and Hanich, Q. (2021). Regional fisheries management: virtual decision making in a pandemic. Marine Policy 125, 104288. doi: 10.1016/j.marpol.2020.104288
Han, J., Zhang, X., He, S., and Jia, P. (2020). Can the coronavirus disease be transmitted from food? A review of evidence, risks, policies and knowledge gaps. Environ. Chem. Lett. 19, 5–16. doi: 10.1007/s10311-020-01101-x
Hobbs, J. E. (2020). Food supply chains during the COVID-19 pandemic. Can. J. Agricult. Econ. 68, 171–176. doi: 10.1111/cjag.12237
Huffman, J. (2020). US Seafood Importers Scramble to Deal with Fallout from Trump's Europe Flight Limits. Santa Monica, CA: Undercurrent News.
IMF (2020). International Monetary Fund. World Economic Outlook. Available online at: https://www.imf.org/en/Publications/WEO/Issues/2020/06/24/WEOUpdateAugust2022 (accessed December, 2022).
Jalava, K. (2020). First respiratory transmitted food borne outbreak? Int. J. Hyg. Environ. Health 226, 113490. doi: 10.1016/j.ijheh.2020.113490
Love, D. C., Allison, E. H., Asche, F., Belton, B., Cottrell, R. S., Froehlich, H. E., et al. (2021). Emerging COVID-19 impacts, responses, and lessons for building resilience in the seafood system. Glob. Food Sec. 28, 100494. doi: 10.1016/j.gfs.2021.100494
NBS (2020). National Bureau Statistics. Coordinative Efforts for Epidemic Control and Economic Development Delivered Notable Results with National Economy Recovered Gradually in the First Half of 2020. Available online at: http://www.stats.gov.cn/english/PressRelease/202007/t20200716_1776211.html (accessed July 18, 2022).
NHC (2022). National Health Commission of the People's Republic of China. http://www.nhc.gov.cn/xcs/yqtb/list_gzbd.shtml.to (accessed August 17, 2022).
Nisar, U., Mu, Y., Kumar, N. R., Shah, S. B. H., Mohsin, M., Kazmi, S. S. U. H., et al. (2021). Growth and trade performance of Indian fish export to China. Pak. J. Agricult. Sci. 58, 1005. doi: 10.21162/PAKJAS/21.1005
Panel, G. (2020). COVID-19: safeguarding food systems and promoting healthy diets. Policy Brief 14, 25.
Peng, D., Hou, X., Li, Y., and Mu, Y. (2019). The difference in development level of marine shellfish industry in 10 major producing countries. Mar. Pol. 106, 103516. doi: 10.1016/j.marpol.2019.103516
Peng, D., Zhang, S., Zhang, H., Pang, D., Yang, Q., Jiang, R., et al. (2021). The oyster fishery in China: trend, concerns and solutions. Mar. Pol. 129, 104524. doi: 10.1016/j.marpol.2021.104524
Perillo, G. M., Botero, C. M., Milanes, C. B., Elliff, C. I., Cervantes, O., Zielinski, S., et al. (2021). Integrated coastal zone management in the context of COVID-19. Ocean Coast. 210, 105687. doi: 10.1016/j.ocecoaman.2021.105687
Rizou, M., Galanakis, I. M., Aldawoud, T. M., and Galanakis, C. M. (2020). Safety of foods, food supply chain and environment within the COVID-19 pandemic. Trends Food Sci. Technol. 102, 293–299. doi: 10.1016/j.tifs.2020.06.008
Roheim, C. A., and Zhang, D. (2018). Sustainability certification and product substitutability: evidence from the seafood market. Food Policy 79, 92–100. doi: 10.1016/j.foodpol.2018.06.002
Sumner, A., Hoy, C., and Ortiz-Juarez, E. (2020). Estimates of the Impact of COVID-19 on Global Poverty (No. 2020/43). WIDER working paper. doi: 10.35188/UNU-WIDER/2020/800-9
Tendall, D. M., Joerin, J., Kopainsky, B., Edwards, P., Shreck, A., Le, Q. B., et al. (2015). Food system resilience: defining the concept. Glob. Food Secur. 6, 17–23. doi: 10.1016/j.gfs.2015.08.001
TRADE MAP (2018). Trade Statistics for International Business Development. Available online at: https://www.trademap.org/Index.aspx (accessed July, 2022).
UN FAO (2020). COVID-19 Dampens the Initially Positive Shrimp Forecast for 2020. Available online at: http://www.fao.org/in-action/globefish/market-reports/resource-detail/en/c/1296667/ (accessed February, 2023).
WHO (2022). World Health Organization. World Health Statistics 2022. Available online at: https://covid19.who.int/region/wpro/country/cn (accessed on August 17, 2022).
World Food Programme (2020). Targeting and Prioritization of Impoverished and Food-Insecure Populations Affected by COVID-19.
Keywords: COVID-19, China, food security, fish and crustacean trade, resilience
Citation: Nisar U, Zhang Z, Cui Z, Mu Y and Zhang H (2023) Impact of COVID-19 on fish and crustacean export from China with building resilient food system through China's lens. Front. Sustain. Food Syst. 7:1189526. doi: 10.3389/fsufs.2023.1189526
Received: 20 April 2023; Accepted: 19 September 2023;
Published: 05 October 2023.
Edited by:
Emmanuel Kakunde Mbaru, Kenya Marine and Fisheries Research Institute, KenyaReviewed by:
Esther Fondo, Kenya Marine and Fisheries Research Institute, KenyaRong Ma, China Agricultural University, China
Copyright © 2023 Nisar, Zhang, Cui, Mu and Zhang. This is an open-access article distributed under the terms of the Creative Commons Attribution License (CC BY). The use, distribution or reproduction in other forums is permitted, provided the original author(s) and the copyright owner(s) are credited and that the original publication in this journal is cited, in accordance with accepted academic practice. No use, distribution or reproduction is permitted which does not comply with these terms.
*Correspondence: Zhixin Zhang, YmVpamkyMDAyQDEyNi5jb20=; Hongzhi Zhang, b3VxZHNub3dAMTYzLmNvbQ==