 Yazhe Li1,2
 Enpu Ma
 Liuwen Liao
- 1School of Geographical Sciences, Hunan Normal University, Changsha, China
- 2Key Laboratory for Urban-Rural Transformation Processes and Effects at Hunan Normal University, Changsha, China
- 3College of Economics and Management, Changsha University, Changsha, China
Facade and rooftop agriculture has great potential in regulating urban local microclimate, building energy conservation and carbon emission reduction. This study aims to address the limitation that the existing studies lack multi-effect simulations of integrated implementation of facade and rooftop agriculture. It takes into account the variability and complexity of thermal coefficients in planting layers during the simulations. By analyzing in-situ observations, the study examines the regulatory impact of integrated agriculture on urban microclimate. Furthermore, it uses observed data instead of DeST temperature database data to simulate the energy-saving effect and carbon emission reduction. In order to analyse the average economic efficiency of rooftop and facade agriculture in China, the study conducts a meta-analysis of existing cases in China. The results of the study are as follows: (1) The thermal insulation efficiency of the facade and rooftop integrated agriculture varies with weather conditions and diurnal variations. It reaches the strongest (1.68°C) on sunny days and around noon, (2) The integrated implementation of facade and rooftop agriculture on a normal home building in Changsha can save a total of 12,226.30 kW·h (5%) of electricity per year, and thus reducing 2,809.26 kg of carbon emissions, and (3) Based on meta-analysis and LCA calculation, the average net present value of the project in China for 40a is RMB -937712.18. The economic efficiency needs to be optimized. The results of this study reveal the ideal ecological benefits of facade and rooftop agriculture and the economic efficiency that hinders their implementation, providing a theoretical basis for building energy conservation and renovation, and the economic efficiency optimization in the regions with hot summer and cold winter.
1. Introduction
The Horizon 2020 Expert Group on “Nature-Based Solutions and Re-Naturing Cities” defines “nature-based solutions (NBS)” as actions that are inspired by, supported by or copied from nature (Kabisch et al., 2016). NBS can simultaneously provide multiple options for achieving urban sustainability goals, such as biodiversity protection, mitigation of and adaptation to climate change and providing social welfare (Kabisch et al., 2016). There are four main forms in realization of NBS: green integrated buildings (facades and rooftops), urban green spaces, community gardens and urban agriculture and green-blue infrastructure. Under the background of acceleration of urbanization and growing land constraints, green integrated buildings (facades and rooftops) are an effective way to solve the problem of land competition with other land projects in cities.
Due to the reduction and resistance of solar radiation by facade and rooftop greening and the evaporation effect of plants and planting layers, it has a significant regulating effect on the thermal environment inside and outside the building and the local microclimate of the city. At present, the scholars in both China and abroad have conducted the studies on the influence of façade (Perez et al., 2014) or rooftop (Appolloni et al., 2021) greening on the internal (Niachou et al., 2001) and external (Berardi, 2016) thermal environment of buildings in different seasons (Xing et al., 2019), and found that it has good effects in regulating the internal and external temperatures of buildings and saving building energy, with energy-saving efficiency of up to 25–58.9% (Coma et al., 2017). However, there is a lack of research on the microclimate characteristics and the ecological and economic benefits of the integrated use of green facades and roofs. When simulating the energy-saving effect on ecological benefits, the thermal parameters of green walls and rooftops are usually calculated based on experimental data and then the thermal parameters are input into the software for simulation. Using fixed thermal parameters in simulation software may introduce bias in the results due to the complexity and variability of thermal coefficients in the planting layer (Hoelscher et al., 2016). In addition, in the context of China’s efforts in achieving the “dual carbon targets,” the carbon reduction capacity of buildings is receiving increasing attention from scholars. Wang et al. (2016) and Wu et al. (2017) compare the carbon reduction capacity of green buildings and conventional buildings from a life-cycle perspective. The energy-saving effect of green walls and rooftops of buildings will contribute to carbon emission reduction. Therefore, this study calculates the carbon emission reductions from the integrated implementation of roof and facade agriculture in buildings. In terms of economic benefit analysis, the existing studies are usually conducted for a single case. Since the project costs are influenced by many uncertain factors such as the purpose of farming, farming form (open-air or greenhouse), agronomic technology, crop type, growing substrate and farming scale (Appolloni et al., 2021), the construction and maintenance costs estimated by scholars vary greatly from project to project, spanning from USD17.3 to USD 1,000/m2 (Appolloni et al., 2021; Huang et al., 2022). As a result, the evaluation of the economic benefits of green walls or rooftops is polarized, with most scholars considering that the high costs in design, construction and maintenance of the system are the main factors limiting the implementation of facade and rooftop agriculture (Perini and Rosasco, 2013; Specht et al., 2014; Kim et al., 2018; Chen et al., 2019; Goodman and Minner, 2019; Appolloni et al., 2021; Pena et al., 2022), while some others believe that facade and rooftop agriculture has more desirable economic benefits (Huang et al., 2022).
Based on this, this study adopts a controlled experimental method to conduct high-precision continuous in-situ observations to analyze the law of regulating effect of the crop layer on the microclimate of its underlying air layer. A new method for simulating energy-saving benefits was proposed. It involves using in-situ observation data instead of DeST temperature database to simulate the energy consumption of a normal home building in Changsha City before and after implementing crop planting on the walls and rooftops. The aim is to quantify the energy-saving effect and carbon emission reduction capacity of the planting layer by maximizing the dynamic variation pattern of its thermal coefficient. By using meta-analysis, the existing studies on the construction and maintenance costs of green walls and rooftops in China were retrieved and analyzed to find the average level of their costs in the national context. Based on life cycle assessment, the quantification of ecological benefits is included in the economic benefit analysis, providing a representative evaluation of the economic benefits of facade and rooftop agriculture in China, so as to enrich the case studies of ecological and economic benefits of different types of urban agriculture and to summarize the feasibility and obstacles of promoting facade and rooftop agriculture in China.
2. Experimental equipment and methods
2.1. Experimental location
The experimental site is in Changsha City, Hunan Province.The experimental building is located in Changsha County, Changsha City (as shown in Figure 1). Changsha city is located in middle-east of China and northeast of Hunan Province, spanning 27°51′-28°41′ N latitude and 111°53′-114°15′ E longitude. According to the climate statistical data provided by the China Meteorological Science Data Service Network, the annual average temperature of the Changsha metropolitan area is 18.4°C, with the maximum of 39.9°C and the minimum of −2.4°C, the total sunshine duration is 1,494.5 h, the multi-year average precipitation is 1,632.5 mm, and the multi-year average evaporation is 902.0 mm (Xu Z. et al., 2021). The climate is characterized by cold winters and hot summers, with distinct four seasons, short springs and autumns and long winters and summers, fully reflecting the common characteristics of the subtropical continental monsoon climate (Ji and Hu, 2018). Therefore, the selection of Changsha as the experimental site can more representatively reflect the regulating effects of facade and rooftop agriculture on the microclimate in the cities with the subtropical continental monsoon climate characterized by hot summers and cold winters and their ecological and economic benefits in China.
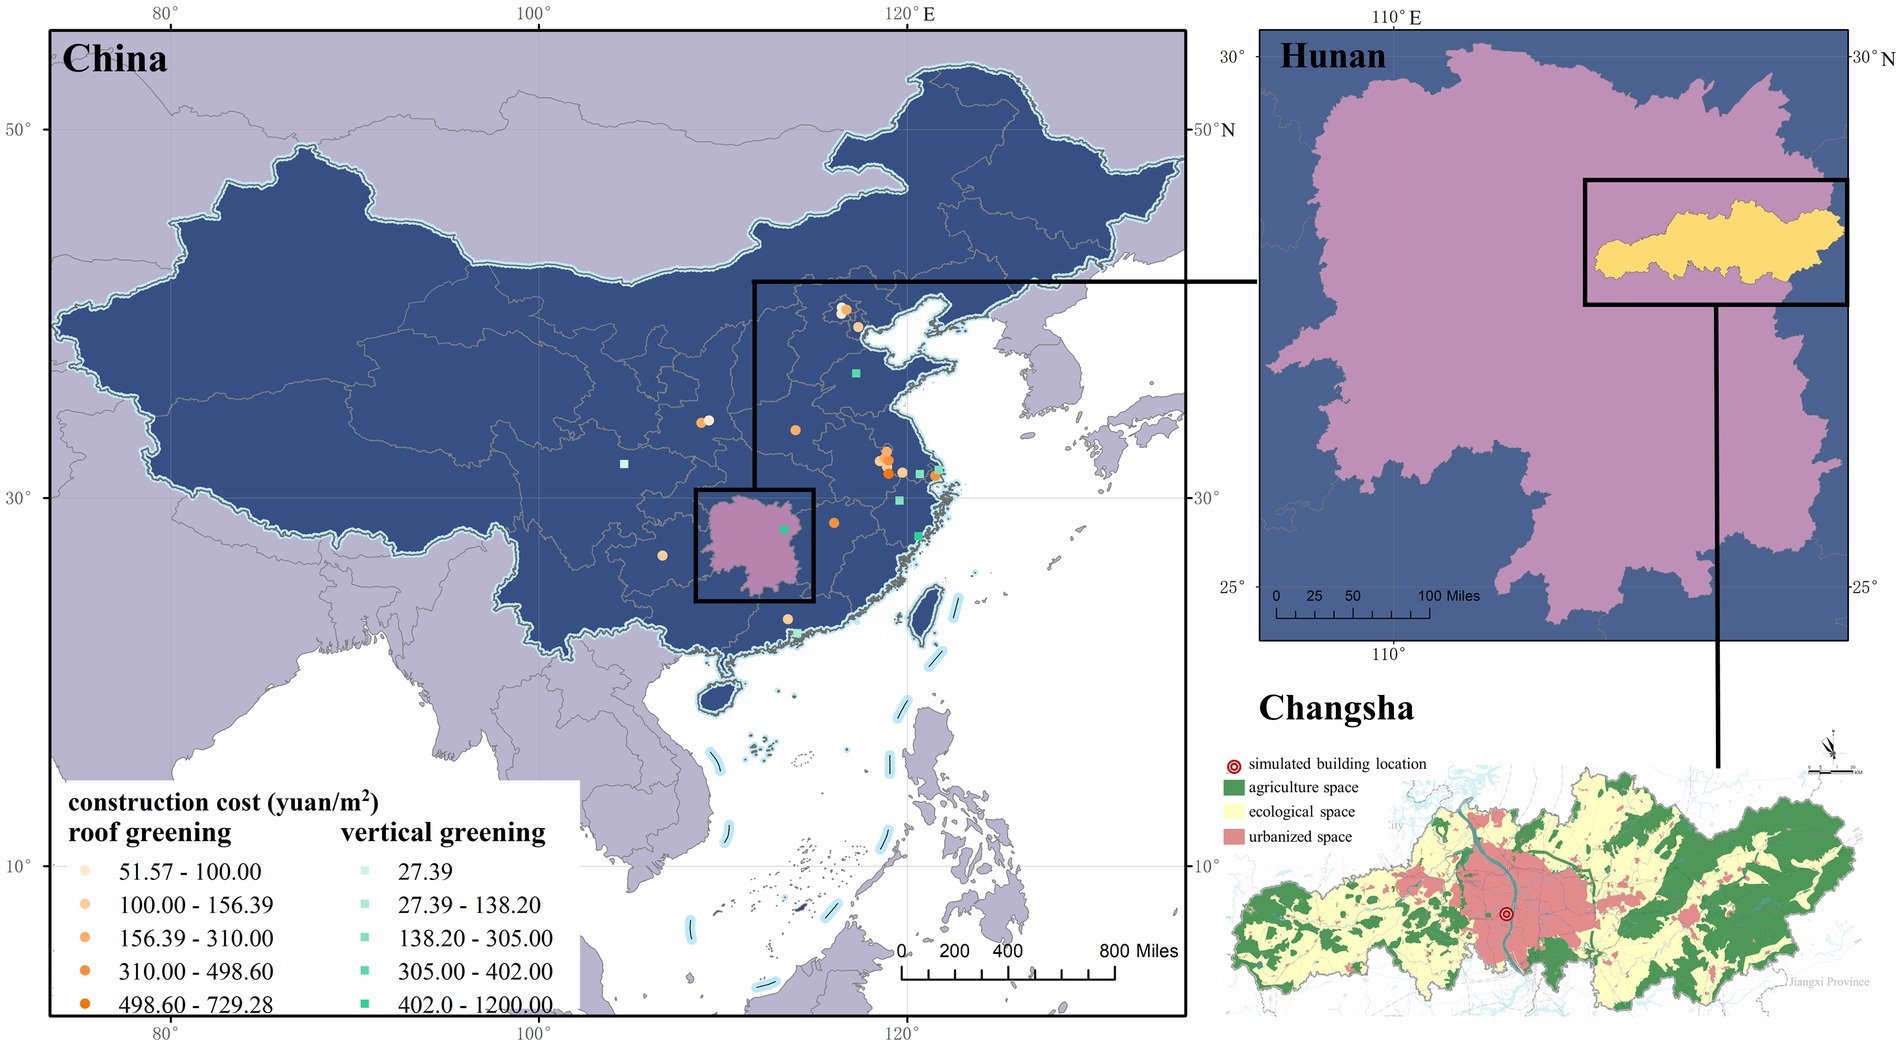
Figure 1. Experimental location and distribution of meta-analysis cases.
2.2. Experimental materials and methods
Two identical planting boxes with dimensions of 80 × 40 × 100 cm with holes at the bottom (for water drainage in the planting layer) were placed on a balcony of the Jingwei Building of Hunan Normal University as the experimental group and the control group, respectively. The balcony faces south and without any obstruction around for better simulation of the open-air environment. In the experimental box, a filter layer was laid at the bottom of the box to prevent soil loss through the pores, and soil was laid on the filter layer for growing peppers. In the control box, only a filter layer was laid at the bottom of the box to prevent leaves and other debris from passing through the pores at bottom and without any other treatment. To meet the observation requirements, two sets of HW200 temperature and humidity recorders were placed at the bottom of two experimental boxes for making real-time observation of the temperatures of the air layers at the bottom of the experimental boxes. The lower portions of the experimental boxes were surrounded by foam boards to prevent water spraying on the balcony floor and avoid the temperature at the bottom of the planting boxes from being disturbed by the external environment.
3. Materials and methods of analysis
3.1. Experimental data and its pre-processing
According to the Thermal Design Code for Civil Buildings, Changsha City belongs to the hot summer and cold winter area. The Energy Conservation Design Standard for Residential Buildings in Hot Summer and Cold Winter Areas stipulates that the calculation periods are June 15–August 31 of the current year for air-conditioning and December 1st - February 28 of the following year for heating. Since the winter in Changsha is relatively warm and the time of heating by air conditioning is short, the power consumption is limited. Therefore, this experiment took June 15–August 31, 2022 as observation interval and simulated the energy consumption savings of air conditioning due to thermal insulation effects in summer by facade and rooftop agriculture and the resulted reduction of carbon emissions.
A total of 78 sets of temperature data were obtained through the observation period of June 15–August 31, 2022, and each set of temperature data was recorded with 30-s accuracy for the experimental and control groups during the 24 h of the day. For the individual extreme outliers, they were processed by deletion followed by interpolation, i.e., the outliers were deleted and replaced by the mean value of the two values immediately before and after the outlier to correct the problem of extreme outliers due to the instability of the instruments.
3.2. Analysis method of thermal insulation effect
3.2.1. Influence of different weather types on the thermal insulation effects of facade and rooftop vertical agriculture
According to the weather types involved in the experimental observation process, the weather was classified into three categories: sunny, cloudy/overcast and rainy, and then the data were divided into three groups based on the weather types: data 1, data 2, and data 3. The daily temperature difference between the experimental group and the control group in every 30 s in each weather type was calculated and the average value of the daily temperature difference was found. Statistical graphs of the data were made with the weather type as the horizontal coordinate and the mean daily temperature difference and the daily maximum/low-temperature difference as the vertical coordinates, respectively.
Where is the temperature difference at time point i (interval of 30 s), is the temperature of the control group at time point i, is the temperature of the experimental group at time point i, and is the mean daily temperature difference, all in °C.
3.2.2. Daily variation pattern of temperature difference
The comprehensive statistics of the time periods during which the daily highest and lowest temperature differences occur in all data groups, as well as in data groups of different weather types (data 1, data 2 and data 3) were made and a frequency histograms were plotted separately to obtain the general daily variation pattern of the temperature difference and the variation pattern of different weather types.
3.3. Simulation of energy saving potential
DeST system is a building environment and HVAC system simulation software platform developed by the Institute of Environment and Equipment, Department of Architectural Science and Technology, Tsinghua University. It can be used either to analyze the thermal characteristics of buildings in detail,or to simulate the system performance, which better solves the limitations of previous air conditioning system simulation software such as TRNSYS, SPARK, and HVACSIM and building energy consumption simulation software such as DOE-2, EnergyPlus, and ESP-r, which cannot well realize the joint dynamic simulation of building and air conditioning system. This system has successfully realized the coupling of building and its control system design.
In this study, the air layer in between the planting layer and the building surface after the implementation of vertical greening on the rooftops and walls in the simulation scenario was taken as a whole, and the temperatures under the planting layer taken in the in-situ observation were that of the air layer. The temperatures of the air layers in the control group and the experimental group taken in the in-situ observation were input into the DeST simulation software as the outdoor temperature, respectively. By doing so, the difficult problem of complexity and variability of the thermal coefficient of the crop planting layer can be effectively avoided, while retaining its dynamic change process as much as possible. At the same time, it can also simulate the regulatory effect of crop planting layers on the microclimate near the building surface.
3.3.1. Overview of the building
The simulated object is a 6-story home building in a residential area of Changsha City. The building was constructed in 2005, north–south oriented and with total construction area of 3,168.4m2. The building has two households on each floor sharing the same staircase, with 24 households totally. The building height is 16.8 m. The floors 2–6 are all standard floor design. The only difference of the 1st floor from the other standard floors is its staircase. It can be seen from the simulation model (Figure 2) that the staircase of the first floor is in an unclosed state. The building simulation model and the standard floor plan are shown in Figure 2.
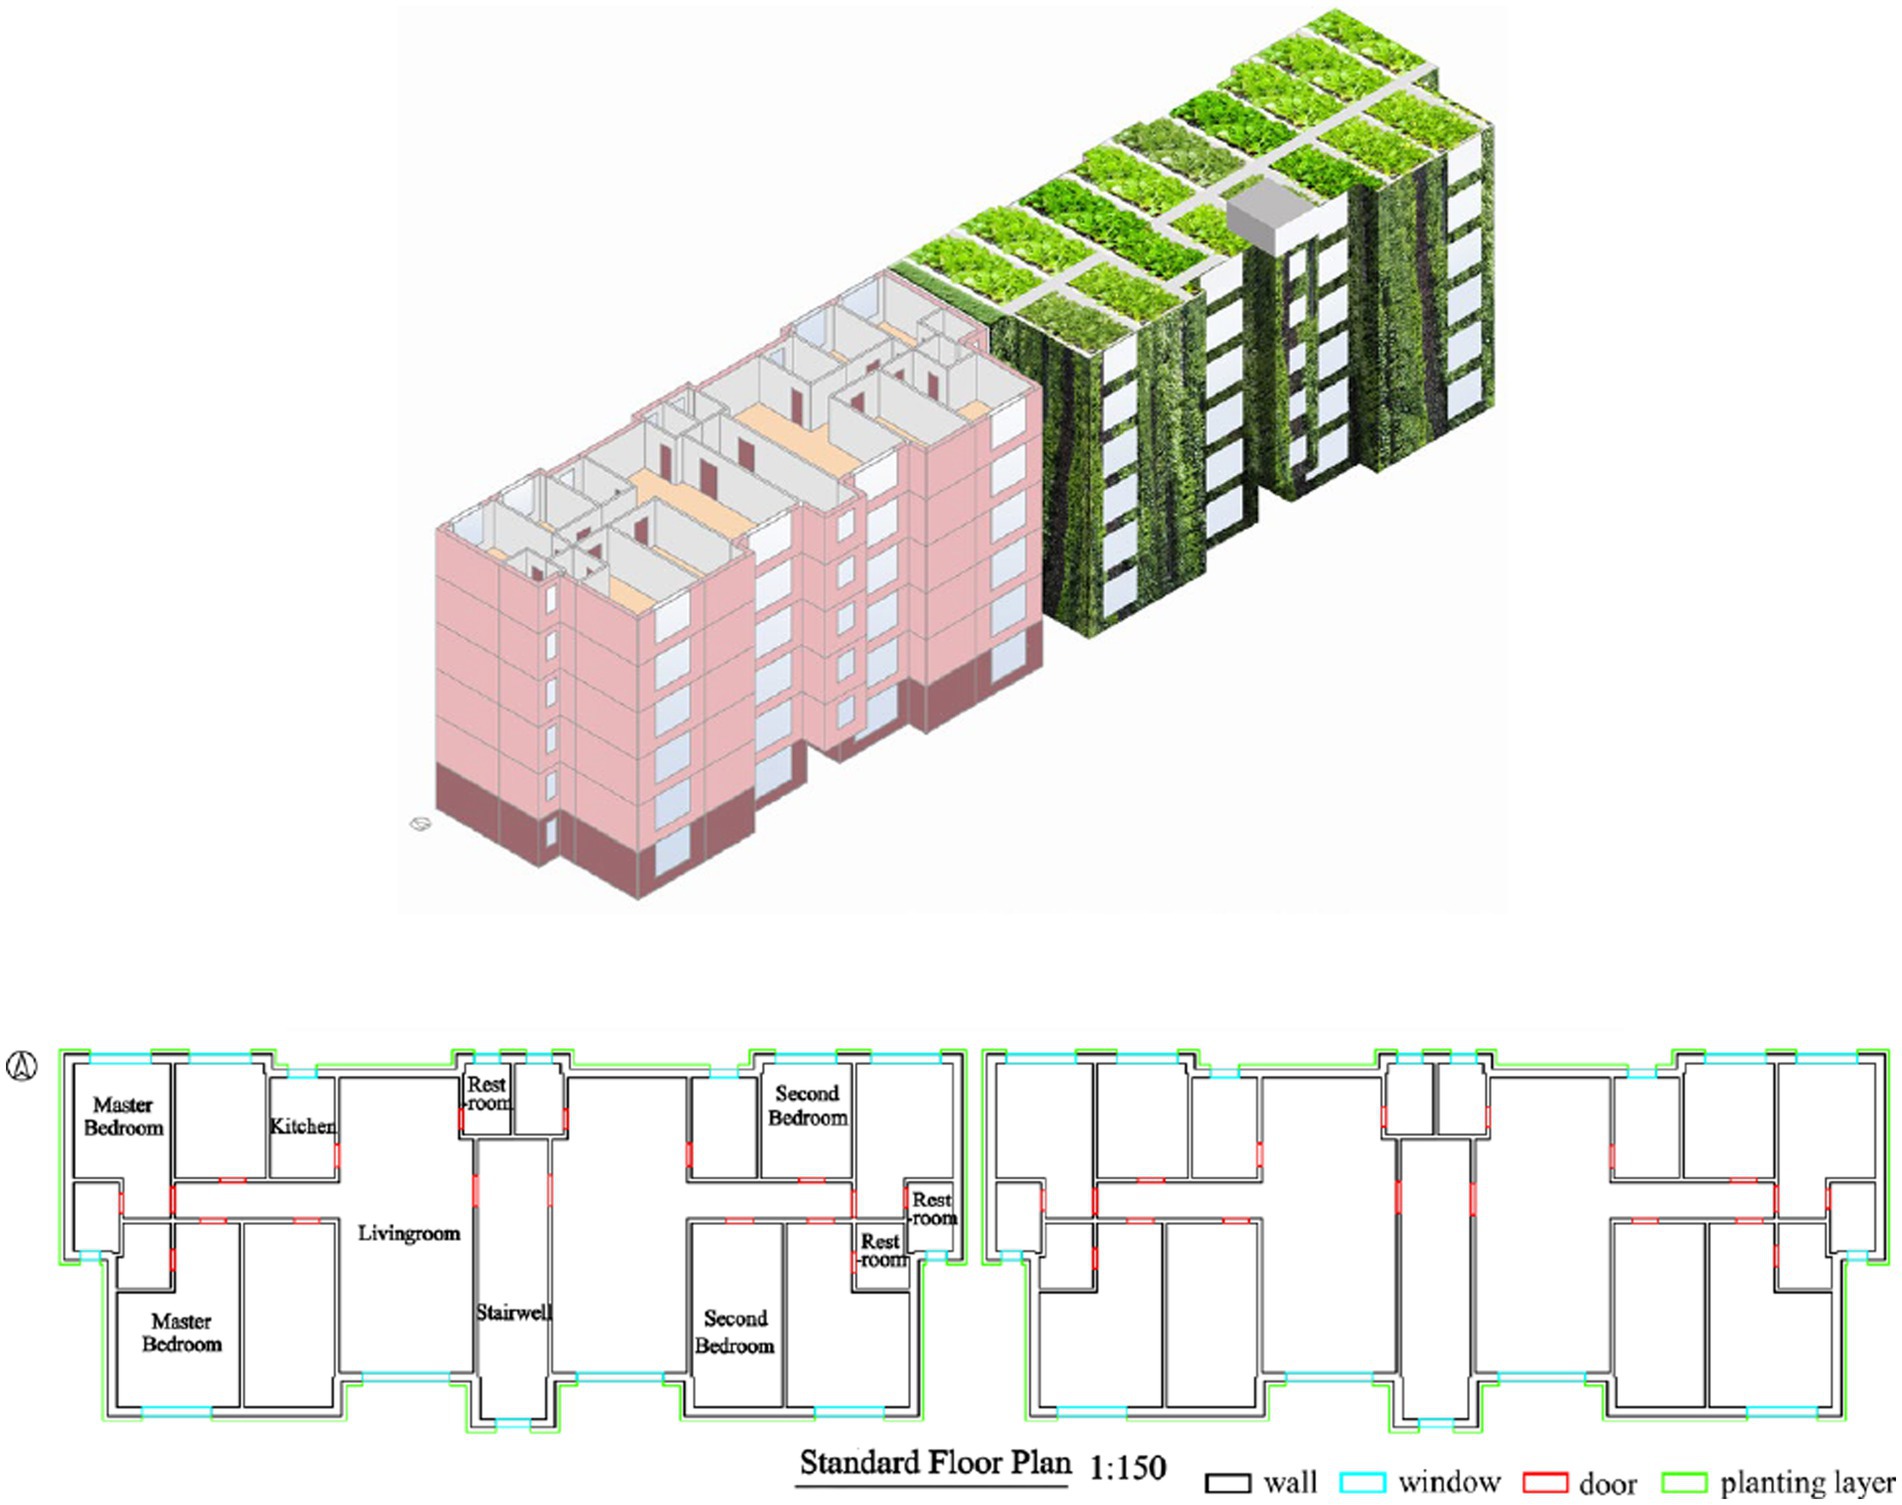
Figure 2. Architectural model DeST 3D drawing and building standard floor plan. Ps: The three-dimensional view in the figure shows a comparison of the effect of the buildings before and after the implementation of greening, which was implemented in both buildings in the actual simulation. The location of the greening is shown in the three-dimensional view and is distributed on all areas of the building surface except for the windows.
3.3.2. The design parameters of the building model
The maintenance structures of the existing buildings in Changsha City meet the requirements of DBJ43/001–2004 Energy Efficiency Design Standard for Residential Buildings in Hunan Province and DBJ43/001–2017 Energy Efficiency Design Standards for Residential Buildings in Hunan Province (hereinafter referred to as the 2004 and 2017 standard, respectively). The 2004 standard has been in effect for a longer period, with a wider range of application and being more representative. As the buildings in this residential area were constructed in 2005, they were designed in accordance with the parameters stipulated in the 2004 standard. The design parameters of the model are shown in Table 1. The basic parameters of different room functions of the building are shown in Table 2. The heat generated from indoor lighting is 0.0141 kW·h/ (m2·d). The frequency of air exchanges when using heating and air conditioning is 1.0 time/h.
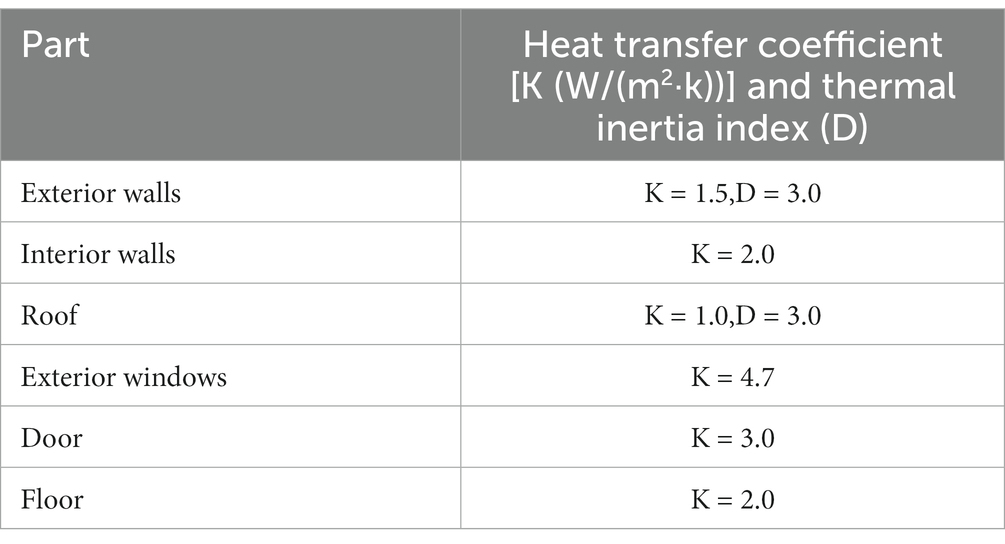
Table 1. Heat transfer coefficient (K[W/(m2·k)]) and thermal inertia index of each part (D).
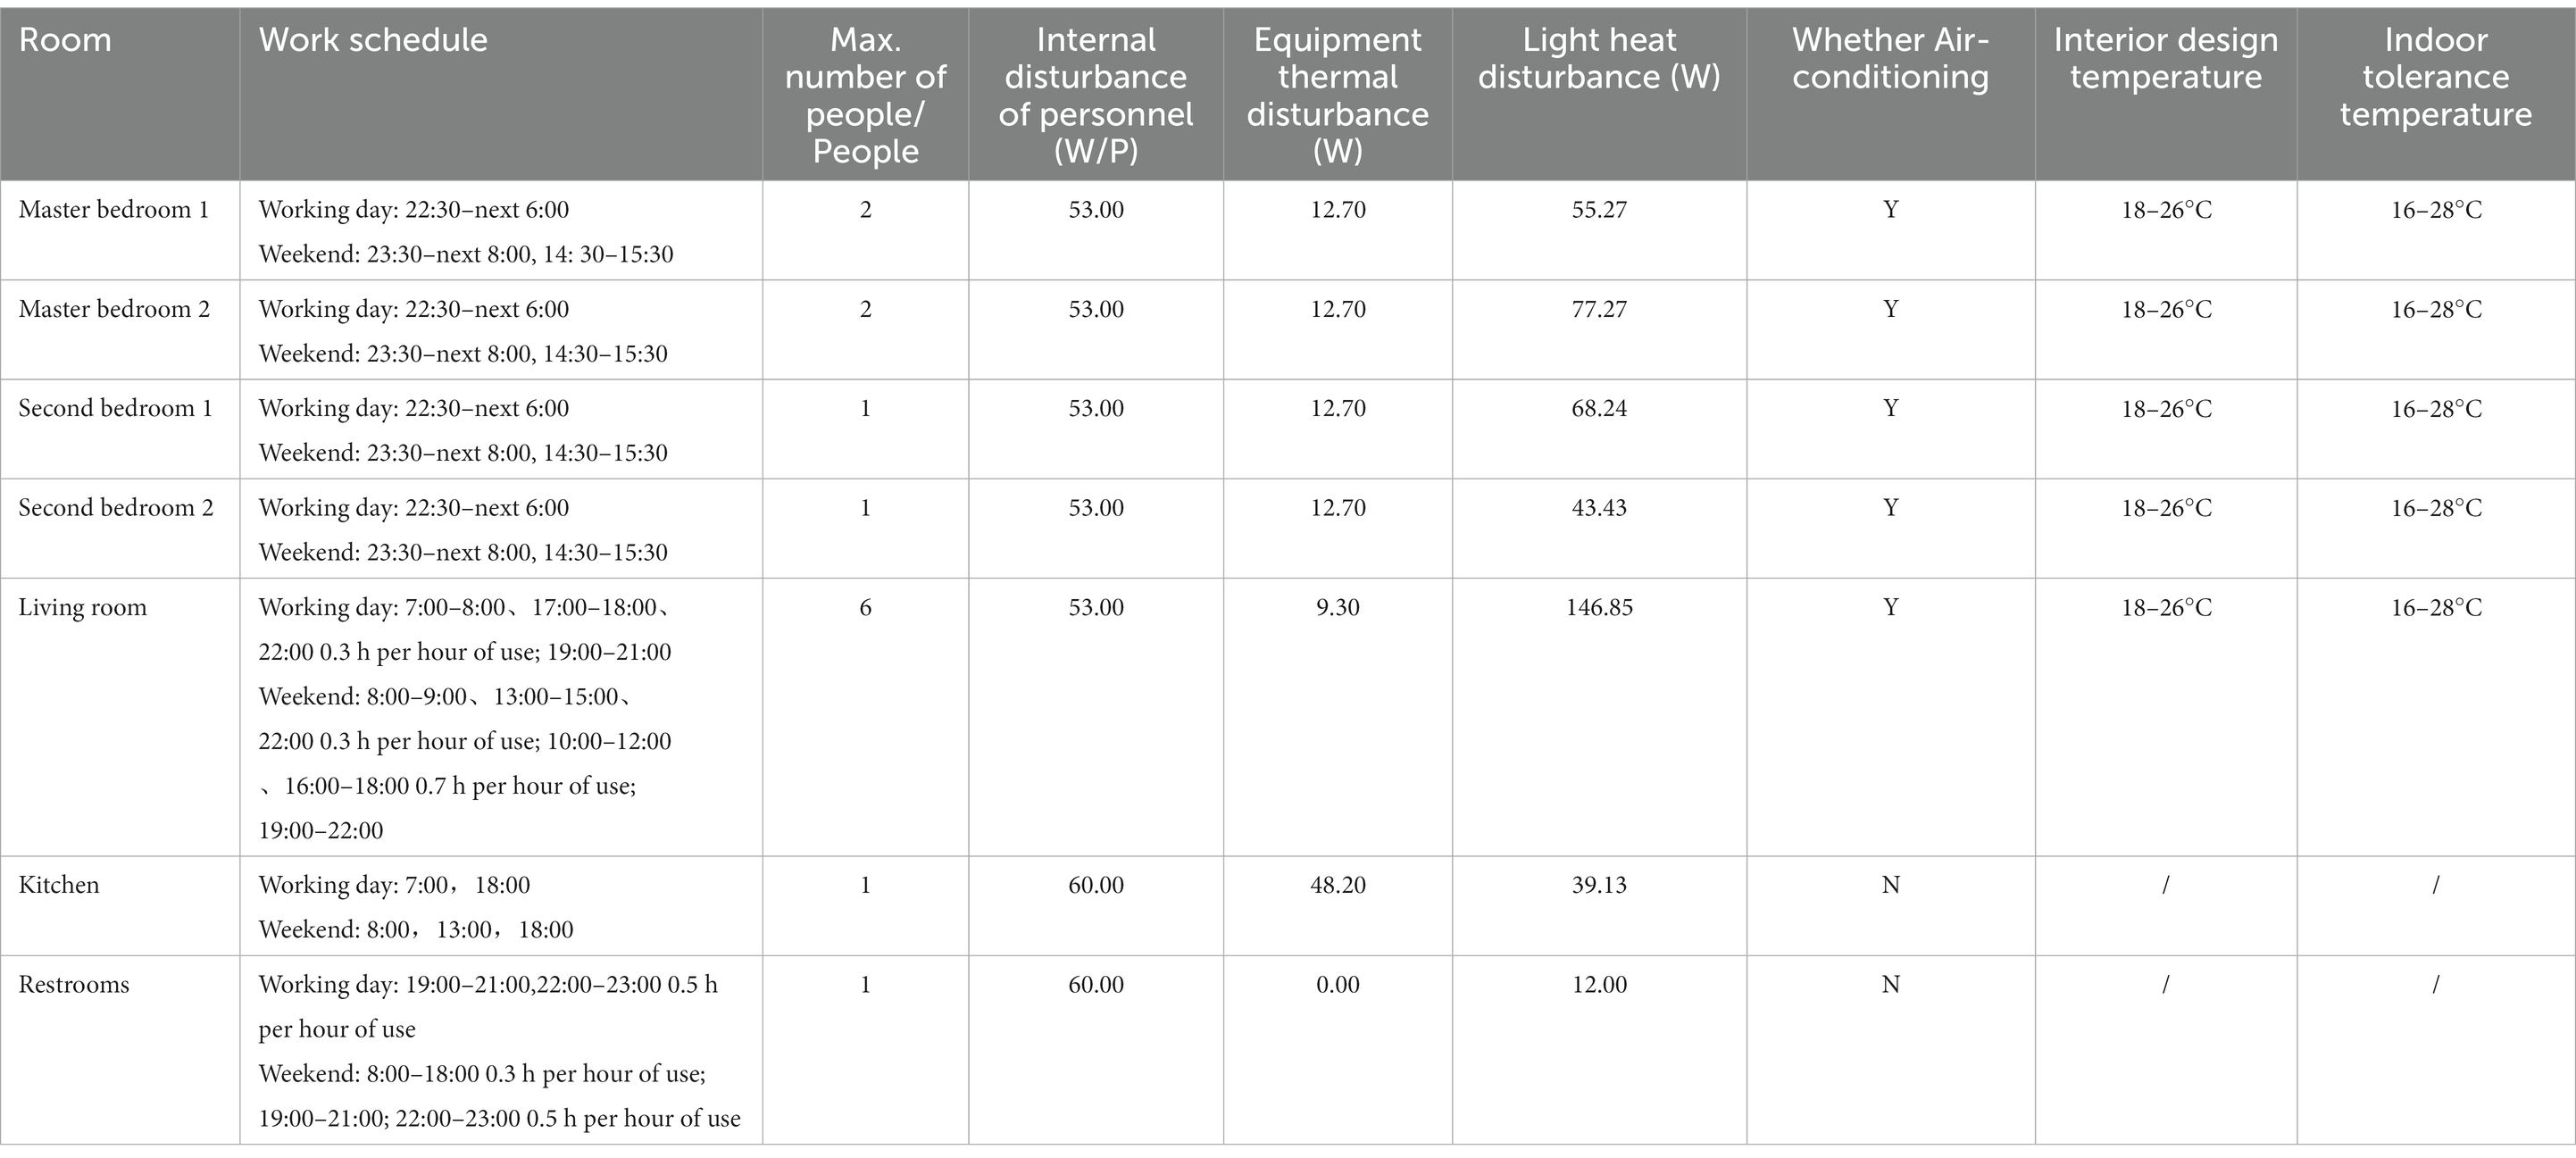
Table 2. Basic setting parameters for different room functions of the building.
3.4. The cost–benefit analysis method for facade and rooftop agriculture based on meta-analysis and life-cycle assessment
As many uncertain factors such as different farming purposes, farming forms (open-air or greenhouse), agronomic technology, crop types, soil substrates and farming scales, etc. are involved in facade and rooftop agriculture and jointly affect the construction cost of farming system, there are large differences in the existing research results. Moreover, due to the late introduction of the vertical agriculture concept in China, the current construction process and technology in China still lag behind as compared with the foreign countries, resulting in cost increase. Therefore, it is more practical to involve the current national situation in evaluating the economic benefits of the domestic cases. Based on this, this study used meta-analysis to conduct a comprehensive search of Chinese and English databases and retrieved a total of 538 research articles on vertical greening in China. Finally 24 qualified articles (17 on rooftop agriculture and 7 on facade wall agriculture) were chosen (Figure 3). The research results of the literature were sorted out, and a total of 18 data on construction costs and 12 data on maintenance costs of rooftop agriculture and 9 data on construction costs and 3 data on maintenance costs of vertical greening were collected, from which the average level of construction and maintenance costs of facade and rooftop agriculture in China was obtained.
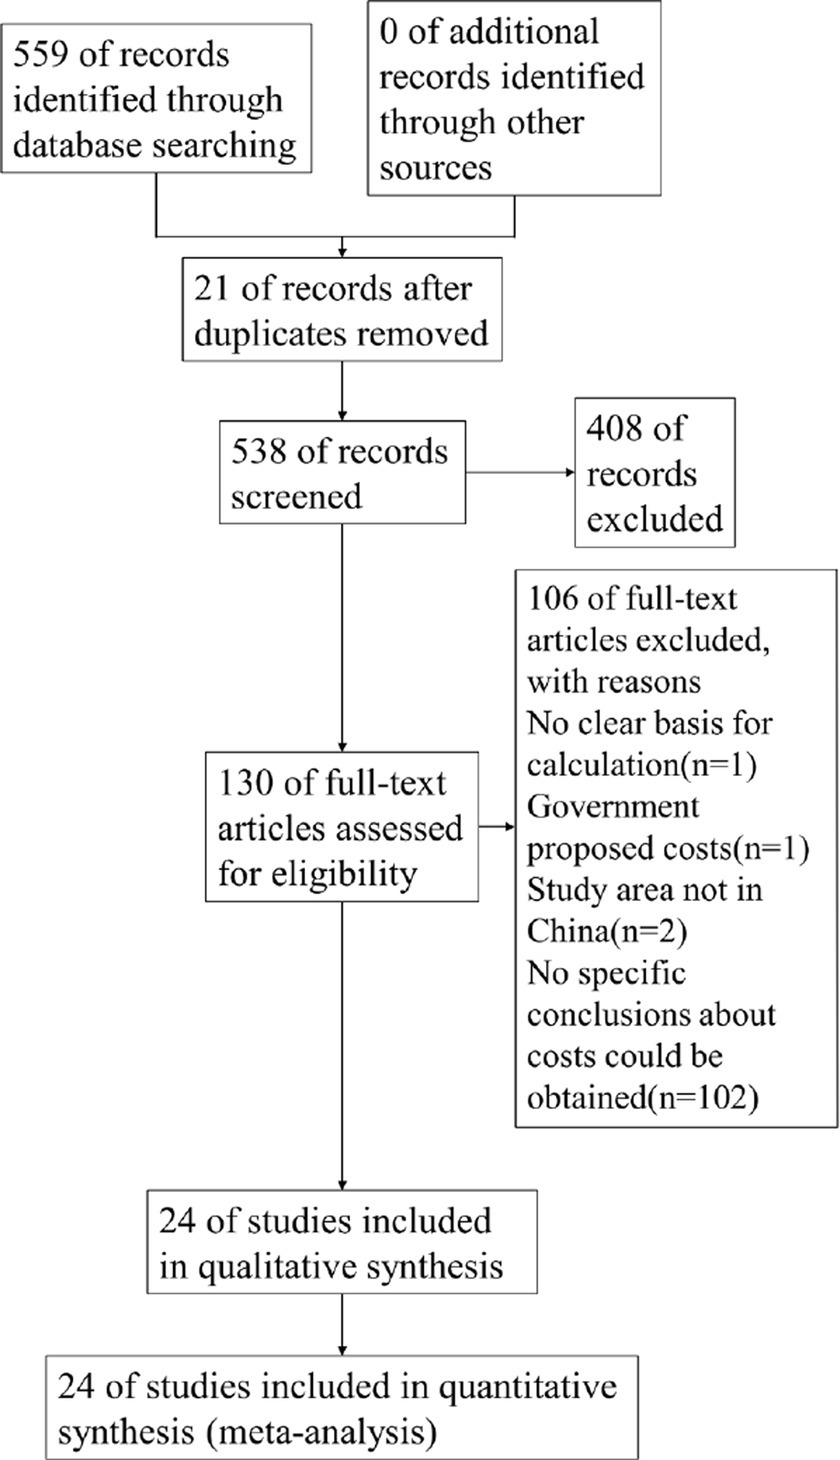
Figure 3. Meta-analysis flow chart.
Life cycle assessment (LCA), as a tool for evaluating the environmental performance of products, is widely used in the green building evaluation system in some countries (Zuo et al., 2017). In this study, the whole life cycle of the green renovation of the building facade and rooftop agriculture refers to the economic life cycle, which mainly includes the initial stage, installation and construction stage, operation and maintenance stage and final demolition stage. Based on the findings of the relevant literature (Feng and Hewage, 2014), a life cycle of 40 years is assumed in this paper.
In the field of engineering economic evaluation, it is the goal of the project decision makers to determine whether the initial investment of the project can make cash flow back through the later returns, while the cost–benefit analysis is to calculate the financial net present value (NPV) and payback period of the project by considering all the costs and quantifiable benefits incurred during the life cycle of the project, so as to provide some reference for the relevant decision-making. In this paper, considering the time value of the capital, the financial NPV and payback period are used for cost–benefit analysis of the building rooftop and facade greening renovation. The formula for calculation of the financial NPV in year k is:
where is the electricity saved, in kW·h; is the unit cost of residential electricity in Changsha City, in yuan/kW·h; is the carbon emission reduction, in kg; is the unit carbon emission reduction cost, in yuan/kg; is the turnover volume of vegetable cold chain transportation, in kg·km; is the unit price of vegetable cold chain transportation, in Yuan/(kg·km); is the turnover volume of vegetable normal transportion, in kg·km; is the unit price of vegetable normal transportation, in yuan/(kg·km); is total vegetable production of facade and rooftop agriculture, in kg; is the sales price of the vegetables, in yuan/kg; is gross profit margin of vegetable sales; CPI is the consumer price index; is the area of green rooftops, in m2; is the maintenance cost of green rooftops, in Yuan/(m2·yr); is the green area of facade, in m2; is the maintenance cost of green facade, in yuan/(m2·yr); is the construction cost of green facade, in yuan/ m2; is the construction cost of green facade, in yuan/ m2; is the subsidy provided by Changsha municipal government for green buildings, in yuan/ m2; is the financial benchmark yield; is the cold chain transportation rate; is the rate of total loss during vegetable transportation; is the vegetable yield per unit area in Hunan Province, in kg/m2; is the vegetable transportation mileage, in km.
According to the residential electricity fee standard in Changsha, yuan. According to the relevant study (Wei and Hou, 2023), yuan. According to the statistics made by the Ministry of Agriculture and Rural Affairs of China, the total loss rate of vegetables during transportation ; the transportation cost per kg of vegetables is about yuan/500 km; the average distance of vegetable transportation radius from production place to sales place is more than 500 km, so the transportation distance of all vegetables in this study is taken as km in the situation without implementation of urban agriculture; the cold chain transportation rate of fruits and vegetables (Yuan et al., 2015). At the transportation distance of 500 km, the current average market price of cold chain transportation yuan/kg. According to the average wholesale price of 28 kinds of key vegetables monitored by the Ministry of Agriculture and Rural Affairs in the whole country, the annual average wholesale price of vegetables yuan/kg, with gross profit margin of vegetable sales . According to the statistical data provided by Bureau of Statistics of Changsha City, the vegetable yield per unit area in Changsha City kg/m2. According to the data provided by National Bureau of Statistics, CPI = 2%. According to the actual financial benchmark yield used in similar renovation projects (Luo, 2017), r is taken as 4.5%. According to the document Notice on Promoting Stable and Healthy Development of the Real Estate Market issued by Changsha Municipal Government, .
4. Results
4.1. The characteristics of the impact of facade and rooftop agriculture on microclimate
4.1.1. The characteristics of the impact of facade and rooftop agriculture on microclimate under different weather types
Figure 4 shows that the average daily temperature difference is positive in most of summer time, i.e., the agricultural planting layer exhibits an overall insulation effect in summer. The highest average daily temperature difference occurred on sunny days, being 2.66°C, and the lowest average daily temperature difference occurred on rainy days, being −0.04°C. The mean value of the average daily temperature difference was the highest on sunny days, being 1.68°C, and the lowest on rainy days, being 0.13°C. The highest mean daily average temperature difference was 1.68°C on sunny days and the lowest was 0.13°C on rainy days. This indicates that the thermal insulation effect of the planting layer was most significant on sunny days, followed by cloudy/overcast days and the lowest on rainy days. It can be seen from the graph that some bars are significantly higher or lower than the general level of the weather type in which they are located. This is caused by significant changes of weather types on that day.
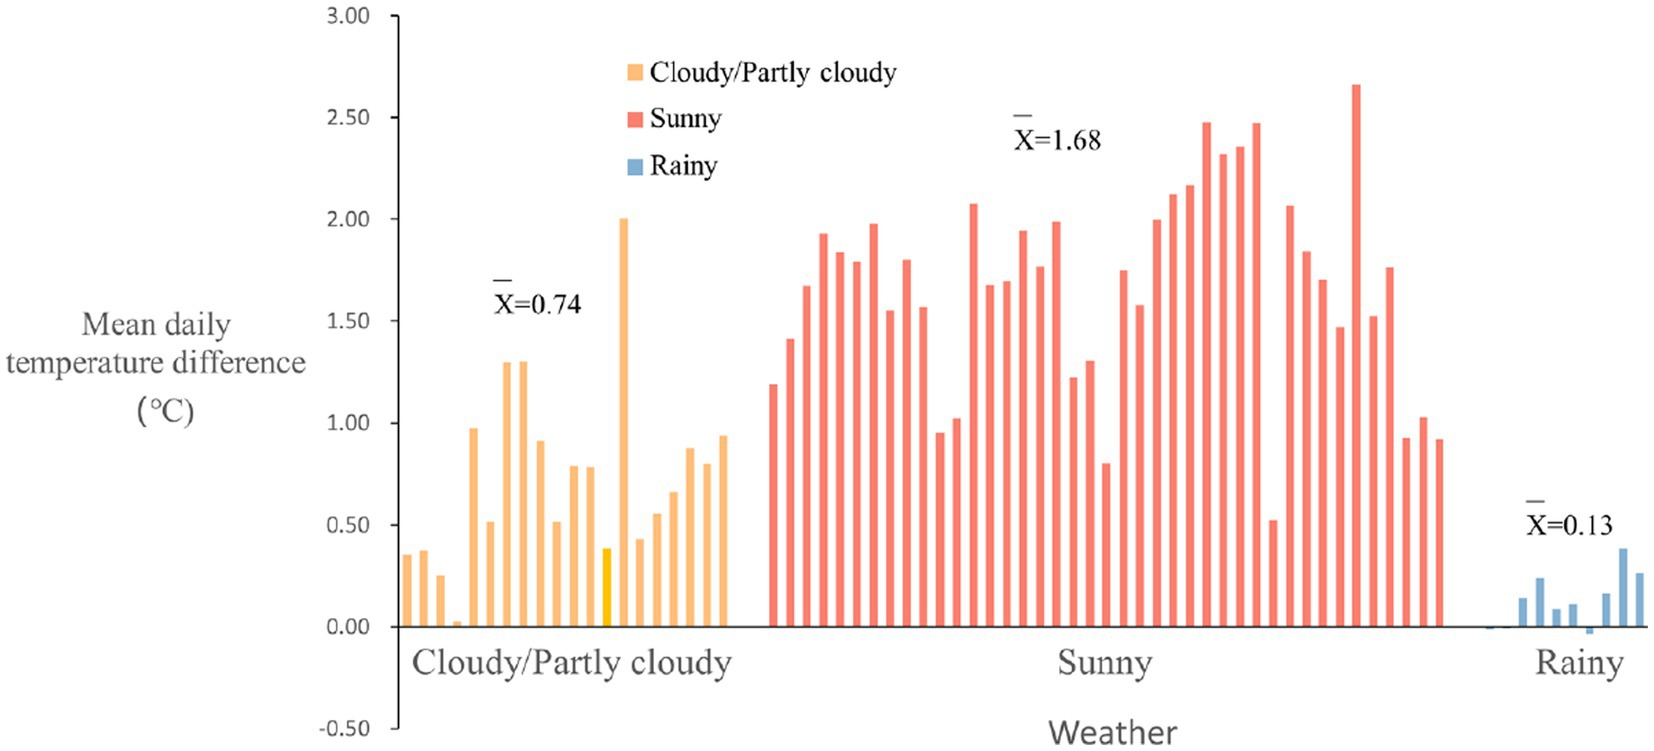
Figure 4. Statistical chart of the average value of daily temperature difference by weather type.
4.1.2. The characteristics of the impact of facade and rooftop agriculture on microclimate at different times of the day
As can be seen from Figure 5, the maximum value of the daily highest temperature difference occurs on sunny days, being 11.8°C. The fluctuation of the daily highest temperature difference was more obvious, in which the fluctuation of the highest dialy temperature difference on most of sunny days was relatively steady, around 9°C, while the highest daily temperature difference in overcast sky days/cloudy days and rainy days fluctuated more greatly. On the general level, the daily highest temperature difference on sunny days > that on overcast sky days/cloudy days > that on rainy days, again indicating that the insulation effect of the planting layer is most satisfactory on sunny days. In terms of the lowest daily temperature difference, there was no significant fluctuation in the lowest temperature difference under the corresponding three weather types. Compared with the highest daily temperature difference, the lowest daily temperature difference less fluctuated, in the range of around −1°C, indicating that the thermal insulation effect of the planting layer was not obvious in summer and no significant difference under different weather types.
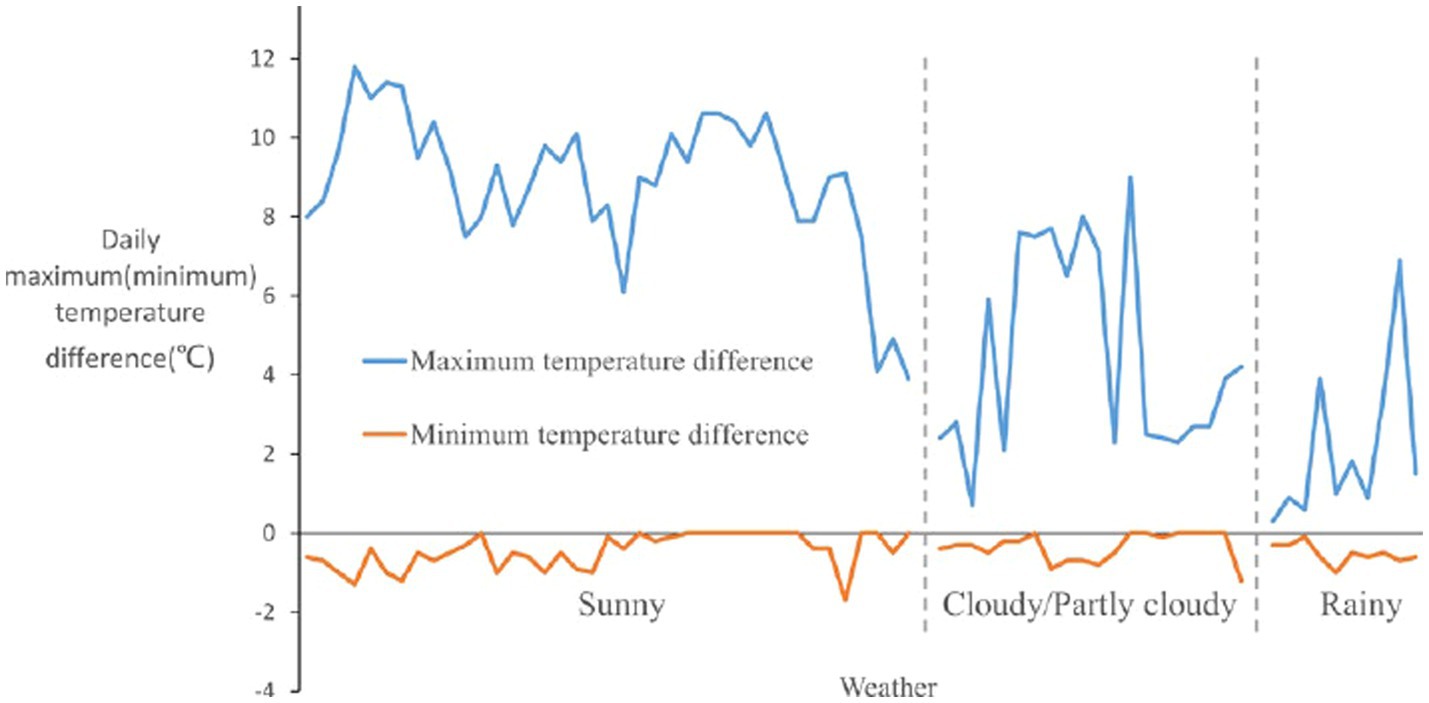
Figure 5. Statistical chart of maximum (minimum) temperature differences by weather type.
It can be seen from Figure 6 that the highest temperature difference occurs at 10:00–15:00, indicating that the insulation effect of the planting layer is most significant at these times, with particular concentration at 13:00–14:00. It can be seen also through comparison of the frequency distribution maps of the highest temperature difference under the three weather types that the highest temperature difference appears at 12:00–15:00 on sunny days, with particular concentration at 13:00–14:00; followed by overcast sky days/cloudy days, the highest temperature difference appears at 11:00–15:00, with particular concentration 12:00–12:30; the highest temperature difference of rainy days appears more randomly, with a close frequency of occurance within each time period of 10:00–15:00.
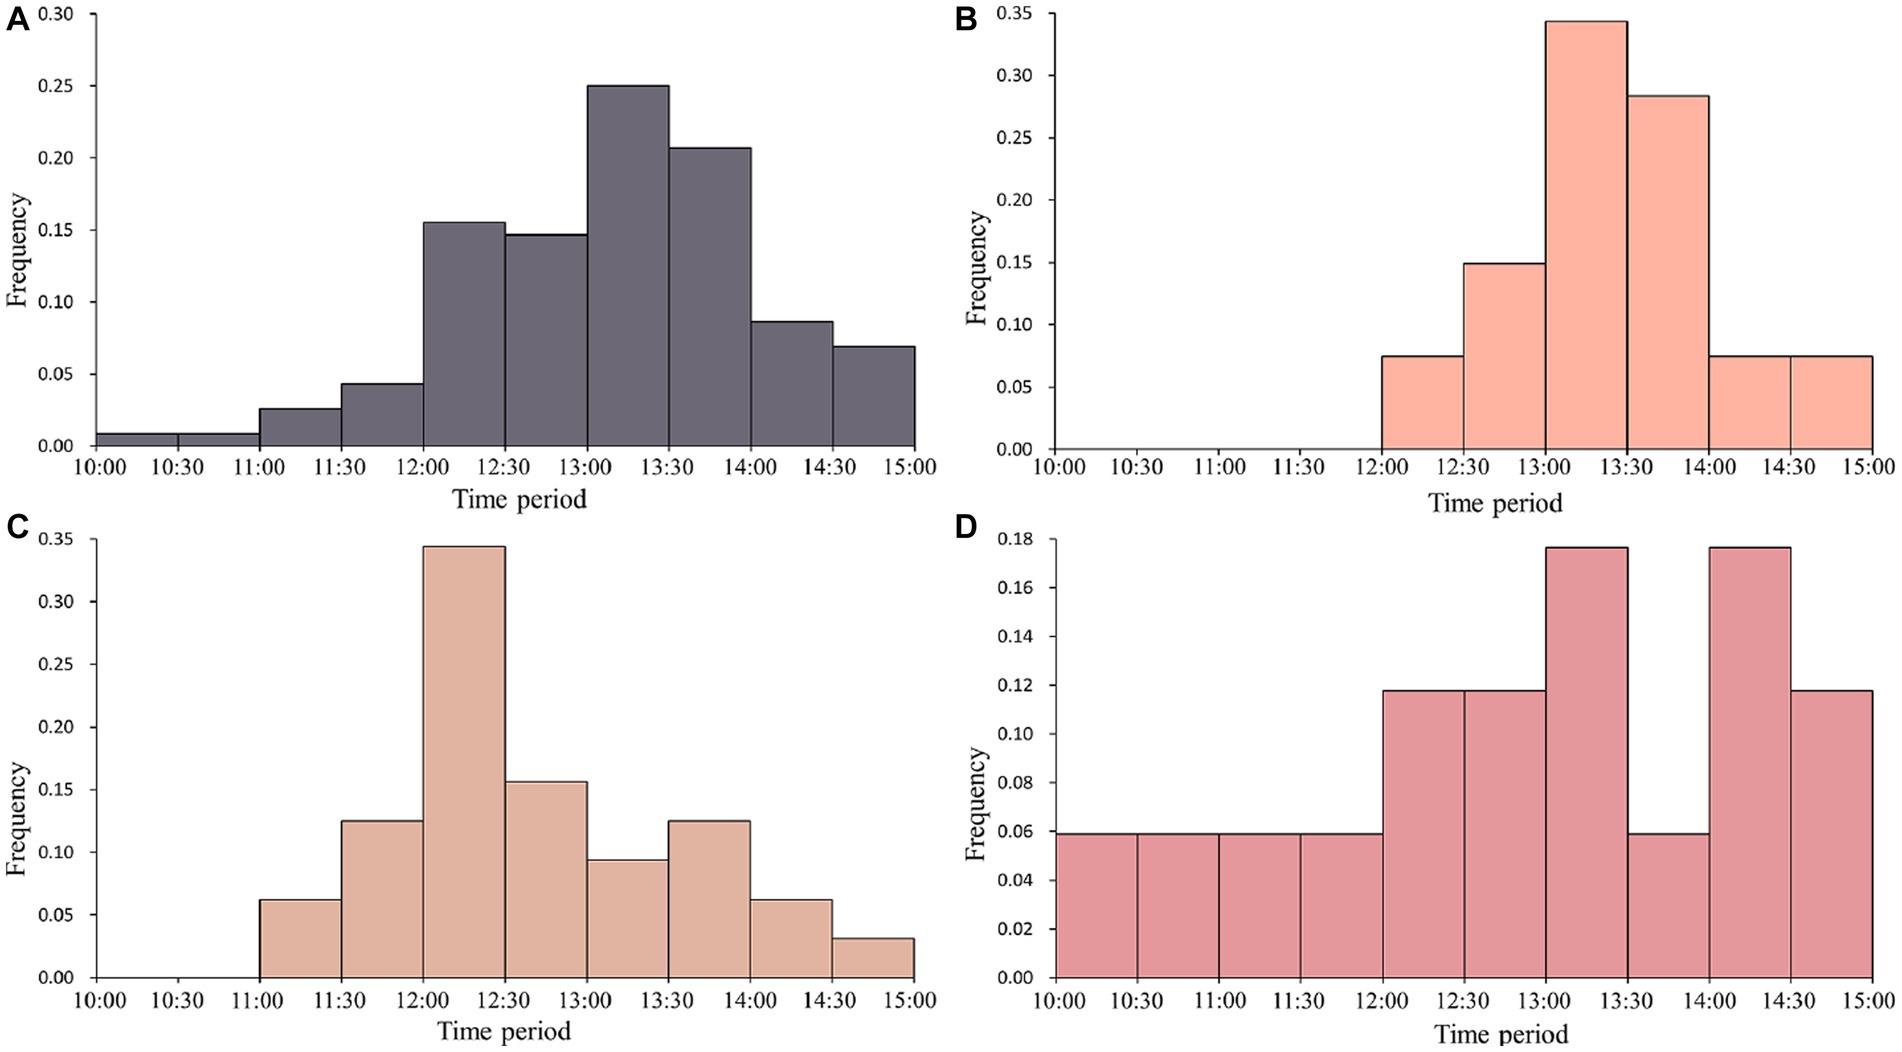
Figure 6. Histogram of the frequency distribution of the period when the maximum temperature difference occurs in all observation days (A), sunny days (B), cloudy/partly cloudy days (C), and rainy days (D).
From Figure 7 we can see that the time periods when the lowest temperature difference appears are relatively scattered and involve longer time period and without obvious clustering phenomenon. It was found from the statistics that the lowest temperature difference appeared most frequently at 16:00–17:00. From the comparison of the frequency distribution maps of the lowest temperature difference under the three weather types, we can see that the time periods when the lowest temperature difference appears have obvious differentiation under different weather types. It mainly appears at 16:00–17:00 in sunny days, with the frequency of occurance significantly higher than the other time periods. It mainly appears at 19:00–21:00 on overcast sky/ cloudy days and at 19:00–20:00 and 24:00–1:00 of the next day on rainy days, with a close frequency of occurance in each time period.
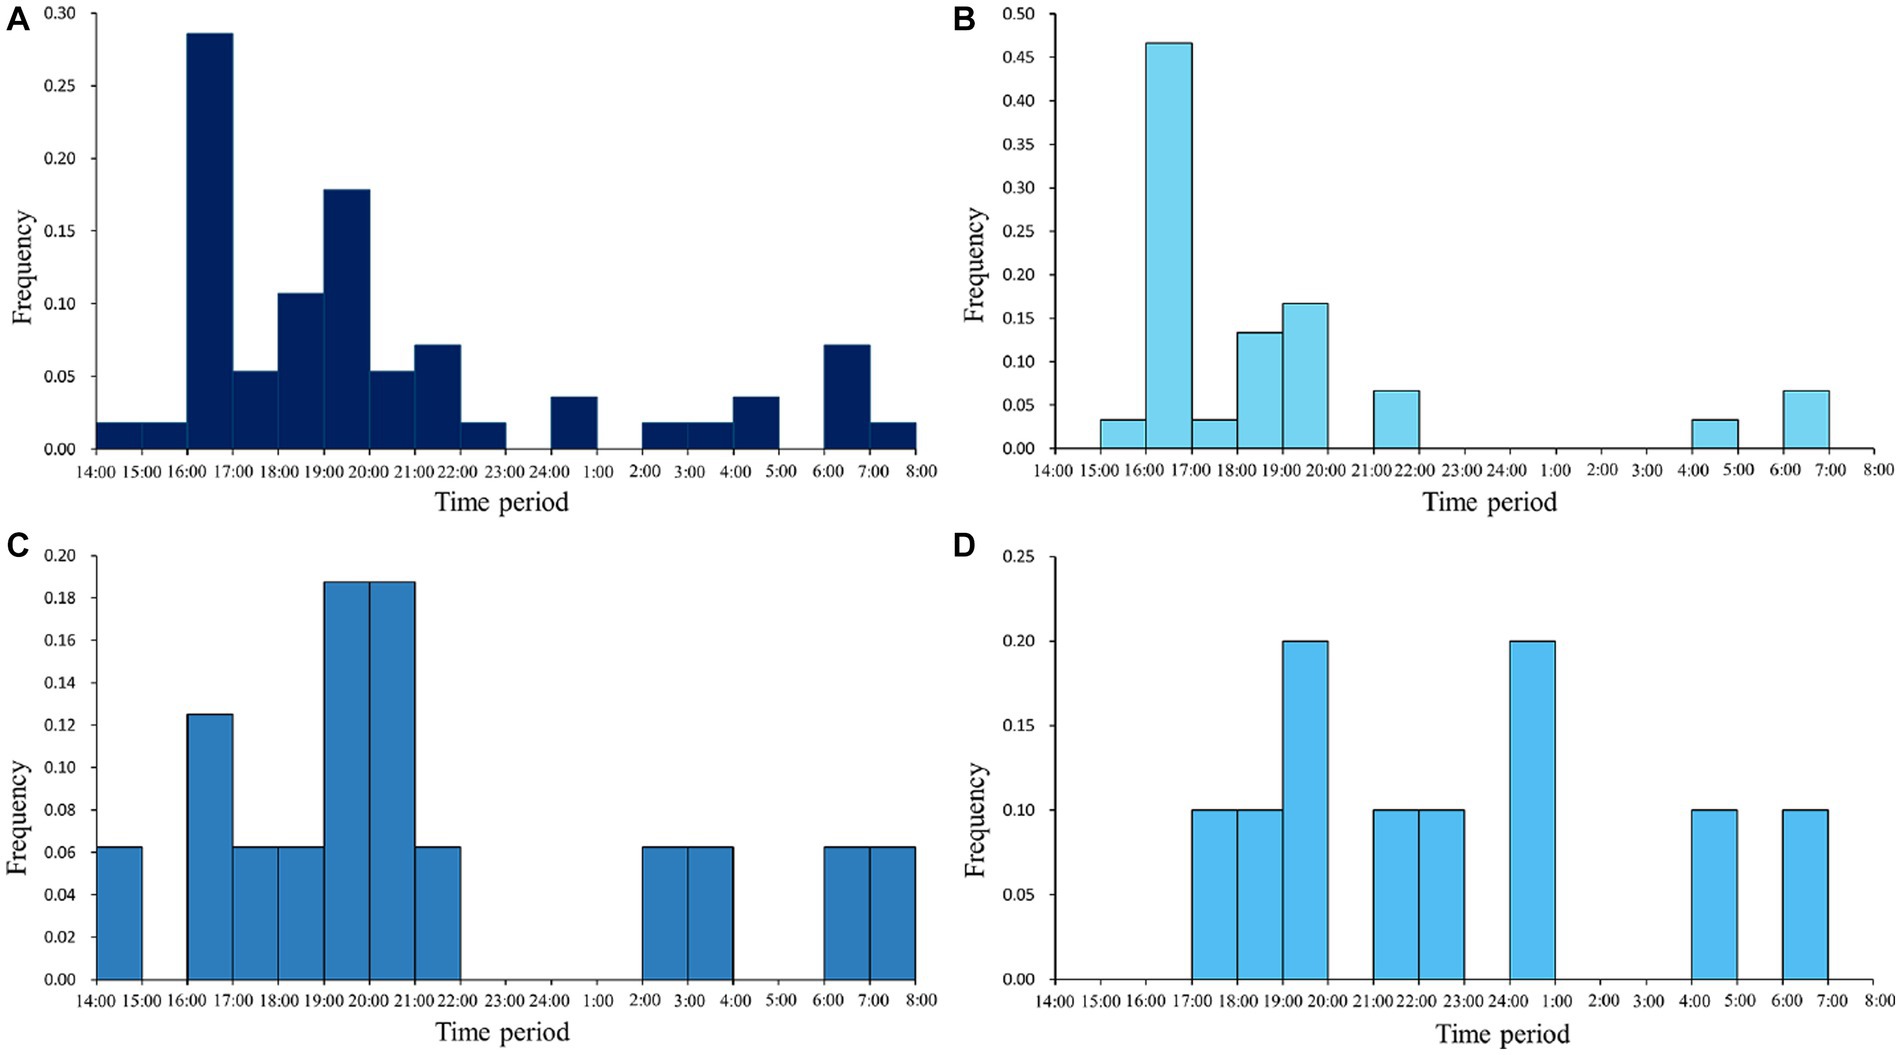
Figure 7. Histogram of the frequency distribution of the period when the minimum temperature difference occurs in all observation days (A), sunny days (B), cloudy/partly cloudy days (C), and rainy days (D).
4.2. Dest-based prediction of energy saving effect and carbon reduction capacity of facade and rooftop agriculture on normal home buildings in Changsha City
As shown in Table 3, the annual cumulative heating load of a basic building without urban agriculture is 10,250.90 kW·h; the annual cumulative cooling load is 258,727.64 kW·h; and the total annual load of the building is 268,978.54 kW·h. The heating load only accounts for 3.81% of the total annual load, and the cooling load even occurs during the heating period (as shown in Figure 8). This phenomenon is caused by the characteristics of the subtropical climate in Hunan Province. It was found from the in-situ experimental data that the thermal insulation effect of the planting layer in the heating calculation period in winter was insignificant. The temperature difference between the experimental group and the control group was lower than 0.5°C. The air conditioners in Changsha city are mainly used for cooling in summer and the usage rate is not high in winter. It can be concluded that the energy saving effect of the crop planting layer is mainly reflected in summer. Therefore, this study will focus on the discussion of building energy saving effect and carbon reduction capacity of urban agriculture in air conditioning period in summer.
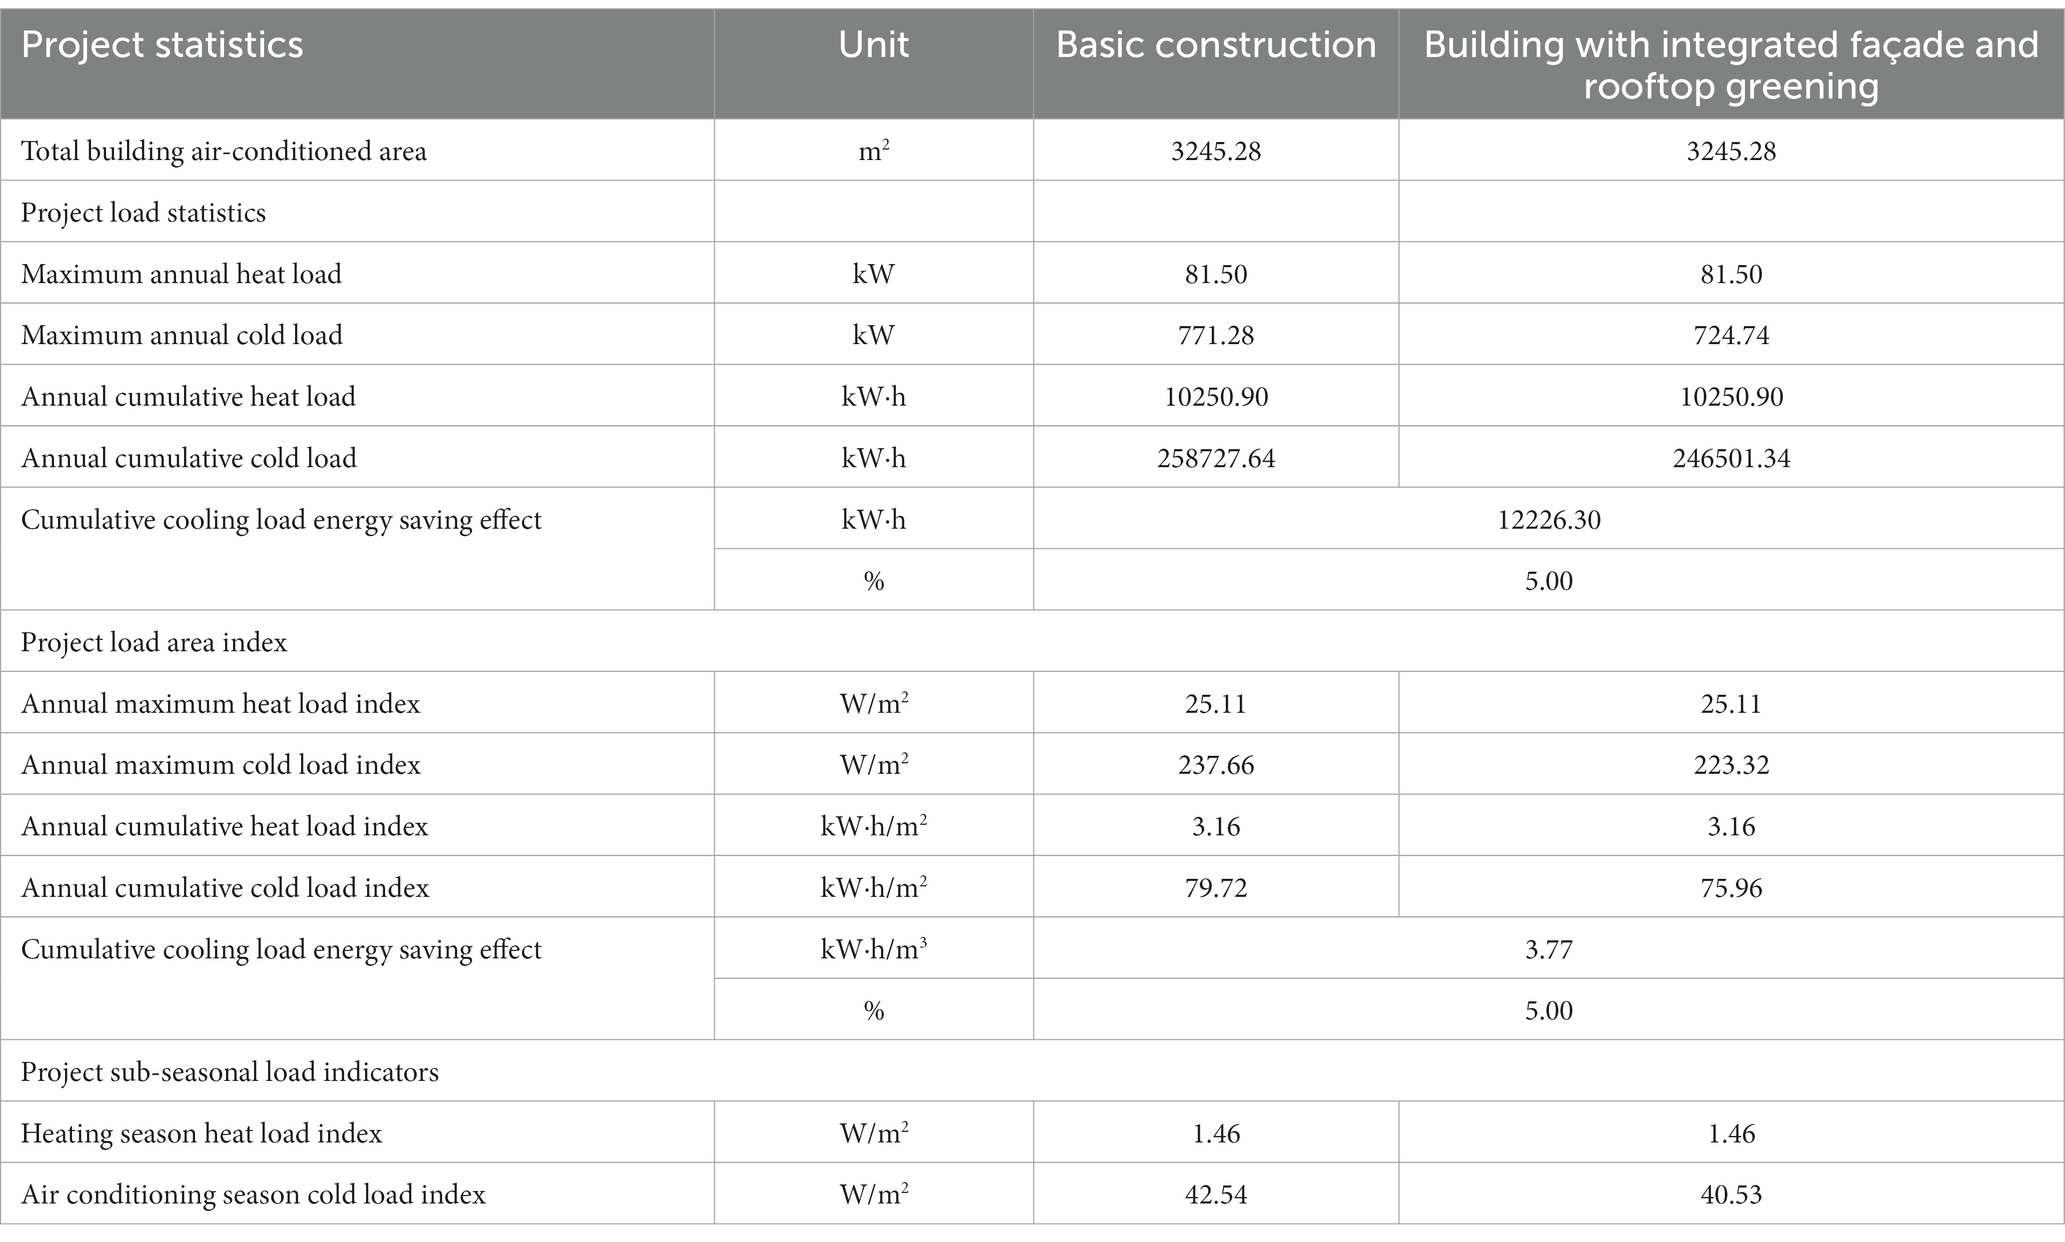
Table 3. Building load statistics.
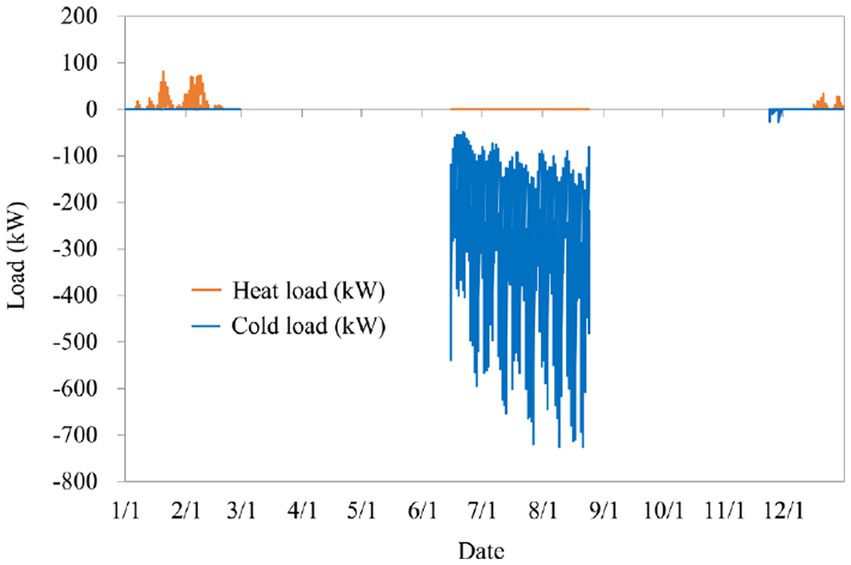
Figure 8. Year-round hour-by-hour air conditioning load.
The integrated implementation of facade and rooftop agriculture on building will reduce power consumption and vegetable transportation mileage due to its good microclimate regulatory capacity and in-situ supply capacity of fresh vegetables, thereby reducing carbon emissions. As shown in Table 3, after implementation of facade and rooftop agriculture on the building, 12,226.30 kW·h of electricity per year can be saved, equivalent to 3.77 kW·h per square meter and 509.43 kW·h per household on average. In terms of reducing carbon emissions, according to the statistics of National Development and Reform Commission of China, the average coal consumption of the thermal power units for power supply is 302.5 g standard coal/ kW·h. Based on the carbon emission factor of 0.67 recommended by the Energy Research Institute of National Development and Reform Commission of China, 0.203 kg of carbon is discharged to the air for production of each kW·h of electricity. Therefore, the simulated building can reduce 2,481.94 kg of carbon emissions per year. According to the calculation of equations (2), (3) and (4), the implementation of facade and rooftop agriculture can reduce vegetable turnover volume of 8,265,539.5 kg·km. Based on the unit carbon emission of 3.96 × 10⁻⁵ kg/(kg·km) generated by vegetable transportation (Li et al., 2022), the total reduction of carbon emissions by the reduction of vegetable transportation mileage is 327.32 kg. The total reduction of carbon emissions is 2,809.26 kg.
4.3. Cost–benefit analysis of facade and rooftop agriculture based on life cycle assessment
The meta-analysis shows that the average construction cost of rooftop agriculture in China is 247.17 RMB/m2 and the average construction cost of facade agriculture is 471.89 RMB/m2. Therefore, after deducting the subsidies provided by the government for green buildings, the total construction investment at the beginning of the life cycle is RMB 1,137,025.74 Yuan. During the life cycle, the annual benefit mainly comes from the cost reduction saved from the reduction of carbon emissions, the income from vegetable sales, the saved electricity cost and the saved transportation cost from the reduction of vegetable turnover volume. The total annual benefit is 38,826.67 yuan without consideration of inflation. The annual cost mainly includes the maintenance cost of facade and rooftop agriculture. Currently, there are few existing studies on the maintenance cost of facade agriculture. Only three data about the maintenance cost of facade agriculture were collected through meta-analysis. As the gaps between the data are too large, it is meaningless to find their average value. Therefore, the maintenance cost of facade and rooftop agriculture is supposed to be 12.92 yuan/ m2 in this study. So, the total annual cost is RMB 42,574.56 Yuan. Under the inflation rate of 2%, starting from the 5th year, the marginal benefit will be greater than the marginal cost and the initial investment starts to be recovered from then on. A total of RMB 205,813.31 Yuan can be recovered in the 40-year life cycle, resulting in a final NPV of RMB -937,712.18 Yuan for the entire project.
5. Discussion
5.1. Ecological benefits of facade and rooftop agriculture
The results of this study show that the building with facade and rooftop agriculture can save 5% of electricity per year compared with the same building without it, resulting in a total reduction of RMB10,856.95 Yuan of electricity cost and 2,903.65 kg of carbon emissions. Wong et al. (2003) simulated the energy savings of rooftop gardens in Singapore and found that the energy savings were 14.6% with a fully greened rooftop, 2.9% with 80% of the area planted with shrubs, and 3.5% with 50% of the area planted with trees. Santamouris et al. (2007) simulated the energy savings of green rooftops in Greece and found that the energy savings ranged from 6 to 49% for the whole building and 12 to 87% for the top floor. Sailor (2008) used Energyplus software to simulate the energy savings of green roofs in Houston and Chicago, and showed an energy savings of about 2%. In the case of green roofs only, the results of Wong et al. and Santamouris et al. were higher than the simulated results of this paper with the integrated implementation of green facade and rooftops. The reasons might be as follows: firstly, Singapore has a tropical rainforest climate and Greece has a Mediterranean climate, and the latitude and climate characteristics of the study areas are different. The study of Alexandria and Jones (2008) and Quaranta et al. (2021) indicated that facade and rooftop greening resulted in different indoor temperature decrease under different climatic conditions. This is one of the reasons why this study advocates the use of in-situ experiments to obtain data in the place where the simulated building is located. Secondly, the method used for building energy consumption calculation assumed that the thermal coefficients such as the heat transfer coefficient of the greening surface are constant, but the results of the in-situ experiments in this study showed that the thermal insulation effects of the greening surfaces were different greatly under different weather types and in different times. During the observation period of the experiment, the facade and rooftop agriculture usually showed strong thermal insulation during the daytime and weak thermal insulation at night. Therefore, if the thermal coefficient of the surrounding structure is assumed to be a constant value beneficial to thermal insulation or heat preservation in a certain period, the simulated energy-saving effect may have deviations. Thirdly, the activities of the residents in rooms and the ons and offs of the air conditioning (heating) system were not taken into account. The method used in the previous studies did not consider the heat generated by the activities of the people in rooms and the different equipment installed in different types of rooms (Peacock et al., 2023). The heat disturbance generated by the people and equipment in rooms are indoor heat sources, which increase the power consumption of the building. Meanwhile, the greening of the building does not have significant effect on indoor heat sources. These might be the reasons leading to a higher energy saving effect than in this study. The experimental results of the in-situ observations showed that the thermal insulation effect of the greened building was better during daytime and reached the best around noontime. However, some types of rooms, such as bedrooms, have human activities and air conditioning on mainly at night, the energy saving effect of the greened building for these rooms can not be as good as that of living rooms and the rooms where the human activities are mainly in daytime. If all the rooms in the building were defaulted to have air-conditioning turned on during daytime, the simulation results would be higher than the present value.
5.2. Economic benefits of facade and rooftop agriculture
Facade and rooftop agriculture has huge market demand and implementation space. On the one hand, with the ever growth of health and environmental awareness, the consumers have increasing demand for fresh, low-carbon footprint and more transparent food supply and closer involvement in food production (American Planning Association, 2007). On the other hand, the rooftops and facades of the buildings in cities are a huge underutilized spatial resource, developing these resources for intensive urban agriculture is expected to produce significant quantities of agricultural produce (Ackerma et al., 2011). Although the ideal market is available, facade and rooftop agriculture has not been widely promoted in practice yet. Many scholars are making feasibility studies on it separately. The costs estimated by the foreign scholars for different farming types vary significantly, but common conclusion has been derived that cost is the main factor limiting the implementation of facade and rooftop agriculture (Perini and Rosasco, 2013; Specht et al., 2014; Kim et al., 2018; Goodman and Minner, 2019; Appolloni et al., 2021; Pena et al., 2022). The analysis of the average economic efficiency of facade and rooftop agriculture in China suggests that the main obstacle hindering the implementation of urban agriculture in China is also its poor economic efficiency which needs to be improved. Kim et al. (2018) also found through a questionnaire that the public generally believes that the economic benefits were the least important driving force for implementing rooftop agriculture and that the life-cycle cost of rooftop agriculture should be reduced greatly for improving its competitiveness.
Based on this, the scholars have analyzed the causes of the high cost of facade and rooftop agriculture and proposed the way of optimizing the economic benefits. Wang (2018) believes that the reason for the high construction and maintenance costs of vertical greening in China mainly comes from the fact that vertical greening is not incorporated into the architectural engineering. As the greening engineering is usually carried out after the building is completed, the composition design and static load, etc. are subject to constraints, which prevents from formation of optimal vertical greening engineering scheme, resulting in waste of human, material and financial resources. In addition, incorporating facade and rooftop agriculture in the buildings will increase the engineering and construction cost, maintenance cost, site acquisition cost and operation cost, resulting in significant increase of construction cost of the buildings compared with normal buildings (Chen et al., 2019). There are many ways to optimize the economic benefits, such as improving the management of light soil, which is the main component of the cost, by reducing soil erosion or finding more economical alternatives for light soil, using recycled materials, increasing produce yields (Kim et al., 2018), promoting its social benefits to the public to increase the enthusiasm and recognition of the residents in participation (Specht et al., 2014). The above mentioned methods should be applied to increase the economic benefits or reduce costs in order to attract participation of more investors and groups in the project. Government subsidies also help to motivate investors. Xu C. et al. (2021) found through their studies that the construction cost of a green infrastructure project was reduced from 3.32 × 10⁶ Yuan to 8.54 × 10⁵ Yuan after the Nanjing government subsidized the project, even lower than the cost of the traditional infrastructure. It can be seen from Figure 1 that the projects of facade and rooftop greening in China are mainly concentrated in the more economically developed coastal areas. The common feature of these areas is that the amount of subsidies for such projects is higher than that of the rest of the provinces and cities. The big difference in subsidy amounts between different provinces and cities has created the uneven spatial distribution of the greening projects. In addition, urban agriculture in the U.S. is mostly managed as a non-profit program or by charitable organizations. The primary purpose of these organizations is to achieve more benefits of the communities (Goodman and Minner, 2019). The enormous social and ecological benefits brought about by urban agriculture can not be quantified precisely. Therefore, relying solely on estimation of monetary returns to decide whether the urban agriculture projects should be carried out is too much one-sided. China should make full use of its institutional features to encourage and guide the social groups and non-profit organizations in participation of the urban agriculture through policy.
5.3. Shortcomings and orientation of future research
1. This paper regards the temperature under the planting box recorded in the in-situ observation as the same as that under the large area of planting layer of the building. In fact, the thermal insulation function of a large area of planting layer may differ from that of the small planting box, thus resulting in deviations in the simulation results of energy saving potential, 2. In this paper, the air conditioning systems are considered to be in operation at a tolerable room temperature in each room. But in reality, in order to save power consumption, the residents are accustomed to sharing one air conditioner for two or more rooms, thus the simulation results of the total energy consumption of the building before and after greening are generally higher than the reality, 3. In the economic benefit analysis in this paper, the functions of building greening in mitigation of rainwater runoff and sewage filtration, as well as the increase in the value of the building itself after engineering and renovation for greening were not taken into account, which may result in the economic benefits being underestimated. The economic benefits in these two aspects can be studied in the future through in-situ observations in the actual cases, and 4. Since the studies on the maintenance cost of facade agriculture are limited, the maintenance cost of rooftop agriculture was used as its substitute in this study. In the future, detailed analyses on the maintenance cost composition should be carried out and the estimation of the maintenance costs of different projects should be conducted for achieving more reasonable results of economic benefit estimation.
6. Conclusion
In this paper, we conducted in-situ observations in Changsha city and analyzed the regulatory characteristics of facade and rooftop agriculture on urban microclimate based on the observed data. We used DeST software, meta-analysis and life cycle assessment method to analyze the ecological and economic benefits of facade and rooftop agriculture implemented on a normal home building in Changsha city and found that: the thermal insulation effect of facade and rooftop agriculture is highest in sunny days and lowest in rainy days. The effect is mainly manifested in daytime, reaching peak value at noontime. Its heat preservation function is often manifested at night. The ecological benefits such as electricity saving (12,226.30 kW·h/year) and reduction of carbon emissions (2,903.65 kg/year) are quite ideal, but the economic benefits in the 40-year life cycle are not desirable (RMB -937712.18 Yuan) which constitutes a major obstacle hindering the implementation of urban agriculture. China should actively learn from the international practical experience and encourage the individuals, collectives or non-profit organizations to participate in facade and rooftop agriculture through preferential policy and investment. The enthusiasm of the public in acceptance of and participation in facade and rooftop agriculture should be enhanced through active publicity to promote the development of urban agriculture in China.
Data availability statement
The original contributions presented in the study are included in the article/Supplementary material, further inquiries can be directed to the corresponding author.
Author contributions
YL was responsible for in-situ observation data analysis and mapping, simulating building energy consumption using DeST software, meta-analysis and economic efficiency evaluation, and completing the first draft of the thesis. EM and LL contributed to guiding the overall direction of the research and thesis revision. JL, SZ, and QZ contributed to implementing in-situ observations. All authors contributed to the article and approved the submitted version.
Funding
This study was funded by Innovation and Entrepreneurship Program for College Students of Hunan: Assessment of multifunctional benefits of urban agriculture based on in-situ observation and meta-analysis and National Natural Science Foundation of China: Agricultural land use transition and its regulation under the meta-coupling of urban food system-42101267.
Acknowledgments
The authors acknowledged the support received from School of Geographical Sciences and Key Laboratory of Process and Effect of Urban-Rural Transition, Hunan Normal University, and College of Economics and Management, Changsha University.
Conflict of interest
The authors declare that the research was conducted in the absence of any commercial or financial relationships that could be construed as a potential conflict of interest.
Publisher’s note
All claims expressed in this article are solely those of the authors and do not necessarily represent those of their affiliated organizations, or those of the publisher, the editors and the reviewers. Any product that may be evaluated in this article, or claim that may be made by its manufacturer, is not guaranteed or endorsed by the publisher.
Supplementary material
The Supplementary material for this article can be found online at: https://www.frontiersin.org/articles/10.3389/fsufs.2023.1206866/full#supplementary-material
References
Ackerma, K., Plunz, R., Conard, M., Katz, R., Dahlgren, E., and Culligan, P. (2011). The potential for urban agriculture in new York City: growing capacity, food security & green infrastructure. New York, Urban Design Lab, Columbia Univ. 2–108. doi: 10.13140/2.1.4748.7683
Alexandria, E., and Jones, P. (2008). Temperature decreases in an urban canyon due to green walls and green roofs in diverse climates. Build. Environ. 43, 480–493. doi: 10.1016/j.buildenv.2006.10.055
American Planning Association. (2007). APA policy guide on community and regional food planning. Available at: https://www.planning.org/policy/guides/adopted/food.htm
Appolloni, E., Orsini, F., Specht, K., Thomaier, S., Sanye-Mengual, E., Pennisi, G., et al. (2021). The global rise of urban rooftop agriculture: a review of worldwide cases. J. Clean. Prod. 296:126556. doi: 10.1016/j.jclepro.2021.126556
Berardi, U. (2016). The outdoor microclimate benefits and energy saving resulting from green roofs retrofits. Energ. Buildings 121, 217–229. doi: 10.1016/j.enbuild.2016.03.021
Chen, X., Shuai, C., Chen, Z., and Zhang, Y. (2019). What are the root causes hindering the implementation of green roofs in urban China? Sci. Total Environ. 654, 742–750. doi: 10.1016/j.scitotenv.2018.11.051
Coma, J., Perez, G., de Gracia, A., Bures, S., Urrestarazu, M., and Cabeza, L. F. (2017). Vertical greenery systems for energy savings in buildings: a comparative study between green walls and green facades. Build. Environ. 111, 228–237. doi: 10.1016/j.buildenv.2016.11.014
Feng, H., and Hewage, K. (2014). Lifecycle assessment of living walls: air purification and energy performance. J. Clean. Prod. 69, 91–99. doi: 10.1016/j.jclepro.2014.01.041
Goodman, W., and Minner, J. (2019). Will the urban agricultural revolution be vertical and soilless? A case study of controlled environment agriculture in new York City. Land Use Policy 83, 160–173. doi: 10.1016/j.landusepol.2018.12.038
Hoelscher, M.-T., Nehls, T., Jänicke, B., and Wessolek, G. (2016). Quantifying cooling effects of facade greening: shading, transpiration and insulation. Energ. Buildings 114, 283–290. doi: 10.1016/j.enbuild.2015.06.047
Huang, J. J., Xiao, M., Li, Y., Yan, R., Zhang, Q., Sun, Y., et al. (2022). The optimization of low impact development placement considering life cycle cost using genetic algorithm. J. Environ. Manag. 309:114700. doi: 10.1016/j.jenvman.2022.114700
Ji, F., and Hu, S. (2018). The influence of climatic factors on tourism in Changsha City. Hunan Province. Tourism Overview 6, 109–111.
Kabisch, N., Frantzeskaki, N., Pauleit, S., Naumann, S., Davis, M., Artmann, M., et al. (2016). Nature-based solutions to climate change mitigation and adaptation in urban areas: perspectives on indicators, knowledge gaps, barriers, and opportunities for action. Ecol. Soc. 21. doi: 10.5751/es-08373-210239
Kim, E., Jung, J., Hapsari, G., Kang, S., Kim, K., Yoon, S., et al. (2018). Economic and environmental sustainability and public perceptions of rooftop farm versus extensive garden. Build. Environ. 146, 206–215. doi: 10.1016/j.buildenv.2018.09.046
Li, M., Jia, N., Lenzen, M., Malik, A., Wei, L., Jin, Y., et al. (2022). Global food-miles account for nearly 20% of total food-systems emissions. Nature Food 3:445. doi: 10.1038/s43016-022-00531-w
Luo, G. (2017). Research on determination for benchmark yield of renovation project of the shantytowns. China, Jiangxi University of Science and Technology.
Niachou, A., Papakonstantinou, K., Santamouris, M., Tsangrassoulis, A., and Mihalakakou, G. (2001). Analysis of the green roof thermal properties and investigation of its energy performance. Energ. Buildings 33, 719–729. doi: 10.1016/S0378-7788(01)00062-7
Peacock, M., Fragaki, A., and Matuszewski, B. J. (2023). The impact of heat electrification on the seasonal and interannual electricity demand of Great Britain. Appl. Energy 337:120885. doi: 10.1016/j.apenergy.2023.120885
Pena, A., Rovira-Val, R., and Mendoza, J. M. F. (2022). Life cycle cost analysis of tomato production in innovative urban agriculture systems. J. Clean. Prod. 367:133037. doi: 10.1016/j.jclepro.2022.133037
Perez, G., Coma, J., Martorell, I., and Cabeza, L. F. (2014). Vertical greenery systems (VGS) for energy saving in buildings: a review. Renew. Sustain. Energy Rev. 39, 139–165. doi: 10.1016/j.rser.2014.07.055
Perini, K., and Rosasco, P. (2013). Cost-benefit analysis for green facades and living wall systems. Build. Environ. 70, 110–121. doi: 10.1016/j.buildenv.2013.08.012
Quaranta, E., Dorati, C., and Pistocchi, A. (2021). Water, energy and climate benefits of urban greening throughout Europe under different climatic scenarios. Sci. Rep. 11:12163. doi: 10.1038/s41598-021-88141-7
Sailor, D. J. (2008). A green roof model for building energy simulation programs. Energ. Buildings 40, 1466–1478. doi: 10.1016/j.enbuild.2008.02.001
Santamouris, M., Pavlou, C., Doukas, P., Mihalakakou, G., Synnefa, A., Hatzibiros, A., et al. (2007). Investigating and analysing the energy and environmental performance of an experimental green roof system installed in a nursery school building in Athens. Greece. Energy 32, 1781–1788. doi: 10.1016/j.energy.2006.11.011
Specht, K., Siebert, R., Hartmann, I., Freisinger, U. B., Sawicka, M., Werner, A., et al. (2014). Urban agriculture of the future: an overview of sustainability aspects of food production in and on buildings. Agric. Hum. Values 31, 33–51. doi: 10.1007/s10460-013-9448-4
Wang, X. (2018). Research on the application of vertical greening in landscaping. Agricu. Technol 38:230+241.
Wang, T., Seo, S., Liao, P.-C., and Fang, D. (2016). GHG emission reduction performance of state-of-the-art green buildings: review of two case studies. Renew. Sust. Energ. Rev. 56, 484–493. doi: 10.1016/j.rser.2015.11.037
Wei, L., and Hou, Y. (2023). The estimation on China's industrial marginal carbon abatement cost and industry carbon peak prediction. Eco. Theory Business Manag. 43, 63–77.
Wong, N. H., Tay, S. F., Wong, R., Ong, C. L., and Sia, A. (2003). Life cycle cost analysis of rooftop gardens in Singapore. Build. Environ. 38, 499–509. doi: 10.1016/S0360-1323(02)00131-2
Wu, X., Peng, B., and Lin, B. (2017). A dynamic life cycle carbon emission assessment on green and non-green buildings in China. Energ. Buildings 149, 272–281. doi: 10.1016/j.enbuild.2017.05.041
Xing, Q., Hao, X., Lin, Y., Tan, H., and Yang, K. (2019). Experimental investigation on the thermal performance of a vertical greening system with green roof in wet and cold climates during winter. Energ. Buildings 183, 105–117. doi: 10.1016/j.enbuild.2018.10.038
Xu, C., Liu, Z., Chen, Z., Zhu, Y., Yin, D., Leng, L., et al. (2021). Environmental and economic benefit comparison between coupled grey-green infrastructure system and traditional grey one through a life cycle perspective. Res. Conserv. Recyc. 174:105804. doi: 10.1016/j.resconrec.2021.105804
Xu, Z., Liu, D., and Yan, L. (2021). Temperature-based fire frequency analysis using machine learning: a case of Changsha China. Climate Risk Manag. 31:100276. doi: 10.1016/j.crm.2021.100276
Yuan, X., Zou, P., Zhu, J., and Wu, D. (2015). Development trend,problems and countermeasures for cold chain logistics industry in China. J. Agric. Sci. Technol. 17, 7–14. doi: 10.13304/j.nykjdb.2014.505
Keywords: in-situ observation, facade and rooftop agriculture, meta-analysis, energy-saving effect, DeST
Citation: Li Y, Ma E, Liao L, Li J, Zhu S and Zhang Q (2023) Microclimate characteristics and multi-effect analysis of facade and rooftop agriculture based on in-situ observation and meta-analysis. Front. Sustain. Food Syst. 7:1206866. doi: 10.3389/fsufs.2023.1206866
Edited by:
Zhenshan Yang, Chinese Academy of Sciences (CAS), ChinaReviewed by:
Attila Tóth, Slovak University of Agriculture, SlovakiaFanxin Meng, Beijing Normal University, China
Copyright © 2023 Li, Ma, Liao, Li, Zhu and Zhang. This is an open-access article distributed under the terms of the Creative Commons Attribution License (CC BY). The use, distribution or reproduction in other forums is permitted, provided the original author(s) and the copyright owner(s) are credited and that the original publication in this journal is cited, in accordance with accepted academic practice. No use, distribution or reproduction is permitted which does not comply with these terms.
*Correspondence: Enpu Ma, bWFlbnB1MjAxNUBzaW5hLmNvbQ==