 Ye Li1
 Yiyan Chen2*
- 1College of Economic and Social Development, Nankai University, Tianjin, China
- 2Economics Program, School of Social Sciences, Universiti Sains Malaysia, Penang, Malaysia
Introduction: Reducing carbon emissions from agriculture is essential to ensuring food security and human prosperity. As a country with approximately 20% of the global population, China has begun actively practicing the low-carbon agricultural development conception. Against the backdrop of disruptive technologies that continue to be integrated into various industries, the massive application of agricultural robots has opened the way to intelligent agriculture. This paper tries to answer whether there is some non-linear nexus between the application of agricultural robots and agricultural carbon emissions in China. As an essential tool for carbon emission reduction in China, does environmental regulation moderate the nexus between agricultural robot applications and agricultural carbon emissions? If so, how does this effect manifest itself?
Methods: This work takes China as an example by collecting macro-regional panel data from 30 provinces from 2006 to 2019. The environmental Kuznets curve theory is extended to agricultural carbon emissions, and we carried out empirical tests utilizing the panel fixed effects model and the moderating effects model.
Results: This study verifies the inverted U-shaped nexus between agricultural robotics applications and agricultural carbon emissions in Chinese provinces, i.e., the agricultural carbon emissions (ACE)-Kuznets curve holds. The higher the level of formal environmental regulation, the larger the peak of the ACE-Kuznets curve and the more the inflection point is pushed back. The higher the level of informal environmental regulation, the lower the peak of the ACE-Kuznets curve and the later the inflection point.
Discussion: The findings in this paper represent the first exploration of the environmental Kuznets curve in agricultural carbon emissions. It is noteworthy that the moderating effect of formal environmental regulation does not lower the peak of the curve as we expect. This appearance is attributed to the reality that China is still in a phase of rising agricultural carbon emissions, which is exacerbated by the overlapping positive effects of agricultural robotics applications and formal environmental regulations. Informal environmental regulation is more effective than formal environmental regulation in reducing agricultural carbon emissions at this stage.
1 Introduction
Since 1970, agriculture has been responsible for around a quarter of global greenhouse gas emissions (Smith et al., 2014; Bennetzen et al., 2016), and at one point this share reached a third (Gilbert, 2012). In the long run, agricultural carbon emissions (ACE), such as black carbon from straw burning, impact the quantity and quality of cereal foods (Gupta, 2014). ACE are one of the most important influencing factors that cause harm to sustainable agricultural development (Koondhar et al., 2021). Whereas, reducing ACE can effectively guarantee the food system’s sustainability, thus ensuring human beings’ basic survival and sustainable development (Singh and Khanna, 2021; Costa et al., 2022; Opoku et al., 2022) China has about 21.5% of the global population size, but only 7% of the global arable land, and its arable land continues to shrink (Greenwood, 2022). Therefore, to cope with food security, China needs to achieve agricultural carbon reduction (Fu et al., 2022).
At present, Chinese agriculture has begun to step into the stage of high-quality evolution with low carbon as the keynote, but an unpromising phenomenon still exists (Chen and Xu, 2023). Due to the limitations of objective conditions such as population size and arable land area, China’s agricultural carbon emission reduction must rely on the input of disruptive technologies to take advantage of the technological innovation effect to drive the agricultural green upgrading and transformation under the premise of guaranteeing food security. Digital technologies, including big data, blockchain, digital twin, artificial intelligence (AI), and the Internet of Things (IoT), can attract an influx of high-level production factors, including high-end talents, cutting-edge knowledge, advanced technological processes and production procedures, thereby optimizing the factor structure of conventional agriculture and expanding the scale and quality of agricultural technological innovation (Klerkx et al., 2019; Bolfe et al., 2020), and ultimately promote agricultural carbon emission reduction (Ali et al., 2021; Luo et al., 2023). Robots are loaded with AI (Rajan and Saffiotti, 2017), blockchain (Aditya et al., 2021), big data (Zhang, 2021), 5G (Sophocleous et al., 2022), digital twins (Hoebert et al., 2019) and a host of other digital technologies as physical carriers (Sodikjanov and Khayitboyev, 2023). Its unique potential for cutting carbon emissions. Robots can contribute significantly to reducing carbon emissions in electricity, gas, manufacturing, or agriculture (Li et al., 2022). The application of robots in agricultural production could ultimately reduce ACE by improving nitrogen utilization, accelerating plant breeding, promoting sustainable agricultural models, and reducing food waste (Pearson et al., 2022). However, to date, policies introduced in many countries to “promote the adoption of robots” still lack rigorous environmental assessments (Dusík et al., 2018), which has led to a heated debate in academia on how robots affect carbon emissions. Agricultural machinery, including harvesters, vans, tractors, trucks, etc., are used to perform various agrarian tasks and processes (Malik and Kohli, 2020). However, due to deficient maintenance and lack of strict environmental regulation (ER) on these fossil fuel-power agricultural machinery, their increasing emission levels have led to pollution, environmental degradation, and significant carbon emissions (Zhang et al., 2017).
Research addressing the nexus between agricultural robotics and ACE is still in its infancy and currently focuses on the linear relationship between them (Oliveira et al., 2021). The relationship between other disruptive technologies, such as ICTs, or new economic models under the impact of disruptive techniques and carbon emissions has been discussed in greater depth by scholars (Melnyk et al., 2019). ICTs and the digital economy all have an inverted U-shaped nexus with carbon emissions (Higón et al., 2017; Sorrell, 2020; Bai et al., 2023; Lei et al., 2023; Li et al., 2023; Zheng et al., 2023). Can these findings be extended to robotic applications in agriculture? i.e., is there some nonlinear relationship, such as an inverted U-shaped relationship, between agricultural robotics applications (ARA) and ACE? To solve this hesitation, this paper takes the Chinese province as the research object and “dissects” the nonlinear nexus between the two variables.
In addition, ER has consistently been recognized as one of the crucial factors effecting carbon emissions (Dietzenbacher and Mukhopadhyay, 2007; Van der Ploeg and Withagen, 2015; Najm, 2019; Ouyang et al., 2019; Danish Ulucak et al., 2020; Neves et al., 2020), and is no exception for ACE (Jiang et al., 2018; Tang et al., 2019; Laborde et al., 2021; Du et al., 2023). Scholars’ cognition of ER is evolving and deepening. Initially, the direct intervention, allocation and utilization of environmental resources by the government through administrative orders for the environment protection were regarded as direct regulation. With the participation and growth of market forces, the types of ER have become more and more abundant, including governmental command-and-control ER, market-incentive ER, and voluntary agreement ER, among others. Subsequently, the introduction of informal regulation (Pargal and Wheeler, 1996) expanded the meaning of ER. China is a vast country with various types of ER, combining statutory, local, informal, and other means. China’s emphasis on ER has deepened significantly over the past few years (Green and Stern, 2017; Kostka and Nahm, 2017), e.g., the Chinese government has strengthened the formulation and improvement of environmental laws and regulations (Fang et al., 2021). Environmental protection departments’ supervisory and enforcement capabilities have continued to improve, and investigations and prosecutions of environmental violations have become timelier and more effective (Hu et al., 2023). Chinese society’s concern for environmental issues has gradually increased, and the public’s willingness to partake in environmental protection actions has increased (Flatø, 2020). Therefore, this work tries to reply another query: How does the overlay of formal and informal ER and agricultural robotics applications act on ACE in China in the context of widespread regional ER? And how does the overlap between the two styles of ER and ARA differ? The practical implications of answering these questions are that they can help improve China’s agricultural management capacity to comply food security and sustainable agrarian development. Theoretically, placing agricultural robotics, ER, and ACE under the same research framework is essential, thus expanding the study of the interrelationships between modern agricultural production and sustainable agricultural development.
This work complements the existing corpus in the next three ways. First, it extends the findings of the traditional environmental Kuznets curve (EKC) to the field of ACE. It constructs a theoretical framework for the nonlinear nexus between ARA and ACE. Second, this paper takes the Chinese provincial area as the research object and verifies the inverted U-shaped nexus between ARA and ACE for the first time. Third, this paper incorporates formal and informal ER into the research framework and analyzes their direct effects on ACE and their moderating effects on the nexus between ARA and ACE, which, according to our knowledge, is a brand-new attempt and exploration.
2 Theory and hypotheses
2.1 Relationship between agricultural robotics applications and agricultural carbon emissions
There is no consensus among scholars on exactly how the use of agricultural robots will affect ACE. One view is that using robots increases agrarian green total factor productivity in the first place, suppressing agricultural carbon intensity (Lin and Li, 2023). For example, robotic tractors fitted with hybrid energy systems for weeding and pest control can reduce emissions by 50%, i.e., reducing substances emissions such as carbon monoxide, carbondioxide, and nitrogen oxides (Gonzalez-de-Soto et al., 2016). Another view is that although the wave of agricultural automation has produced many agricultural robots, diesel-powered robots, which use diesel as an energy source, are the mainstay in all areas of agriculture (Bručienė et al., 2021; Niu et al., 2022; Jiang et al., 2023). The current widespread adoption of robots in agriculture still carries the risk of increasing carbon emissions, as solar- and electric-powered agricultural robots have not yet been able to fully replace those using traditional fossil fuels. Current research has showed solicitude for discussing the linear effects of ARA on ACE.
Only constructing a linear regression model to analyze the effect of ARA on ACE and ignoring the nonlinear relationship between the two can lead to the negative or positive effects being ignored, making the research conclusions unable to reveal the actual results (Wang et al., 2023a). This study leads into the idea of the EKC and constructs the influence mechanism of the nonlinear relationship between ARA and ACE based on scale, structure, and technology effects (Wang et al., 2023b). Overall, this work concludes that as ARA increase, ACE will show an inverted U-shaped tendency of increasing and then decreasing. The ARA-ACE theoretical link is as follows.
For one thing, when ARA starts to increase from a lower level, the scale effect causes the application of agricultural robots to change in the same direction as ACE. Therefore, It exhibits an upward movement on the curve’s left side. First, ARA expand agricultural energy demand. Robotics, as a digital technology, has a clear dependence on electricity. With the popularization of ARA, agricultural electricity consumption will continue to rise (Song et al., 2023). China’s electricity production currently relies on coal-fired power generation (Yang et al., 2022). To meet the electricity requirement insufficiency created by the ARA rollout and to guarantee electricity supply, the high-carbon energy sources consumption will increase, inevitably leading to more ACE (Böhringer and Rivers, 2021). In addition, ARA will scale up agricultural production. The application of digital technology-based agricultural robots can transform traditional agricultural production methods and automate agriculture (Oliveira et al., 2021), which leads to extensive labor force replacements and significant increases in agricultural productivity. This advantage drives the scaling up of agriculture, i.e., more agricultural products can be produced when the production time remains the same as in the traditional way (Bechar and Vigneault, 2016, 2017). Increasing agricultural production consumes more resources and energy, which subsequently increases yield-based ACE (van Loon et al., 2019; Lamb et al., 2021). At this stage, since the level of ARA is still relatively limited, the decrease in ACE due to technological effects is not yet able to entirely neutralize the increase in ACE due to scale effects.
On the other hand, when ARA grows to a certain level and continues to grow, the technology effect and structural effect will lead to the application of agricultural robots and ACE reverse change, so it shows the characteristics of the right side of the curve down rise. First, ARA can improve the agrarian production efficiency. ARA will promote the realization of agrarian production automation and intelligence. For example, ARA can realize precise fertilizer application and irrigation (Oliveira et al., 2021), reduce resource waste and environmental pollution, and promote the agrarian development in the direction of being more environmentally friendly and sustainable. In addition, ARA can optimize the structure of agricultural production. Agricultural robots, equipped with advanced sensors and data analysis technologies, can monitor multiple factors such as soil, weather, and plant growth in real-time (Bručienė et al., 2021; Niu et al., 2022). Through the intelligent decision support system, farmers can make production plans more scientifically, select suitable crop varieties, and optimize the production structure to adapt to local soil, climate conditions, and market demand to reduce resource waste and environmental pollution.
In short, this work argues that the effect of ARA on ACE has a non-linear trend. First, the scale effect will dominate. Then, the other two effects dominate, thus forming an ACE-Kuznets curve (KC) shaped like an EKC. Based on this analysis, hypothesis 1 is proposed:
H1: The effect of ARA on ACE is characterized by an inverted U-shape, i.e., ACE initially increases with the increase in the application of agricultural robots and then gradually decreases after reaching the peak point.
2.2 Impact of environmental regulations on the ACE-Kuznets curve
ER is a prerequisite for the formation of the EKC (Wang et al., 2022), which is particularly evident in developed countries (Zhang et al., 2019) such as the United States (Pata, 2021), the United Kingdom (Yilanci et al., 2023), France (Ma et al., 2021), Germany (Pata et al., 2023) and Italy (Kalisvaart et al., 2023). This phenomenon may be because developed countries have more robust legal systems regarding environmental protection (Song et al., 2020). In addition to promoting the formation of the EKC, ER is also one factor that influences the shape of the EKC. Scholars deemed that if appropriate environmental policies are implemented, a horizontal path can be found, and even the inflection point can be reached earlier (Munasinghe, 1995; Dai et al., 2022). In terms of the intensity of ER, low-intensity ER can make the EKC flatter and the position of the inflection point lower. In contrast, high-intensity ER can make the inflection point of the EKC more advanced (more advanced compared to low-intensity), the position of the inflection point higher, and the shape of the curve steeper (Yin et al., 2015). After going through the experience of covering EKC in several countries, Dasgupta et al. (2002) found that the number of EKC thresholds based on a sample of developing countries is lower than that of developed countries. They suggested that ER in developing countries may be one of the most considerable grounds for this trend. Not coincidentally, Blackman et al. (2006) reached similar conclusions on environmental issues such as climate change, air quality, waste management, land degradation, and natural disasters. Zhang et al. (2009) used carbon dioxide, sulfur dioxide, industrial smog, and solid waste as indicators of environmental quality. They found that stringent and systematic ER can change the EKC pattern and its inflection point. These effects show the unique role of ER for EKC.
In addition, the causes of EKC formation can be decomposed into scale, structural, and technological effects (Grossman and Krueger, 1991). ER can promote industrial structure upgrading to enhance the structural effect, and industrial structure upgrading can further promote technological innovation to enhance the technical effect (Wen and Dai, 2021). ER can also increase total factor productivity (Peng et al., 2021), which is conducive to expanding production scale under the condition of ER.
In addition to formal environmental regulation (FER), the effects of informal environmental regulation (IER), i.e., individuals’ environmental thoughts, concepts, awareness, attitudes, and perceptions of environmental protection, become more and more obvious (Whitburn et al., 2019; Torres et al., 2020; Peter et al., 2021; Smith, 2021; Kousar et al., 2022).
However, the current study does not address the impact of ER on EKC in agriculture. Does ER have a similar effect on the shape of the ACE-KC? Can ER positively impact the agrarian low-carbon development in China? Based on the above discussion, hypothesis 2 is proposed:
H2: ER (including FER and IER) changes the shape of the ACE-KC, and higher levels of regulation bring the curve’s inflection point forward.
In conclusion, based on the EKC theory, we hypothesize an inverted U-shaped nexus between ARA and ACE and that the two moderating variables, formal and informal ER, moderated the relationship simultaneously. Therefore, the following conceptual model is developed to reflect these influences (see Figure 1).
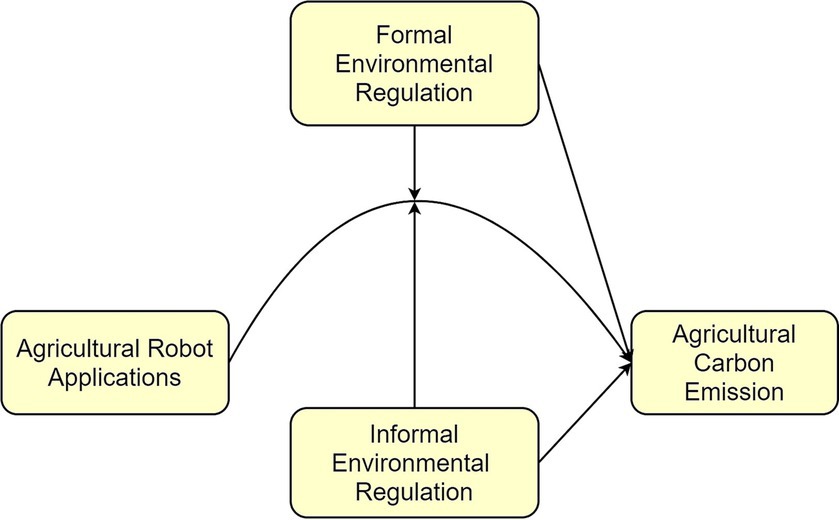
Figure 1. Conceptual model.
3 Materials and methods
3.1 Variable selection
3.1.1 Explained variables: agricultural carbon emissions (ACE)
This study combines practical experience in production and relevant research results. Also, it takes into account that the decarbonization of agriculture mainly manifests itself in the reduction of inputs of high-carbon agricultural materials and high-carbon agricultural production activities, and concludes that the carbon emissions from agriculture mainly originate from the following aspects: (1) direct or indirect carbon emissions from the production and utilize of fertilizers, pesticides, and agricultural films (Long and Tang, 2021); (2) carbon emissions from the direct ordiesel fuel’s indirect consumption by agrarian machinery (Mantoam et al., 2020); (3) carbon emissions from the use of electricity in irrigation (McCarthy et al., 2020); (4) carbon emissions from the destruction of soil organic carbon pools during agricultural ploughing, i.e., organic carbon loss (Mukumbuta and Hatano, 2020). Accordingly, this study mainly examines the carbon emissions directly or indirectly caused by six carbon sources touched upon the agricultural production procedure, such as fertilizers, pesticides, agricultural films, diesel fuel, irrigation, and ploughing, and adopts the IPCC Carbon Emission Coefficient Method to estimate the ACE. The estimation method for ACE is shown in Equation (1).
Where ACE is the total amount of ACE, ACEi is the amount of carbon emissions from each carbon source, Ti is the amount of each carbon source, and δi is the emission coefficient of the carbon source (In Table 1, there are agricultural carbon emission sources and emission coefficients). Fertilizer, pesticide, agricultural film, diesel fuel, irrigation, and ploughing are calculated using the actual amount of use, irrigated area, and crops sown area in that year, respectively.
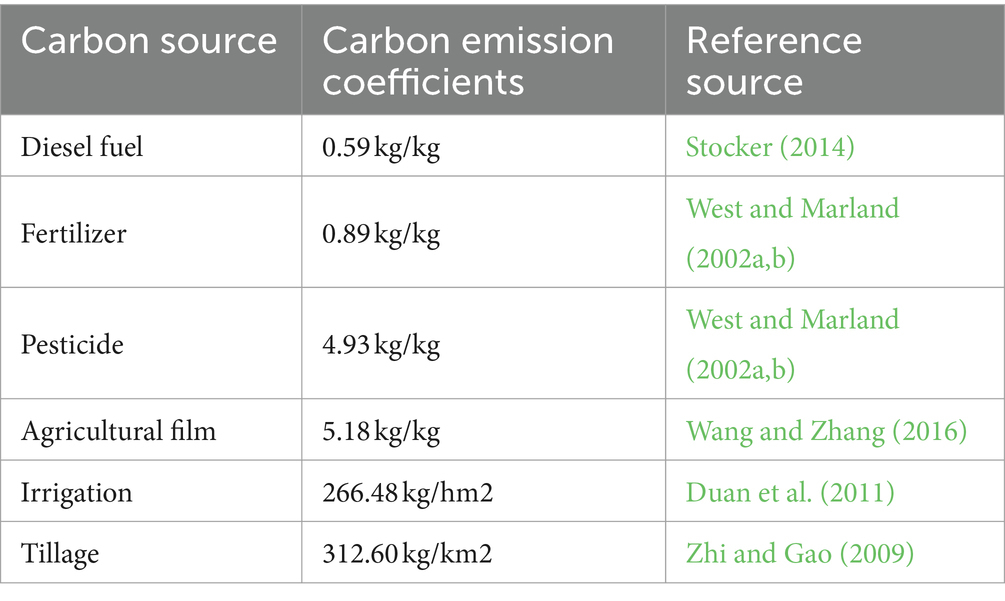
Table 1. Agricultural carbon emission sources and emission coefficients.
3.1.2 Explanatory variable: agricultural robot installations (ARI)
This paper uses the amount of agricultural robots installed as a proxy variable for ARA. Referring to the practices of existing studies (Cheng et al., 2019; Acemoglu and Restrepo, 2020), this study uses the Bartik instrumental variables method to estimate the installation of agricultural robots at the regional level. The robot stock data provided by the International Federation of Robotics (IFR) is at the country-industry level, and its industry classification standards are inconsistent with those of China. This work draws on Yan et al. (2020) to group and organize relevant industries and use the food and beverage industry as a proxy for agriculture. The formula for measuring the number of agricultural robots installed at the regional level is shown in Equation (2).
where Lit is the number of people employed in the food and beverage industry in region i in year t; ARIt is the national stock of robots in the food and beverage industry in year t; and Lt is the number of people employed in the national food and beverage industry in year t. The larger the value of ARI, the higher the level of application of agricultural robots.
3.1.3 Moderator variables
In this paper, ER is categorized into formal and informal ER. First, this work uses the amount of regional environmental laws as a proxy variable for FER (Yu and Wang, 2021). In addition, this paper draws on the methodology of Pargal and Wheeler (1996), which selects a range of indicators such as income level, educational attainment, population density, and age structure to synthesize a measure of the intensity of informal regulation in each region. Specific indicators are explained as follows: (1) Income level. The higher the income level, the stronger the public demand for a high-quality living environment. Compared with poorer areas, high-income areas are more concerned about the impact of environmental pollution (Nahar et al., 2023). In this paper, the average salary of urban workers is used to measure the income level of each region. (2) Education level. The higher the education level, the more intense the environmental protection awareness and the higher the degree of public concern for environmental quality (Al-Shidi et al., 2021). In this paper, the proportion of employed people with a tertiary education level or above in each region is chosen as an indicator to portray the more significant influence of higher education levels in informal regulation. (3) Population density. Higher population density means that the number of people affected by the negative externalities of environmental pollution is higher, and the number of people involved in informal regulation is also higher (Muktiwibowo, 2018). In this paper, the density of the resident population is selected to measure the population density of each region. (4) Age structure. Provinces with a high proportion of young people are more concerned about pollution and have a higher level of participation in environmental non-governmental organizations (NGOs) (Bi et al., 2010; Yapici et al., 2017). This paper chooses the proportion of the population under 15 years old as the age structure variable. We use the entropy weight method to calculate the final comprehensive index.
3.1.4 Control variables
Referring to existing research (Rehman et al., 2019; He et al., 2021; Liu et al., 2021; Xu et al., 2023), this article chooses the intensity of financial support for agriculture (X1), rural electricity consumption (X2), total sown area of crops (X3), the total power of agricultural machinery (X4), agricultural disaster area (X5) and agricultural industry structure (X6) as control variables. Among them, the intensity of financial support for agriculture is measured by the amount of agriculture-related expenditure as a proportion of financial expenditure. The structure of the agricultural industry is measured by the value-added of primary industry/gross regional product.
3.2 Data sources
This work takes 30 provincial administrative regions in China (excluding Tibet, Hong Kong, Macao, and Taiwan region) as the study area, with a sample period of 2006–2019 (given the data availability). The raw data for measuring the ARI come from reports published by the IFR and the China Labor Statistics Yearbook. The remaining variables are from the National Bureau of Statistics of China, China Statistical Yearbook, CEIdata database, China Rural Statistical Yearbook, and the China Three Rural Areas (agriculture, rural areas, and peasants) Research Database. Table 2 presents the results of descriptive statistics for each variable.
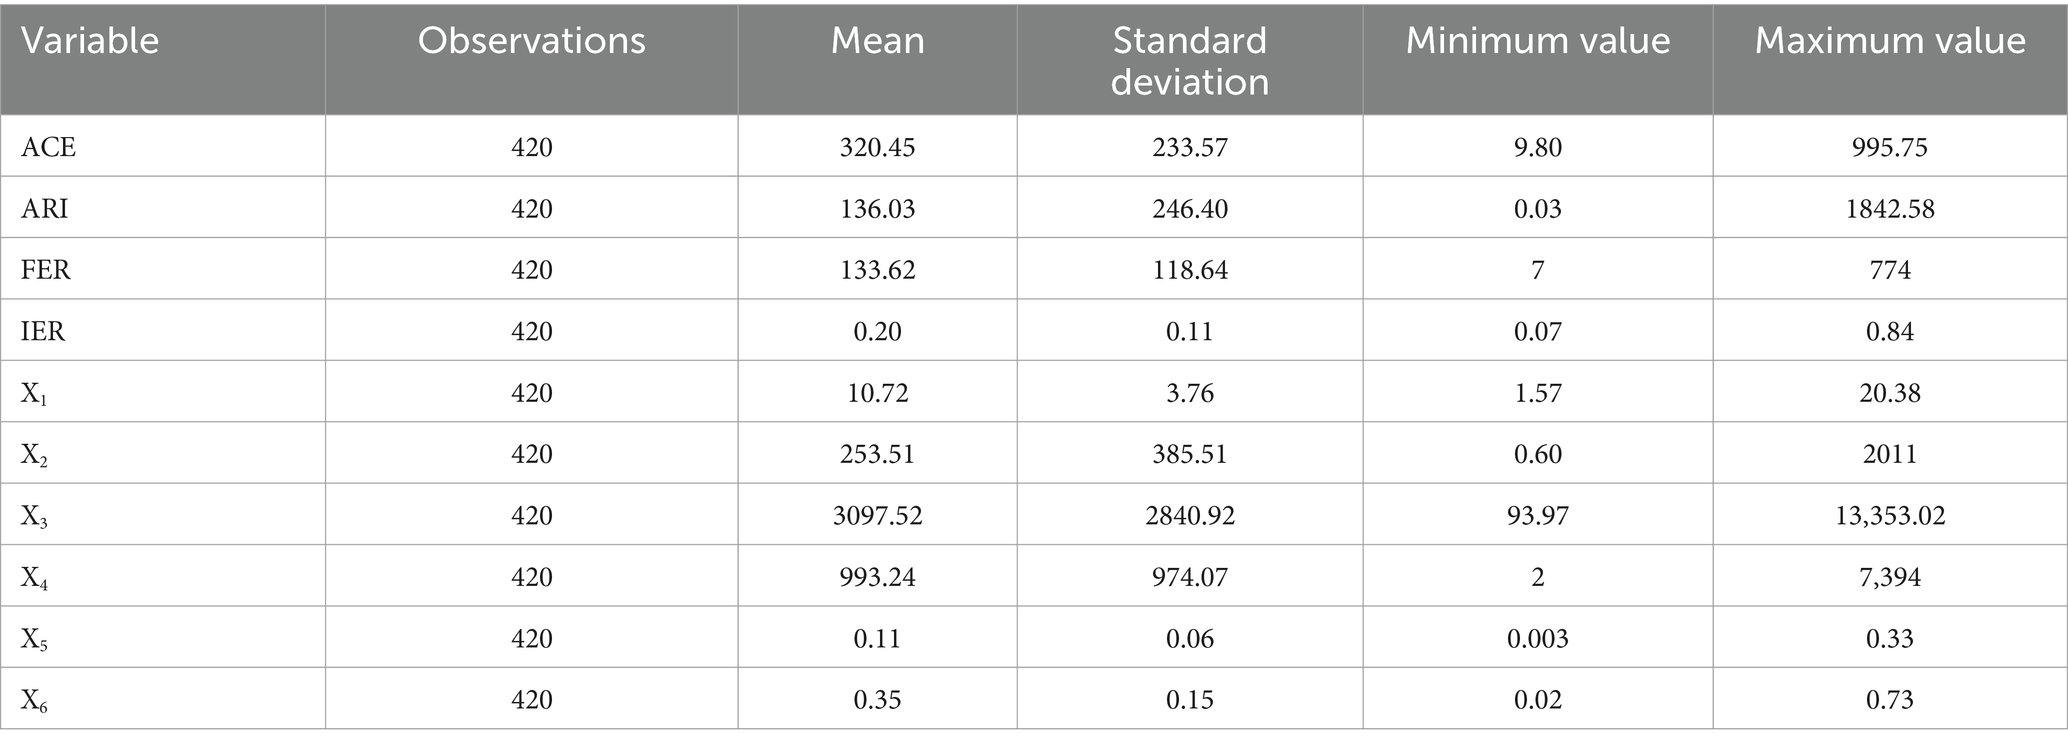
Table 2. Descriptive statistics of variables.
3.3 Model and estimation
Based on the theoretical hypotheses of Section 2 and the variable selection of Section 3.1, this study first establishes a benchmark regression model to test the inverted U-shaped relationship between ARI and ACE, namely the ACE-KC hypothesis. The benchmark regression model setup is as follows:
Following this, to test the moderating effect of FER and IER on the inverted U-shaped relationship between ARI and ACE, this study adds the interaction term of FER (IER) with ARI and the interaction term of FER (IER) with ARI2 to Equation (3). The constructed moderating effect model is as follows:
In Equations (3, 4), subscripts i and t denote province and year, respectively; Z is a matrix of control variables; is a constant term; denotes the parameter to be estimated.denotes individual fixed effects, which control the inherent characteristics of provinces that do not change over time, and is the error term. In addition, ACE, ARI, and control variables are logarithmized before empirical analysis to reduce heteroskedasticity and non-stationarity.
We estimate Equations (3, 4) using fixed-effects (within) regression. The selection of the estimation method is accomplished in two steps. In the first step, a choice between pooled and random effects regression is made. The p-value of the Breusch and Pagan Lagrange Multiplier (BP-LM) test rejects the null hypothesis. There is evidence of substantial random effect. Therefore, we run a random effects model. In the second step, the Hausman test is utilized to select a fixed effects or random effects model. This paper uses robust Hausman with looser assumptions to conduct the test. We use fixed effects since the p-value is significant (p < 0.05).
4 Results
4.1 The impact of agricultural robot installation on agricultural carbon emissions
In this section, we make a preliminary judgment on the relationship between ARI and ACE to verify their nonlinear relationship. Columns (1)–(2) of Table 3 show the results of the direct impact of ARI on ACE. The coefficient of the linear term of ARI is 0.0738 (p < 0.01), and the coefficient of the quadratic term is −0.0048 (p < 0.01) when only the primary term of ARI, the secondary term, and the rest of the control variables are included. With the inclusion of the FER and IER variables, for the panel fixed-effects model with both individual (province) and time effects, the coefficient of the linear term of ARI is 0.0694 (p < 0.01), and the coefficient of the quadratic term is −0.0041 (p < 0.01). And they all pass the correlation significance test. Therefore, it can be inferred that ARI and ACE show an inverted U-shaped curve relationship. This result indicates that hypothesis 1 has been verified.
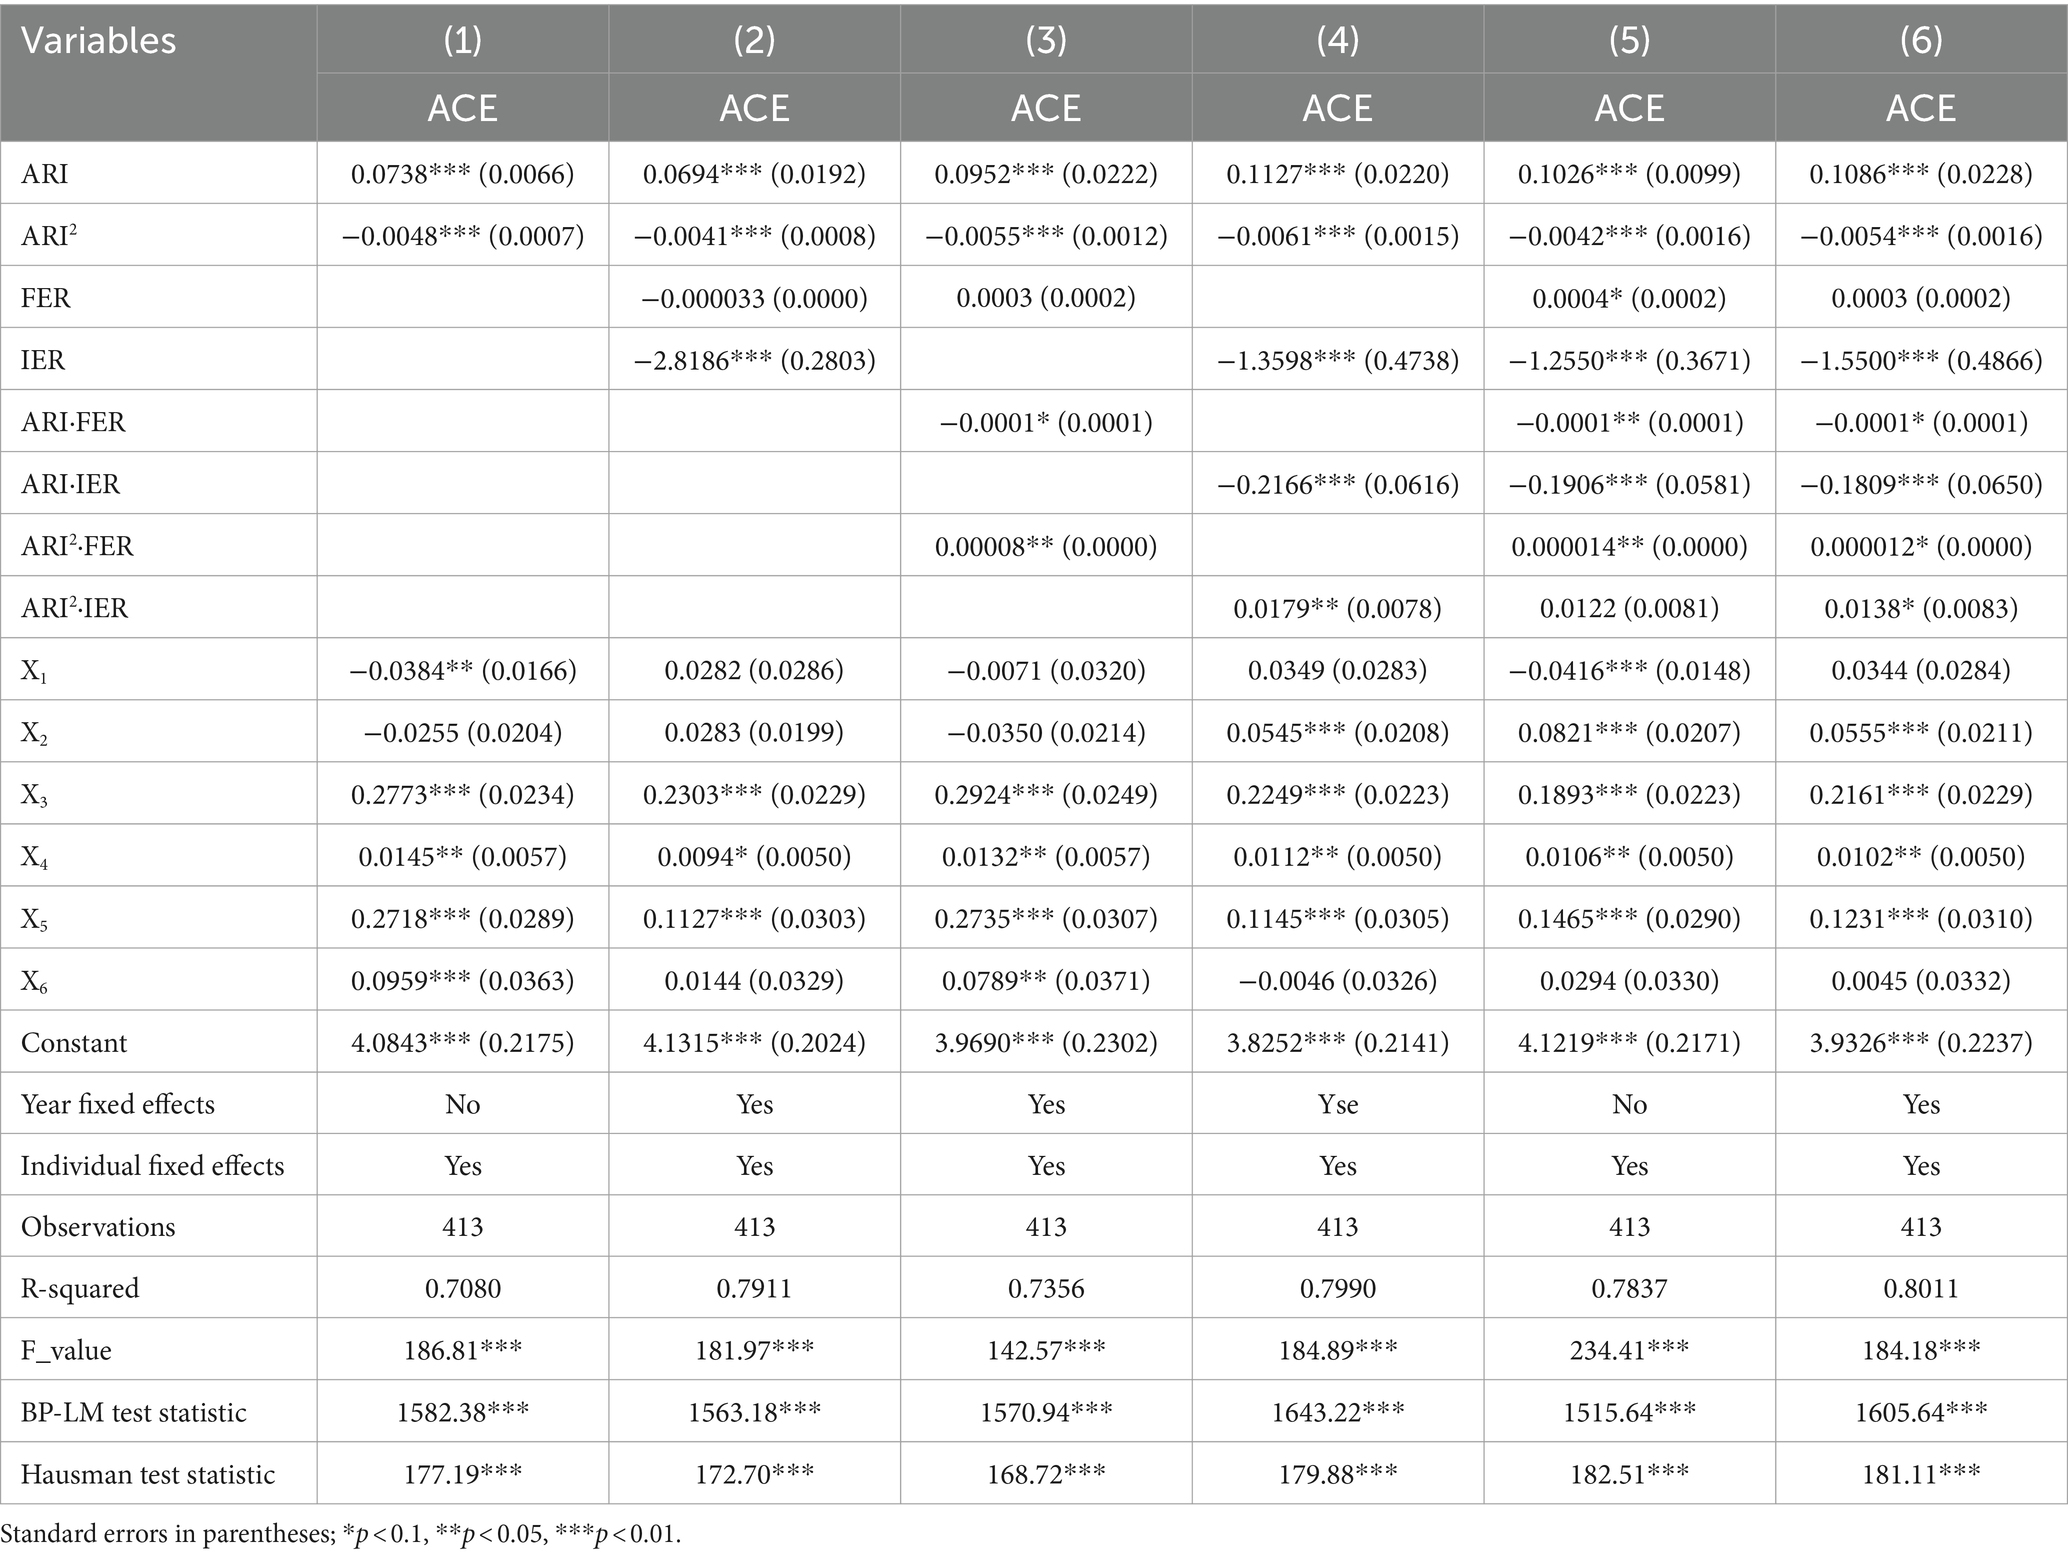
Table 3. Empirical results on direct and moderating effects.
A possible explanation for this result is that in the early stages of introducing agricultural robotics, the amount of agricultural robots installed may be relatively low due to the time required for the public to accept and absorb new technologies. However, the demand for agricultural development will continue to increase as society develops, and traditional agriculture is mainly dependent on fossil fuels and resources (Rosati et al., 2021; Sumberg and Giller, 2022), which may bring about a continued rise in ACE. However, as the amount of agricultural robots continues to increase, on the one hand, the automation of agrarian production increases, reducing the need for human labor, and how agriculture is practiced is likely to change during this phase (Marinoudi et al., 2019; Lowenberg-DeBoer et al., 2020). For example, the delicate management of agriculture and the reduction of pesticide and fertilizer use. For one thing, the greater the number of agrarian robots, the lower the cost of utilizing clean energy to power the robots due to scale effects. Therefore, as agricultural robots gradually become more common, the energy source of the robots will also use more clean energy. Both may lead to a gradual decline in ACE during this period. In addition, among the control variables, X3, X4, and X5 always have significant positive effects on ACE, and the rest of the control variables do not have consistent effects on ACE in different models.
4.2 The impact of the interaction between the number of agricultural robots installed and environmental regulations on agricultural carbon emissions
The estimation result of adding the interaction terms ARI⸱FER and ARI2⸱FER is shown in column (3) of Table 3. In the individual-time fixed-effects model, the coefficient of FER is 0.0003; The coefficient of the interaction term of FER with the linear term of ARI is −0.0001 (p < 0.1); The coefficient of the interaction term of FER with the quadratic term of ARI is 0.00008 (p < 0.05). The estimation result of adding the interaction terms ARI⸱IER and ARI2⸱IER is shown in columns (4) of Table 3. In the individual-time fixed-effects model, the coefficient of IER is −1.3598 (p < 0.01); The coefficient of the interaction term of IER with the linear term of ARI is −0.2166 (p < 0.01); The coefficient of the interaction term of IER with the quadratic term of ARI is 0.0179 (p < 0.05). These results indicate that FER and IER both have independent significant moderating effect on the ACE-KC.
The estimation results of adding the interaction terms ARI⸱FER, ARI2⸱FER, ARI⸱IER, and ARI2⸱IER are shown in columns (5) and (6) of Table 3. The inverted U-shaped nexus between ARI and ACE still holds, suggesting the relationship is robust. The coefficients on FER are 0.0004 (p < 0.1) in the individual fixed-effects model and 0.0003 in the individual-time fixed-effects model. This result suggests that FER does not have a significant inhibitory effect on ACE. The coefficients of the interaction term of FER with the linear term of ARI are −0.0001 (p < 0.05) in the individual fixed-effects model and − 0.0001 (p < 0.1) in the individual-time fixed-effects model; the coefficients of the interaction term of FER with the quadratic term of ARI are 0.000014 (p < 0.05) in the individual fixed-effects model and 0.000012 (p < 0.1) in the individual-time fixed effects model. This result indicates that FER has a significant moderating effect on the ACE-KC. The coefficients for IER are −1.2550 (p < 0.01) in the individual fixed-effects model and − 1.5500 (p < 0.01) in the individual-time fixed-effects model. This result indicates that IER has a significant inhibitory effect on ACE. The coefficients of the interaction term of IER with the liner term of ARI are −0.1906 (p < 0.01) in the individual fixed-effects model and − 0.1809 (p < 0.01) in the individual-time fixed-effects model; the coefficients of the interaction term of IER with the quadratic term of ARI are 0.0122 in the individual fixed-effects model and 0.0138 (p < 0.1) in the individual-time fixed-effects model. This result suggests that IER has the same significant moderating effect on the ACE-KC.
At this point, hypothesis 2 is halfway confirmed, i.e., ER (both formal and informal ER) changes the shape of the ACE-KC, and exactly how the shape changes will be discussed in Section 4.3. In addition, the control variables X2, X3, X4, and X5 have significant positive effects on ACE, while the rest have insignificant effects on ACE.
4.3 Robustness test and endogeneity test
4.3.1 Robustness test
To ensure the reliability of the above conclusions, we draw on the practices of existing studies (Liu P. et al., 2024) and further conduct robustness tests on the benchmark regression model and the moderating effects model. The specific approach is as follows: We use the first-order lag terms of ARI, FER, and IER as new variables to re-estimate each model in Table 3, respectively. The results are displayed in Table 4. The results of the robustness test show that the direction and significance of the coefficients in the re-estimate model and the original model remain the same, indicating that the empirical findings of this study are robust.
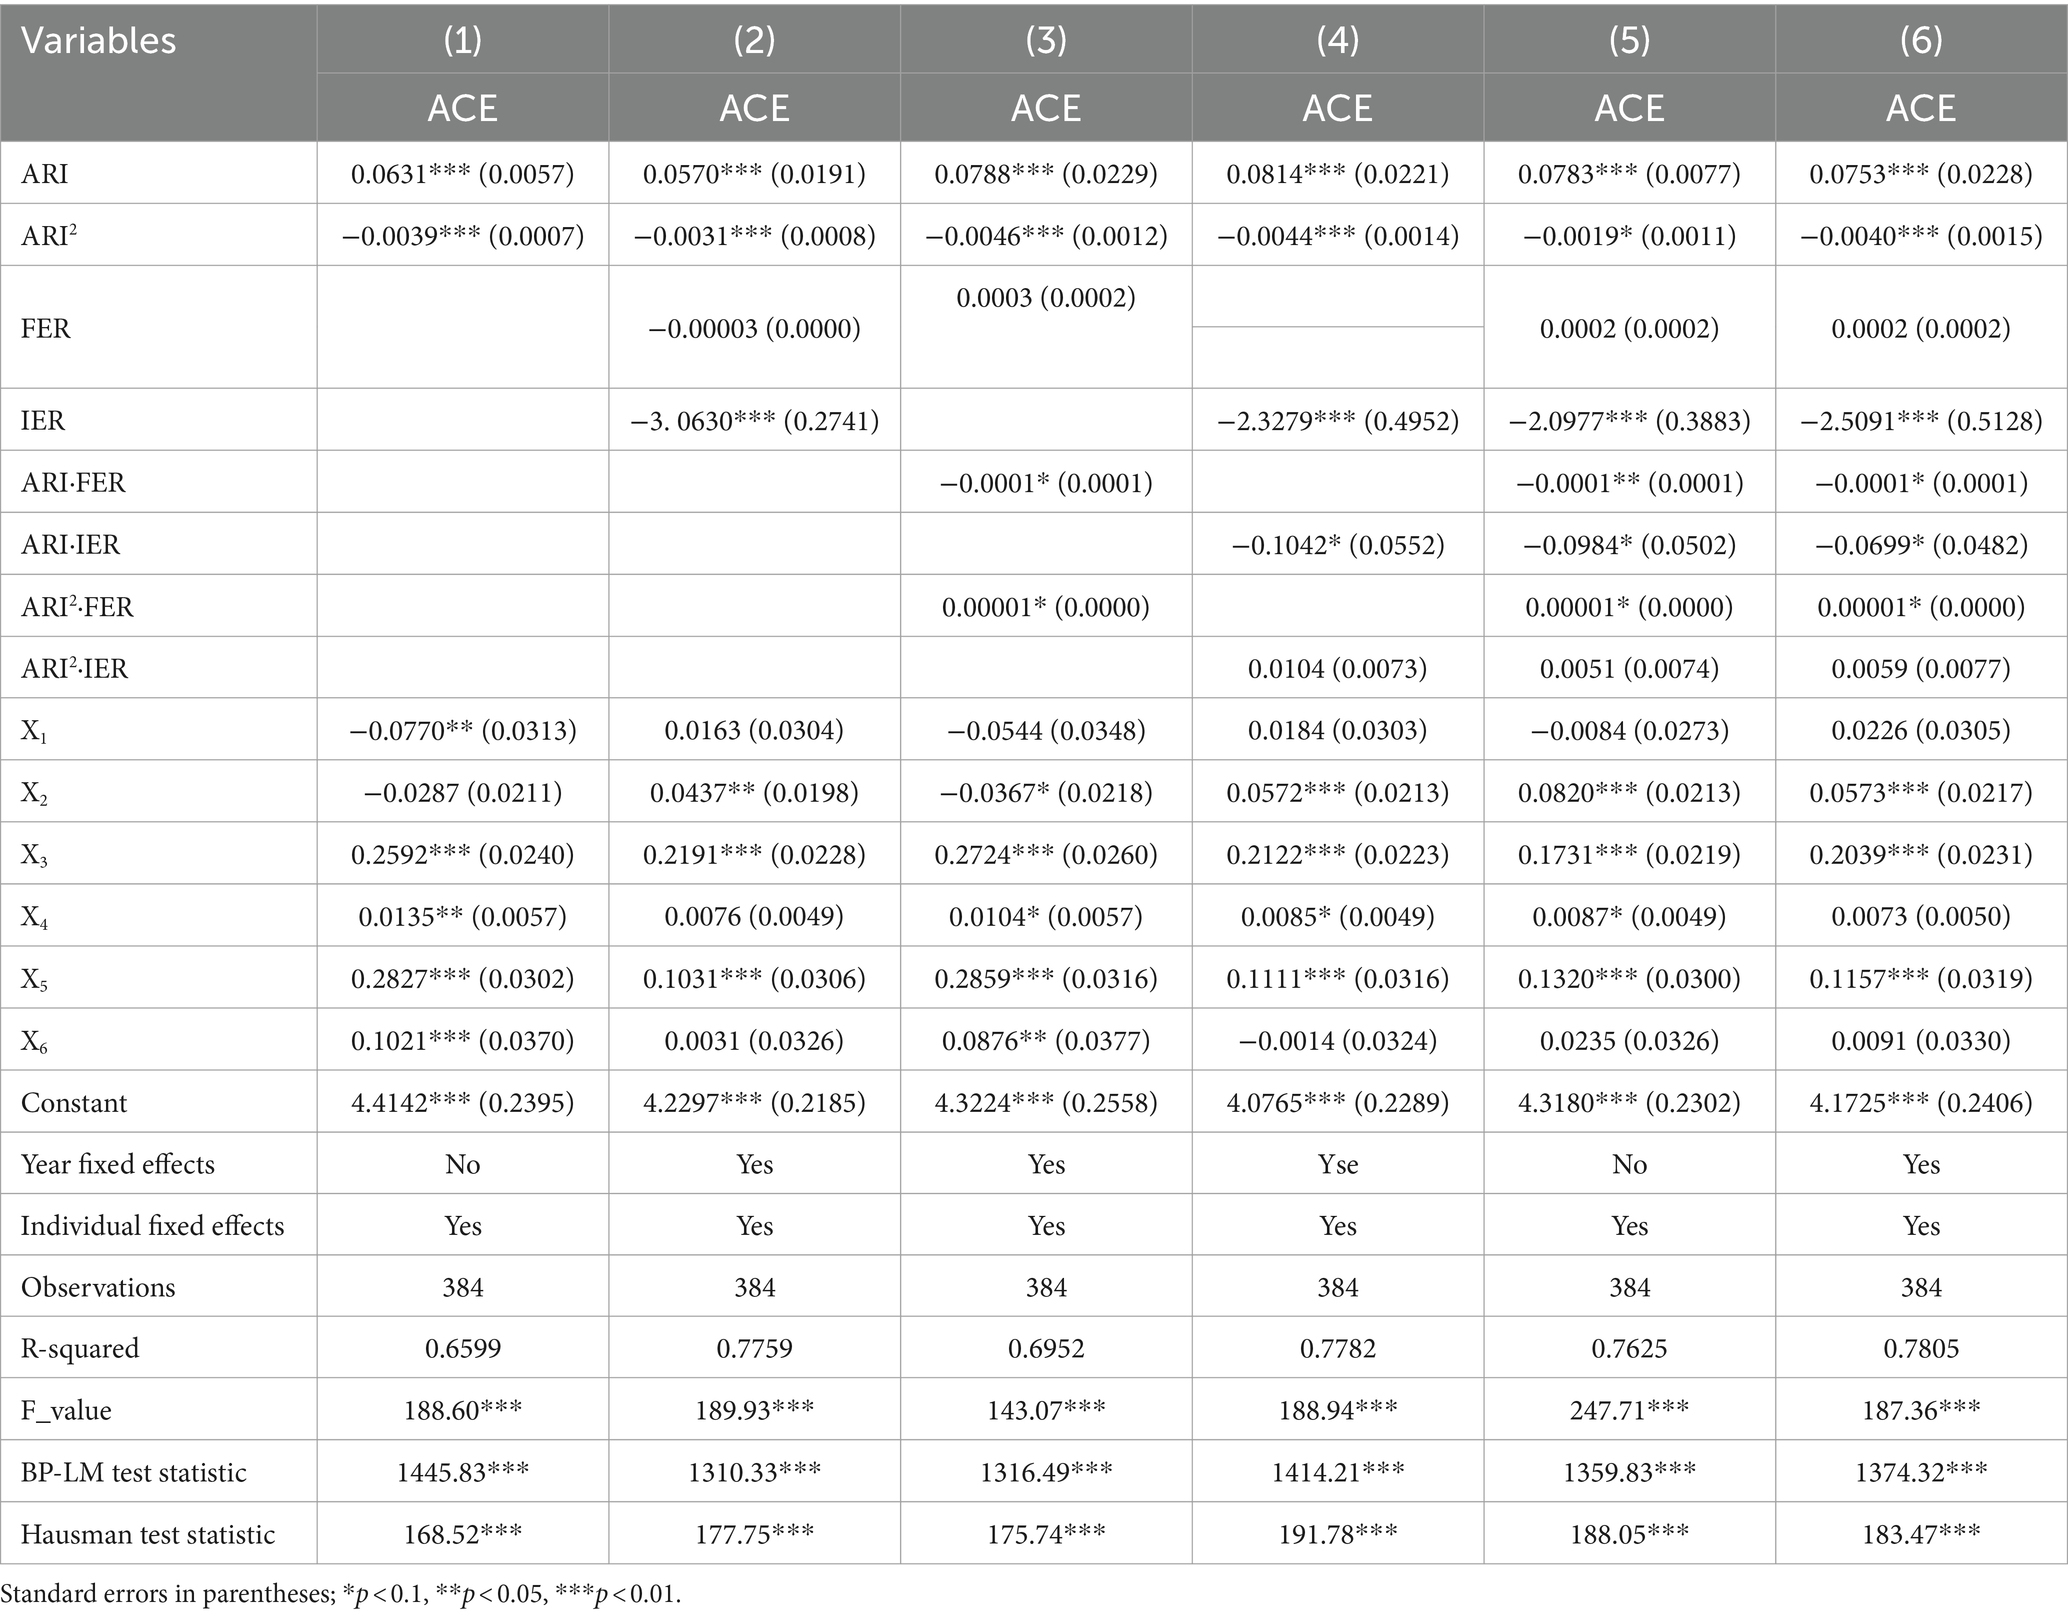
Table 4. Robustness test results on direct and moderating effects.
4.3.2 Endogeneity test
To prevent model estimation errors caused by endogeneity problems, we use the two-stage least squares (2SLS) method for re-estimation in this study. Drawing on the idea of Huang et al. (2019) selecting historical data from the time dimension as a viable instrumental variable, this study uses the number of agricultural small tractors in each province from 1978 to 1991 as an instrumental variable (IV) for regional ARI. The instrumental variable satisfies both the correlation and exogenous conditions.
The 2SLS estimation results are shown in Table 5. In column (1), both the F-statistic and instrumental variables show significant results at the 1% level. This result confirms the validity of the selected instrumental variables, i.e., no weak instrumental variables exist. The regression results in column (2) show that ARI contributes significantly to ACE, confirming that the results of the benchmark regression are robust.
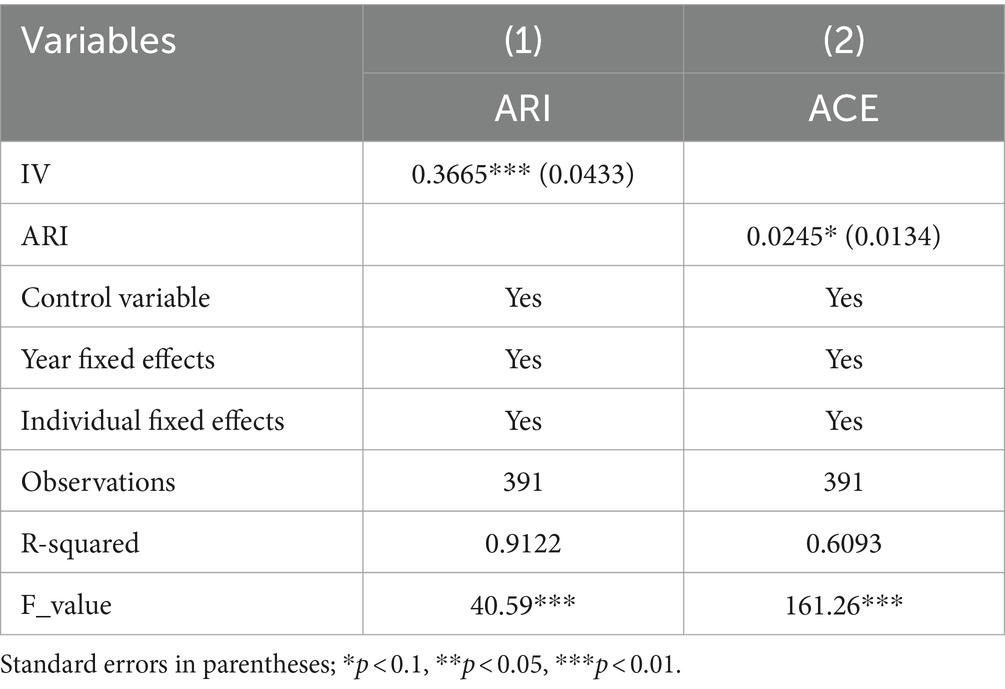
Table 5. 2SLS regression results.
4.4 Analysis of the moderation effect
We already know that FER and IER have significant moderating effects on the ACE-KC. Next, this paper further analyzes how the two styles of ER affect the shape of the ACE-KC. After concluding that the coefficients of both interaction terms of FER with ARI and ARI2 are significant, we extract the corresponding estimated regression equation (see Equation 5) based on the estimation results demonstrated by columns (6) in Table 3 (the estimated coefficients of FER are not significant, so they are deleted).
Where represents the estimated value of ACE. is 0.1086, is −0.0054, is −0.0001, is 0.000012, and is 3.9326.
Figure 2 shows the Kuznets plots of ACE and ARI for different levels of FER at low, medium, and high. FER(0) represents the relation diagram between ARI and ACE when FER is taken as 0, i.e., when there is no FER. As a continuous variable, FER was divided using a generalized method (Aiken et al., 1991). The mean was used to represent the medium level (M). The mean plus one standard deviation represents a high level (H). The mean minus one standard deviation represents a low level (L). The results of the delineation are shown below:
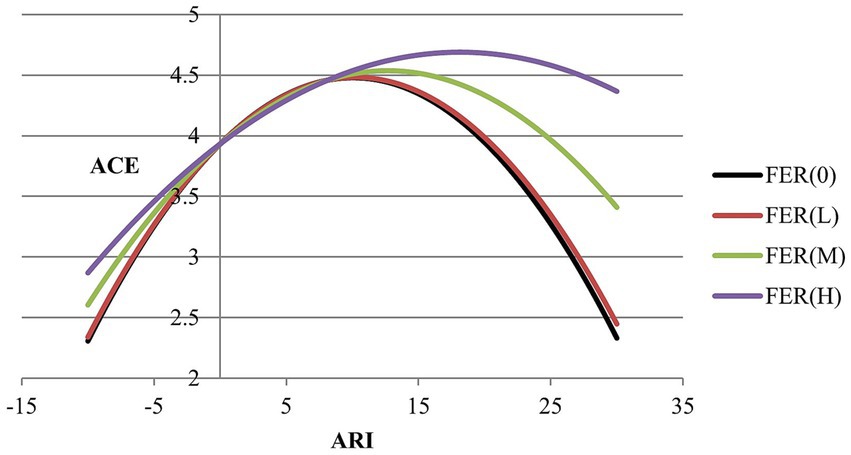
Figure 2. Moderating effect of FER on ACE-Kuznets curve.
As shown in Figure 2, at lower levels of FER, the ACE-KC almost overlaps with the absence of FER, suggesting that lenient FER barely alters the relationship between ARI and ACE. The slope of the ACE-KC is smaller (in absolute value) under strict FER than under loose FER. The curve rises more slowly in the rising phase and falls more slowly in the falling phase. In addition, the higher the level of FER, the peak of the ACE-KC rises gradually, and its inflection point becomes more delayed. In conclusion, FER does not improve the relationship between ARI and ACE, while the higher the FER level, the worse the situation perhaps becomes. Therefore, the second half of hypothesis 2 was not tested. One possible reason for this is that ER itself may lead to a “green paradox” effect (Liu et al., 2018), which can occur especially in developing countries (Dietzenbacher and Mukhopadhyay, 2007; Van der Ploeg and Withagen, 2015). Some studies have found an inverted U-shaped relationship between ER and carbon emissions (Chen et al., 2020). The positive coefficient of FER in our results indicates that the current FER in China is in the increasing stage for ACE. Since the sample maximum value of ARI is 7.5189 (ARI is logarithmic value for consistency with the regression results), the black curve in Figure 2 shows that ARI is in an increasing stage before 7.5189, which indicates that the current ARI on ACE in China is also positive. When the positive effect of FER on ACE is superimposed on the positive effect of ARI on ACE, the phenomenon of the peak of the ACE-KC increasing with the increase of the FER level is shown in Figure 2.
After concluding that the coefficients of both interaction terms of IER with ARI and ARI2 are significant, we extracted the corresponding estimated regression equations (see Equation 6) based on the estimation results exhibited by columns (6) in Table 3.
Where represents the estimated value of ACE. is 0.1086, is −0.0054, is −1.5500, is −0.1809, is 0.0138, and is 3.9326.
Kuznets plots of ACE and ARI at different levels of IER at low, medium, and high levels are shown in Figure 3. IER was divided in the same way as FER. The division results are as follows:
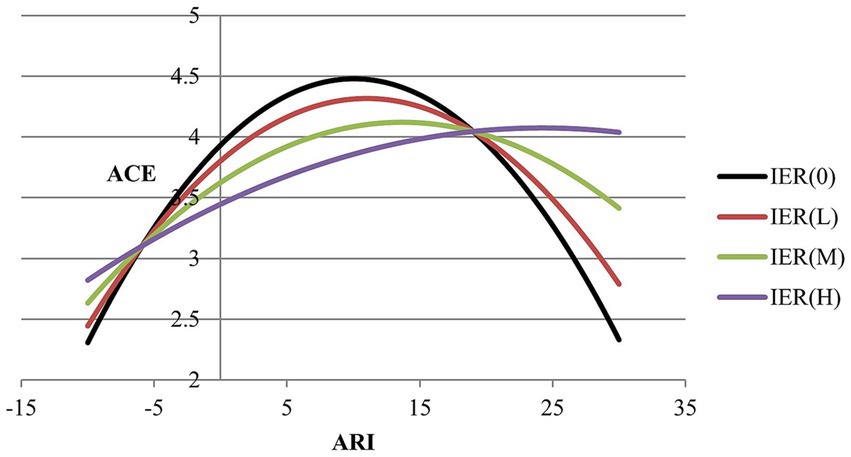
Figure 3. Moderating effect of IER on ACE-Kuznets curve.
Figure 3 shows that the ACE-KC’s slope (in absolute value) is smaller under strict IER pieces than under loose IER. The curve rises more slowly in the rising phase and falls more slowly in the falling phase. Also, the higher the level of IER, the peak of the ACE-KC gradually decreases, but its inflection point becomes more pushed back. Alternatively, the inverted “U” shaped nexus between the number of ARI and ACE becomes closer to a linear relationship as the level of IER increases. In short, the relatively strict IER is more conducive to realizing the decline of ACE peak than the relatively lenient FER, but the emission reduction process is not accelerated. Therefore, the second half of hypothesis 2 was not tested. However, compared to FER, IER did not advance the inflection point of the ACE-KC, but it reduced the peak of the ACE-KC. This result suggests that IER has a more significant effect on improving the relationship between ARI and ACE compared with FER. The main reason may be that the current ARI in China positively affects ACE. In contrast, IER has a negative effect on ACE (the coefficient of IER is significantly negative in Table 3). The superposition of both positive and negative effects makes the ACE-KC’s slope (absolute value) smaller, i.e., the curve becomes flatter. It also indicates that the positive effect of ARI on ACE is stronger than the negative effect of IER on ACE.
4.5 Heterogeneity analysis
There are “gradient differences” in agricultural development and AI levels in China’s eastern, central, and western regions, leading to regional heterogeneity in ARA. In addition, ARA may have a heterogeneous impact on the ACE due to differences in regional natural conditions and digitalization bases. Therefore, this study explores the moderating effects of FER and IER on the ACE-KC in China’s eastern, central, and western regions.
The results of the heterogeneity regressions for the eastern, central, and western regions are shown in Table 6. In the eastern region, the estimated coefficient of ARI is 0.1560; ARI2 is −0.0148; ARI⸱FER is −0.0001; ARI2⸱FER is 0.00003; ARI⸱IER is −0.2155; and ARI2⸱IER is 0.0306. All coefficients except ARI⸱FER pass the significance test. These results indicate that the inverted U-shaped relationship between ARI and ACE holds in the eastern region and that FER and IER have significant moderating effects on ACE-KC. In the central region, the estimated coefficient of ARI is 0.0376; 0.0010 for ARI2; −0.0002 for ARI⸱FER; 0.00002 for ARI2⸱FER; −0.5835 for ARI⸱IER; and 0.0365 for ARI2⸱IER. The ARI and ARI2 coefficients are insignificant, while the interaction term coefficients all pass the significance test. This suggests that the inverted U-shaped relationship between ARI and ACE does not hold in the central region, but FER and IER have significant moderating effects.
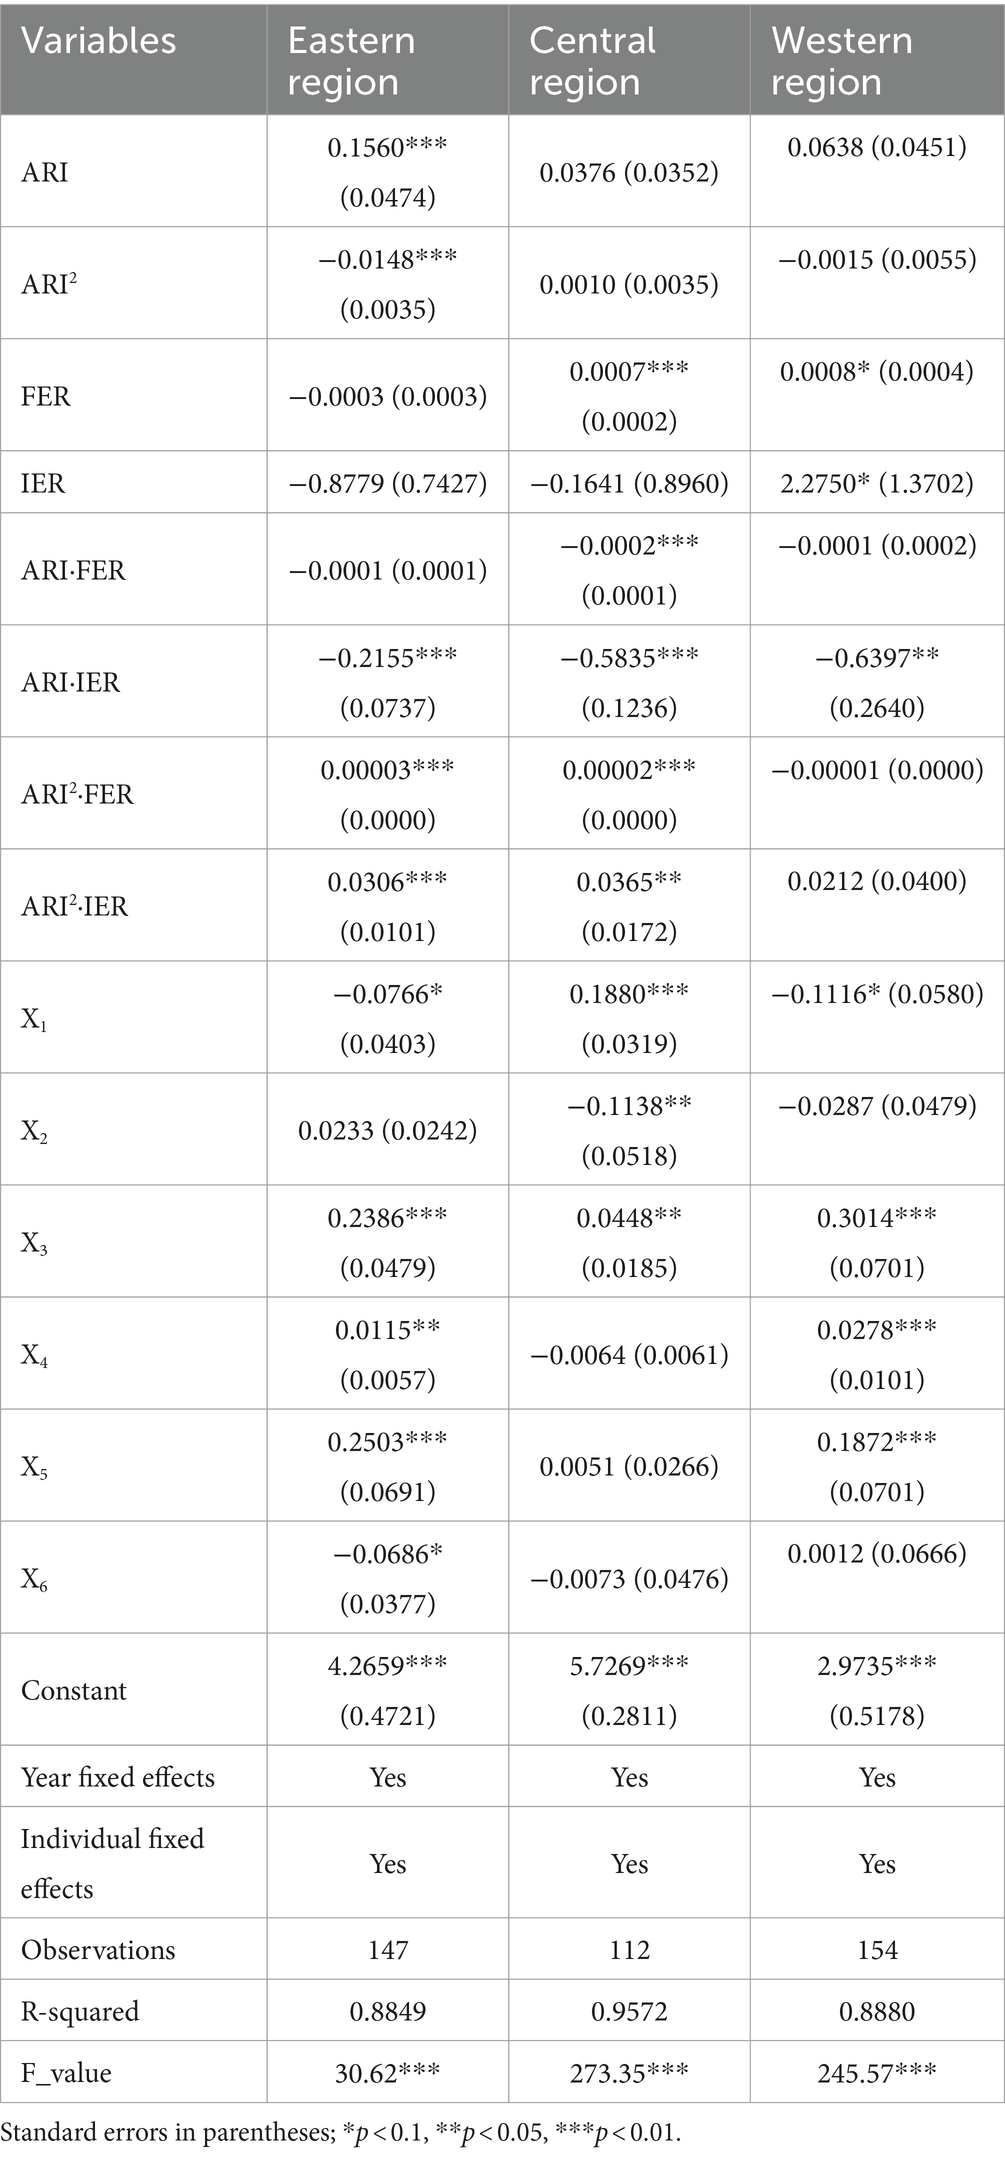
Table 6. Heterogeneity analysis results on moderating effects.
In contrast, the inverted U-shaped relationship between ARI and ACE and the moderating effects of FER and IER are insignificant in the western region. The heterogeneity results suggest that ACE-KC is particularly pronounced in the relatively economically developed eastern region, consistent with the finding that EKC is particularly pronounced in developed countries (Kalisvaart et al., 2023). The moderating effects of FER and IER in the western region are not significant, perhaps because the region is sparsely populated, the level of economic development and environmental pollution is low, and the strength of ER is relatively small, so there are no significant moderating effects.
5 Discussion and conclusion
This study uses the Chinese provincial areas as the objects of study to explore the nonlinear effect of the application of agricultural robots on ACE in the context of various disruptive technologies that shape the outlook for changes in agricultural production. We also explore the moderating effects of FER and IER on the nexus between the application of agrarian robots and ACE, based on the context that China has been prioritizing environmental and climate issues in recent years and incorporating both formal and informal ERs into the research framework. It is found that there is an inverted U-shaped relationship between the application of agricultural robots and ACE, i.e., as the application of agricultural robots increases, ACE first increases and then decreases. The results obtained in this paper are like those of Liu B. et al. (2024), except that their study was on the nonlinear nexus between the extent of application of all industrial robots in the region and regional carbon emissions. On the other hand, this paper focuses on the agricultural sector, making our study a novel exploration of academia.
According to the moderating effects analysis of the study, both formal and informal ER changed the shape of the ACE-KC. Specifically, FER increased the peak of the ACE-KC and delayed the inflection point. IER decreased the peak of the ACE-KC but delayed the inflection point. The current literature studying the effect of ER on CO2 KC focuses on FER. The research by Yin et al. (2015) found that higher levels of ER, while causing the peak of CO2 KC to rise, also had a more advanced inflection point, which is inconsistent with the results obtained in this paper. The possible reasons for this discrepancy are the different fields of study, where our study is focused on agriculture. Secondly, the independent variable used in this paper is ARI, while Yin et al. (2015) use gross regional product. Again, the period of the study sample is different. Our sample interval is from 2006 to 2019, while Yin et al. (2015) adopted the sample interval from 1999 to 2011. Some of the reasons FER makes the peak of the ACE-KC higher are discussed in depth next.
First, the spillover effects of environmental justice and environmental governance make it imperative that environmental protection, including carbon emission reduction, be carried out in the context of efficient synergies within the region (Gunningham, 2009; Holley and Sinclair, 2013). Although China’s Beijing-Tianjin-Hebei and Yangtze River Delta regions are already engaged in collaborative legislation on regional environmental governance, collaborative legislation is a “new sprout” from China’s traditional legislative system. Therefore, China’s Constitution, the Legislative Law, and other relevant laws on the legal effect of regional environmental governance collaborative legislation are not yet clear, which often leads to China’s regional environmental governance collaborative legislation being faced with the problem of constitutionality, legislative conflicts and other problems (Van Rooij, 2006; Li, 2019; Zhu, 2019). Insufficient synchronization of regional environmental governance collaborative legislation will directly affect regional environmental governance synergistic law enforcement and reduce the effectiveness of law enforcement. Inadequate supporting policies and measures are not conducive to enhancing the efficiency of collaborative legislation on regional environmental governance. For example, the legal effect of different local normative documents on environmental protection issues varies greatly (Zhang and Fu, 2008). In practice, in the same region, various local normative documents are formulated by different subjects for the same environmental governance issues, which leads to local laws in some places and local government regulations in others (Shen et al., 2017). The difference in legal effect will directly affect the enforcement behavior of regional environmental law enforcement subjects, which will have a certain adverse effect on the future regional environmental collaborative governance, making the input of ER and governance effects often disproportionate.
Second, even without considering collaborative environmental governance, environmental laws established in different regions often contradict legislation and enforcement (Marquis et al., 2011), undermining their actual regulatory effect in curbing carbon emissions. For example, Shanghai has relatively clear provisions for local cooperative governance for air pollution prevention and control. However, some local legislation, such as Jiangsu’s, is more general. The Tianjin Water Pollution Prevention and Control Regulations, compared with the water pollution prevention and control regulations of Beijing and Hebei, have a particular chapter on “Regional Water Pollution Prevention and Control Collaboration.” Hebei Province stipulates the specific procedures for determining the list of enterprises participating in mandatory cleaner production audits. In contrast, Beijing and Tianjin only generally stipulate that the competent authorities in charge of cleaner production and the environmental protection authorities shall determine the list following the law without stipulating the specific procedures. The incomplete harmonization of legislative content is not only reflected in the inconsistency of substantive provisions but also includes procedural provisions that are not uniform. The inconsistency of the legislation makes regional environmental governance less effective (Lo et al., 2006) and weakens the inhibiting effect of environmental laws on carbon emissions.
Finally, FER (FER), such as strict environmental laws, may lead to escalating compliance costs for firms in STI activities (Delmas and Marcus, 2004; Shi et al., 2018; Chen and Qian, 2020), thereby weakening firms’ technological innovation capabilities (Ramanathan et al., 2017; Jiang et al., 2021), limited R&D funds being used for environmental compliance and reducing R&D investment in non-environmental areas (Rubashkina et al., 2015), resulting in the technological value added declining in non-environmental areas of the robots, affecting its function of curbing carbon emissions. On the other hand, strict environmental laws may lead to an increasing number of agribusinesses engaging in greenwashing or carbon credit speculation, i.e., avoiding their current environmental responsibilities through differences in the price of carbon offsets between different enterprises, purchasing green bonds, and purchasing carbon emission quota through the carbon trading mechanism (Kalesnik et al., 2020; Gao and Schmittmann, 2022), and increasing their emissions from agricultural activities (Kalesnik et al., 2020; Gao and Schmittmann, 2022).
Because of these reflections, in the future, we will focus on some issues related to ARA and synergistic carbon emission reduction in China’s regional agriculture and thus continue to enrich the findings of this paper.
According to our knowledge, no literature examines the effect of IER on the KC. IER is more like a soft external constraining force than FER. For example, environmental media reports, as IER, can promote industrial structure upgrading by monitoring the government and guiding public opinion (Chen et al., 2020), thus protecting the environment and reducing carbon emissions. In addition, other variables that can be used as proxies for IER include the number of petition visits (Ren et al., 2018), community pressure (Féres and Reynaud, 2012), neighborhood income inequality (Moser and Zwickl, 2014), Pollution Information Transparency Index (PITI) (Zhang and Huang, 2023), etc., all have positive effects on environmental protection and carbon emission reduction. In agriculture, the PITI, an IER, can similarly increase total factor productivity and reduce ACE (Liu et al., 2022). In addition to the PITI, village rules, as a kind of IER, can likewise promote cleaner production behaviors among farmers and reduce ACE (Du et al., 2023). It follows that IER can effectively lower ACE. That is why we included IER in our model. In future research, we can continue to explore how different measures of IER differ in their impact on ACE and how the effect on the relationship between ARA and ACE differs, which would be a further extension of this study.
6 Policy implications
To realize “Agricultural Zero-Carbonism,” our work can furnish the following recommendations to administrations.
The first suggestion. Although there is a significant ARA-ACE inverted U-shaped curve, China is still in the left half of the curve. At this stage, an increase in ARA leads to an increase in ACE. Since this trend is problematic to avoid before the inflection point, the government should vigorously promote agricultural robots and reach the inflection point as soon as possible. Meanwhile, the government should exploit and release numerous national, industry, and association-level standards for green agricultural robots, covering all agrarian corners with green agricultural robot standards, encouraging the manufacture of more clean energy-powered agrarian robots and minimizing the environmental damage brought about by the scale effect of agricultural robot applications.
The second recommendation. Since FER is insignificant for ACE, the government should adopt a lean governance approach by proposing a lean FER for agriculture to reduce the rising regulatory costs associated with policy redundancy. The government only needs to set more disbursements into the censor procedure. Being an all-around nanny in policy design, formulation, censor, implementation, and feedback is unnecessary. The government should adopt a scientific and elastic lean FER to replace the rigid and traditional FER.
The third recommendation. Since IER can limit and suppress ACE, the government should gradually delegate various powers of IER to the public, instructing the public to actively participate in the standard design, formulation, censoring, implementation, and feedback of IER and ultimately establish a system that is shared and governed by everyone. of “pro-environmental civil society.”
The fourth recommendation. Due to the regulatory effect of FER, the peak value of the inverted U-shaped curve rises, and the inflection point is pushed back. Plus, FER is not significant on ACE. Therefore, the government should reduce the FER for the agricultural sector or provide exemptions to qualified agricultural enterprises and self-employed agricultural workers and allow them to carry out agricultural operations under the prerequisites of “weak FER” or even “zero FER” under the premise of complying with the constitution.
The fifth recommendation. Due to the regulating effect of IER, the peak value of the inverted U-shaped curve decreases, and the inflection point is pushed back. Plus, IER can significantly reduce the ACE; therefore, the government should further promote IER and integrate it with the ARA’s development strategy, encourage more societal forces to partake in the investigation and application promotion of ARA, and customize the corresponding IER, increase the suitability between ARA and IER, reduce the internal consumption and increase the resonance effect, so that the superposition of IER and ARA can make the inflection point earlier.
Data availability statement
Publicly available datasets were analyzed in this study. This data can be found here: the raw data for measuring the ARI come from reports published by the IFR and the China Labor Statistics Yearbook. The remaining variables are from the National Bureau of Statistics of China, China Statistical Yearbook, CEIdata database, China Rural Statistical Yearbook, and the China Three Rural Areas (agriculture, rural areas, and peasants) Research Database.
Author contributions
YL: Conceptualization, Data curation, Formal analysis, Funding acquisition, Methodology, Project administration, Software, Writing – original draft. YC: Conceptualization, Investigation, Resources, Supervision, Validation, Visualization, Writing – review & editing.
Funding
The author(s) declare that financial support was received for the research, authorship, and/or publication of this article. This research was funded by “the Fundamental Research Funds for the Central Universities” (grant number 63232162).
Conflict of interest
The authors declare that the research was conducted in the absence of any commercial or financial relationships that could be construed as a potential conflict of interest.
Publisher’s note
All claims expressed in this article are solely those of the authors and do not necessarily represent those of their affiliated organizations, or those of the publisher, the editors and the reviewers. Any product that may be evaluated in this article, or claim that may be made by its manufacturer, is not guaranteed or endorsed by the publisher.
References
Acemoglu, D., and Restrepo, P. (2020). Robots and jobs: Evidence from US labor markets. J. Polit. Econ. 128, 2188–2244. doi: 10.1086/705716
Aditya, U. S., Singh, R., Singh, P. K., and Kalla, A. (2021). A survey on blockchain in robotics: issues, opportunities, challenges and future directions. J. Netw. Comput. Appl. 196:103245. doi: 10.1016/j.jnca.2021.103245
Aiken, L. S., West, S. G., and Reno, R. R., (1991). Multiple regression: Testing and interpreting interactions. Thousand Oaks, CA: Sage.
Ali, A., Usman, M., Usman, O., and Sarkodie, S. A. (2021). Modeling the effects of agricultural innovation and biocapacity on carbon dioxide emissions in an agrarian-based economy: evidence from the dynamic ARDL simulations. Front. Ener. Res. 8:592061. doi: 10.3389/fenrg.2020.592061
Al-Shidi, H. K., Ambusaidi, A. K., and Sulaiman, H. (2021). Public awareness, perceptions and attitudes on air pollution and its health effects in Muscat, Oman. J. Air Waste Manage. Assoc. 71, 1159–1174. doi: 10.1080/10962247.2021.1930287
Bai, L., Guo, T., Xu, W., Liu, Y., Kuang, M., and Jiang, L. (2023). Effects of digital economy on carbon emission intensity in Chinese cities: a life-cycle theory and the application of non-linear spatial panel smooth transition threshold model. Energy Policy 183:113792. doi: 10.1016/j.enpol.2023.113792
Bechar, A., and Vigneault, C. (2016). Agricultural robots for field operations: concepts and components. Biosyst. Eng. 149, 94–111. doi: 10.1016/j.biosystemseng.2016.06.014
Bechar, A., and Vigneault, C. (2017). Agricultural robots for field operations. Part 2: operations and systems. Biosyst. Eng. 153, 110–128. doi: 10.1016/j.biosystemseng.2016.11.004
Bennetzen, E. H., Smith, P., and Porter, J. R. (2016). Decoupling of greenhouse gas emissions from global agricultural production: 1970–2050. Glob. Chang. Biol. 22, 763–781. doi: 10.1111/gcb.13120
Bi, J., Zhang, Y., and Zhang, B. (2010). Public perception of environmental issues across socioeconomic characteristics: a survey study in Wujin, China. Front. Environ. Sci. Eng. China 4, 361–372. doi: 10.1007/s11783-010-0017-4
Blackman, A., Morgenstern, R., Montealegre, L., Murcia, L., and García, J. (2006). Review of the efficiency and effectiveness of Colombia’s environmental policies. Report. Washington, DC: Resources for the Future.
Böhringer, C., and Rivers, N. (2021). The energy efficiency rebound effect in general equilibrium. J. Environ. Econ. Manag. 109:102508. doi: 10.1016/j.jeem.2021.102508
Bolfe, É. L., Jorge, L. A. D. C., Sanches, I. D. A., Luchiari Júnior, A., da Costa, C. C., Victoria, D. D. C., et al. (2020). Precision and digital agriculture: adoption of technologies and perception of Brazilian farmers. Agriculture 10:653. doi: 10.3390/agriculture10120653
Bručienė, I., Aleliūnas, D., Šarauskis, E., and Romaneckas, K. (2021). Influence of mechanical and intelligent robotic weed control methods on energy efficiency and environment in organic sugar beet production. Agriculture 11:449. doi: 10.3390/agriculture11050449
Cheng, H., Jia, R., Li, D., and Li, H. (2019). The rise of robots in China. J. Econ. Perspect. 33, 71–88. doi: 10.1257/jep.33.2.71
Chen, K., and Xu, M. (2023). Meeting low-carbon and food security objectives of China Agri-food system under the greater food approach: status quo, challenges, and pathways. Issues in Agricultural Economy 6, 77–85. (In Chinese)
Chen, X., and Qian, W. (2020). Effect of marine environmental regulation on the industrial structure adjustment of manufacturing industry: an empirical analysis of China's eleven coastal provinces. Mar. Policy 113:103797. doi: 10.1016/j.marpol.2019.103797
Chen, Y., Fan, X., and Zhou, Q. (2020). An inverted-U impact of environmental regulations on carbon emissions in China’s iron and steel industry: mechanisms of synergy and innovation effects. Sustain. For. 12:1038. doi: 10.3390/su12031038
Costa, C. Jr., Wollenberg, E., Benitez, M., Newman, R., Gardner, N., and Bellone, F. (2022). Roadmap for achieving net-zero emissions in global food systems by 2050. Sci. Rep. 12:15064. doi: 10.1038/s41598-022-18601-1
Dai, Y., Zhang, H., Cheng, J., Jiang, X., Ji, X., and Zhu, D. (2022). Whether ecological measures have influenced the environmental Kuznets curve (EKC)? An analysis using land footprint in the Weihe River basin, China. Ecol. Indicat. 139:108891. doi: 10.1016/j.ecolind.2022.108891
Danish Ulucak, R., Khan, S. U. D., Baloch, M. A., and Li, N. (2020). Mitigation pathways toward sustainable development: is there any trade-off between environmental regulation and carbon emissions reduction? Sustain. Dev. 28, 813–822. doi: 10.1002/sd.2032
Dasgupta, S., Laplante, B., Wang, H., and Wheeler, D. (2002). Confronting the environmental Kuznets curve. J. Econ. Perspect. 16, 147–168. doi: 10.1257/0895330027157
Delmas, M., and Marcus, A. (2004). Firms' choice of regulatory instruments to reduce pollution: a transaction cost approach. Bus. Polit. 6, 1–20. doi: 10.2202/1469-3569.1073
Dietzenbacher, E., and Mukhopadhyay, K. (2007). An empirical examination of the pollution haven hypothesis for India: towards a green Leontief paradox? Environ. Resour. Econ. 36, 427–449. doi: 10.1007/s10640-006-9036-9
Duan, H., Zhang, Y., Zhao, J., and Bian, X. (2011). Carbon footprint analysis of farmland ecosystem in China. J. Soil Water Conserv. 25, 203–208. (In Chinese)
Dusík, J., Fischer, T., and Šarić, I. (2018). Strategic environmental and social assessment of automation. Scoping Working Paper, 1–49.
Du, Y., Liu, H., Huang, H., and Li, X. (2023). The carbon emission reduction effect of agricultural policy——evidence from China. J. Clean. Prod. 406:137005. doi: 10.1016/j.jclepro.2023.137005
Fang, Z., Kong, X., Sensoy, A., Cui, X., and Cheng, F. (2021). Government’s awareness of environmental protection and corporate green innovation: a natural experiment from the new environmental protection law in China. Econ. Anal. Policy 70, 294–312. doi: 10.1016/j.eap.2021.03.003
Féres, J., and Reynaud, A. (2012). Assessing the impact of formal and informal regulations on environmental and economic performance of Brazilian manufacturing firms. Environ. Resour. Econ. 52, 65–85. doi: 10.1007/s10640-011-9520-8
Flatø, H. (2020). Socioeconomic status, air pollution and desire for local environmental protection in China: insights from national survey data. J. Environ. Plan. Manag. 63, 49–66. doi: 10.1080/09640568.2019.1630373
Fu, C., Min, W., and Liu, H. (2022). Decomposition and decoupling analysis of carbon emissions from cultivated land use in China’s main agricultural producing areas. Sustain. For. 14:5145. doi: 10.3390/su14095145
Gao, Y., and Schmittmann, J. M. (2022). Green bond pricing and greenwashing under asymmetric information. International Monetary Fund: Washington, DC. 1.
Gilbert, N. (2012). One-third of our greenhouse gas emissions come from agriculture. Nature 31, 10–12.
Gonzalez-de-Soto, M., Emmi, L., Benavides, C., Garcia, I., and Gonzalez-de-Santos, P. (2016). Reducing air pollution with hybrid-powered robotic tractors for precision agriculture. Biosyst. Eng. 143, 79–94. doi: 10.1016/j.biosystemseng.2016.01.008
Green, F., and Stern, N. (2017). China’s changing economy: implications for its carbon dioxide emissions. Clim. Pol. 17, 423–442. doi: 10.1080/14693062.2016.1156515
Greenwood, L. (2022). China’s interests in US agriculture: Augmenting food security through investment abroad. US-China Economic and Security Review Commission, Staff Research Report, p. 11.
Grossman, G. M., and Krueger, A. B. (1991). Environmental impacts of a North American free trade agreement. NBER Working Papers. 3914. doi: 10.3386/w3914
Gunningham, N. (2009). The new collaborative environmental governance: the localization of regulation. J Law Soc 36, 145–166. doi: 10.1111/j.1467-6478.2009.00461.x
Gupta, R. (2014). Low-hanging fruit in black carbon mitigation: crop residue burning in South Asia. Clim. Change Econ. 5:1450012. doi: 10.1142/S2010007814500122
He, P., Zhang, J., and Li, W. (2021). The role of agricultural green production technologies in improving low-carbon efficiency in China: necessary but not effective. J. Environ. Manag. 293:112837. doi: 10.1016/j.jenvman.2021.112837
Higón, D. A., Gholami, R., and Shirazi, F. (2017). ICT and environmental sustainability: a global perspective. Telematics Inform. 34, 85–95. doi: 10.1016/j.tele.2017.01.001
Hoebert, T., Lepuschitz, W., List, E., and Merdan, M. (2019). Cloud-based digital twin for industrial robotics. Industrial Applications of Holonic and Multi-Agent Systems: 9th International Conference, Holo MAS 2019, Linz, Austria, August 26–29, 2019.
Holley, C., and Sinclair, D. (2013). Deliberative participation, environmental law and collaborative governance: insights from surface and groundwater studies. Environ. Law Collab. Govern. 30, 32–55.
Huang, Q., Yu, Y., and Zhang, S. (2019). Internet development and productivity growth in manufacturing industry: internal mechanism and China experiences. China Indust. Econ. 8, 5–23. (In Chinese)
Hu, K., Li, D., Shi, D., and Xu, W. (2023). Environmental regulation and energy efficiency: evidence from daily penalty policy in China. J. Regul. Econ. 63, 1–29. doi: 10.1007/s11149-022-09455-6
Jiang, M., Zhu, B., Chevallier, J., and Xie, R. (2018). Allocating provincial CO 2 quotas for the Chinese national carbon program. Aust. J. Agric. Resour. Econ. 62, 457–479. doi: 10.1111/1467-8489.12261
Jiang, Y., Yang, F., Zhang, Z., and Li, S. (2023). Development and tests of sliding contact line-powered track transporter. Int. J. Agric. Biol. Eng. 16, 68–75. doi: 10.25165/j.ijabe.20231604.7841
Jiang, Z., Wang, Z., and Lan, X. (2021). How environmental regulations affect corporate innovation? The coupling mechanism of mandatory rules and voluntary management. Technol. Soc. 65:101575. doi: 10.1016/j.techsoc.2021.101575
Kalesnik, V., Wilkens, M., and Zink, J. (2020). Green data or greenwashing? Do corporate carbon emissions data enable investors to mitigate climate change? SSRN Electron. J. 1–51. doi: 10.2139/ssrn.3722973
Kalisvaart, M., Senkoe-Gough, H., Onoko, W., and Zwaigenbaum, E. (2023). Revisiting the environmental Kuznets curve model: greenhouse gas emissions within Canada. Canadian J. Undergrad. Res. 8, 22–27.
Klerkx, L., Jakku, E., and Labarthe, P. (2019). A review of social science on digital agriculture, smart farming and agriculture 4.0: new contributions and a future research agenda. NJAS 90-91:100315, 1–16. doi: 10.1016/j.njas.2019.100315
Koondhar, M. A., Aziz, N., Tan, Z., Yang, S., Abbasi, K. R., and Kong, R. (2021). Green growth of cereal food production under the constraints of agricultural carbon emissions: a new insights from ARDL and VECM models. Sustain Energy Technol Assess 47:101452. doi: 10.1016/j.seta.2021.101452
Kostka, G., and Nahm, J. (2017). Central–local relations: recentralization and environmental governance in China. China Q. 231, 567–582. doi: 10.1017/S0305741017001011
Kousar, S., Afzal, M., Ahmed, F., and Bojnec, Š. (2022). Environmental awareness and air quality: the mediating role of environmental protective behaviors. Sustain. For. 14:3138. doi: 10.3390/su14063138
Laborde, D., Mamun, A., Martin, W., Piñeiro, V., and Vos, R. (2021). Agricultural subsidies and global greenhouse gas emissions. Nat. Commun. 12:2601. doi: 10.1038/s41467-021-22703-1
Lamb, W. F., Wiedmann, T., Pongratz, J., Andrew, R., Crippa, M., Olivier, J. G., et al. (2021). A review of trends and drivers of greenhouse gas emissions by sector from 1990 to 2018. Environ. Res. Lett. 16:073005. doi: 10.1088/1748-9326/abee4e
Lei, X., Ma, Y., Ke, J., and Zhang, C. (2023). The non-linear impact of the digital economy on carbon emissions based on a mediated effects model. Sustain. For. 15:7438. doi: 10.3390/su15097438
Lin, Y., and Li, C. (2023). Towards sustainable development: research on the green growth effect of digital agriculture in China. Environ. Sci. Pollut. Res., 1–14.
Liu, B., Yang, X., and Zhang, J. (2024). Nonlinear effect of industrial robot applications on carbon emissions: evidence from China. Environ. Impact Assess. Rev. 104:107297. doi: 10.1016/j.eiar.2023.107297
Liu, D., Zhu, X., and Wang, Y. (2021). China's agricultural green total factor productivity based on carbon emission: an analysis of evolution trend and influencing factors. J. Clean. Prod. 278:123692. doi: 10.1016/j.jclepro.2020.123692
Liu, P., Huang, T., Shao, Y., and Jia, B. (2024). Environmental regulation, technology density, and green technology innovation efficiency. Heliyon 10:323809:e23809. doi: 10.1016/j.heliyon.2023.e23809
Liu, Y., Li, Z., and Yin, X. (2018). The effects of three types of environmental regulation on energy consumption—evidence from China. Environ. Sci. Pollut. Res. 25, 27334–27351. doi: 10.1007/s11356-018-2769-5
Liu, Y., She, Y., Liu, S., and Lan, H. (2022). Supply-shock, demand-induced or superposition effect? The impacts of formal and informal environmental regulations on total factor productivity of Chinese agricultural enterprises. J. Clean. Prod. 380:135052. doi: 10.1016/j.jclepro.2022.135052
Li, X., Zhang, C., and Zhu, H. (2023). Effect of information and communication technology on CO2 emissions: an analysis based on country heterogeneity perspective. Technol. Forecast. Soc. Chang. 192:122599. doi: 10.1016/j.techfore.2023.122599
Li, Y. (2019). Governing environmental conflicts in China: lessons learned from the case of the Liulitun waste incineration power plant in Beijing. Public Policy Adm. 34, 189–209. doi: 10.1177/0952076717709521
Li, Y., Zhang, Y., Pan, A., Han, M., and Veglianti, E. (2022). Carbon emission reduction effects of industrial robot applications: heterogeneity characteristics and influencing mechanisms. Technol. Soc. 70:102034. doi: 10.1016/j.techsoc.2022.102034
Lo, C. W. H., Fryxell, G. E., and Wong, W. W. H. (2006). Effective regulations with little effect? The antecedents of the perceptions of environmental officials on enforcement effectiveness in China. Environ. Manag. 38, 388–410. doi: 10.1007/s00267-005-0075-8
Long, D. J., and Tang, L. (2021). The impact of socio-economic institutional change on agricultural carbon dioxide emission reduction in China. PLoS One 16:e0251816. doi: 10.1371/journal.pone.0251816
Lowenberg-DeBoer, J., Huang, I. Y., Grigoriadis, V., and Blackmore, S. (2020). Economics of robots and automation in field crop production. Precis. Agric. 21, 278–299. doi: 10.1007/s11119-019-09667-5
Luo, J., Hu, M., Huang, M., and Bai, Y. (2023). How does innovation consortium promote low-carbon agricultural technology innovation: an evolutionary game analysis. J. Clean. Prod. 384:135564. doi: 10.1016/j.jclepro.2022.135564
Malik, A., and Kohli, S. (2020). Electric tractors: survey of challenges and opportunities in India. Materials Today 28, 2318–2324. doi: 10.1016/j.matpr.2020.04.585
Mantoam, E. J., Angnes, G., Mekonnen, M. M., and Romanelli, T. L. (2020). Energy, carbon and water footprints on agricultural machinery. Biosyst. Eng. 198, 304–322. doi: 10.1016/j.biosystemseng.2020.08.019
Marinoudi, V., Sørensen, C. G., Pearson, S., and Bochtis, D. (2019). Robotics and labour in agriculture. A context consideration. Biosyst. Eng. 184, 111–121. doi: 10.1016/j.biosystemseng.2019.06.013
Marquis, C., Zhang, J., and Zhou, Y. (2011). Regulatory uncertainty and corporate responses to environmental protection in China. Calif. Manag. Rev. 54, 39–63. doi: 10.1525/cmr.2011.54.1.39
Ma, X., Ahmad, N., and Oei, P. Y. (2021). Environmental Kuznets curve in France and Germany: role of renewable and nonrenewable energy. Renew. Energy 172, 88–99. doi: 10.1016/j.renene.2021.03.014
McCarthy, B., Anex, R., Wang, Y., Kendall, A. D., Anctil, A., Haacker, E. M., et al. (2020). Trends in water use, energy consumption, and carbon emissions from irrigation: role of shifting technologies and energy sources. Environ. Sci. Technol. 54, 15329–15337. doi: 10.1021/acs.est.0c02897
Melnyk, L., Dehtyarova, I., Kubatko, O., Karintseva, O., and Derykolenko, A. (2019). Disruptive technologies for the transition of digital economies towards sustainability. Економiчний часопис-XXI 179, 22–30. doi: 10.21003/ea.V179-02
Moser, M., and Zwickl, K. (2014). Informal environmental regulation of industrial air pollution: Does neighborhood inequality matter?. WU Vienna University of Economics and Business. Department of Economics Working Paper Series. No. 192. doi: 10.57938/6e2422a9-e320-4ff4-a112-6a429f2b945f
Muktiwibowo, A. K. (2018). “A street with informal regulation,” in Transdisciplinary urbanism and culture: From pedagogy to praxis. eds. Q. Zaman and I. Troiani T (Cham: The Urban Book Series, Springer), 113–125.
Mukumbuta, I., and Hatano, R. (2020). Do tillage and conversion of grassland to cropland always deplete soil organic carbon? Soil Sci. Plant Nutr. 66, 76–83. doi: 10.1080/00380768.2019.1676135
Munasinghe, M. (1995). Making economic growth more sustainable. Ecol. Econ. 15, 121–124. doi: 10.1016/0921-8009(95)00066-6
Nahar, N., Hossain, Z., and Mahiuddin, S. (2023). Assessment of the environmental perceptions, attitudes, and awareness of city dwellers regarding sustainable urban environmental management: a case study of Dhaka, Bangladesh. Environ. Dev. Sustain. 25, 7503–7531. doi: 10.1007/s10668-022-02354-y
Najm, S. (2019). The green paradox and budgetary institutions. Energy Policy 133:110846. doi: 10.1016/j.enpol.2019.06.054
Neves, S. A., Marques, A. C., and Patrício, M. (2020). Determinants of CO2 emissions in European Union countries: does environmental regulation reduce environmental pollution? Econ. Anal. Policy 68, 114–125. doi: 10.1016/j.eap.2020.09.005
Niu, C., Li, Y., and Yan, X. T. (2022). “Sustainable mechatronic solution for agricultural precision farming inspired by space robotics technologies” in Eco mechatronics: Challenges for evolution, development and sustainability (Cham: Springer International Publishing), 177–194.
Oliveira, L. F., Moreira, A. P., and Silva, M. F. (2021). Advances in agriculture robotics: a state-of-the-art review and challenges ahead. Robotics 10:52. doi: 10.3390/robotics10020052
Opoku, E. E. O., Dogah, K. E., and Aluko, O. A. (2022). The contribution of human development towards environmental sustainability. Energy Econ. 106:105782. doi: 10.1016/j.eneco.2021.105782
Ouyang, X., Shao, Q., Zhu, X., He, Q., Xiang, C., and Wei, G. (2019). Environmental regulation, economic growth and air pollution: panel threshold analysis for OECD countries. Sci. Total Environ. 657, 234–241. doi: 10.1016/j.scitotenv.2018.12.056
Pargal, S., and Wheeler, D. (1996). Informal regulation of industrial pollution in developing countries: evidence from Indonesia. J. Polit. Econ. 104, 1314–1327. doi: 10.1086/262061
Pata, U. K. (2021). Renewable and non-renewable energy consumption, economic complexity, CO 2 emissions, and ecological footprint in the USA: testing the EKC hypothesis with a structural break. Environ. Sci. Pollut. Res. 28, 846–861. doi: 10.1007/s11356-020-10446-3
Pata, U. K., Kartal, M. T., Erdogan, S., and Sarkodie, S. A. (2023). The role of renewable and nuclear energy R & D expenditures and income on environmental quality in Germany: scrutinizing the EKC and LCC hypotheses with smooth structural changes. Appl. Energy 342:121138. doi: 10.1016/j.apenergy.2023.121138
Pearson, S., Camacho-Villa, T. C., Valluru, R., Gaju, O., Rai, M. C., Gould, I., et al. (2022). Robotics and autonomous systems for net zero agriculture. Curr. Robot. Rep. 3, 57–64. doi: 10.1007/s43154-022-00077-6
Peng, J., Xie, R., Ma, C., and Fu, Y. (2021). Market-based environmental regulation and total factor productivity: evidence from Chinese enterprises. Econ. Model. 95, 394–407. doi: 10.1016/j.econmod.2020.03.006
Peter, M., Diekötter, T., Höffler, T., and Kremer, K. (2021). Biodiversity citizen science: outcomes for the participating citizens. People Nat. 3, 294–311. doi: 10.1002/pan3.10193
Rajan, K., and Saffiotti, A. (2017). Towards a science of integrated AI and robotics. Artif. Intell. 247, 1–9. doi: 10.1016/j.artint.2017.03.003
Ramanathan, R., He, Q., Black, A., Ghobadian, A., and Gallear, D. (2017). Environmental regulations, innovation and firm performance: a revisit of the Porter hypothesis. J. Clean. Prod. 155, 79–92. doi: 10.1016/j.jclepro.2016.08.116
Rehman, A., Rauf, A., Ahmad, M., Chandio, A. A., and Deyuan, Z. (2019). The effect of carbon dioxide emission and the consumption of electrical energy, fossil fuel energy, and renewable energy, on economic performance: evidence from Pakistan. Environ. Sci. Pollut. Res. 26, 21760–21773. doi: 10.1007/s11356-019-05550-y
Ren, S., Li, X., Yuan, B., Li, D., and Chen, X. (2018). The effects of three types of environmental regulation on eco-efficiency: A cross-region analysis in China. J. Clean. Prod. 173, 245–255. doi: 10.1016/j.jclepro.2016.08.113
Rosati, A., Borek, R., and Canali, S. (2021). Agroforestry and organic agriculture. Agrofor. Syst. 95, 805–821. doi: 10.1007/s10457-020-00559-6
Rubashkina, Y., Galeotti, M., and Verdolini, E. (2015). Environmental regulation and competitiveness: empirical evidence on the Porter hypothesis from European manufacturing sectors. Energy Policy 83, 288–300. doi: 10.1016/j.enpol.2015.02.014
Shen, J., Wei, Y. D., and Yang, Z. (2017). The impact of environmental regulations on the location of pollution-intensive industries in China. J. Clean. Prod. 148, 785–794. doi: 10.1016/j.jclepro.2017.02.050
Shi, B., Feng, C., Qiu, M., and Ekeland, A. (2018). Innovation suppression and migration effect: the unintentional consequences of environmental regulation. China Econ. Rev. 49, 1–23. doi: 10.1016/j.chieco.2017.12.007
Singh, R., and Khanna, V. (2021). “Climate change and food systems: implications on food security,” in Climate change and resilient food systems. eds. V. K. Hebsale Mallappa and M. Shirur (Singapore: Springer), 73–111.
Smith, K. K. (2021). African American environmental thought: Foundations. Lawrence, KS: University Press of Kansas.
Smith, P., Bustamante, M., Ahammad, H., Clark, H., Dong, H., Elsiddig, E. A., et al. (2014). “Agriculture, forestry and other land use (AFOLU)” in Climate change 2014: Mitigation of climate change. Contribution of working group III to the fifth assessment report of the intergovernmental panel on climate change (Cambridge: Cambridge University Press), 811–922.
Sodikjanov, J. S., and Khayitboyev, Q. A. (2023). Research of software-hardware of industrial robots. Texas J. Eng. Technol. 22, 13–16.
Song, J., Chen, Y., and Luan, F. (2023). Air pollution, water pollution, and robots: is technology the panacea. J. Environ. Manag. 330:117170. doi: 10.1016/j.jenvman.2022.117170
Song, M., Wang, S., and Zhang, H. (2020). Could environmental regulation and R &D tax incentives affect green product innovation? J. Clean. Prod. 258:120849. doi: 10.1016/j.jclepro.2020.120849
Sophocleous, M., Lessi, C., Xu, Z., Špaňhel, J., Qiu, R., Lendinez, A., et al. (2022). “AI-driven intent-based networking for 5G enhanced robot autonomy” in IFIP international conference on artificial intelligence applications and innovations (Cham: Springer International Publishing), 61–70.
Sorrell, S. (2020). Digitalisation of goods: a systematic review of the determinants and magnitude of the impacts on energy consumption. Environ. Res. Lett. 15:043001. doi: 10.1088/1748-9326/ab6788
Stocker, T. (2014). Climate change 2013: The physical science basis: Working group I contribution to the fifth assessment report of the intergovernmental panel on climate change. Cambridge: Cambridge university press.
Sumberg, J., and Giller, K. E. (2022). What is ‘conventional’agriculture? Glob. Food Sec. 32:100617. doi: 10.1016/j.gfs.2022.100617
Tang, K., He, C., Ma, C., and Wang, D. (2019). Does carbon farming provide a cost-effective option to mitigate GHG emissions? Evidence from China. Aust. J. Agric. Resour. Econ. 63, 575–592. doi: 10.1111/1467-8489.12306
Torres, M. A. O., Kallas, Z., and Herrera, S. I. O. (2020). Farmers’ environmental perceptions and preferences regarding climate change adaptation and mitigation actions; towards a sustainable agricultural system in México. Land Use Policy 99:105031. doi: 10.1016/j.landusepol.2020.105031
Van der Ploeg, F., and Withagen, C. (2015). Global warming and the green paradox: a review of adverse effects of climate policies. Rev. Environ. Econ. Policy 9, 1–29. doi: 10.1093/reep/rev008
van Loon, M. P., Hijbeek, R., Ten Berge, H. F., De Sy, V., Ten Broeke, G. A., Solomon, D., et al. (2019). Impacts of intensifying or expanding cereal cropping in sub-Saharan Africa on greenhouse gas emissions and food security. Glob. Chang. Biol. 25, 3720–3730. doi: 10.1111/gcb.14783
Van Rooij, B. (2006). Implementation of Chinese environmental law: regular enforcement and political campaigns. Dev. Chang. 37, 57–74. doi: 10.1111/j.0012-155X.2006.00469.x
Wang, B., and Zhang, W. (2016). A research of agricultural eco-efficiency measure in China and space-time differences. China Popul. Resour. Environ. 26, 11–19. (In Chinese)
Wang, Q., Wang, L., and Li, R. (2023a). Trade protectionism jeopardizes carbon neutrality–decoupling and breakpoints roles of trade openness. Sustain. Product. Consump. 35, 201–215. doi: 10.1016/j.spc.2022.08.034
Wang, Q., Yang, T., and Li, R. (2023b). Does income inequality reshape the environmental Kuznets curve (EKC) hypothesis? A nonlinear panel data analysis. Environ. Res. 216:114575. doi: 10.1016/j.envres.2022.114575
Wang, X., Zhang, T., Nathwani, J., Yang, F., and Shao, Q. (2022). Environmental regulation, technology innovation, and low carbon development: revisiting the EKC hypothesis, Porter hypothesis, and Jevons’ paradox in China's iron & steel industry. Technol. Forecast. Soc. Chang. 176:121471. doi: 10.1016/j.techfore.2022.121471
Wen, H., and Dai, J. (2021). The change of sources of growth and sustainable development in China: based on the extended EKC explanation. Sustain. For. 13:2803. doi: 10.3390/su13052803
West, T. O., and Marland, G. (2002a). A synthesis of carbon sequestration, carbon emissions, and net carbon flux in agriculture: comparing tillage practices in the United States. Agric. Ecosyst. Environ. 91, 217–232. doi: 10.1016/S0167-8809(01)00233-X
West, T. O., and Marland, G. (2002b). Net carbon flux from agricultural ecosystems: methodology for full carbon cycle analyses. Environ. Pollut. 116, 439–444. doi: 10.1016/S0269-7491(01)00221-4
Whitburn, J., Linklater, W. L., and Milfont, T. L. (2019). Exposure to urban nature and tree planting are related to pro-environmental behavior via connection to nature, the use of nature for psychological restoration, and environmental attitudes. Environ. Behav. 51, 787–810. doi: 10.1177/0013916517751009
Xu, N., Zhang, W., Li, H., and Chen, W. (2023). Fiscal support and carbon productivity of agriculture—empirical evidence from China. Ener. Environ. :0958305X2311516. doi: 10.1177/0958305X231151683
Yang, Q., Huang, T., Chen, F., Uche, J., Wang, Y., Yuan, P., et al. (2022). Water saving potential for large-scale photovoltaic power generation in China: based on life cycle assessment. Renew. Sust. Energ. Rev. 167:112681. doi: 10.1016/j.rser.2022.112681
Yan, X., Zhu, B., and Ma, C. (2020). Employment under robot impact: evidence from China manufacturing. Statistical Research 37, 74–87. (In Chinese)
Yapici, G., Ögenler, O., Kurt, A. Ö., Koçaş, F., and Şaşmaz, T. (2017). Assessment of environmental attitudes and risk perceptions among university students in Mersin, Turkey. J. Environ. Public Health 2017, 1–8. doi: 10.1155/2017/5650926
Yilanci, V., Gorus, M. S., and Andreoni, V. (2023). Reinvestigation of the validity of the EKC hypothesis extended with energy: A time-varying analysis for the United Kingdom. J. Clean. Prod. 428:139284. doi: 10.1016/j.jclepro.2023.139284
Yin, J., Zheng, M., and Chen, J. (2015). Assessment of environmental attitudes and risk perceptions among university students in Mersin, Turkey. J. Environ. Public Health, 2017, 1–8. doi: 10.1155/2017/5650926
Yu, X., and Wang, P. (2021). Economic effects analysis of environmental regulation policy in the process of industrial structure upgrading: evidence from Chinese provincial panel data. Sci. Total Environ. 753:142004. doi: 10.1016/j.scitotenv.2020.142004
Zhang, D., Shen, J., Zhang, F., Li, Y. E., and Zhang, W. (2017). Carbon footprint of grain production in China. Sci. Rep. 7:4126. doi: 10.1038/s41598-017-04182-x
Zhang, H., Zhou, F., Yang, H., and Guo, Q. (2009). Regulation performance of the win-win of environmental protection and economic development. Econ. Res. J. 44, 14–26+67. (In Chinese)
Zhang, J., and Fu, X. (2008). FDI and environmental regulations in China. J. Asia Pac. Econ. 13, 332–353. doi: 10.1080/13547860802131326
Zhang, M., and Huang, M. (2023). Study on the impact of informal environmental regulation on substantive green innovation in China: Evidence from PITI disclosure. Environ. Sci. Pollut. Res. 30, 10444–10456. doi: 10.1007/s11356-022-22868-2
Zhang, N. (2021). A cloud-based platform for big data-driven cps modeling of robots. IEEE Access 9, 34667–34680. doi: 10.1109/ACCESS.2021.3061477
Zhang, Y., Chen, X., Wu, Y., Shuai, C., and Shen, L. (2019). The environmental Kuznets curve of CO2 emissions in the manufacturing and construction industries: a global empirical analysis. Environ. Impact Assess. Rev. 79:106303. doi: 10.1016/j.eiar.2019.106303
Zheng, R., Wu, G., Cheng, Y., Liu, H., Wang, Y., and Wang, X. (2023). How does digitalization drive carbon emissions? The inverted U-shaped effect in China. Environ. Impact Assess. Rev. 102:107203. doi: 10.1016/j.eiar.2023.107203
Zhi, J., and Gao, J. (2009). Analysis of carbon emission caused by food consumption in urban and rural inhabitants in China. Prog. Geogr. 28, 429–434. (In Chinese)
Keywords: agricultural robotics, agricultural carbon emissions, Kuznets curve, formal environmental regulation, informal environmental regulation
Citation: Li Y and Chen Y (2024) Robotics, environmental regulation, and agricultural carbon emissions: an examination of the environmental Kuznets curve theory and moderating effects. Front. Sustain. Food Syst. 8:1336877. doi: 10.3389/fsufs.2024.1336877
Edited by:
Nicolas Merveille, Université du Québec à Montréal, CanadaReviewed by:
Pengzhen Liu, Jinan University, ChinaSalma Mouneer, The Women University, Multan, Pakistan
Copyright © 2024 Li and Chen. This is an open-access article distributed under the terms of the Creative Commons Attribution License (CC BY). The use, distribution or reproduction in other forums is permitted, provided the original author(s) and the copyright owner(s) are credited and that the original publication in this journal is cited, in accordance with accepted academic practice. No use, distribution or reproduction is permitted which does not comply with these terms.
*Correspondence: Yiyan Chen, Y2hlbnlpeWFuQHN0dWRlbnQudXNtLm15