 Joseph Serge Mbarga Evouna
 Ernest L. Molua
 Raoul Fani Djomo Choumbou1
 Perez L. Kemeni Kambiet
- 1Department of Agricultural Economics and Agribusiness, University of Buea, Buea, Cameroon
- 2Centre for Independent Development Research (CIDR), Buea, Cameroon
- 3International Water Research Institute, Mohammed VI Polytechnique University, Benguerir, Morocco
Agrifood markets play a pivotal role in assuring national food security and improved welfare for smallholder farm families. However, the extent to which this is possible depends on the structure and performance of these markets. This study utilizes primary data collected from 326 cassava marketers operating in 15 markets to examine the structure and performance of the cassava market in Cameroon. We employ parametric and non-parametric techniques to determine the degree of market concentration and marketing performance of these cassava marketers. Our findings highlight a high market concentration with a Gini coefficient (GC) of 0.76 and 0.79 for wholesalers and retailers, respectively. This indicates that the cassava market is probably oligopolistic in structure. In addition, we reveal that average marketing efficiency is 14.20% and 87% for retailers and wholesalers, respectively. This indicates that retailers are relatively inefficient as compared to wholesalers. Furthermore, we observed that prices are set up in the markets according to the place of sale and the type of marketers. However, prices are influenced by factors such as transport, the quantity sold in on-spot markets, and the need for liquidity. In general, our results highlight that the region, type of marketer (wholesaler or retailer), and socio-economic factors account significantly for the variation of odds to participate in markets. Hence, to influence the dynamics of price on the consumers, it might be necessary to promulgate policies that could improve retailers' efficiency. This might be through the restructuring of retailers into cooperatives and associations which may permit retailers to access other critical resources.
1 Introduction
There is a resurgent interest in the study of agrifood market price linkages (Akem et al., 2019; Guerrero Lara et al., 2023). This is attributable to the notion that access to the market plays an important role in assuring better income and welfare among smallholders (Ferris et al., 2014; Mmbando et al., 2015; Magesa et al., 2020). Moreover, inaccessibility to the input and output market is a principal inhibitor to smallholders' productivity and regional food security (Nakawuka et al., 2018). This notion has driven research on agrifood linkages to focus on understanding the nature of price signals in regional (Marsden et al., 2019; von Cramon-Taubadel and Goodwin, 2021; Barrett et al., 2022) and international markets (Bitzer et al., 2013; Marsden, 2013; Dou et al., 2020).
Agricultural markets are pivotal for sustainable economic development (World Bank, 2007; Akram-Lodhi, 2008; Veltmeyer, 2009). The Sustainable Development Goal to “end hunger, achieve food security and improved nutrition, and promote sustainable agriculture” (SDG2) recognizes the role of markets in empowering small farmers, promoting gender equality, and ending rural poverty in the Post-2015 Development Agenda. An essential component of any plan aimed at achieving more productive and sustainable agriculture and rural development is to guarantee agricultural and food producers' access to markets that exhibit greater efficiency, transparency, and competitiveness (Nkendah et al., 2007; Mvodo and Liang, 2012a; Neik et al., 2023). Markets have a significant influence on the availability, accessibility, utilization, and stability of food (Mmbando et al., 2017). Efficient agricultural marketing systems can lower food expenses and minimize supply fluctuations, thus enhancing the food security of both impoverished and affluent households (Bitzer et al., 2013; Barrett et al., 2022). Although markets serve as a crucial link, they often fail to function efficiently for both producers and consumers. Expanding interconnected markets present significant prospects for increased revenue, but they also include hazards due to extended food value chains, where external forces exert a stronger influence and smallholder farmers have less control over input and product pricing (Abdou, 2007; Akem et al., 2019). Given the significant transformations occurring in agricultural markets, a crucial concern for development is to improve the involvement of small-scale farmers and guarantee that agricultural expansion will effectively reduce poverty.
However, African agrifoods are inherently inefficient. Most are characterized by a wide range of spot markets with varying prices and undefined rules for market participation. These specificities increase modeling complexity while highlighting the implication of context and market structures in market research. Besides, African agrifood markets are poorly structured due to a lack of the basic infrastructure required to enable the modeling of any perfectly competitive scenario (Fackler and Goodwin, 2001; Barrett and Li, 2002). Market structures and agent interaction greatly determine how price signals are generated and transmitted in agricultural markets (Conforti, 2004; Wilcox and Abbott, 2006; Abdulai, 2007; Rapsomanikis and Mugera, 2011).
This research analyzes the structure and performance of cassava markets in Cameroon. Our interest in cassava is motivated by three main reasons. First, cassava is a highly-ranked staple with an extensive value chain spanning multiple derivatives (James et al., 2012; Wambo et al., 2011; Costa and Delgado, 2019). This attribute gives cassava a favorable income and welfare appeal for smallholder and government investments. Second, cassava is a critical crop for stabilizing the regional food system network and food security. Our assertions are further strengthened by the food security challenges experienced during the recent destabilization of the global value chains of wheat and rice (Ababulgu et al., 2022; Gengenbach et al., 2022; Neik et al., 2023). It should be noted that the cassava value chain employs millions of Africans while providing a suitable alternative to alleviate household welfare. Finally, cassava derivatives, such as starch, are highly integrated into global value chains through their association with the food, pharmaceuticals, and textile industries (Costa and Delgado, 2019; Fernando et al., 2022). Therefore, what happens to the cassava value chain has an implication for both regional and international markets. In this light, our research contributes to three-fold aims. First, we supplement the literature on the African agrifood market with information on the structure and drivers of agent participation in cassava markets in Cameroon. This aspect and those of other “food crops” have some worth that is been neglected in agrifood market research. Most authors focus on the study of “cash crops” such as oil palm, cocoa rubber, banana, or cereals such as maize, rice, and wheat. This is partly because of their GDP implication, relatively structured markets, and the ease of data acquisition for these markets especially when compared to “food crops” such as cassava (Dillon and Dambro, 2017; Akem et al., 2019). Second, we utilize market composition analysis which is an essential complement to static and dynamic regression modeling approaches (Harriss, 1979; Baulch, 1997; Fackler and Goodwin, 2001). Finally, our study utilizes a primary dataset from Cameroon which is considered a miniature of Africa because of its cultural diversity, agro-biodiversity, and the reflexivity of its society to many African contexts. These attributes make it a suitable living laboratory on which many aspects of African socioeconomics can be modeled. This implies that our results can aid policy formulation for agricultural markets in Cameroon and other African countries although with some moderation.
Section 2 includes a brief review of agrifood markets. Section 3 highlights the methodology, while Section 4 discusses the results of this study. Section 5 presents some concluding remarks.
2 African agrifood markets: a review of structure and performance
In developing countries, such as Cameroon, the challenges for agrifood market policies are enormous. Markets are either absent or lack formal market regulatory structures. For example, agricultural markets are relatively less mapped out. As such there is little knowledge of the expected behavior of its participants. There is, however, no identifiable perfectly competitive market in Africa. Rather foodstuffs are moved through complex production, processing, and distribution pathways which demand close attention (Akem et al., 2019). In addition, the poor distribution of basic infrastructure, such as roads, railways, and telecommunication, provides an unlevelled playing field among operators in agrifood markets (Teng and Oliveros, 2016). Information is highly asymmetric, and transaction cost is disproportionately distributed (Fackler and Goodwin, 2001; Barrett and Li, 2002). These conditions have contributed to diverse behavioral patterns between operators in agrifood markets (Lelissa and Kuhil, 2018). The outcome of these market behaviors drives changes in market prices in ways that are not captured within price-centered (transmission-based) models (Fackler and Goodwin, 2001).
According to Harriss (1979) and Udry et al. (1996), understanding market structures precedes price analysis and other forms of analysis. In principle, the analysis of market structures leverages agent market behaviors and conducts tests to assess market competition, price structure, and market performance (Chong and Chan, 2014). Therefore, understanding market structures and agent behavior aids in the modeling and interpretation of many dynamic market integration models. However, research has often neglected this aspect (Dillon and Dambro, 2017; Akem et al., 2019). It is important to focus on context and without proper market contextualization, these models present spurious market integration results that have policy implications (Fackler and Goodwin, 2001; Akem et al., 2019). Fackler and Goodwin (2001) argue that correlation and other integration results are very inefficient.
Headey et al. (2009) noted that economies with integrated and efficient markets progress better than those with inefficient and poorly integrated markets. This view motivated the study of market integration through the modeling of price co-movement as a prerequisite for the stabilization of agrifood markets in most countries. This premise has however been criticized. Studies (Akem et al., 2019; Deconinck, 2021) suggest that price-based approaches are misleading in African agrifood markets because prices in agrifood markets are a summation of transaction and transportation costs. These are not fixed prices, especially in developing countries. The above variables are also difficult to fit within static and dynamic integration models. Bonanno et al. (2018) suggest that market integration is a necessary but not sufficient condition for market efficiency. Nonetheless, most studies (Abdulai, 2007; Minot, 2011; Myers and Jayne, 2012; Abidoye and Labuschagne, 2014; Burke and Myers, 2014; Fricke and Muratori, 2017; Nakawuka et al., 2018; Pierre and Kaminski, 2019; Tsowou and Gayi, 2019) in the region are focused on analyzing market integration and efficiency. Many studies in developing countries, such as Africa and Asia, utilize regression (Abdulai, 2000; Tostão and Brorsen, 2005; Myers, 2013; Minten et al., 2014) and correlation (Harriss, 1979; Ravallion, 1986; Goodwin and Schroeder, 1991; Rosenzweig and Binswanger, 1993; Chaudhuri and Ligas, 2009) analyses of pricing to highlight some semblance of market efficiency or market performance. However, the results of these models are influenced by other fundamental factors peculiar to each market (Harriss, 1979; Merton, 1987; Goldenberg et al., 2001). Prices reflect the inherent behavior and conduct of market agents (Harriss, 1979). As such, using price transmission as a measure of market efficiency and performance might be desirable, but it provides little information on the underlying construct of the drivers of market prices. The implication is that many price transmission-based models are ineffective in explaining the realities of many unstructured and dynamic markets.
In Cameroon, studies have used autoregressive lag models and vector error correction models to analyze livestock (Ukum et al., 2018; Akem et al., 2019), banana (Nkendah et al., 2007), cocoa (Kamdem et al., 2010), and oil palm markets (Akem et al., 2019). To the best of our knowledge no study has utilized node-point market margin approaches to study cassava markets. At best, Mvodo and Liang (2012a,b) and Pierre and Kaminski (2019) have attempted to provide some analysis of cassava markets using swot analysis and linear regression models. These methods generally highlight the general nature and challenges of cassava markets but provide little information on the dynamics of power within nodes in the agrifood. Our study fills this gap by providing information on the structure and distribution of market power and the key drivers of market participation among actors in this market. Thus, providing relevant information which is needed for the design of more efficient cassava agrifood policies.
3 Methodology
3.1 Study area
This study utilizes primary data from the Center, Littoral, and West regions of Cameroon. Cameroon is located between latitude 2°N to 13°N and longitude 8°25°E and 16°20°E in the Central African subregion. It opens to the Atlantic Ocean in the west with a total coastline of 402 km. It is bounded to the west by Nigeria, northeast by Chad, south by Gabon, DR Congo, and Equatorial Guinea, and to the east by Central African Republic. It has a total surface area of 475,650 km which is distributed into five agroecological zones in ten geographical regions (MINFOF, 2018). The most notable zones are the Sudano-Sahelian, High Guinea Savannah, Western Highland, Monomodal Humid Rainforest, and the Bimodal Rainforest (Figure 1). This agroecological diversity permits the growth of most crops that characterize other African nations hence the name-tag “Africa in miniature” (MINEPDED, 2017). By this natural virtue over other African nations, Cameroon has become the breadbasket of Central Africa and supplies to Gabon, Central African Republic, Equatorial Guinea, and Tchad, as well as neighboring Nigeria to the West.
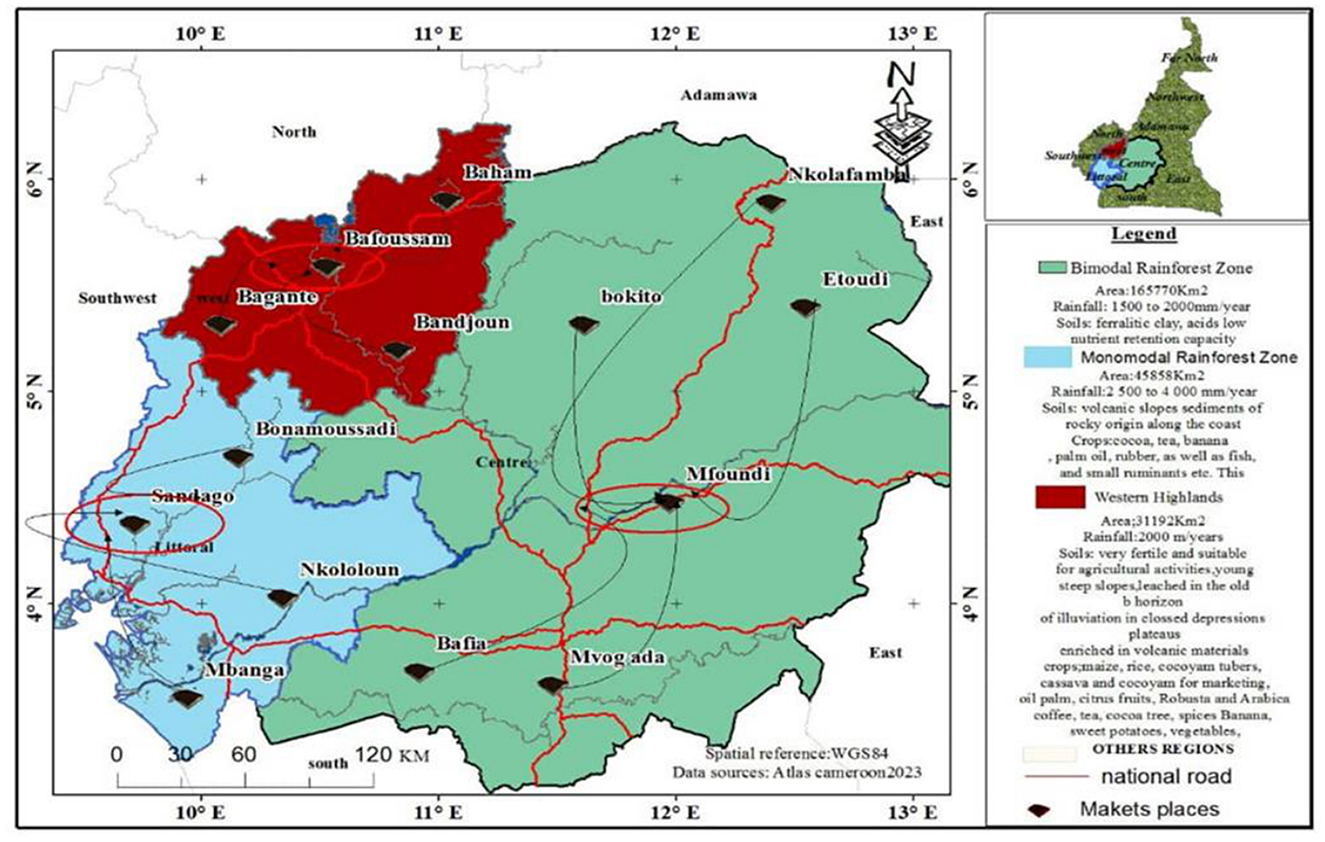
Figure 1. A map of Cameroon showing the selected study area and location of markets. Source: Constructed from Atlas-foret dataset Cameroon, 2023.
Our study covers the West, Northwest (Western highlands); the Littoral and Southwest (Monomodal Humid Rainforest); the Center, East, and South (Bimodal Humid Rainforest) regions of Cameroon (MINRESI, 2007; MINADER, 2012). These three agroecology zones were chosen because they have a characteristic tropical climate of two seasons (a rainy season and a dry season), which permits the cultivation of cassava (Molua and Lambi, 2006). Apart from the favorable climate for cassava production, these areas also harbor the largest markets for retail and wholesale of cassava produce (Yaoundé, Douala, and Bafoussam) and its derivatives. Furthermore, the “main” markets of these areas are interconnected by accessible roads. Thus, making it ideal for our analysis.
3.2 Sampling techniques and source of data
A three-stage sampling procedure was used. Center, Littoral, and West regions were purposively selected in the first stage based on the intensity or volume of cassava marketed per year. Using data from MINADER (2012) on cassava trade volume per region, in the second stage, we selected 15 markets as follows: Mvog-Ada, Mfoundi, Etoudi, Nkolafamba, Bafia, Bokito, Mvog-Mbi, Sandago, Nkololoun, Bonamoussadi, Mbanga, Bafoussam, Baham, Bagangte, and Bandjoun. In the third stage, we utilized information from the cassava vendor association of each region to establish a proportional sampling frame based on the relative distributions of retailers and wholesalers of cassava within our choice markets. In the end, a total of 400 vendors were studied. After cleaning, however, only 326 were identified to be complete and suitable for analysis.
A structured pretested questionnaire was the main survey instrument for the data collection. The questionnaires were administered by well-trained enumerators who were conversant with the local market “terminologies.” To ensure consistency of information, the enumerators conducted face-to-face interviews where the market agent was recorded directly. This information was further supplemented by key informant interviews with stakeholders in the various regions. This aspect involves holding open-ended interviews with randomly selected key stakeholders in the cassava vendor association, cooperatives, and the Ministry of Agriculture. These interviews were later transcribed word verbatim in French or English depending on the preferred language of the interviewee. Table 1 summarizes the proportion of wholesalers and retailers sampled per region.
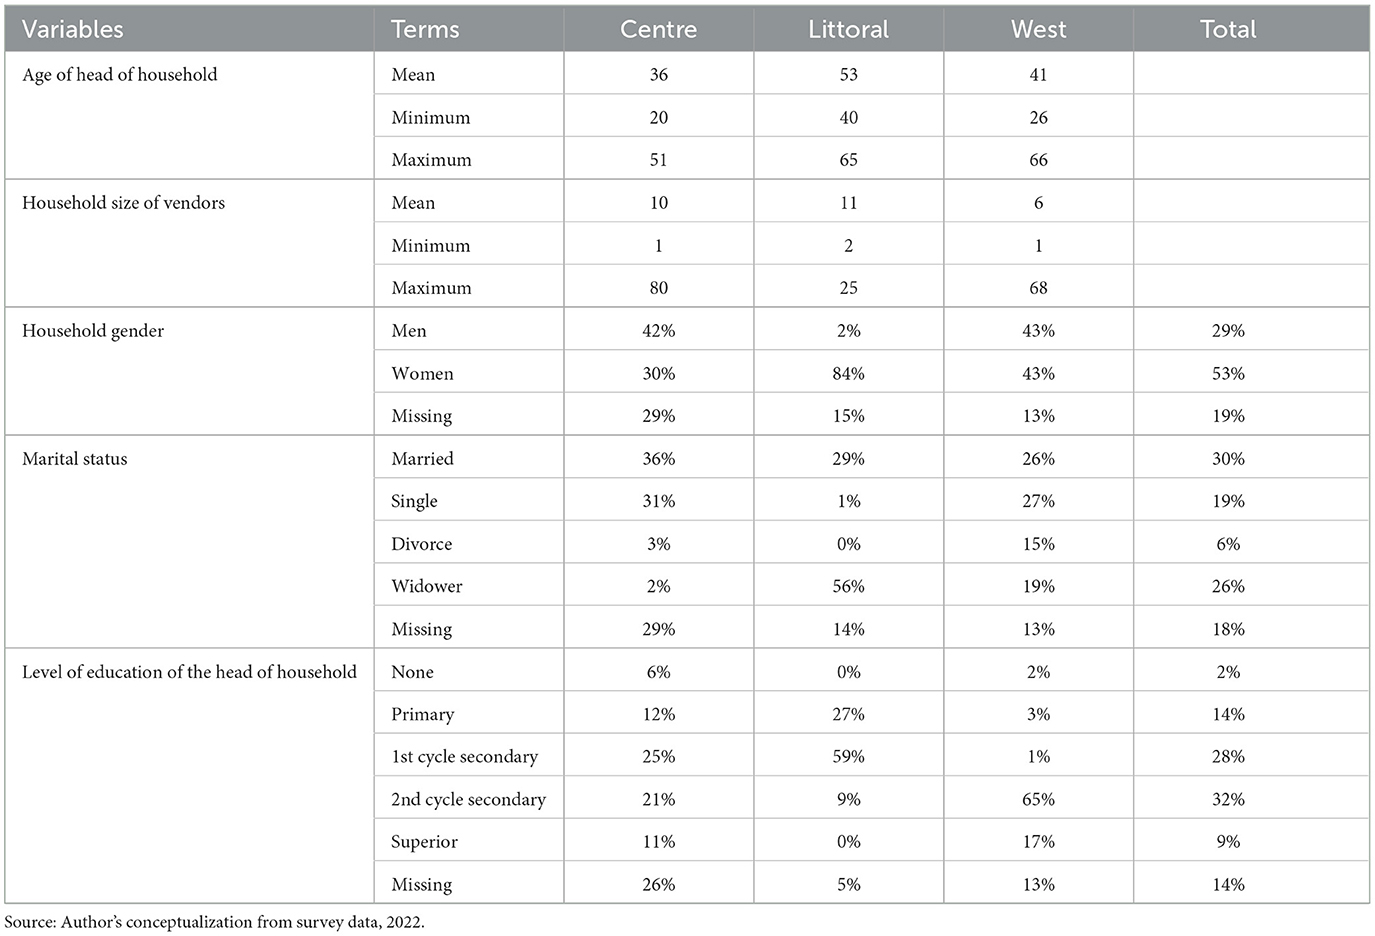
Table 1. The number of marketers interviewed per region.
3.3 Theoretical framework
Our framework is inspired by the Bain-Labini-Modigliani limit-output theory. Their theory asserts that for a given market where products are undifferentiated and there is a sequential entry of new competing firms, established firms turn to set market prices (“limit-prices”) below the market equilibrium when entry is imminent. This limit price serves as a deterrent against future entrants while assuring long run profit maximization for established firms. We postulate a static model where firms adopt a limit price to maximize expected profits over an infinite horizon prior to the time when entry is uncertain.
The approach involves a multistage game between the entrant firms and the established firms (Baron, 1973; Eaton and Ware, 1987) but its success depends on a set of assumptions:
• All firms aim to maximize their long run profit despite operating in a market of undifferentiated products with inverse production function where is an aggregated output.
• Second, the function is twice differentiable and and .
• Furthermore, for all , where is the output of firm i. In this way, the marginal revenue and profits of any firm are decreasing in any other firm's output.
• In addition, for any firm i the cost function is Where F(ki) is the cost of capacity ki. This capacity is sunk cost once incurred but there exists a possibility of producing output at constant variable cost V per unit, up to capacity ki.
• Equally, F(0) = 0; F(ki) > 0, for ki > 0;F(ki) > F(k0), for ki > k0; and , for ki > k0 such that capacity costs are increasing in ki but average capacity costs are decreasing in ki.
• Finally, given that excess capacity is not a barrier in this model, it implies that any firm i determines its necessary and sufficient entry conditions (for profit maximization) based on a predetermined capacity and inherent market prices of the first (i − 1) firm.
In this light, if we consider Kn firms in the end of the (n − 1) period, an established firm chose a period n with pn(Kn) limit price conditional on the number of established firms. For any n period, kn entrant firms may decide to enter a market by playing a form of Cournot subgame. Entrant firms use their knowledge of the limit price and the number of established firms to decide whether to play the game. On the contrary, under the same game, the established firm attempts to preserve its long-term profitability by altering its price for the next period and hence chooses a price pn+1(Kn+1) for the period (n+1) where Kn+1 = Kn+ kn. Thus, the profitability of established firms in period n depends on the number of entrant firms in this period. Specifically, if no firm enters the market, then (kn = 0), Kn+1 = Kn and profit is maintained as denoted by πn(pn(Kn), Kn). On the other hand, if firm(s) enter (kn > 0) at period n, then the profit of established firms decreases such that the postentry profit is given by πn(Kn+1) < πn(pn(Kn), Kn) for any Kn+1 > Kn, where πn(Kn+1) is assumed constant and independent of any pre-entry prices. The postentry profit reflects the short run reaction of the established firms to entry, while their complete reaction is to choose a price pn+1(Kn+1) in the next period of the game such that new entrants may be discouraged or forced out of the market. This is especially true since the assumed sunk cost of entry has a bearing on the computation of their profit function. The model establishes the path that links firm profitability to market concentration in Cournot markets.
3.4 Measurement of market structure, conduct, and performance
In this study, we utilize the Gini coefficient (GC), Market efficiency (ME), and Lorenz curve to estimate the structure of cassava markets from their market concentration. In concept, market concentration captures the dynamics of market players. Specifically, it depicts the extent to which market shares are distributed among firms in each market. Unfortunately, the picture is sometimes considered imperfect since it omits other factors such as entry barriers, product differentiation, and innovation (Baagyere et al., 2023). From this premise, it is recommended that most market concentration analyses be associated with other complimentary analyses, which will clarify the market snapshot.
In our context, we employ GC, ME, and Lorenz curves, as well as a multinomial logistic model, to analyze the cassava market structure. The multinomial model is used to evaluate inherent market factors which are omitted in most market concentration models while GC and Lorenz curves are used to examine the market concentration. According to the Food and Agricultural Organization (FAO, 2006), using the GC and Lorenz curve enables an evaluation of the level of inequality or equality in the sales volume (sales capacity) and realized income among the sellers within a market. This approach has also been used by Thu et al. (2020) to analyze the tuna value chain.
As in Thu et al. (2020), the basic estimation model for GC is given as follows
Where i(1, 2, 3, …..n) represents the number of firms (cassava sellers) while xi denotes the percentage of cassava sellers in the market, and yi represents the cumulative proportion of cassava sales for i sellers in the market. As mentioned above, GC represents the Gini coefficient. Bukar et al. (2015) and Bannor et al. (2018) assert that GC values approaching 0 indicate perfect equality and perfect competition (no difference in market shares) between market participants while median values indicate oligopolistic or structures of monopolistic competition. On the other hand, values approaching 1 indicate perfect inequality and monopolistic market structures. To better appreciate the outcome, the generated non-aggregated GCs are represented on a Lorenz curve. A Lorenz curve closer to the line of equality indicates equality among the market participants and a Lorenz curve further from the line of perfect equality indicates inequality among the market participants.
Given that our aim is to depict a clear snapshot of the cassava market, we augmented GC with marginal efficiency analysis. ME, generally, permits the measurement of intermediary value addition which is omitted in other concentration models (Haruna et al., 2012; Jeyanthi, 2018). In essence, following Jeyanthi (2018), the basic Shephard model for market efficiency is given as follows:
Assuming marketing cost is represented by total cost as
Marketing margin is represented by total revenues from sales (total value product);
Then the model could be rewritten as follows:
Where F represents the entry cost which is mostly sunk and V represents the variable cost of the firm (cassava seller). ki and pi represent the capacity (the quantity of cassava volume) and price per unit for every i, for every cassava seller in the market. Like GC, when values of ME approach 0 it indicates perfect competition among market participants. Whereas, when ME approaches 100 it indicates a situation of perfect monopoly. Median values equally indicate varying degrees of oligopolistic competition.
Finally, to estimate a multinomial logistic model to estimate the barriers to market entry and exit, we estimate a multinomial logistic model which is given as follows:
Where the In(.) parameter evaluates the log likelihood of selecting a desired market (either farmgate, local village market, or central market) and K is the reference group. In our case, let us assume K as a farmgate market. In that case, j = 1 if the individual participates in a central or village market over a farmgate market, and j = 0 if otherwise. The result is evaluated against xi, which represents ith predictor variable. βi also represents the coefficient estimates of the ith predictor. This approach is highly desirable where dependent variables have multiple categories (Midi et al., 2011). Moreover, the computed maximum likelihood permits the computation of various scenarios despite the size of available data, and to some extent, it is based on a strong normality assumption which makes its results more robust as compared to other multiclass models.
4 Results and discussion
4.1 Socio-demographic characteristics of cassava traders
Table 2 summarizes the relative distribution of individual characteristics of the sampled vendors. From the table, cassava markets are dominated by young people and slightly elder people with an average age ranging from 36 years in the Center to 53 years in the Littoral region. Most marketers are in their economically active growth period. Penningroth and Scott (2019) attest that young people and economically active people are usually self-motivated and innovative thus explaining their drive to embrace new opportunities in the cassava agrifood market. The distribution indicates high household sizes with an average of nine persons per household in the pooled study area. This value is higher for the Littoral and Center regions, which might explain their relatively higher engagement in cassava marketing. The Littoral and Center regions host the economic and political capitals of the nation and have larger household sizes which might imply increased pressure on household food security (Table 2). These factors drive marketers to grab new market opportunities to improve household welfare (Agbugba and Obi, 2013; Olagunju et al., 2020). Furthermore, larger households provide available labor necessary for the efficient coordination of marketing operations.
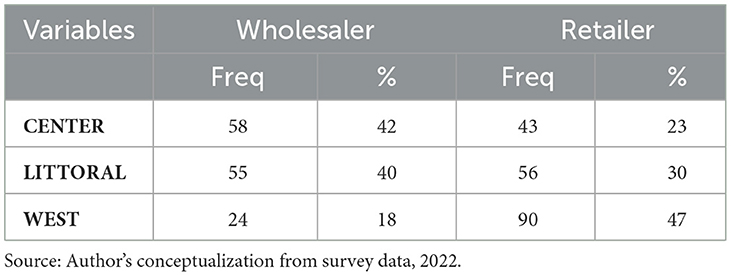
Table 2. General information and socio-demographic characteristics of respondents.
Women were more involved in cassava marketing than men. On average, 53% of the surveyed marketers were women, while 29% were men, and 19% is missing data. This could be due to the relative skewed distribution of economic opportunities between women and men. With men having more opportunities, they are free to choose other segments and industries to be employed. This is not the case for women as such they are more likely to hop on any “neglected” market “leftovers.” Baagyere et al. (2023) highlight similar results with women in the chicken egg market in Northern Ghana.
On average, 30% of cassava marketers were married, while 26% were widowed, 19% were single, 6% were divorced, and 18% corresponds to missing data. Specifically, in the West region, the marital status showed that 67% of the marketers were married. In the Littoral region, the results showed that 45% of the marketers were married. In the Center region, the results showed that 40% of the marketers were married. According to Anjikwi et al. (2020), marriage brings stability to the activity and could lead to higher productivity. In some cases, married women benefit from their partners' networks and resources to enhance their activities. In addition, engaging in cassava marketing for a married woman might serve as a suitable household income and welfare diversification strategy (Anjikwi et al., 2020).
Cassava marketers are averagely educated. Over 98% have at least gone through the primary education which may imply most marketers can read and write. A level of education is critical for cassava marketers as it might enable them to track market trends of cassava prices, and this increases their ability to develop market strategies. Ammanuel (2020) highlights that the education of sorghum marketers in Benue State played a crucial role in their market participation. In addition, Nkamigbo (2019) observed that educated people are more enlightened, well conversant with efficient marketing of their marketable surplus and hence can reduce marketable loss.
4.2 Market power, structure and performance of cassava traders
The market power and structure of cassava markets are described based on the volume of sales from the market. The results in Tables 3, 4 show the volume of sales from the marketing of cassava. For the pooled retailers, the findings indicate that the cassava market is highly concentrated at the retail level, reflecting an uncompetitive condition. This may be the result of collusive practices in buying and selling and differences in the degree of risk involved in sourcing suppliers by different type of marketers. Although there was a relatively high income inequality in both markets, we observed that the level of concentration in retailing (0.79) was higher than in wholesaling (0.76). This finding is in line with those of previous studies (Haruna et al., 2012; Ahmed et al., 2018) which highlighted that the Gini coefficient >0.5 indicates an unequal distribution of sales among market participants.
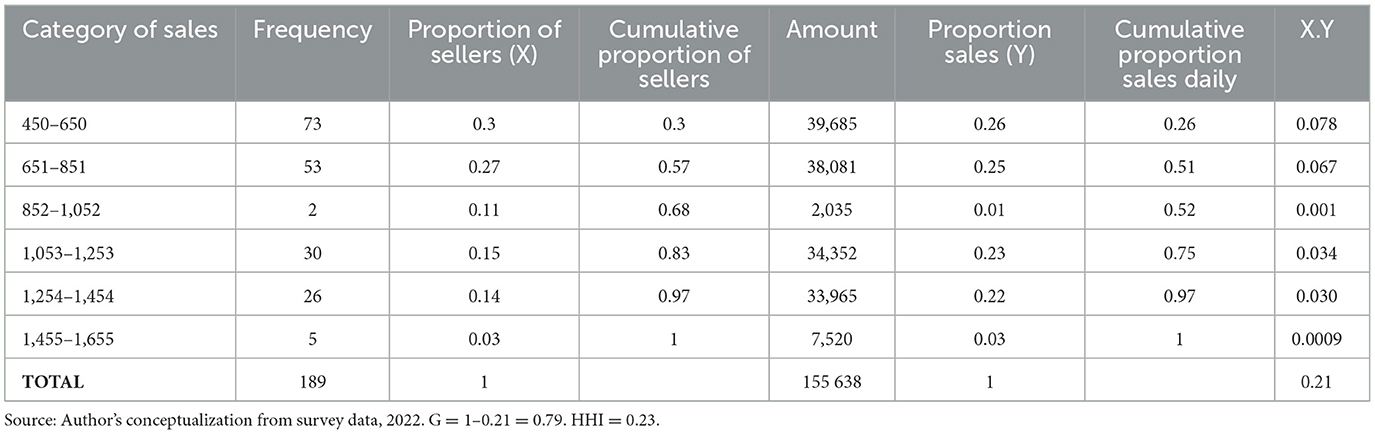
Table 3. Pooled sample for retailers.
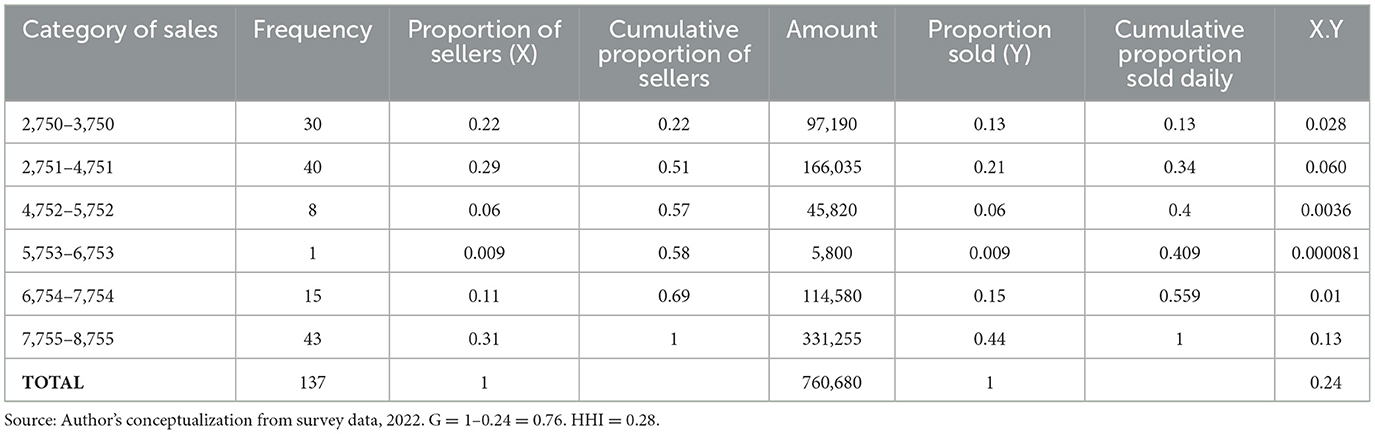
Table 4. Pooled sample for wholesalers.
Specifically, the result indicated that marketers in the Center region within the sales range of 650–851 constituted 96% of the total respondents and earned 25,646 FCFA (USD42.7),1 and the Gini coefficient was 0.12. Marketers in the Littoral region within the sales range of 1254–1454 (which constitutes 37% of the total respondents) earned 17,000 FCFA (USD28.3), and the Gini coefficient was 0.48. Marketers in the West region within the sales range of 450–650 (which constitutes 65% of the total respondents) earned 46,705 FCFA (USD77.8). For the pooled sample analysis of retailers, the Gini coefficient was 0.93. This implies that the cassava retail market is perfectly competitive. That is, there are relatively many retailers in the market such that none of them had control over the largest portion of total sales.
The resulting Lorenz curve of Figure 2 depicts a similar equality scenario for retailers. The x-axis (highlighted as p) represents the percentage of market participants while the y-axis [indicated by L(p)] highlights the market share fraction occupied by these participants. The graph however shows that the level of inequality is higher for the bottom 30% of the market participants as compared to the top 70%. The kink effectively highlights this divide where we observe that the bottom 30% have access to < 10% of the market, whereas the remaining 90% of the market share is split almost equally between the top 70%. This result supports the notion of an unequal market as presented in Table 3. Precisely, it highlights a new caveat of inequality in the bottom 30% of the retail markets, which was shadowed in the marginal analysis. The kink might also suggest a market trap (barrier) that prevents agents from taking advantage of the opportunities within the agrifood market.
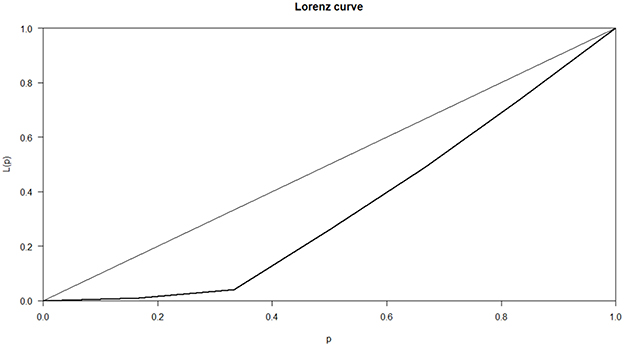
Figure 2. Lorenz curve for retailers. Source: Author's conceptualization from survey data, 2022.
The results of a pooled sample of wholesalers indicate similar trends as those in the retail market but the market is segregated, and the income gap is wider between groups.
Specifically, the result indicated that marketers in the Center region within the sales range of 7,755–8,755 (which constituted 74% of the total respondents) earned 339,225 FCFA (USD565.4), and the Gini coefficient was 0.61. While marketers in the Littoral region within the sales range of 2,751–4,751 (which constituted 62% of the total respondents) earned 137,530 FCFA (USD229.2), and the Gini coefficient was 0.55. Marketers in the West region within the sales range of 2,750–3,750 (which constituted 58% of the total respondents) earned 46,705 FCFA (USD77.8), and the Gini coefficient was 0.35. This implies that the cassava wholesale market was perfectly competitive. This is reflected the existence of many small-scale producers and suppliers of the produce with the result that none of them could influence supplies by either increasing or decreasing the quantity supplied to influence price. The result of the analysis is similar to the findings of Mafimisebi et al. (2006) in the analysis of palm oil marketing in Osun state which shows a Gini coefficient of 0.47 indicating a low level of inequality in sellers' income levels.
The segregation within wholesaler markets is well depicted in the Lorenz curve of Figure 3. The curve highlights three kinks (inflection points), notably 20%, 40%, and approximately 80%, each associated with a market share. In this case, the bottom 20% corresponds to approximately 4% of the market share while the bottom 40% occupies <20% of the market share. The remaining 60% of the market is unequally split by the top 60%. From the 80% inflection point, the top 20% controls over 50% of the market share. These results indicate a higher within market inequality among wholesalers which is far higher than what is observed with retailers despite the pooled Gini coefficient results of Tables 3, 4.
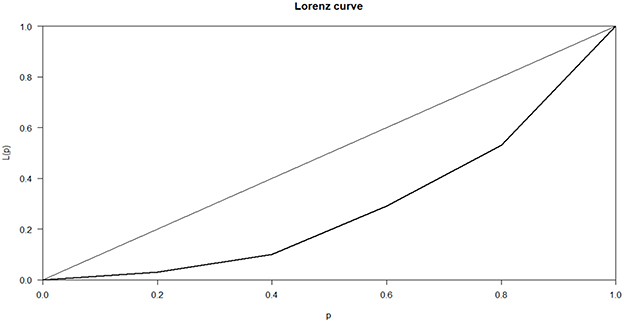
Figure 3. Lorenz curve for wholesalers. Source: Author's conceptualization from survey data, 2022.
4.3 Market efficiency and performance
The pooled findings show that the marketing efficiency (ME) of retailers ranges between 1.42 and 6.31 with an average and standard deviation of 3.21 and 0.99, respectively. Specifically, in the Center region, findings show that ME ranges between 2.88 and 6.31 with an average and standard deviation of 4.42 and 0.73, respectively. In the Littoral region, findings show that ME ranges between 1.94 and 3.6 with an average and standard deviation of 2.76 and 0.43, respectively. In the West region, we find that ME ranges between 1.42 and 5 with the average and standard deviation of 2.90 and 0.89, respectively. The values indicate that retailers are efficient despite the challenges and unequal distribution of market shares among participants. Our findings corroborate the results obtained by Haruna et al. (2012) and Adegbite and Adejobi (2018) who analyzed tomato traders in Pwalugu in Ghana. Table 5 summarizes the results of the ME of retailers.
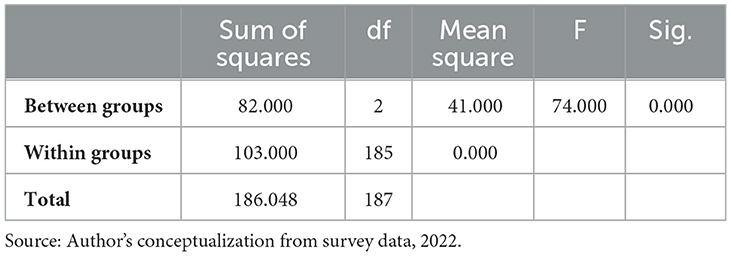
Table 5. Marketing efficiency (ME) of retailer.
The pooled findings show that the ME of wholesalers ranges between 0.87 and 8.22 with the average and standard deviation of 2.88 and 1.72, respectively. Specifically, in the Center region, our findings show that ME ranges between 3.16 and 8.22 with an average and standard deviation of 4.64 and 1.15, respectively. In the Littoral region, we observe that ME ranges between 0.87 and 1.91 with an average and standard deviation of 1.34 and 0.22, respectively, and in the West region, our findings indicate that ME ranges between 1.48 and 3.62 with the average and standard deviation of 2.2 and 0.62, respectively. Wholesalers are thus efficient despite existing market inequality. This finding is in line with Ojo et al. (2016) who reported marketing efficiency of tomato marketing as low as 24.87% and 10.07% in Abuja Municipal. Table 6 summarizes the results of the ME of wholesalers. Table 6 highlights a significant mean square difference for both retail and wholesale cassava markets. The mean square difference is significant for both the retailers and the wholesalers. This highlights the implicit difference in market structures of the studied regions.
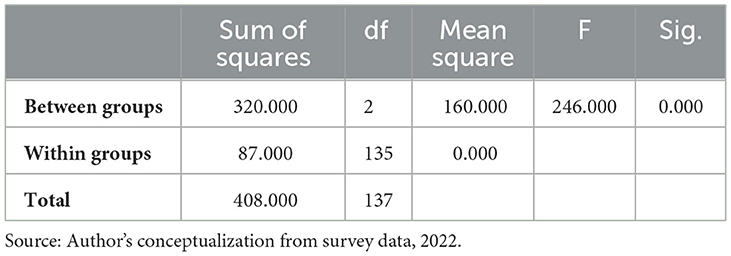
Table 6. Marketing efficiency (ME) of wholesaler.
4.4 Drivers of market participation among market participants
Table 7 highlights the correlates that drive the participation of market agents to engage in either farmgate, town, or central market within the sampled regions. These results should be taken cautiously as correlates only and nothing more. Specifically, our analysis excludes control for endogeneity between market drivers on market participation between agents. From the result, agents' participation in either town or central markets is significantly correlated with the regional location of the market. Precisely, being in the Littoral region increases the odds of agent participation in either the town or central market over any farmgate market. Additionally, being in the West region equally increases the chances of agent participation in a central market but decreases the odds of their participation in a village market over any farmgate markets. Possibly this could be attributed to two factors. First, these regions are the most economically active. Second, they are the most accessible in terms of road and transport infrastructure (MINADER, 2012). However, the West region is also a dynamic production basin where farmers most often turn to have contracts and agreements with other participants thus making it less profitable to participate in the local village market over selling at farmgate markets (MINRESI, 2007; MINADER, 2012).
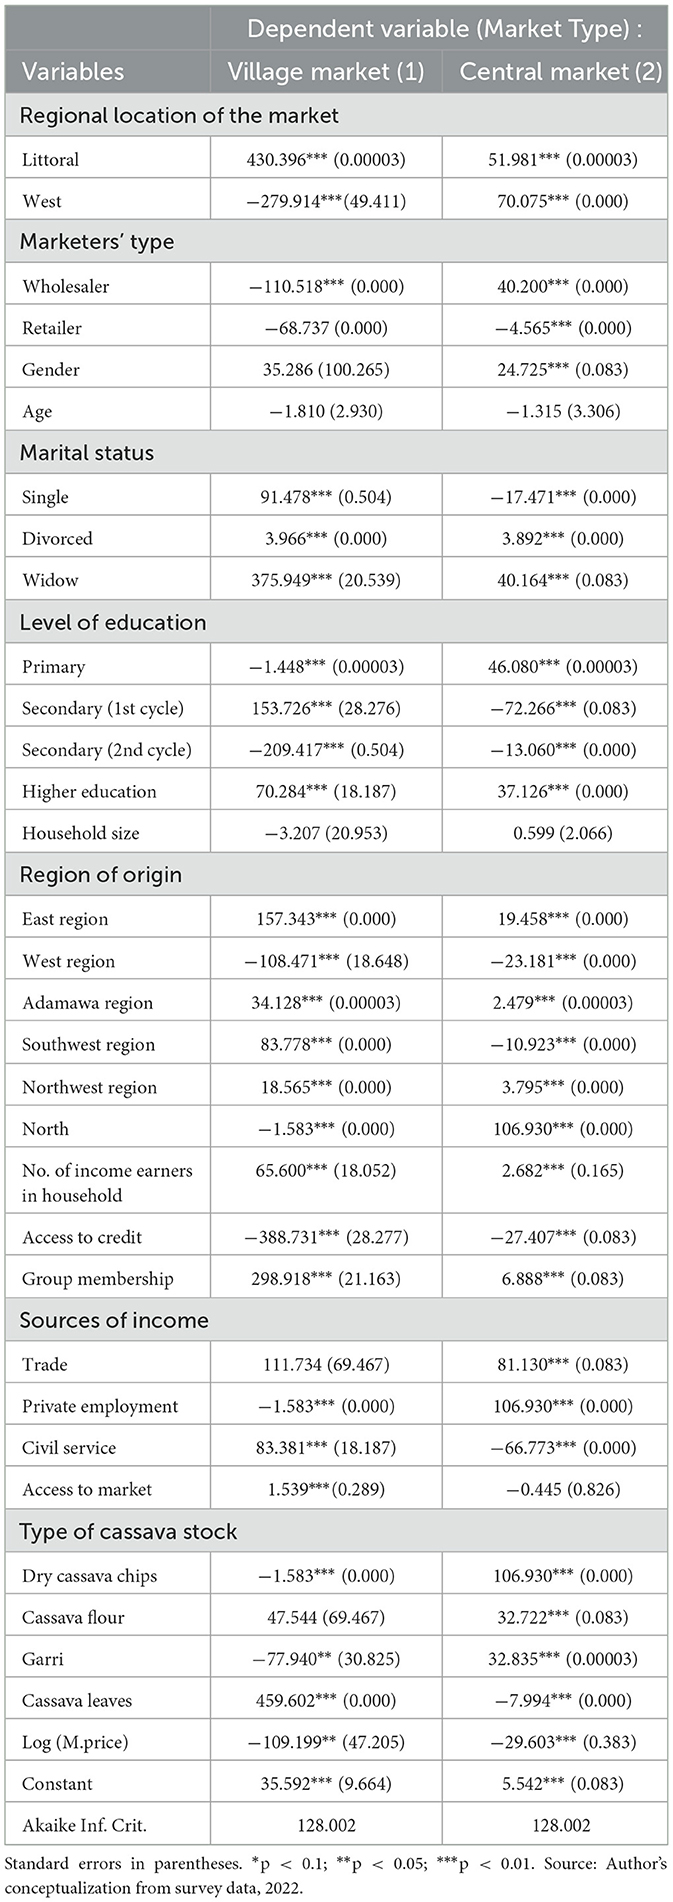
Table 7. Drivers of market participation among cassava market agents.
Marketer type is also a significant driver of market choice. It turns out that being a wholesaler decreases the odds of participating in local village markets over participating in farmgates. This might be so because the marketing margins in selling in these markets might be meager especially when compared to the possible benefits of selling in central markets. Indeed, most local village markets are not spatially distant from so-called farmgate markets in most regions of Cameroon. The margin in this case is therefore not large enough to warrant farmers' interest. Being a retailer on the other hand reduces the odds of participating in central markets. This could be linked to the highly competitive nature of central markets. In some cases, such competitions necessitate participants to invest massive amounts of financial resources which might not be suitable for retailers. Notably, Pierre and Kaminski (2019) highlights that central markets are usually located at the heart of active cities in Cameroon thus contributing to higher purchasing power within these markets. As noted by Baagyere et al. (2023), being a female increases the odds of selling in central markets. An explanation might be the relatively higher agreeableness of females which aids them to understand and manage the wide range of costumer pool that might buy cassava or its derivatives.
Marital status is equally a significant driver of market participation choice among agents. It is unusual that being married does not account for any changes in the choice of participation. Contrary to Anjikwi et al. (2020)'s study, being single, divorced, or widowed contributes to market participation. Though unexpected, it is plausible that this is partly because of the labor requirement and the associated logistic challenges to the activity. Being “unmarried” increases the odds of participating in the local village and central markets over farmgates. It is exceptional that being single reduces the odds of participating in central markets. This is possibly because singles are relatively less burdened and as such have the possibility of participating in other ventures in central markets and cities.
Furthermore, we find that education plays a significant role in driving agent participation. Indeed, education increases actors' understanding of risk and margin evaluation, which contributes to better decision making in various situations Ammanuel (2020). In addition, being an indigen from either regions significantly affects the odds of choosing a town or central market over any farmgate market. This corroborates with Abdulai's (2000, 2007) study, which highlighted that tribal cooperation plays a key role in improving the market competitiveness of market actors. The income source of households and access to finance, markets, and group membership were equally found to play a critical role in improving the odds of participation among agents.
Notably, being a “part-time” trader (privately employed or a civil servant) turned out to drive the odds of participation in town or central markets over farmgates. Being privately employed, however, decreases the odds of participating in any local village market but increases the odds of participating in the central market. This is considerably logical especially given that most private institutions and central markets are located in cities. Intuitively, it is fair to assume that these agents juggle between their jobs and a secondary income source. As such they may not have the luxury of participating in farmgate markets. Interestingly, the type of cassava product or derivative in stock plays a role in the choice of market between agents. The odds of cassava chips, cassava flour, garri, and cassava leaf traders are highly correlated with the choice of market. Trading either cassava chips or garri reduces the odds of agent participation in any village market over farmgates. Similarly trading cassava leaves as vegetable decreases the odds of agent participation in any central market. This is because of the relative fragility and sensitivity of cassava leaves to abrasion and spoilage. Finally, we observe that the purchase price of cassava decreases the odds of participation of traders in either town or central markets. Increased purchase cost cuts down marketing margins thus making it less profitable to sell in distant markets rather than other farm markets. This equally corroborates the ideas of the limit price theory highlighted in Section 3.3 above.
4.5 Constraints and implications for food security
The most challenging factors that affect cassava marketing include transport difficulties and a lack of finance or credit. Table 8 shows that 97% of vendors agree that transport cost is a major challenge, whereas 66% of vendors agree that credit accessibility usually affects their activities. This is true for both wholesale and retail markets. More specifically, vendors in the Center region indicated transportation difficulties (34%), high transportation costs (28%), too many buyers (15%), and a lack of finance or credit (13%). In the Littoral region, respondents cited the same difficulties with varying percentages as transportation difficulties (30%), high transportation costs (28%), too many buyers (16%), and a lack of finance or credit (25%) as main constraints. On the other hand, in the West region, respondents claim transportation difficulties (33%), high transportation costs (25%), too many buyers (11%), a lack of finance or credit (28%), and the risk of commodity deterioration (perishability) (12%) as main challenges. Intuitively, the high transport cost is probably due to bad roads which increased transport fares coupled with the fact that the market participants mostly self-finance their business activities through their personal savings, and as such these marketers suffer serious financial constraints which affect their trade volumes. By extension this implies that improving both variables could possibly increase net income for wholesalers and retailers.
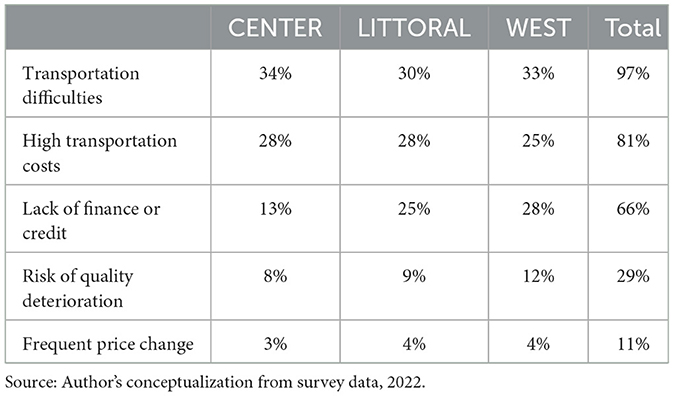
Table 8. The major constraints related to cassava marketing.
There are some policy implications from these findings. First, this study depicts the structure of retail and wholesale markets for cassava which makes it relevant to both researchers and policy makers. To researchers, we provide a preliminary basis for which other price-based models can be conceived for sophisticated market analysis. Second, this study exposes the nature of inequality within various markets. Specifically, we highlight the within group inequality in cassava wholesaler and retailer markets. This caveat may permit policy institutions to target the most appropriate segment for various interventions. Finally, we highlight the main constraint to market participation and the drivers for agent market participation. This can help governments design appropriate motivations for driving market efficiency within the cassava agrifood system. These policies may ultimately improve the cassava agrifood system thereby improving the livelihood of millions of agents (including farmers) who participate at various nodes of the agrifood value chain.
5 Conclusion
The study uses parametric and non-parametric techniques to ascertain market power, structure and performance of cassava markets in Cameroon. We equally employ a multinomial logistic model to access the drivers of market participation. The results indicate that the market is dominated by economically active people with 63% of the vendors being women, in the active age group of 20–65 years. The educational level of the vendors showed that 32% attended secondary school and 49% were married. Our findings equally highlight a highly concentrated wholesale and retail market with corresponding Gini coefficients of 0.76 and 0.79. This indicates that cassava markets in the Center, Littoral, and West regions are oligopoly in structure. Among other things, our results highlight that, the region, marketers' type (wholesaler or retailer), and socio-economic factors such as access to education, region of origin, marital status, access to credit source of income, group membership, and the type of cassava stock account significantly for the variation of odds to participate in either farmgate, village market, or central markets. Our results also reveal that prices are set up in the markets according to the place of sale and the type of marketers. However, these prices are influenced by factors such as transport, the quantity sold on the market, and the need for liquidity. In addition, cassava retailers are less efficient as compared to wholesalers with associated average marketing efficiency of 14.20% and 87% for retailers and wholesalers, respectively. Therefore, efforts at the market centers should be tailored toward reorganizing retailers into cooperatives and associated institutions. This might be an appropriate measure that will enable retailers to reap the benefits lodged within the cassava markets. This would also help them benefit from credit facilities from agricultural and commercial banks and micro credit financial institutions. Although to a limited extent, our results could benefit government agricultural market policies.
Data availability statement
The raw data supporting the conclusions of this article will be made available by the authors, without undue reservation.
Ethics statement
Ethical review and approval was not required for the study on human participants in accordance with the local legislation and institutional requirements. Written informed consent from the (patients/participants OR patients/participants legal guardian/next of kin) was not required to participate in this study in accordance with the national legislation and the institutional requirements.
Author contributions
JM: Conceptualization, Data curation, Formal analysis, Funding acquisition, Investigation, Methodology, Resources, Software, Validation, Visualization, Writing—original draft, Writing—review & editing. ELM: Conceptualization, Investigation, Methodology, Project administration, Resources, Software, Supervision, Validation, Visualization, Writing—original draft, Writing—review & editing. RD: Conceptualization, Methodology, Software, Supervision, Validation, Writing—review & editing. PK: Conceptualization, Investigation, Methodology, Validation, Visualization, Writing—original draft, Writing—review & editing.
Funding
The author(s) declare that no financial support was received for the research, authorship, and/or publication of this article.
Conflict of interest
The authors declare that the research was conducted in the absence of any commercial or financial relationships that could be construed as a potential conflict of interest.
Publisher's note
All claims expressed in this article are solely those of the authors and do not necessarily represent those of their affiliated organizations, or those of the publisher, the editors and the reviewers. Any product that may be evaluated in this article, or claim that may be made by its manufacturer, is not guaranteed or endorsed by the publisher.
Footnotes
1. ^1USD ~ 600FCFA.
References
Ababulgu, N., Abajobir, N., and Wana, H. (2022). The embarking of COVID-19 and the perishable products' value chain in Ethiopia. J. Innov. Entrepr. 11:34. doi: 10.1186/s13731-022-00224-5
Abdou, A. I. (2007). “Modified marketing efficiency criteria for consideration in cropping structure planning: a case of newly reclaimed land farmers in Egypt,” in 16th International Farm Management Association Congress A Vibrant Rural Economy–The Challenge for Balance, 79.
Abdulai, A. (2000). Spatial price transmission and asymmetry in the Ghanaian maize market. J. Dev. Econ. 63, 327–349. doi: 10.1016/S0304-3878(00)00115-2
Abdulai, A. (2007). Spatial and Vertical Price Transmission in Food Staples Market Chains in Eastern and Southern Africa: What Is the Evidence Spatial and Vertical price transmission in food staples market chains in Eastern and Southern Africa: What is the evidence? Paper presented at the FAO Trade and Markets Division Workshop on Staple Food Trade and Market Policy Options for Promoting Development in Eastern and Southern Africa, Rome. Available online at: https://www.researchgate.net/publication/239547250 (accessed December 3, 2023).
Abidoye, B. O., and Labuschagne, M. (2014). The transmission of world maize price to South African maize market: a threshold cointegration approach. Agric. Econ. 45, 501–512. doi: 10.1111/agec.12102
Adegbite, A., and Adejobi, A. O. (2018). Marketing efficiency in the distributive trade channel for Onions in Osun State. Alanya Akademik Bakiş 2, 195–212. doi: 10.29023/alanyaakademik.351608
Agbugba, I. K., and Obi, A. (2013). Market structure, price formation and price transmission for wood charcoal in southeastern Nigeria. J. Agric. Sci. 5, 77–86. doi: 10.5539/jas.v5n10p77
Ahmed, M. A., Idris, A., and Chinda, M. D. (2018). Analysis of onion marketing structure in Yola North local government area of Adamawa State, Nigeria. Int. J. Sci. Res. Manag. 6:743. doi: 10.18535/ijsrm/v6i10.em02
Akem, N. F., Molua, E. L., and Nzie, J. R. M. (2019). Margin size by actors on nodes in poultry-meat supply chain in Southwestern Cameroon,” in 2019 Sixth International Conference, September 23-26, 2019, Abuja, Nigeria (No. 295683) (African Association of Agricultural Economists).
Akram-Lodhi, A. H. (2008). (Re) imagining agrarian relations? The world development report 2008: agriculture for development. Dev. Change 39, 1145–1161.
Ammanuel, O. A. (2020). Conduct and structure of soybean marketing in North Central States of Nigeria. Ieee-Sem 8. doi: 10.24940/theijbm/2021/v9/i1/BM2101-049
Anjikwi, Y., Bashir, A. B., and Adamu, A. G. (2020). Analysis of ginger markets in hawul local government area Borno State, Nigeria. J. Econ. Allied Res. 4, 126–140.
Baagyere, J., Abdul-Rahaman, A., Wongnaa, C. A., Amfo, B., Issahaku, G., Damba, O. T., et al. (2023). Organization and performance of chicken egg marketing in Northern Ghana. J. Agric. Food Res. doi: 10.1016/j.jafr.2023.100633
Bannor, R. K., Adjei-Addo, E., and Oppong-Kyeremeh, H. (2018). Marketable surplus and its determinants among small scale maize producers in the Ashanti and Northern regions of Ghana. SKUAST J. Res. 20, 9–18.
Baron, D. P. (1973). Limit pricing, potential entry, and barriers to entry. Am. Econ. Rev. 63, 666–674.
Barrett, C. B., and Li, J. R. (2002). Distinguishing between equilibrium and integration in spatial price analysis. Am. J. Agric. Econ. 84, 292–307. doi: 10.1111/1467-8276.00298
Barrett, C. B., Reardon, T., Swinnen, J., and Zilberman, D. (2022). Agri-food value chain revolutions in low-and middle-income countries. J. Econ. Liter. 60, 1316–1377. doi: 10.1257/jel.20201539
Baulch, B. (1997). Testing for food market integration revisited. J. Dev. Stud. 33, 512–534. doi: 10.1080/00220389708422479
Bitzer, V., Glasbergen, P., and Arts, B. (2013). Exploring the potential of intersectoral partnerships to improve the position of farmers in global agrifood chains: findings from the coffee sector in Peru. Agric. Hum. Values 30, 5–20. doi: 10.1007/s10460-012-9372-z
Bonanno, A., Russo, C., and Menapace, L. (2018). Market power and bargaining in agrifood markets: a review of emerging topics and tools. Agribusiness 34, 6–23. doi: 10.1002/agr.21542
Bukar, U., Mohammed, D., Wakawa, R., Shettima, B. G., and Muhammad, S. T. (2015). Analysis of market structure, conduct and performance for pepper in Borno State, Nigeria: a review. J Agric. Econ. Environ. Soc. Sci. 1, 181–190.
Burke, W. J., and Myers, R. J. (2014). Spatial equilibrium and price transmission between Southern African maize markets connected by informal trade. Food Policy 49, 59–70. doi: 10.1016/j.foodpol.2014.05.008
Chaudhuri, A., and Ligas, M. (2009). Consequences of value in retail markets. J. Retailing 85, 406–419. doi: 10.1016/j.jretai.2009.05.006
Chong, H. Y., and Chan, T. H. (2014). Market structure and competition: assessment of malaysian pharmaceutical industry based on the modified structure-conduct-performance paradigm. Int. J. Organiz. Innov. 7, 137–150.
Conforti, P. (2004). Price transmission in selected agricultural markets. FAO Commodity and trade policy research working paper.
Costa, C., and Delgado, C. (2019). The cassava value chain in Mozambique. Washington, DC: World Bank. doi: 10.1596/31754
Dillon, B., and Dambro, C. (2017). How Competitive Are Crop Markets in Sub-Saharan Africa? Am. J. Agric. Econ. 99, 1344–1361. doi: 10.1093/ajae/aax044
Dou, Y., da Silva, R. F. B., McCord, P., Zaehringer, J. G., Yang, H., Furumo, P. R., et al. (2020). Understanding how smallholders integrated into pericoupled and telecoupled systems. Sustainability 12, 1596. doi: 10.3390/su12041596
Eaton, B. C., and Ware, R. (1987). A theory of market structure with sequential entry. RAND J. Econ. 18, 1–16. doi: 10.2307/2555531
Fackler, P. L., and Goodwin, B. K. (2001). “Spatial price analysis,” in Handbook of agricultural economics, eds. B. Gardner and G. Rausser (Amsterdam: Elsevier), 971–1024. doi: 10.1016/S1574-0072(01)01008-8
FAO (2006). Inequality Analysis: The Gini Index. EASYPol Series 040. Available online at: http://www.fao.org/policy-support/tools-and-publications/resources-details/es/c/446282 (accessed November 3, 2023).
Fernando, N. M. L., Amaraweera, A. P. S. M., Gunawardane, O. H. P., Wanninayaka, W. M. D. B., Manipura, A., Manamperi, W. A. R., et al. (2022). Sustainable biorefinery approach for cassava. Engineer 55, 71–88. doi: 10.4038/engineer.v55i2.7510
Ferris, S., Robbins, P., Best, R., Seville, D., Buxton, A., Shriver, J., et al. (2014). Linking Smallholder Farmers to Markets and the Implications for Extension and Advisory Services. Available online at: www.meas-extension.org
Fricke, S., and Muratori, L. (2017). Spatial price transmission and trade policies: new evidence for agricultural products from selected sub-Saharan African countries with high frequency data (No. 2017-006). Jena Economic Research Papers. Available online at: http://hdl.handle.net/10419/174367 (accessed November 3, 2023).
Gengenbach, H., Comé, A. A., and Nhabinde, J. B. (2022). Serving “the Uses of Life”: gender, history, and food security in a cassava value chain scheme. African Stud. Rev. 65, 93–117. doi: 10.1017/asr.2021.137
Goldenberg, J., Libai, B., and Muller, E. (2001). Using complex systems analysis to advance marketing theory development: modeling heterogeneity effects on new product growth through stochastic cellular automata. Acad. Market. Sci. Rev. 9, 1–18.
Goodwin, B. K., and Schroeder, T. C. (1991). Cointegration tests and spatial price linkages in regional cattle markets. Am. J. Agric. Econ. 73, 452–464. doi: 10.2307/1242730
Guerrero Lara, L., van Oers, L., Smessaert, J., Spanier, J., Raj, G., and Feola, G. (2023). Degrowth and agri-food systems: a research agenda for the critical social sciences. Sustain. Sci. 18, 1579–1594. doi: 10.1007/s11625-022-01276-y
Harriss, B. (1979). There is method in my madness: or is it vice versa? Measuring agricultural market performance. Food Res. Insti. Stud. 17, 197–218.
Haruna, I., Nkegbe, P. K., and Ustarz, Y. (2012). Structure, conduct and performance of tomato marketing in Ghana. J. Econ. Sustain. Dev. 3, 156–163.
Headey, D. D., Malaiyandi, S., and Fan, S. (2009). Navigating the perfect storm. Reflections on the Food, Energy, and Financial Crises. IFPRI website. Available online at: http://www.ifpri.~org/sites/default/files/publications/ifpridp00889.pdf (accessed December 3, 2023).
James, B. D., Bramel, P., Witte, E., Asiedu, R., Watson, D., and Okechukwu, R. (2012). “Unleashing the power of cassava in Africa...are we there yet?” in Proceedings of the 11th Triennial Symposium of the ISTRC-AB Held at Memling Hotel: Tropical Roots and Tuber Crops and the Challenges of Globalization and Climate Changes (Kinshasa), 300–311.
Jeyanthi, P. (2018). Estimation of market efficiency and analysis of price data. Cochin: Central Institute of Fisheries Technology.
Kamdem, C. B., Galtier, F., Gockowski, J., Helene, D. B., Egg, J., and Dia, B. K. (2010). What determines the price received by cocoa farmers in Cameroon? An empirical analysis based on bargaining theory. Afr. J. Agric. Resour. Econ. 5, 318–339.
Lelissa, T. B., and Kuhil, A. M. (2018). The structure conduct performance model and competing hypothesis–A review of literature. Structure 9, 76–89.
Mafimisebi, O. E., Awolola, D. O., and Fasasi, R. A. (2006). “Analysis of the fundamentals in palm oil marketing in osun state, Nigeria,” in Agricultural Research for Development in Nigeria. Proceedings of the 2nd Annual Conference of the Federal University of Technology, Akure, 192–198.
Magesa, M. M., Michael, K., and Ko, J. (2020). Access and use of agricultural market information by smallholder farmers: Measuring informational capabilities. Electr. J. Inf. Syst. Develop. Countr. 86:e12134. doi: 10.1002/isd2.12134
Marsden, T. (2013). From post-productionism to reflexive governance: contested transitions in securing more sustainable food futures. J. Rural Stud. 29, 123–134. doi: 10.1016/j.jrurstud.2011.10.001
Marsden, T., Moragues Faus, A., and Sonnino, R. (2019). Reproducing vulnerabilities in agri-food systems: Tracing the links between governance, financialization, and vulnerability in Europe post 2007–2008. J. Agrar. Change 19, 82–100. doi: 10.1111/joac.12267
Merton, R. C. (1987). A simple model of capital market equilibrium with incomplete information. Available online at: https://dspace.mit.edu/bitstream/handle/1721.1/2166/SWP-1869-18148074.pdf (accessed December 3, 2023).
Midi, H., Sarkar, S. K., and Rana, S. (2011). Adequacy of multinomial logit model with nominal responses over binary logit model. Trends Appl. Sci. Res. 6:900.
MINEPDED (2017). Annuaires des statistiques agricoles (documents 2009–2010) - AGRISTAT-N°17 (Campagnes 2009 et 2010) - “FAO catalog”. Available online at: https://data.apps.fao.org/catalog/dataset/documents/resource/2e7583c4-aab5-4ee2-b029-e909f3ced1ea (accessed November 16, 2023)
Minot, N. W. (2011). Transmission of World Food Price Changes to Markets in Sub-Saharan Africa. Available online at: http://www.ifpri.org/publications/results/taxonomy%3A468 (accessed December 3, 2023).
MINRESI (2007). Deuxième rapport sur l'état des ressources phytogénétiques pour l'alimentation et l'agriculture au Cameroun. 60.24
Minten, B., Stifel, D., and Tamru, S. (2014). Structural transformation of cereal markets in Ethiopia. J. Dev. Stud. 50, 611–629. doi: 10.1080/00220388.2014.887686
Mmbando, F. E., Wale, E. Z., and Baiyegunhi, L. J. (2015). Determinants of smallholder farmers' participation in maize and pigeonpea markets in Tanzania. Agrekon 54, 96–119. doi: 10.1080/03031853.2014.974630
Mmbando, F. E., Wale, E. Z., and Baiyegunhi, L. J. (2017). The welfare impacts of market channel choice by smallholder farmers in Tanzania. Dev. Pract. 27, 981–993. doi: 10.1080/09614524.2017.1353066
Molua, E. L., and Lambi, C. M. (2006). “Climate, hydrology and water resources in Cameroon,” in CEEPA, Pretoria, 37.
Mvodo, E. S. M., and Liang, D. (2012a). Cassava sector development in Cameroon: production and marketing factors affecting price. Agric. Sci. 3:651. doi: 10.4236/as.2012.35078
Mvodo, E. S. M., and Liang, D. (2012b). SWOT analysis of cassava sector in Cameroon. Int. J. Econ. Manag. Eng. 6, 2785–2791.
Myers, R. J. (2013). Evaluating the effectiveness of inter-regional trade and storage in Malawi's private sector maize markets. Food Policy 41, 75–84. doi: 10.1016/j.foodpol.2013.04.007
Myers, R. J., and Jayne, T. S. (2012). Multiple-regime spatial price transmission with an application to maize markets in Southern Africa. Am. J. Agric. Econ. 94, 174–188. doi: 10.1093/ajae/aar123
Nakawuka, P., Langan, S., Schmitter, P., and Barron, J. (2018). “A review of trends, constraints, and opportunities of smallholder irrigation in East Africa,” in Global Food Security (New York: Elsevier B.V.), 196–212. doi: 10.1016/j.gfs.2017.10.003
Neik, T. X., Siddique, K. H., Mayes, S., Edwards, D., Batley, J., Mabhaudhi, T., et al. (2023). Diversifying agrifood systems to ensure global food security following the Russia–Ukraine crisis. Front. Sustain. Food Syst. 7:1124640. doi: 10.3389/fsufs.2023.1124640
Nkamigbo, D. C. (2019). Inter-market price spread and determinants of net farm income in watermelon marketing in Anambra State. Int. J. Agric. Policy Res. 7, 100–107.
Nkendah, R., Nzouessin, C. B., and Temple, L. (2007). Economic analysis of the spatial integration of plantain markets in Cameroon. Afr. J. Econ. Policy 14, 57–82. doi: 10.4314/ajep.v14i1.44194
Ojo, A. O., Mustapha, A., and Ojo, M. A. (2016). Analysis of Marketing Efficiency of Tomato Fruits in Abuja Municipal Area Council, Nigeria.
Olagunju, O. S., Bolarinwa, O. A., and Erinfolami, T. P. (2020). Knowledge and factors associated with modern contraceptive use among young women in West African countries. Int. J. All Res. Writ. 1, 148–161.
Penningroth, S. L., and Scott, W. D. (2019). Age-related differences in the goals and concerns that motivate real-life prospective memory tasks. PLoS ONE 14:e0216888. doi: 10.1371/journal.pone.0216888
Pierre, G., and Kaminski, J. (2019). Cross country maize market linkages in Africa: integration and price transmission across local and global markets. Agric. Econ. 50, 79–90. doi: 10.1111/agec.12467
Rapsomanikis, G., and Mugera, H. (2011). “Price transmission and volatility spillovers in food markets of developing countries,” in Methods to Analyse Agricultural Commodity Price Volatility (New York: Springer), 165–179. doi: 10.1007/978-1-4419-7634-5_10
Ravallion, M. (1986). Testing market integration. Am. J. Agric. Econ. 68, 102–109. doi: 10.2307/1241654
Rosenzweig, M. R., and Binswanger, H. P. (1993). Wealth, weather risk and the composition and profitability of agricultural investments. Econ. J. 103, 56–78. doi: 10.2307/2234337
Teng, P. S., and Oliveros, J. A. (2016). The enabling environment for inclusive agribusiness in Southeast Asia. Asian J. Agric. Dev. 13, 1–20. doi: 10.37801/ajad2016.13.2.1
Thu N. D. H. Le Quyen C. Thi N. T. T. Lebailly P. (2020), Social value chain analysis: the case of tuna value chain in three south central provinces of Vietnam. Asian Soc. Sci. 16, 43–60. doi: 10.5539/ass.v16n8p43
Tostão, E., and Brorsen, B. W. (2005). Spatial price efficiency in Mozambique's post-reform maize markets. Agric. Econ. 33, 205–214. doi: 10.1111/j.1574-0862.2005.00262.x
Tsowou, K., and Gayi, S. K. (2019). Trade reforms and integration of cocoa farmers into world markets: evidence from African and non-African Countries. J. African Trade. 6:16. doi: 10.2991/jat.k.190916.001
Udry, C., Fafchamps, M., Rose, E., and Strauss, J. (1996). Efficiency and Market Structure: Testing for Profit Maximization in African Agriculture. Available online at: http://www.econ.nwu.edu/faculty/udry/ (accessed December 3, 2023).
Ukum, U. B., Molua, E. L., and Akem, F. N. (2018). Poultry price and market analysis in the southwest region of Cameroon. J. Food Sec. 6, 42–50. doi: 10.12691/JFS-6-1-5
Veltmeyer, H. (2009). The World Bank on ‘agriculture for development': a failure of imagination or the power of ideology? J. Peasant Stud. 36, 393–410. doi: 10.1080/03066150902928363
von Cramon-Taubadel, S., and Goodwin, B. K. (2021). Price transmission in agricultural markets. Ann. Rev. Resour. Econ. 13, 65–84. doi: 10.1146/annurev-resource-100518-093938
Wambo, A., Mahungu, N., Kendenga, T., and O'Brien, E. (2011). Cassava investment in Africa: taking inventory of initiatives in Africa in view of positioning cassava as a strategic commodity. Consultant 4:41.
Wilcox, M. D., and Abbott, P. C. (2006). “Can cocoa farmer organizations countervail buyer market power?” in 2006 Annual meeting, July 23-26, Long Beach, CA (No. 21261). American Agriculture Economics Association (New Name 2008: Agricultural and Applied Economics Association).
Keywords: cassava agrifood, market structure, market performance, Gini coefficient, Cameroon
Citation: Mbarga Evouna JS, Molua EL, Djomo Choumbou RF and Kemeni Kambiet PL (2024) Structure and performance of cassava markets: challenges of food security and connecting small farmers to markets in Cameroon. Front. Sustain. Food Syst. 8:1353565. doi: 10.3389/fsufs.2024.1353565
Received: 10 December 2023; Accepted: 26 February 2024;
Published: 20 March 2024.
Edited by:
Noshaba Aziz, Shandong University of Technology, ChinaReviewed by:
Qingjun Zhao, Huzhou College, ChinaHongru Wang, Nanjing Agricultural University, China
Copyright © 2024 Mbarga Evouna, Molua, Djomo Choumbou and Kemeni Kambiet. This is an open-access article distributed under the terms of the Creative Commons Attribution License (CC BY). The use, distribution or reproduction in other forums is permitted, provided the original author(s) and the copyright owner(s) are credited and that the original publication in this journal is cited, in accordance with accepted academic practice. No use, distribution or reproduction is permitted which does not comply with these terms.
*Correspondence: Perez L. Kemeni Kambiet, a2VtZW5pa2FtYmlldEBnbWFpbC5jb20=