 Lifang Fu1
 Huaxu Zhang2*
- 1College of Arts and Sciences, Northeast Agricultural University, Harbin, China
- 2College of Engineering, Northeast Agricultural University, Harbin, China
In recent years, the high-frequency abnormal price fluctuations of small-scale agricultural products have been detrimental to market stability. The traditional method based on statistical data of production factors can no longer accurately predict abnormal price fluctuations. Therefore, this study takes scallions as an example and extracts the influencing factors of their prices based on the LDA-NLP-TVP-VAR model from massive network information, and analyzes the causes and changing characteristics of price fluctuations from four perspectives: market supply, economic environment and market sentiment, and attention. Initially, the study employs an LDA topic model to extract factors from online sentiment data over the past four years. Subsequently, using the SO-PMI algorithm to expand domain-specific lexicons and employing semantic and sentiment analysis with syntactic parsing, the study aims to improve the accuracy of sentiment quantification in text analysis. Furthermore, cointegration and Granger causality tests validate the significant impact of these factors on scallion price fluctuations, mitigating spurious regression issues. Finally, by employing a TVP-VAR model, the study compares the impulse responses and shock magnitudes of various factors in different time and spatial dimensions. It also delves into the mechanisms of heterogeneous impacts and trends in scallion prices, considering the corresponding socio-economic context and public sentiment events within specific time windows, thereby providing valuable decision-making insights for the healthy development of agricultural markets.
1 Introduction
As a large agricultural country, China ‘s agricultural economy is extremely important in the national economy. In recent years, although the national income and consumption level have been steadily improved, the emergence of COVID−19 has seriously impacted China ‘s agricultural market, and the price fluctuation of agricultural products in China has become increasingly intensified (Fan et al., 2020). These situations have affected the daily life of the people, damaged the income of each subject in the market, and also limited the development of related industries. Studies have shown that small-scale agricultural products are different from large-scale agricultural products due to their small total output, concentrated production areas, and large changes in demand elasticity. Their prices are not only affected by meteorological factors, but also highly susceptible to market sentiment and social emergencies triggered by online public opinion. Therefore, there will be frequent fluctuations in prices in the short term, with the most obvious fluctuations in scallion, ginger, garlic (Zhang and Jiaojiao, 2022), and this situation is only based on historical price data or conventional supply and demand and meteorological factors, It is difficult to find and define other influencing factors that affect market conditions and price changes in time, Therefore, in recent years, online public opinion analysis has become an effective way to solve this problem.
In recent years, social platforms are the most direct channels for people to release and obtain information. Network public opinion also reflects the concerns, subjective attitudes, and opinions of the general public. The relevant information of agricultural product prices and market expectations has attracted more and more attention. Therefore, the emotional tendencies and expectations greatly affect the specific production and operation, consumption decision-making and behavior of various market players in the industrial chain, such as growers, intermediaries, and consumers, thus affecting the market (Pan et al., 2020). Therefore, the research of network public opinion can explore the various influencing factors that affect the future market price, but the network public opinion has a certain degree of ‘conduction effect’ (Cabezas et al., 2021), ‘conformity effect’ (Wani et al., 2018) and ‘opinion leader effect’ (Park and Kaye, 2017). When the price of agricultural products rises significantly, people ‘s negative emotions for higher prices will form a trend of accepting ‘popularity ‘according to the consistency of individuals. Because the herd mentality inhibits the subjective initiative of the hearer to understand the information, it is easy to make the relevant public opinion present a ‘one-sided ‘situation; at the same time, opinion leaders in social media constitute an important source of information and influence, which affects the emotional tendencies of most people, thus affecting the expectations and behavioral decisions of market players. Therefore, how to extract and quantify key influencing factors from complex networks has become an important and challenging research direction.
The price of agricultural products is closely related to people ‘s lives. When the market fluctuates greatly, it will attract more people ‘s attention and participate in the discussion. Especially during the epidemic period, the uncertainty and risks faced by production and market sales highlight the panic and anxiety of the people (Yang et al., 2022), and the frequent social events in recent years are more likely to spread and ferment through network public opinion, which also indirectly damages the credibility of the government ‘s social security (Wang, 2023). Therefore, in order to ensure the sustainable development of agriculture, China ‘s government departments and institutions respond in a timely manner and formulate effective policies to alleviate the negative effects of the COVID-19.
The study combines natural language processing with time series methods, and proposes a research method for LDA-NLP-TVP-VAR based on information extraction requirements, multi-level analysis, and time-varying analysis, which makes in-depth exploration from the national macro policy orientation, the overall market situation, the impact of COVID-19, the market subject’s expectations and emotional orientation, and fills the blank of the research on the influencing factors of small agricultural products from the network perspective.
The study comprises seven sections: introduction (Section 1), related research (Section 2), materials and analysis method (qualitative) (Section 3), data analysis and analysis method (quantify) (Section 4), results and discussion (Section 5), conclusions and policy implications (Section 6).
2 Related research
2.1 Influencing factors of the price
Scallions fall under the category of small-scale agricultural products, characterized by small-scale production and market scales. The price fluctuations of scallions exhibit significant seasonality, cyclicality, trends, and clustering (Jun and Xingchen, 2021). This renders small-scale agricultural product prices highly susceptible to frequent abnormal fluctuations due to endogenous factors, macroeconomic influences, and external uncertainties (Zhang et al., 2019). Such fluctuations not only harm the interests of various market participants but also disrupt the smooth operation of the agricultural economy. Hui and Ninghui (2014), Liu (2018), and Guo et al. (2019) argue that factors like supply, intrinsic characteristics, and inventory control strategies contribute to the intense price volatility of small-scale agricultural products. Yao (2021) prove that garlic’s own price, growth period temperature, and money supply are the main driving forces for sustained price increases. Balcilar et al. (2022) conducted sentiment analysis based on news sentiment indices, demonstrating the Granger causal relationship between the societal events of the COVID-19 pandemic and substantial fluctuations in agricultural product prices.
In summary, the existing literature provides valuable insights into the general dynamics of small-scale agricultural product prices and the impact of external factors, yet there is a distinct lack of specific research addressing the unique characteristics and drivers of scallion price fluctuations. Future studies should aim to bridge these gaps and contribute to a more comprehensive understanding of the factors influencing scallion prices in the market. In the era of information, numerous factors contribute to shifts in market trends and economic conditions. Among these, the attitudes, expectations, and ensuing behaviors of various market participants hold a significant sway over future fluctuations in agricultural product prices. Consequently, by integrating online sentiment analysis, it becomes possible to promptly identify latent influencing factors affecting market trends and price volatility in different contexts.
2.2 The connection between online public opinion and market prices
Research on the relationship between online public sentiment and market prices has predominantly manifested within the realm of finance. Notably, studies have explored how sentiment factors such as online discourse, public emotions, and attention affect stocks, futures, and other financial instruments. Kim et al. (2022), and Liu et al. (2023) predicting future stock prices based on deep learning methods by analyzing market sentiment obtained from social media or news. Chen et al. (2022) through public opinion analysis, it was found that investors’ optimistic biases and risk perception have to some extent influenced the decisions of stock exchanges and the real estate market. Jia et al. (2021) demonstrated that the COVID-19 pandemic acted as a unidirectional Granger cause of pork price fluctuations. Lv et al. (2022) verified that public opinion has a certain degree of impact on garlic prices using natural language processing and time series methods. Liu et al. (2022) empirical analysis of the dynamic impact of negative public sentiment on agricultural product prices during the COVID-19 pandemic using text mining and time-varying parameter vector autoregressive models.
The earlier-mentioned literature underscores several shortcomings in the current research pertaining to the connection between online public sentiment and market prices. Firstly, many referenced studies employ pandemic-related indices for sentiment analysis rather than examining authentic public discourse. This methodology might not offer a comprehensive portrayal of genuine public attitudes and the pertinent sentiment factors. Secondly, an exclusive reliance on sentiment analysis to deduce public emotional attitudes overlooks the significance of public attention, a factor identified as influencing price fluctuations.
2.3 Opinion analysis method of network public
2.3.1 Topic extraction and clustering of public opinion
The initial method for sentiment topic classification was the word frequency analysis approach. Gradually, clustering algorithms and machine learning have also been employed in research on sentiment hotspot discovery, topic extraction, and clustering. For instance: Selvam (2019) use natural language processing and machine learning technology, successfully extracted keywords from popular topics on news websites. Su et al. (2019) propose a parallel algorithm based on MapReduce framework for finding hotspots from product reviews. Wan et al. (2019) proposed a text structure based composite feature text extraction and classification algorithm. Liu et al. (2021) mining Traffic Emergencies from Social Network Data Based on Machine Learning. Weng et al. (2017) and Diaz and Panangadan (2020) based on natural language processing and machine learning methods, the development of medical sub domain classifiers and the recognition of illegal commercial advertisements were completed, respectively. Mittal et al. (2021) introduced a deep graph-long short-term memory (DG-LSTM) model for multi-label text classification, applied to categorize themes in Indian judicial cases.
However, there are some shortcomings and research gaps in the literature. Firstly, early methods primarily relied on word frequency analysis, lacking the capability to handle more complex contexts. Secondly, certain studies excessively depended on machine learning techniques, overlooking a comprehensive understanding of genuine public sentiment, especially when employing indicators related to pandemics for sentiment analysis. Lastly, some research, while focusing on hotspot identification, paid insufficient attention to the impact of public attention on market price fluctuations, indicating a deficiency in studies in this aspect. Therefore, future research could delve into these areas to enhance a deeper understanding of the relationship between online public sentiment and market prices.
2.3.2 Sentiment analysis methods
Sentiment analysis involves the analysis, processing, summarization, and inference of subjective texts imbued with emotions. It employs sentiment score metrics to quantify qualitative data. With the evolution of the internet and social media, sentiment analysis has become an effective quantitative solution for various fields, such as finance, education, management, and e-commerce. Researchers have made significant contributions to this domain: Rao et al. (2014) and Dybowski and Adämmer (2018) identified social emotions related to certain entities and news events using sentiment lexicons; Wang et al. (2020) optimized sentiment analysis method based on Twitter text information ontology and emotion diffusion mode. Yucel et al. (2022) conducted emotion classification on customer reviews of four different types of products/services using a classifier framework. Cao et al. (2016) propose a cross-media public sentiment analysis system for microblog.
Traditional sentiment analysis relies on lexicon-based techniques that entail rule creation, text dissection, keyword identification, and sentiment score computation. Though effective for smaller datasets, enhancing accuracy in specialized domains necessitates the inclusion or expansion of domain-specific terms. This entails a detailed examination of emotional expression traits within the domain, which can be labor-intensive. Additionally, tokenization-based sentiment analysis often overlooks semantic relationships between adjacent words, compromising accuracy and reliability by not capturing complete language context and nuances.
3 Materials and analysis method (qualitative)
3.1 Overview
This study delves into the factors influencing scallion prices through the utilization of LDA topic modeling, natural language processing, and time series analysis. Firstly, it employs web scraping to collect online sentiment data related to scallion prices. After data preprocessing, an LDA topic model is constructed for topic extraction and cluster analysis. Secondly, utilizing the domain dictionary expanded by the SO-PMI algorithm, the study quantifies sentiment in the text, constructs an attention index, and tests its feasibility through experiments. Lastly, after verifying the relevance of online sentiment factors to scallion prices through stationarity, cointegration, and Granger causality tests, the TVP-VAR model is used to analyze the time-varying impact of public sentiment on scallion price fluctuations. Figure 1 illustrates the conceptual flow of this study.
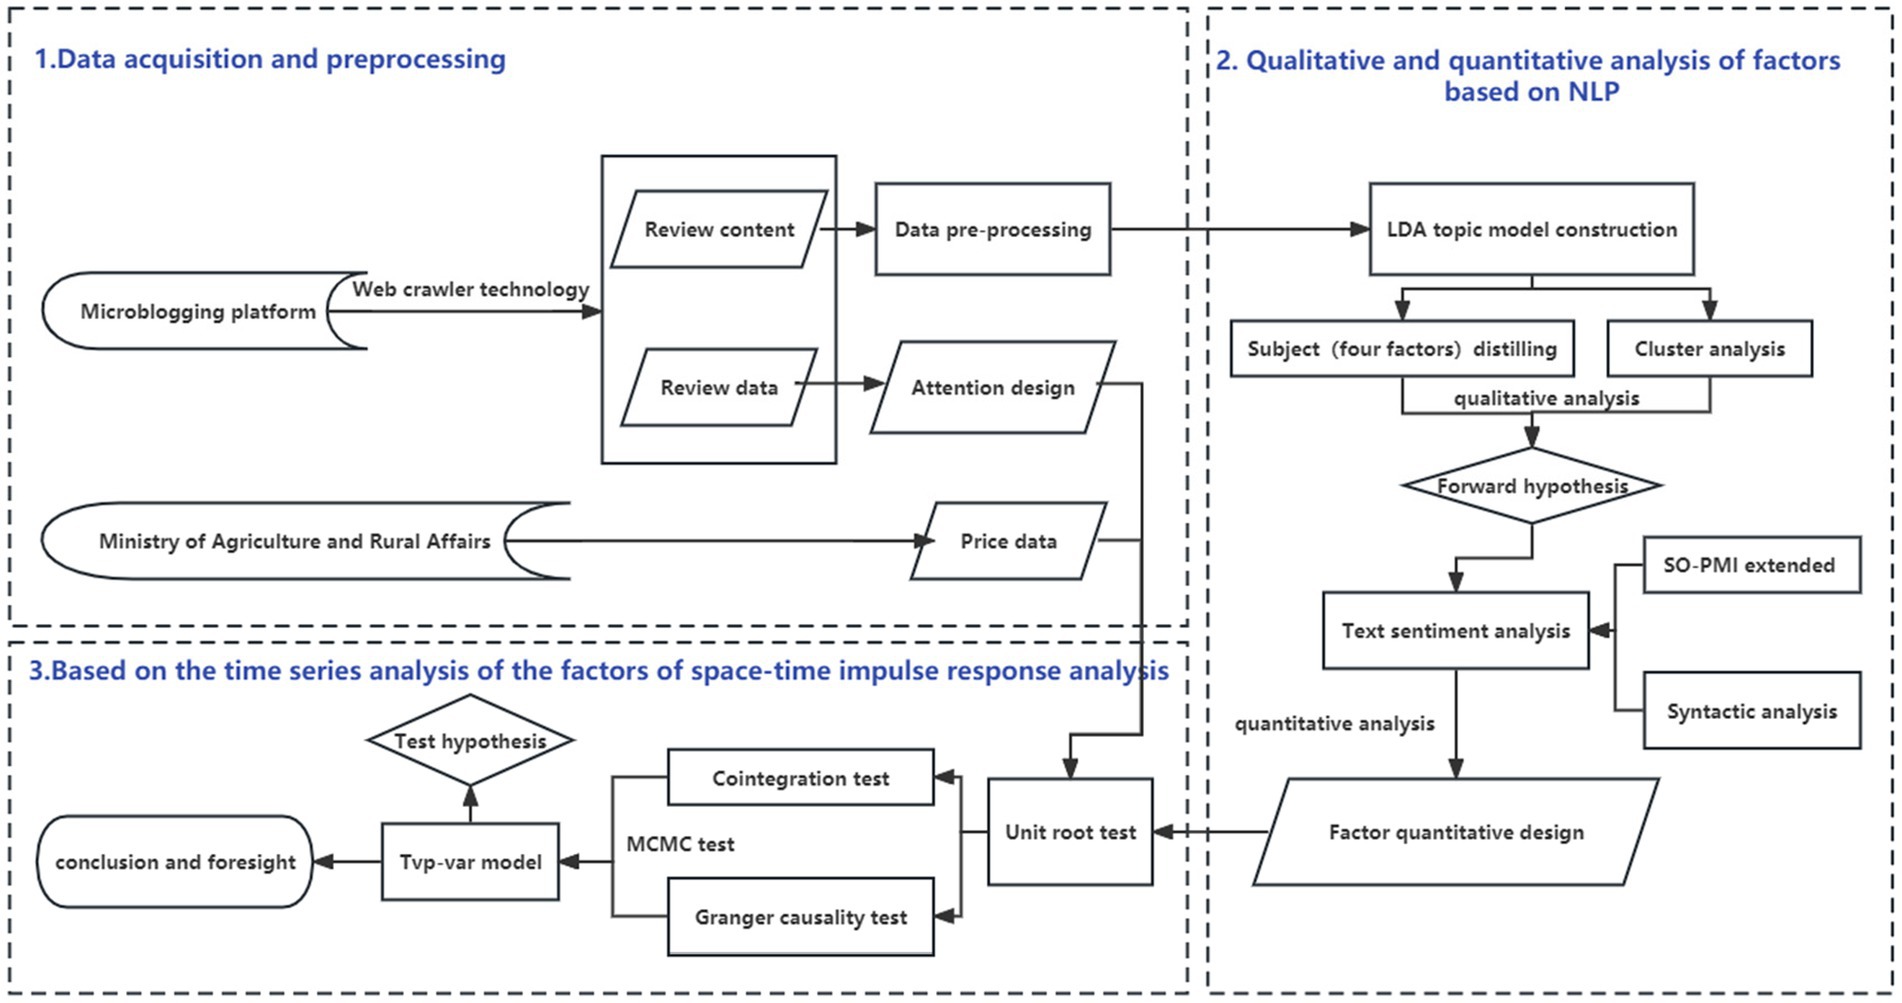
Figure 1. Thinking flow chart.
Among them, the innovation points of this article are as follows:
(1) Unlike previous studies that utilized methods like Baidu Index or search popularity, this research employs the LDA model for textual analysis and topic classification of online sentiment over the past three years, resulting in a more comprehensive set of extracted factors. These factors encompass market supply and demand, the overall economic environment, related agricultural product prices, and market attention, providing a holistic view of the significant factors influencing scallion price fluctuations from both macro and micro perspectives.
(2) To enhance sentiment analysis, this study appropriately expands the domain dictionary using the SO-PMI algorithm and incorporates syntactic analysis. It focuses on assessing the impact of negation words and degree adverbs on sentiment orientation, improving the accuracy and reliability of emotion quantification based on textual meaning. Additionally, correlations between factors are verified through cointegration tests and Granger causality analysis.
(3) The application of the TVP-VAR model analysis offers a unique perspective, allowing for comparisons of various factors’ impact on scallion prices in different time and space dimensions, including specific time points, short-term, and long-term perspectives. This approach reveals fundamental market patterns of scallion price fluctuations and explores the underlying reasons behind abnormal price fluctuations during specific periods.
3.2 Data acquisition
Research data were sourced from authoritative websites of the Ministry of Commerce1 and the Ministry of Agriculture and Rural Affairs.2 The study focused on monthly scallion price data spanning January 2008 to April 2021. Notable fluctuations were observed within this timeframe, with the highest scallion price recorded at 9.9133 yuan/kg in February 2021 and the lowest at 1.326 yuan/kg in August 2008, revealing significant variability and occasional abnormalities.
Utilizing Python, a web crawler was employed to extract relevant public opinion information from Weibo. The search encompassed three keywords: scallion, scallion price, and small-scale agricultural products. The specific content retrieved included release time, terminal, link, user name, comment or news subject, likes, forwards, comments, and embedded pictures. The crawling duration spanned from January 2019 to July 2022. Given that some public opinion data exhibited weak correlation with scallion prices, a total of 4,757 public opinion instances strongly correlated with scallion prices were extracted. After eliminating 36 invalid entries, 4,721 valid public opinion instances remained for further analysis.
3.3 Data preprocessing
This experiment is based on the Jieba module of the R language to realize the Chinese word segmentation of the public opinion information data set. Next, uses Baidu stop word lexicon, which contains 1857 stop word strings. In order to enhance the effect of topic extraction and cluster analysis, the word frequency statistics of the corpus are carried out and the new stop words and strings are introduced manually according to the distribution. Based on the Ggplot2 drawing package in R language, the visual design of word frequency is carried out. The Figure 2 shows the top 30 words in the corpus:
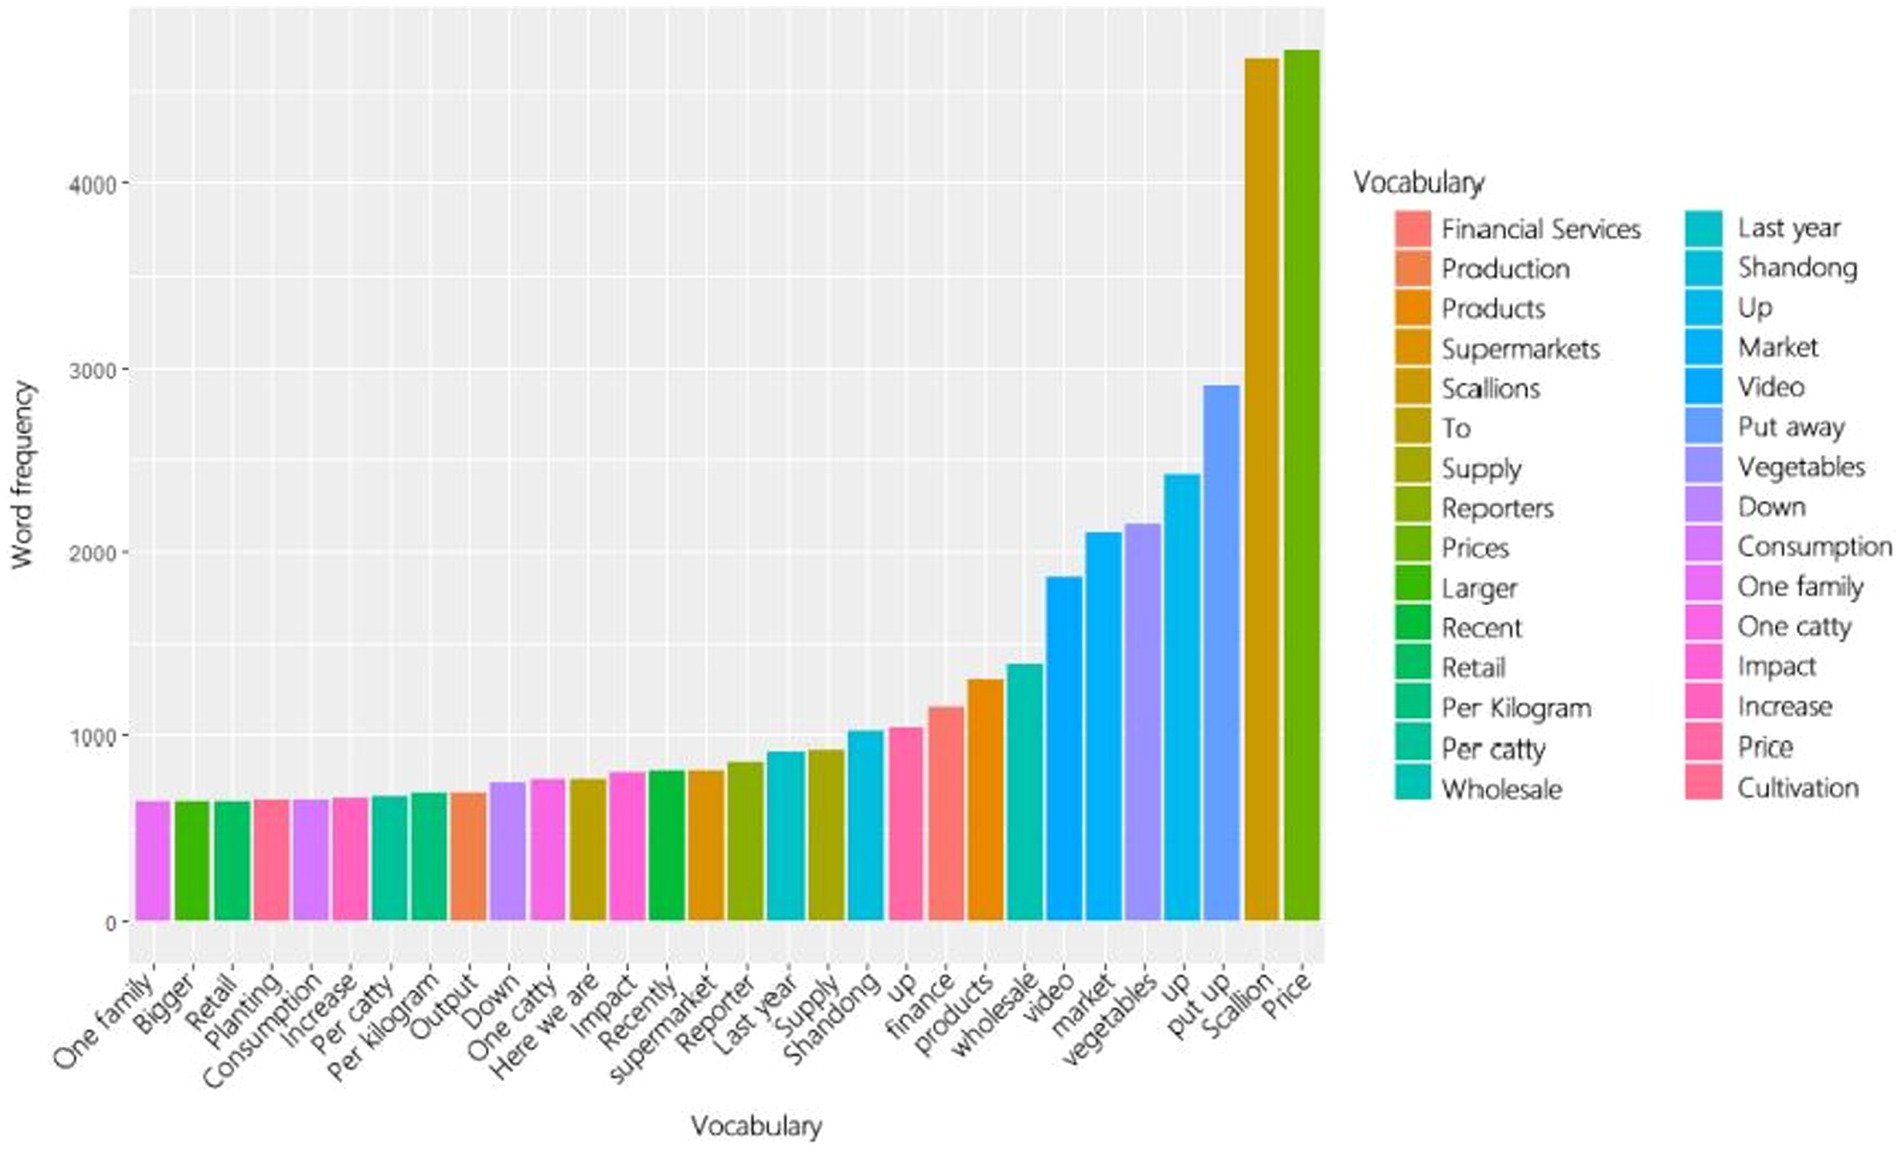
Figure 2. Word frequency statistics of public opinion information data.
This paper selects words or characters that do not appear in the existing deactivated lexicon, such as ‘pick up, expand, jump, underline, micro-blog, a catty, a’, etc., interactive information such as ‘@ user, # topic #, web link ‘, etc., and introduces the two into the existing deactivated lexicon (a total of 1890 kinds), and eliminates punctuation marks and word segmentation with a length of less than 1. The preprocessed text is vectorized using the Purrr package in Tidyverse.
3.4 LDA model construction
The study employed the LDA method from the Rstudio machine learning library to construct a topic model. During the model construction process, we manually set the number of topics to three (K = 3), and the hyperparameters α and β were kept at their default values. This configuration aimed to extract factors related to price from the sentiment data about scallions. The input and output parameters of the model are presented in Table 1. Through this approach, our goal is to identify distinct topics from the sentiment data and further analyze the information related to prices.
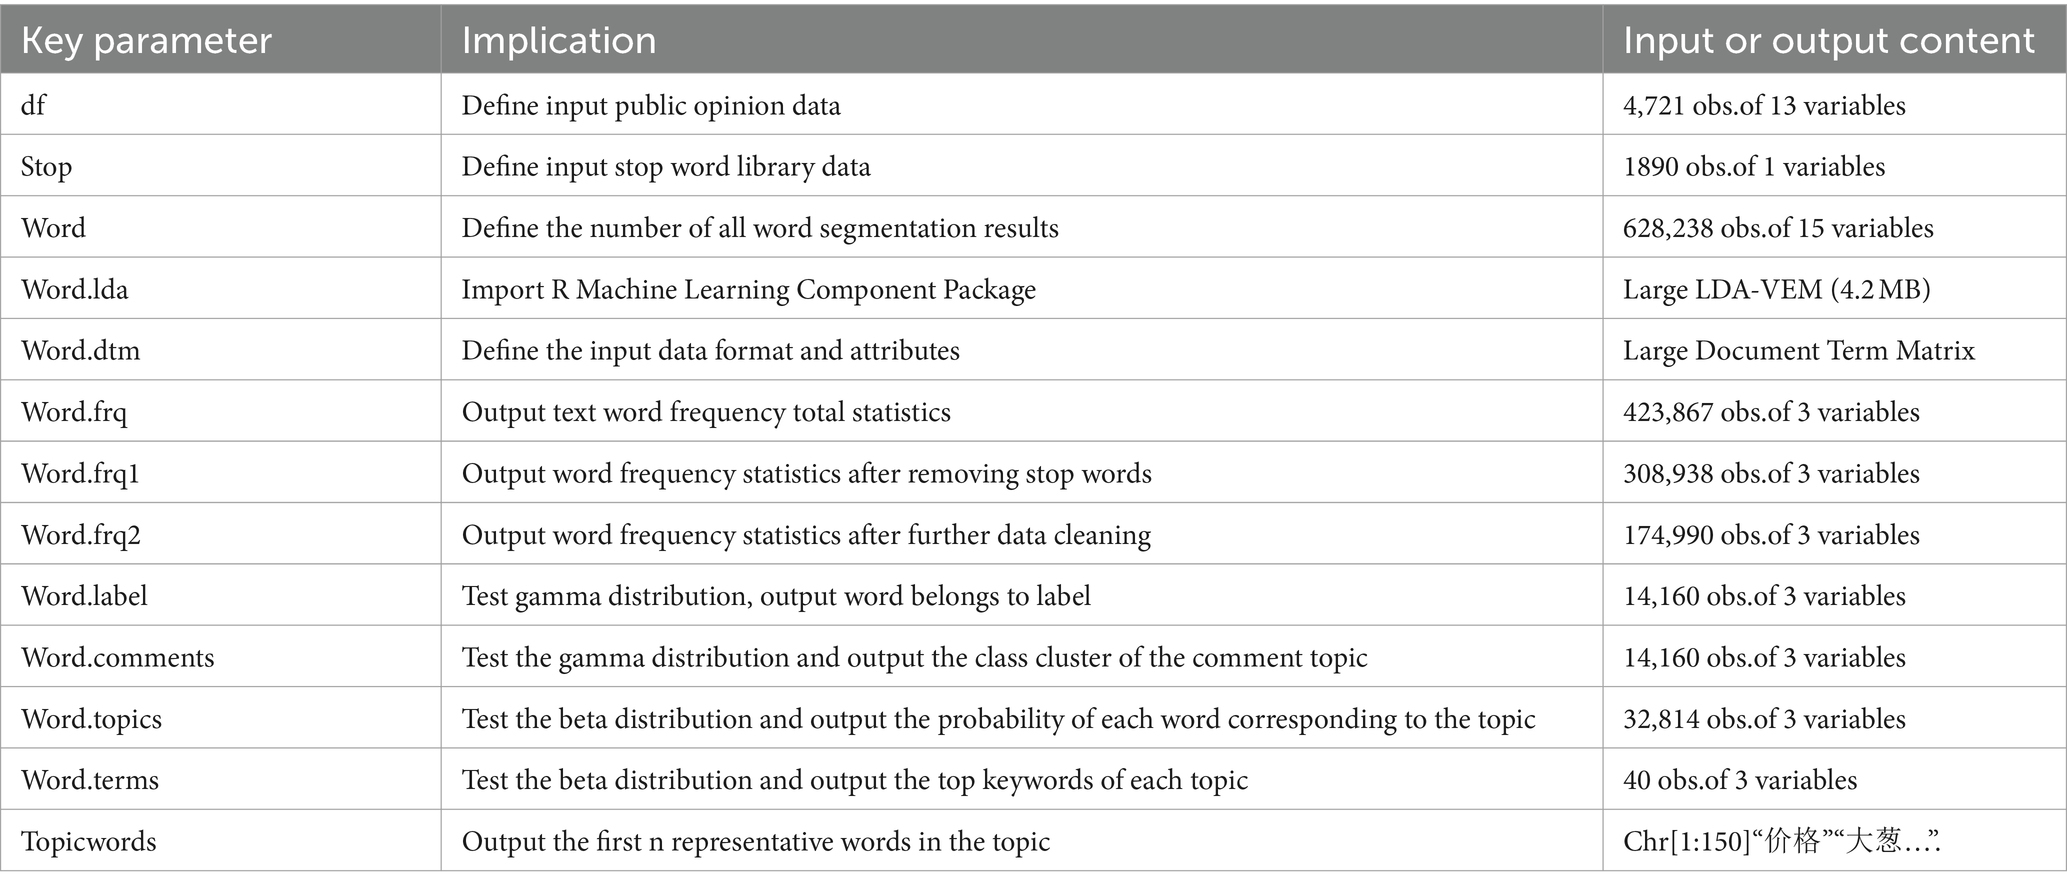
Table 1. LDA model inputs and outputs.
Utilizing the input and output parameters mentioned earlier, the model was constructed. With the help of the R language and the Ggplot2 package, we designed visualizations to showcase the top twenty topic words and their corresponding probabilities for each of the three topics. The results are presented in Figure 3.
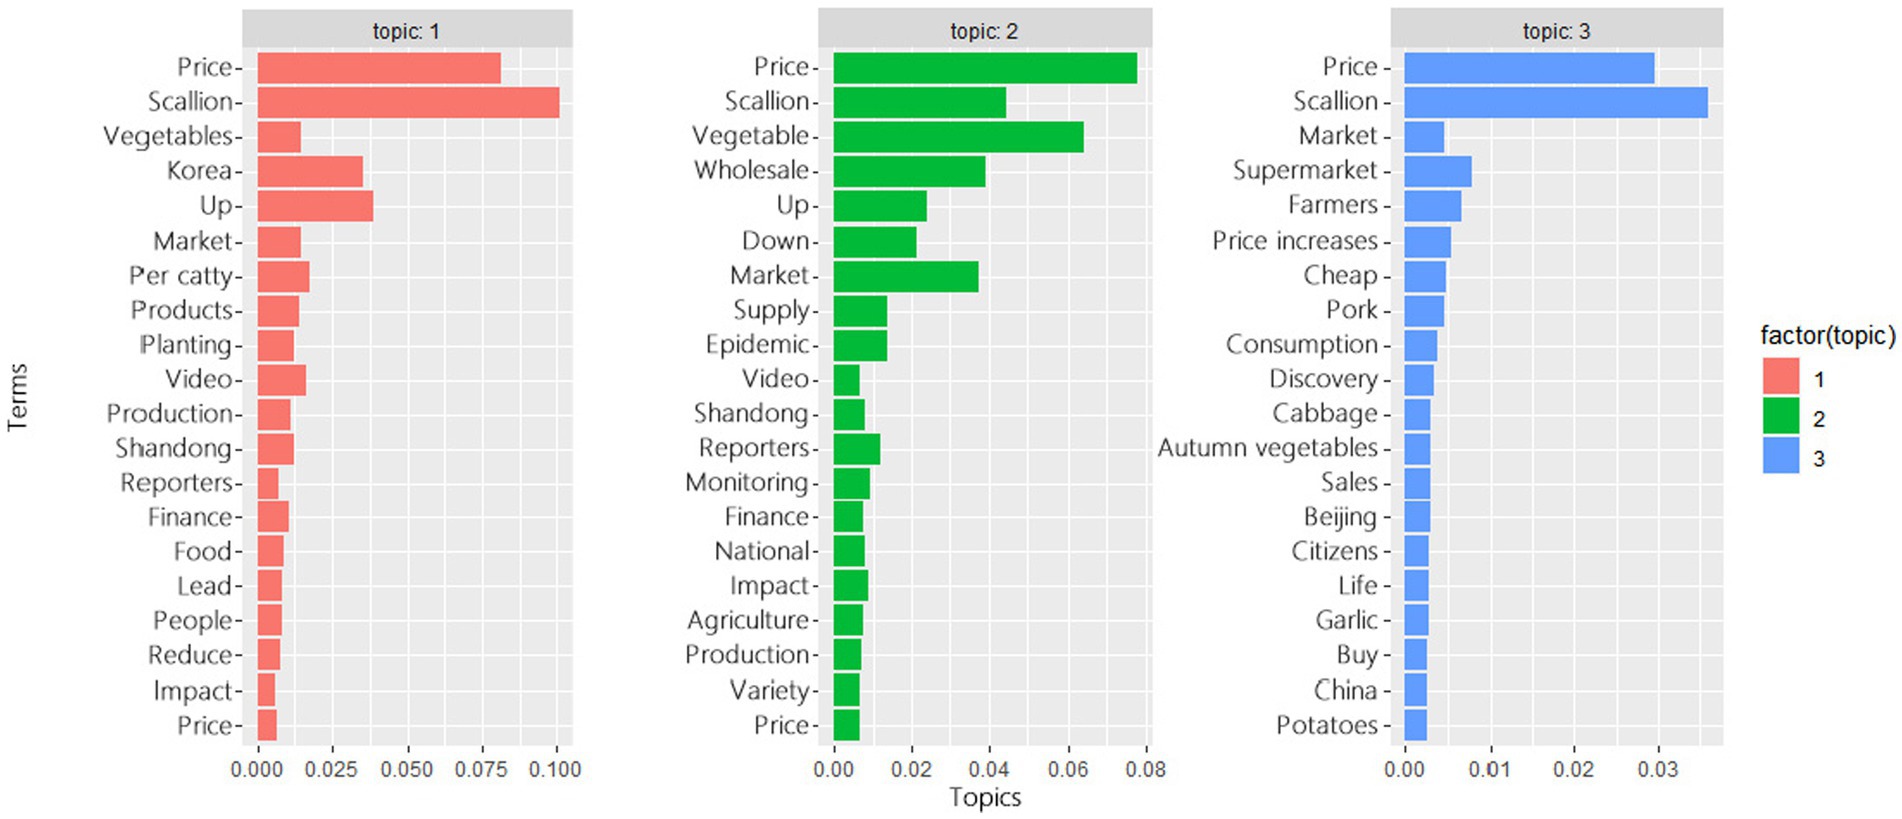
Figure 3. Three themes and their keywords extraction.
All of them contain repeated keywords such as scallion, price, vegetable, rise, fall, market and so on. It shows that the three themes extracted are related to the fluctuation of scallion price, which is consistent with the research direction of this paper. Now remove the keywords that are repetitive and have little significance to the theme extraction, filter the top 30 and unique keywords under each theme for further analysis, it aims to summarize the factors related to price in public opinion information and explain them, as shown in the Table 2.

Table 2. Three themes unique subject word display.
Employed a topic cluster discrimination method based on the Gamma function and Beta probability to associate factors with topics and topics with indices. This method allowed us to extract comments from the corpus that corresponded to the three identified topics. These comments were then processed and integrated into three separate datasets, consisting of 1,430, 2097, and 1,194 comments, representing proportions of 30.30, 44.43, and 25.28%, respectively. Notably, the second factor had the highest proportion, while the third factor had the lowest. This distribution suggests that discussions about prices by internet users are primarily linked to macroscopic factors, indicating a higher interest in understanding how scallion prices fluctuate under the influence of the pandemic and how the agricultural market evolves.
3.5 Hypothesis
To comprehensively assess public sensitivity and interest in online information about scallions, a fourth influencing factor, market attention, is introduced. The definition and calculation formula for this factor are provided in section 4.4. The following qualitative analysis examines the impact of different sentiment factors on scallion prices, with four research hypotheses for verification:
Market factors: These factors reflect market supply and demand dynamics, climate variations, and environmental conditions. Small-scale agricultural products like scallions often have fixed cultivation areas and dense planting, making them vulnerable to climate changes and natural disasters that can cause significant yield reductions, resulting in short-term price fluctuations.
Macroeconomic factors: These factors portray the overall economic environment and market development. In recent years, China’s agriculture has experienced stable growth with a positive market outlook. However, the global COVID-19 pandemic has severely affected agricultural production and market conditions. As the pandemic gradually recedes and national macroeconomic policies are enacted, the pandemic’s influence on agricultural product prices diminishes rapidly.
Relevant agricultural product prices: These factors primarily reflect the price fluctuations and market conditions of substitutes for scallion s, such as garlic, chili peppers, and ginger. Overall, the price trends of these agricultural products exhibit a certain degree of convergence. In the short term, the prices of these substitutes tend to mutually constrain each other.
Market attention factor: This factor indicates the level of attention and the attitude of various market participants toward information related to scallion price fluctuations. It also indirectly reflects the market expectations and investment behaviors of market speculators and distributors. When scallion prices experience fluctuations, it may trigger some investors to hoard or sell, further promoting price increases or decreases. This behavior can lead to short-term supply exceeding demand, causing rapid price fluctuations. Such market actions negatively impact the stability of scallion prices.
Based on the above considerations, this paper presents the following four hypotheses:
H1: The influence of market factors on the price stability of scallion shows a trend of negative higher than positive in the whole range.
H2: The stability of environmental factors on the price of scallion showed a trend of positive higher than negative effects in the early stage (the period when the epidemic did not spread), and a trend of negative effects higher than positive effects after the spread of the epidemic in the middle and late stages.
H3: The factors of agricultural products and their related products have a negative impact on the stability of the price of scallion, which is higher than the positive impact.
H4: In the short term, the attention factor has a positive trend higher than the negative impact on the stability of the price of scallion, while in the long term, it will show a negative trend higher than the positive impact.
4 Analysis method (quantify)
The above completed the qualitative analysis of public opinion factors, and then carried out the quantitative design of public opinion factors through natural language processing. The following diagram is the thinking flow chart of this chapter. The first part is the construction of basic dictionary, and the second part is the quantitative design of factors (Figure 4).
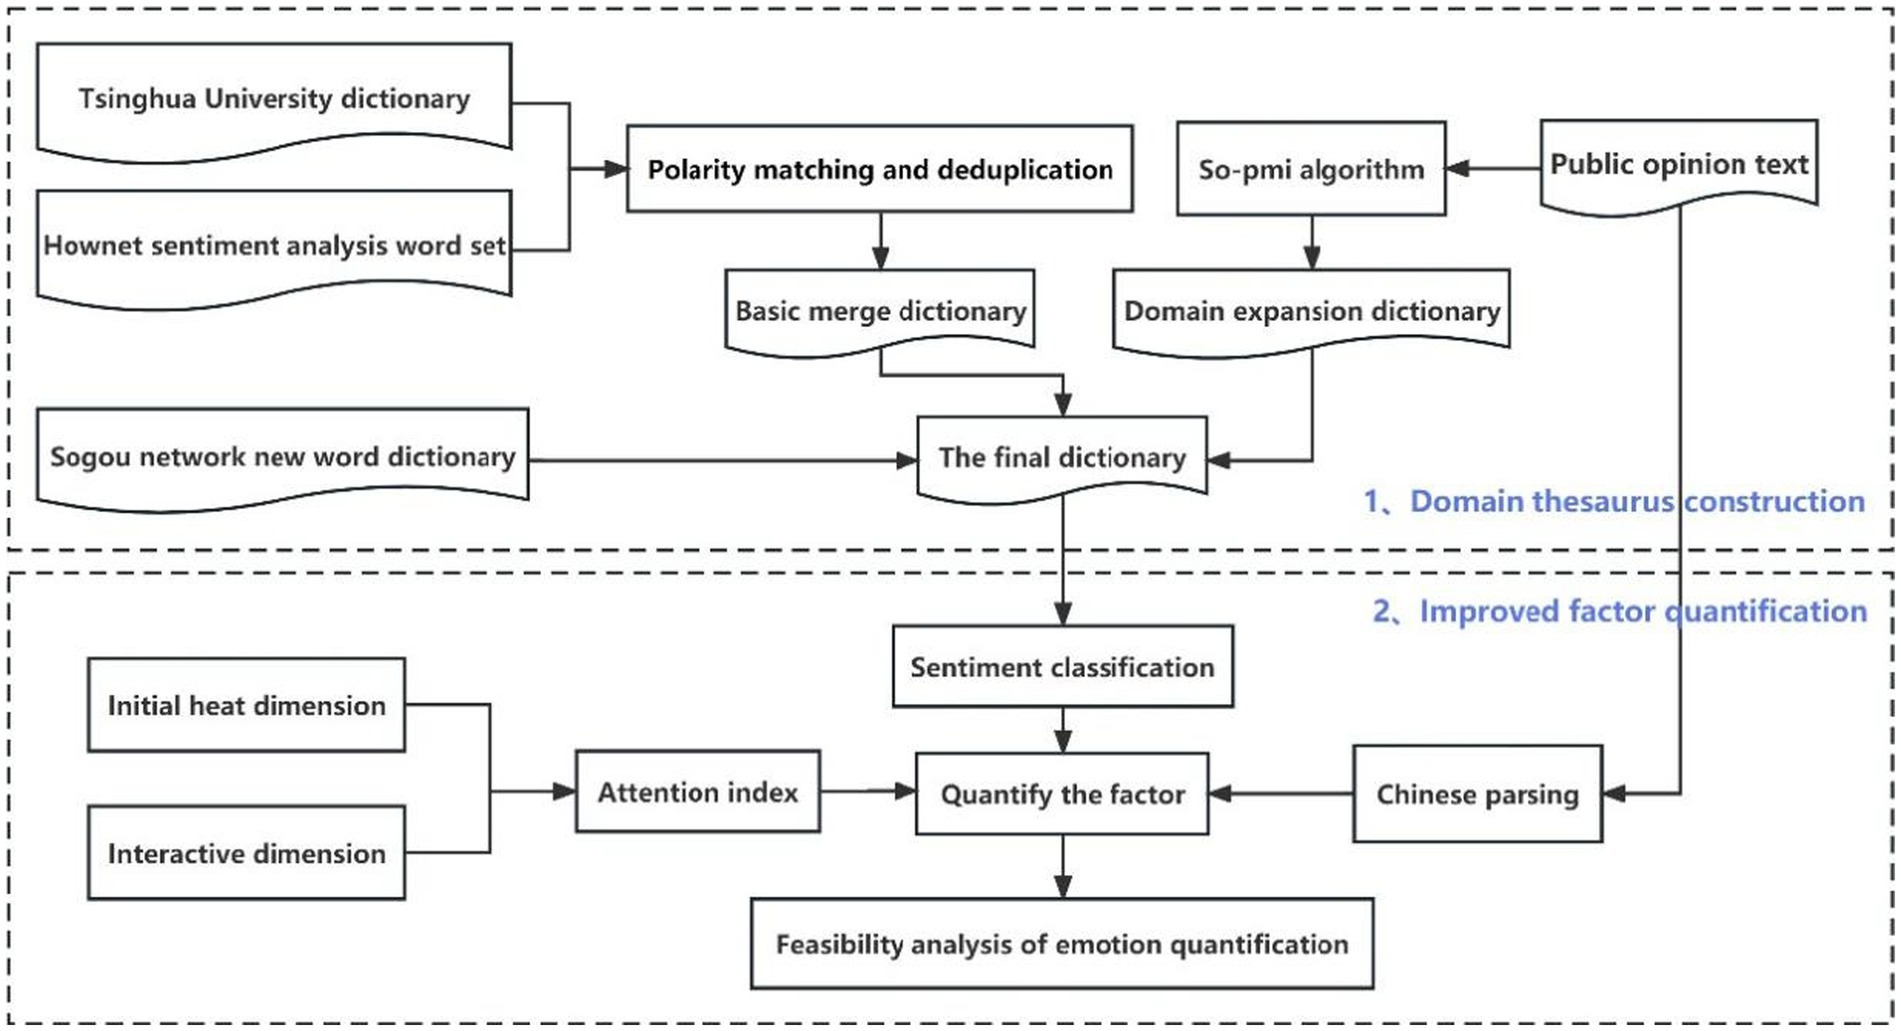
Figure 4. Flow chart of chapter 4.
4.1 Basic dictionary construction
The dictionary-based sentiment analysis method is effective for quantifying emotions in text data. However, calculating sentiment expectation values relies heavily on the accuracy of the sentiment lexicon. In practical applications, words like “rise,” “double,” and “fall” may have different emotional polarities in different domains. Thus, it’s crucial to create and expand emotion dictionaries specific to particular fields.
In this study, the resources are based on the “Hownet Sentiment Analysis Lexicon” and “Tsinghua University Chinese Positive and Negative Sentiment Lexicon.” Positive sentiment words from the former and positive words from the latter are deduplicated and merged, resulting in a positive sentiment lexicon. Similarly, a negative sentiment lexicon is created by establishing corresponding relationships. After merging and organizing these two lexicons, an expanded basic sentiment lexicon is obtained. Furthermore, the study incorporates popular new words from Sogou’s network to further enhance the sentiment vocabulary resources.
4.2 Dictionary expansion based on SO-PMI
The public opinion data contains market-specific words, so the domain words are further expanded based on the SO-PMI (Sentiment-oriented Pointwise Mutual Information) algorithm. The algorithm consists of two parts, which are the PMI algorithm ontology and the SO sentiment analysis prefix.
(1) Pointwise Mutual Information (PMI) is used to determine the probability of two words appearing at the same time in the corpus. As shown in Eq. (1):
P (swα, awβ) is the joint probability, that is, the probability that both appear in the corpus at the same time. P (swα) and P (awβ) represent the probability that both appear in the sample respectively, if PMI > 0, there is a certain correlation between the two words, and the greater the value, the stronger the correlation; if PMI = 0, the two words are independent and unrelated; if PMI < 0, the two words are mutually exclusive.
(2) The emotional tendency point mutual information algorithm uses the PMI algorithm to extract emotional words in the corpus, and then performs word-level semantic orientation (SO). The SO algorithm formula is as shown in Eq. (2):
The SO-PMI algorithm is derived from the above two, the words with known emotional polarity are selected as the benchmark discriminant words (emotional seed words). The emotional polarity is judged by judging the degree of association between strange words and emotional seed words in the corpus. As shown Eqs. (3, 4 and 5) bellow:
Here, pswα and nswα represent the selected positive and negative sentiment seed words, respectively, while awβ stands for the unknown sentiment polarity words to be determined from the corpus. For each unfamiliar word, the SOPMI output result determines the sentiment polarity: if it’s a positive value, the sentiment is positive; if it’s 0, it’s neutral; if it’s a negative value, the sentiment is negative. The specific word occurrence probability p is determined through the document frequency method. Building upon the SO-PMI algorithm, this paper further expands the domain-specific vocabulary. Some of the expanded words are presented in Appendix Table A1. After manually eliminating output words with unknown meaning or no effect on sentiment analysis, the expanded domain words in the previous two sections are summarized into the basic dictionary, and the weight design is carried out. The final domain dictionary is shown in the Appendix Table A2.
4.3 Emotional quantification methods
Based on the above dictionary, the three-factor quantitative design is carried out. The specific steps are as follows:
(1) The study focuses on each segmented sentiment text, which results from the tokenization process. Data is read and stored in lists using the R language’s Readxl package. The sentiment lexicon and the corpus are input, and sentiment words from the lexicon are merged based on their four different parts of speech categories. These merged words are then matched with indices in the text, with priority given to annotating positive and negative sentiment words, assigning them corresponding weights.
(2) To enhance sentiment analysis accuracy, syntactic analysis based on Chinese language usage rules is introduced: First, each sentiment text is checked for matching with degree adverbs. Second, considering the detected sentiment word as the center, the analysis verifies if the word’s preceding and following words match with negation words from a negation lexicon. Positive and negative sentiment expectation values (Spos, Sneg) for each sentiment text are then calculated based on whether the sentiment words’ preceding words are negation words or not, along with the weighted contribution of degree adverbs. As shown Eqs. (6, 7 and 8) bellow:
Where Wj is the weight of the jth degree adverb, i is the total number of degree adverb matching in each public opinion information, and W is the product of all degree adverb weights in each public opinion data.
(3) According to the dictionary and index matching principle, the positive emotional expectation value Spos and the negative emotional expectation value Sneg are output one by one to sum, and the final emotional score (emotional expectation value) corresponding to each public opinion data under each factor is calculated and output according to the factor classification result.
(4) Combine the three-factor emotional expectation results into a whole, take the final emotional expectation value as the standard, and the text emotion is positive when it is positive. The larger the value, the stronger the positive emotion; when is zero, the output text emotion is neutral; when it is negative, the text emotion is negative. The smaller the value is, the stronger the negative emotion is. The expected values of the three factors are shown in the Supplementary Material. The overall corpus output emotional score expectation is visualized in Figure 5.
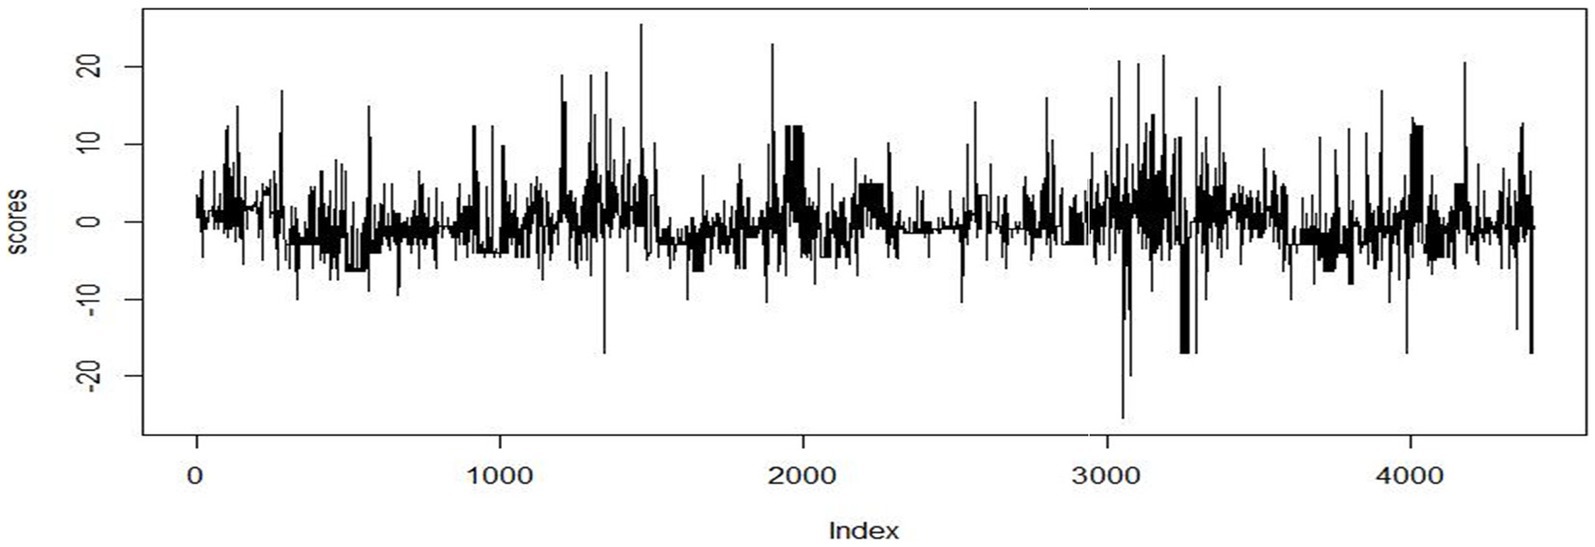
Figure 5. Visualization of emotional expectation.
4.4 Evaluation
(1)The validity of the dictionary is tested, and the validity of its construction is verified based on the dictionary matching degree, that is, the sum of the proportion of positive and negative text emotions is counted. The dictionary matching rate is 88.9995% (positive 35.12%, negative 53.87%, neutral 11.01%).
(2) Use performance metrics as a benchmark to test the rationality of the dictionary, including precision (P), recall (R) and accuracy (Acc). Among them, the corpus is divided into the following four situations based on the confusion matrix criterion: True Positive (TP), True Negative (TN), False Positive (FP), False Negative (FN), the calculation formulas for each performance indicator are shown in Eqs. (9, 10 and 11):
The sentiment analysis in this paper can be regarded as a two-classification problem, which is the positive and negative emotional attitude of netizens to the price of scallion. From the final output results, 472 public opinion data (about 10% of the total data) and their emotional classification results are randomly sampled, including 155 positive samples and 317 negative samples. Artificial verification screens out 7 FN (false negative examples) and 3 FP (false positive examples), so the confusion matrix is obtained: , combined with the accuracy measurement formula of the above model, the precision rate p = 98.065%, the recall rate R = 95.597%, and the accuracy rate Acc = 97.881% are calculated. The results show that the three evaluation indicators all meet the standards, which proves that the domain dictionary constructed is accurate and effective.
4.5 The fourth influencing factor
This paper designs indicators for the attention factor from two dimensions: initial popularity and interaction volume. The final attention index is obtained by multiplying the initial popularity dimension by the interaction volume dimension. The explanations and details of these two dimensions are provided below:
(1) Initial Popularity Dimension (H initial): Each topic is assigned an initial popularity value, which is positively correlated with the number of documents containing that topic within a specific time window. After obtaining the distribution of topic probabilities, a sliding average method is applied to segment the sentiment information data for each corresponding topic into time windows. This is used to calculate the topic strength values for different topics within each time window. As shown in Eq. (12):
(2) Interaction Volume Dimension (H interaction): Interaction volume is the most straightforward indicator for measuring content engagement. Generally, it is calculated by assigning different weighted values to various data metrics. Since page views have relatively low objectivity, they are not considered in this study. Instead, metrics like likes, comments, and shares are given importance based on their relevance to the research topic. Given the focus of this study on the content of discussions, higher weights are assigned to likes and shares, with a weighting ratio of 1.2:1:1.2. Based on this, the formula for calculating the interaction volume dimension, H interaction, the following Eq. (13) is shown:
In summary, the fourth chapter has completed the quantitative analysis of the improvement of four different factors, and the fifth chapter will carry out empirical analysis.
5 Results and discussion
5.1 Time serialization and unit root test
Based on the comments in the corpus, the total number of output variables is 4,721, and the period and price of each comment are unified, as shown in the Figure 6.

Figure 6. Price and index matching distribution visualization.
As depicted in the graph, discussions among internet users regarding scallion prices increase as the scallion prices rise. There are thousands of comments during the peak period of scallion prices, and this high level of discussion continues for an extended period. Conversely, when scallion prices are low, there are fewer comments from internet users, indicating lower levels of attention.
For monthly aggregated sentiment expectation values, the time unit is used. The dependent variable is denoted as scallion price (Y), and the independent variables are market factor (X1), macroeconomic factor (X2), agricultural product-related factor (X3) and Attention factor (X4). In the following discussion, variable names will be abbreviated. Pre-tests for each dataset were conducted, and the results indicate that all datasets pass the stationarity test, as shown in Appendix Table B1.
5.2 Cointegration test
To avoid the issue of “spurious regression,” this study employs cointegration tests to determine whether there exists a stable equilibrium relationship among several sets of data. Initially, the optimal lag order is determined, as indicated in Appendix Table B2. By considering five criteria, marked with an asterisk (*) under each criterion. Subsequently, the Johansen cointegration test is performed using the determined optimal lag order of “3.” The results are presented in the Table 3.
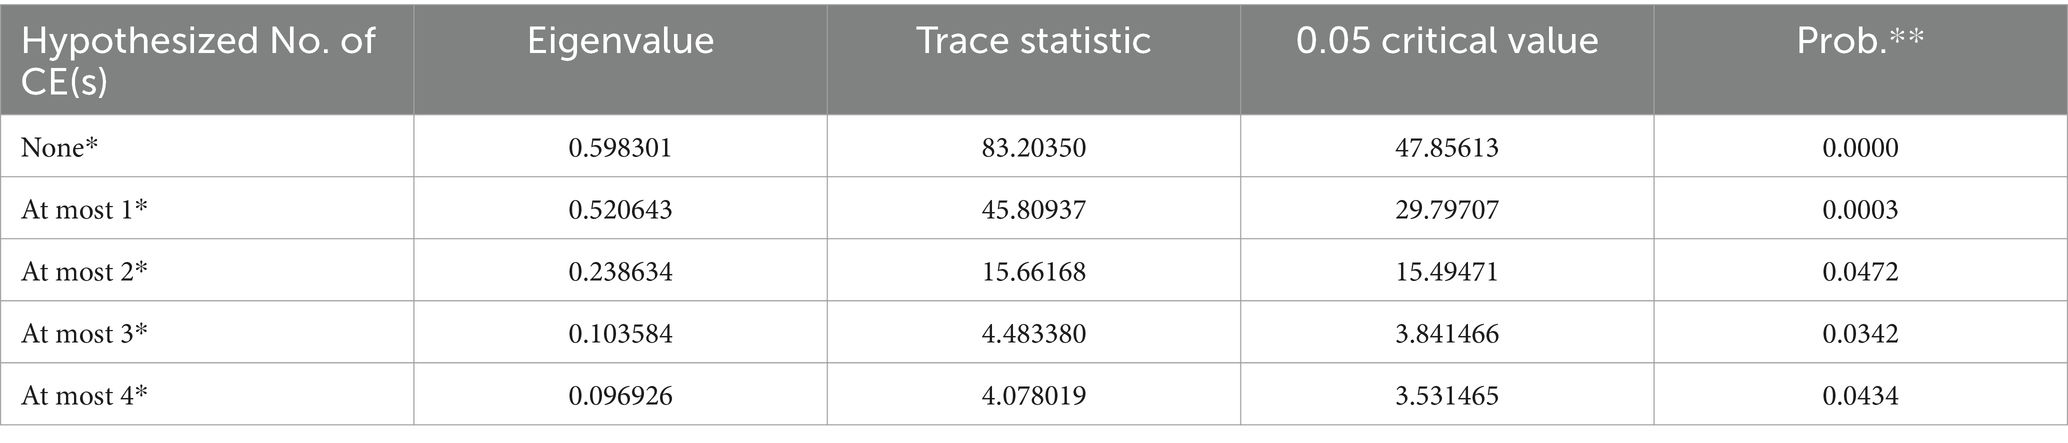
Table 3. Johansen cointegration test results.
The experimental results indicate that under all four hypothesis scenarios: “None,” “At most 1,” “At most 2,” and “At most 3,” the null hypothesis is rejected. This suggests that there exist cointegration relationships among the five sets of factors, not just one to four sets.
5.3 Granger causality test
Variables having cointegration relationships do not necessarily possess causal relationships. Therefore, conducting the Granger causality test further analyzes the causal relationships between variables. The results are presented in the Table 4.
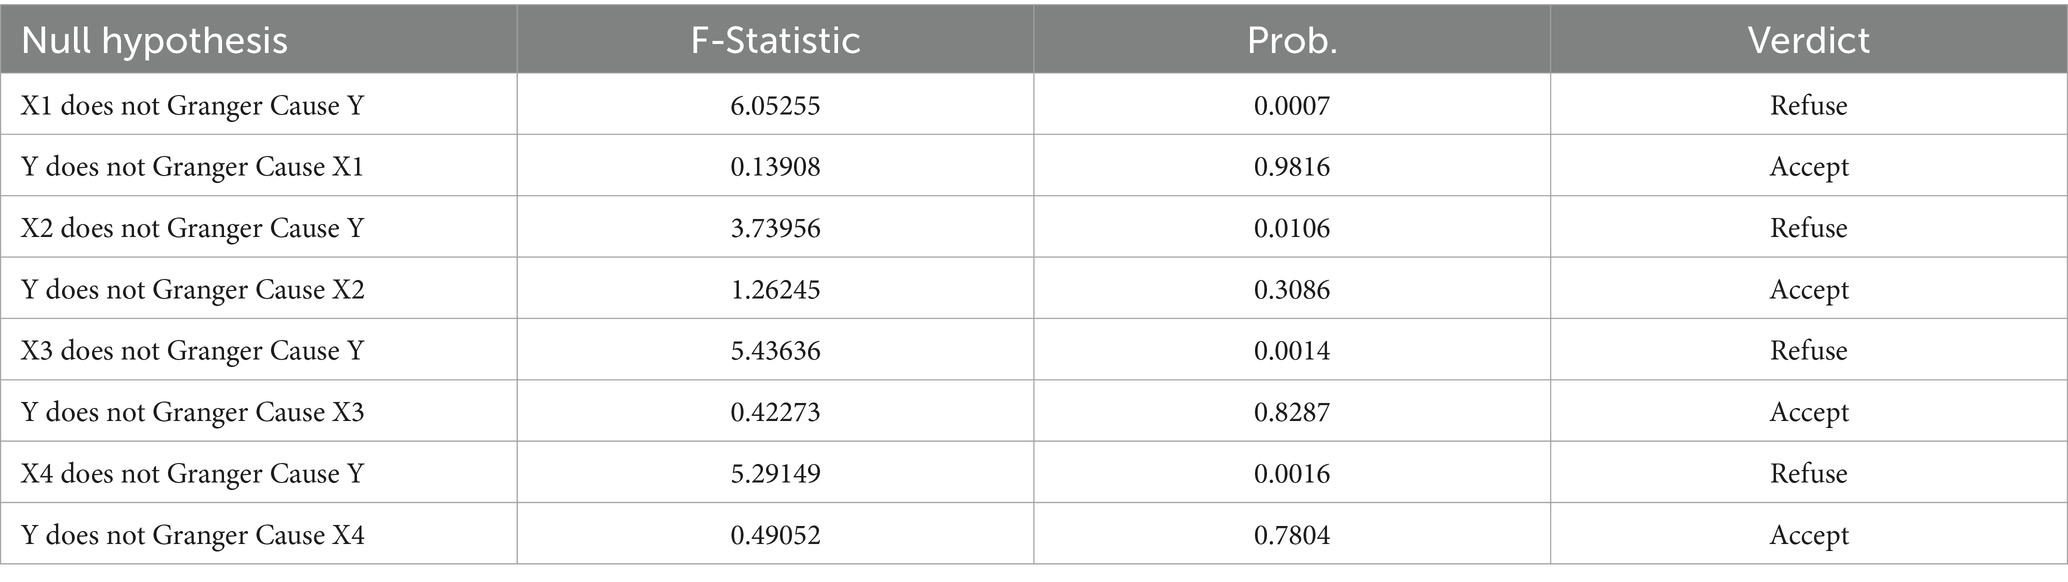
Table 4. Granger causality test results.
Based on the table above, it can be observed that in the context of Granger causality relationships between the four factors and scallion prices, X1, X2, X3, and X4 are considered Granger-causing factors for the variation in Y. However, in terms of the Granger causality relationships between scallion prices and the four factors, the Prob. values are all greater than the significance level of 0.05. Therefore, the null hypothesis is accepted, indicating that Y is not a Granger-causing factor for the changes in X1, X2, X3, and X4. In other words, all four groups of factors are considered one-way Granger-causing factors for scallion prices.
5.4 TVP-VAR model
In various periodic evolution processes, the effects of variables that follow the time series and have correlations differ in different stages, implying time-varying and nonlinear relationships. The TVP-VAR model’s time-varying coefficients can accurately represent changes in the lag structure and potential nonlinear characteristics over time. Small-scale agricultural product prices are influenced by external shocks, leading to changes in economic structure and public opinion characteristics. The fixed parameter model struggles to capture this structural change, making the time-varying parameter model a suitable choice for measurement analysis. The TVP-VAR model, based on the structural VAR model, is represented in the following form:
In Eq. (14), yt is a k × 1-dimensional observation vector, A is a k × k-dimensional simultaneous parameter matrix F1,…, Fs is a k × 1-dimensional coefficient matrix, and the disturbance term μt is a k × 1-dimensional structural shock. , The structural impact of the contemporaneous relationship is judged by the recursive method, and the simultaneous parameter matrix is a lower triangular matrix. A = , The simplified structural VAR model is obtained:
In Eq. (15) . Stacks the row elements in constitute dimension vector β and define , where ⊗ denotes the Kronecker score, and the model can be simplified as:
Relax the assumptions of the parameters in the above formula, that is, all the parameters conform to the time series characteristics. And the model can be simplified to Eq. (16):
In Eq. (17), the coefficient Simultaneous parameter matrix , Cvariance matrix with random fluctuations , All have time-varying.
According to the research of Primiceri and Nakajima, the elements of non-0 and 1 in the lower triangular matrix are stacked into a column of vectors, that is at=(a 21, a 31, a 32, a 41, …, a k, k-1), ream h t=(h 1 t, …, h kt), quorum . Similarly, it can also be assumed that these parameters follow a random walk process as described by Eqs (18, 19):
In which,
5.4.1 MCMC algorithm test
This study used the TVP-VAR model for empirical analysis. Initially, the MCMC algorithm estimated time-varying parameters in unobserved latent variables, with 10,000 samples. To ensure independent samples and robust estimation results, the first 1,000 samples were discarded to obtain effective samples. Appendix Table B3 presents the standard deviations, upper and lower 95% credible intervals, and posterior means of selected parameters based on MCMC estimation of the TVP-VAR model. All posterior means fall within the 95% confidence interval. Geweke statistics are all below 1.96, indicating that the null hypothesis of parameter convergence to the posterior distribution is not rejected at the 5% significance level. The pre-sampling during the iteration cycles effectively led the Markov chain to concentrate. The maximum value of ineffective factors is within an acceptable range, suggesting that the posterior distribution of various parameters was effectively sampled.
As depicted in Figure 7, in the top row, the first six parameters gradually decrease with small fluctuations, indicating autocorrelation in the data; the second row reveals stable data fluctuations within a certain range; the bottom row displays posterior distribution density functions, with parameters following normal or quasi-normal distributions, indicating well-behaved values. These findings collectively suggest stable, uncorrelated samples generated by the experimental simulation, and validate the effectiveness of MCMC for estimation.
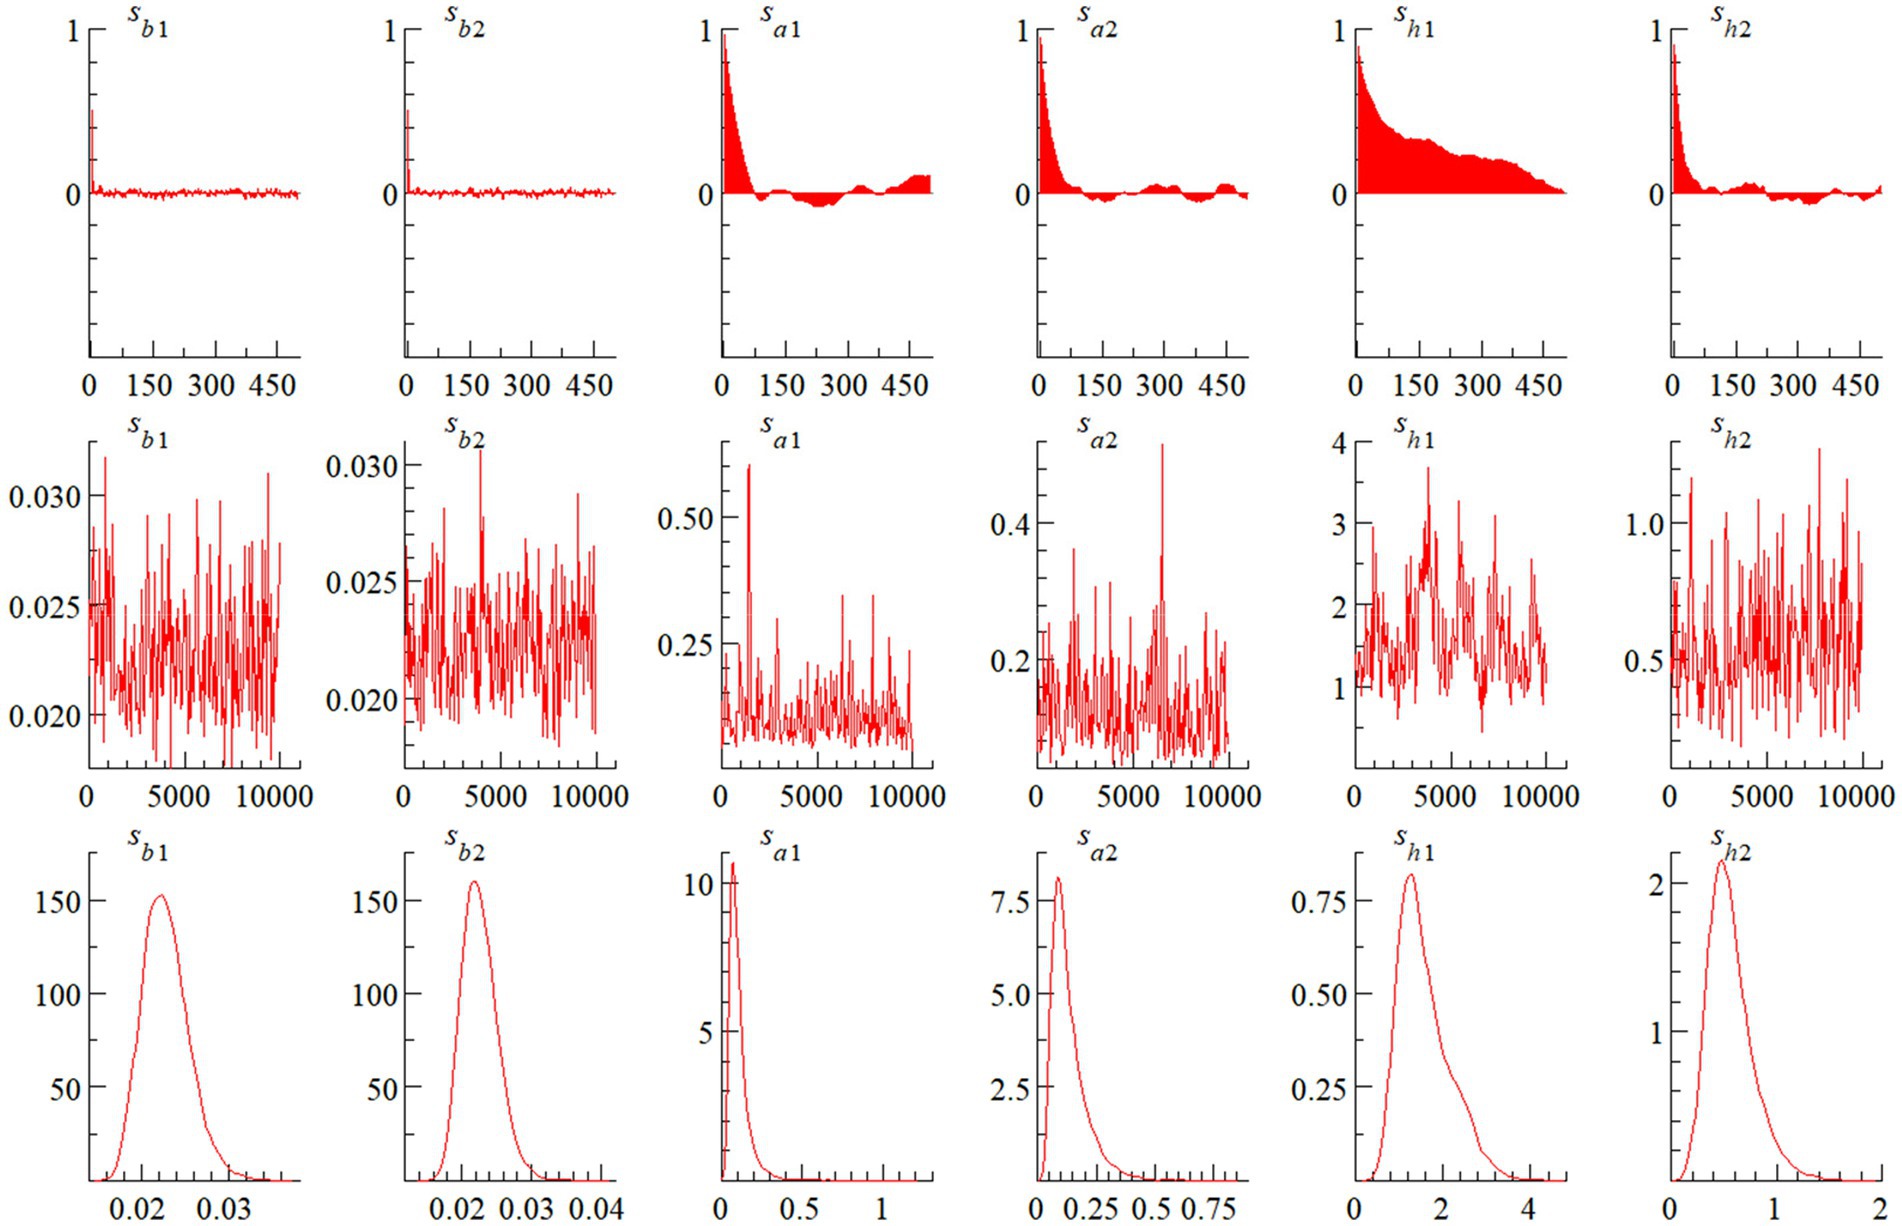
Figure 7. The graphical representation of MCMC algorithm estimation results.
5.4.2 Stochastic volatility analysis
Figure 8 presents the posterior estimates of the corresponding random volatility of the four factor-price pairs under structural shocks. The random volatility of X1 experiences minor fluctuations after the end of 2019, reaching its peak in November 2020, followed by a gradual decline until maintaining relative stability. The random volatility of X2 shows an overall increasing trend, reaching peaks in early 2021 and mid−2022. On the other hand, X3 and X4 both exhibit decreasing and increasing trends respectively, with relatively small fluctuations. The random volatility of Y reaches its peak in early 2021. Notably, each of the five factors exhibits unique patterns in random volatility within the same time window. Therefore, it becomes essential to analyze the dynamic spatiotemporal response of these factors to the fluctuations in scallion prices across different time periods, lag periods, and time points.
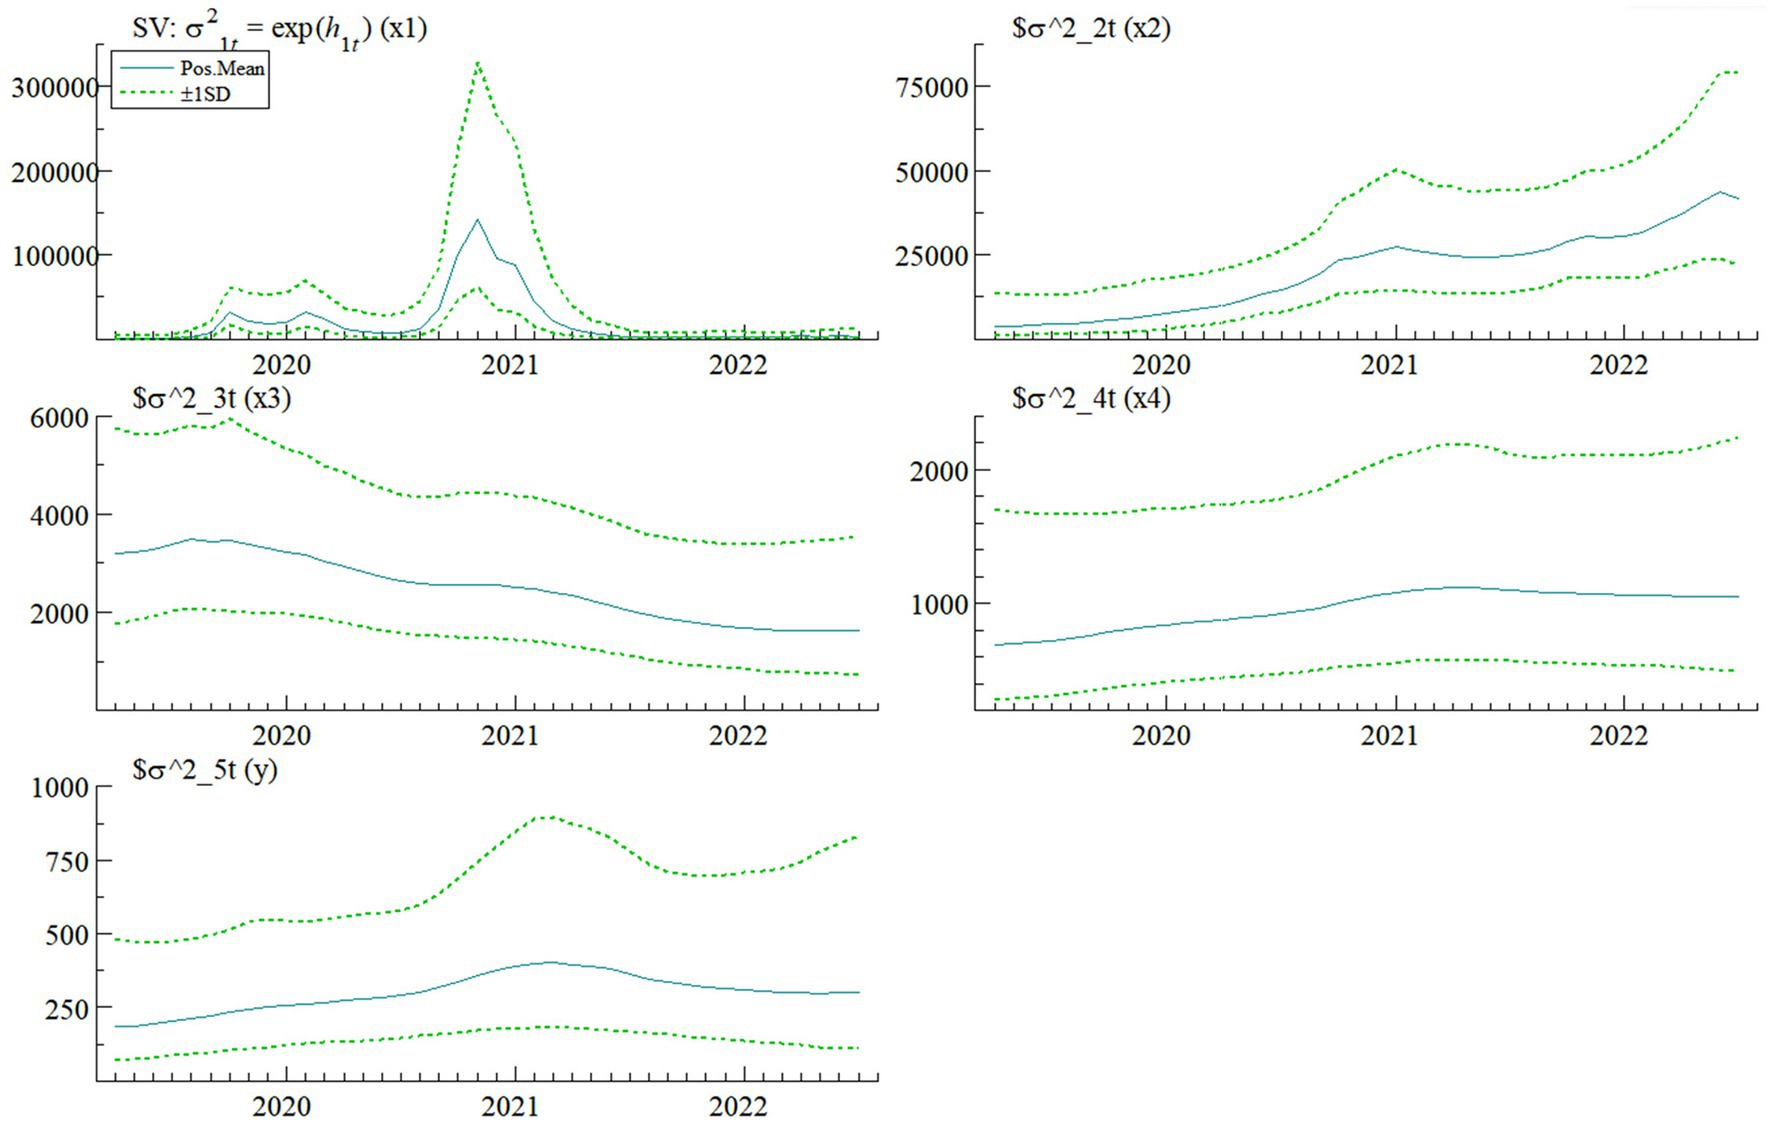
Figure 8. A posteriori estimation of stochastic volatility for structural shocks.
5.5 Test results for hypotheses
5.5.1 Conclusion based on time period
Figure 9 illustrates the dynamic impulse response of the four factors on Y, considering three different lag periods corresponding to short-term, medium-term, and long-term effects, represented by one month, two months, and one quarter, respectively. The study reveals that the impact of the four factor groups on Y is subject to time variation, indicating that as the trends of these factors evolve over their lifecycle, Y experiences continuous fluctuations. Furthermore, the effects of each factor on Y vary across different lag periods. In the case of X1 and X2, their influence on Y is not notably evident within a one-month lag, but becomes more significant over the span of one quarter. This phenomenon can be attributed to the fact that the growth cycle of scallion is typically around three to five months. As a small-scale agricultural product highly sensitive to market conditions, its price often displays quarterly fluctuations, leading to a similar pattern of lagged effects driven by market and environmental factors. Conversely, the influence of X3 and X4 on Y is most pronounced within a one-month lag period and weakest within one quarter. This could be attributed to the short-term attention people pay to scallion prices, often spanning one month.

Figure 9. Analysis of time-varying characteristics of equal pulse response with different lead times.
Compared to X1 and X2, the influence of X3 on Y is relatively more pronounced, yet the differences among these three factors are relatively small, with X4 having the least impact. Specifically, due to the low household consumption of scallions and weak price transmission to other agricultural products, the internal prices of small-scale agricultural products tend to mutually influence each other. In contrast to market and environmental factors, the significant impact of scallions’ intrinsic characteristics, as well as substitute products like ginger and garlic, becomes more evident.
For the four assumptions in 3.4, the empirical analysis of the results has a certain degree of verification. Among them, H2 and H3 have the highest conformity, while H1 and H4 have found more directions for analysis and interpretation:
X1: X1 has a stabilizing negative impact on Y in the early and middle terms, confirming the hypothesis H1. In the early and middle terms, X1 has a stabilizing negative effect on Y, and this can be attributed to two main factors. Firstly, in 2018, prolonged low scallion prices influenced scallion growers to reduce their cultivation areas in the early months of 2019, leading to a tighter supply in the scallion market. Secondly, adverse weather conditions in 2020–2021, especially in major scallion-producing regions like Shandong and Liaoning, including increased rainfall and unfavorable conditions like frost and flooding, resulted in lower scallion yields. This had a short-term negative impact on scallion prices. However, a turning point was observed in January 2022. The previous severe winter had reduced the supply and circulation of scallions. Nevertheless, increased buying and selling activities during traditional festivals and holidays, coupled with the circulation of scallions from overwintering greenhouses, balanced the supply–demand situation and maintained a healthier fluctuation in scallion prices during this period.
X2: X2 has a positive impact on Y in the early stages and a negative impact in the later stages, confirming hypothesis H2. This shift is attributed to two key factors: First, an increase in China’s GDP from 2019 to 2020 created a favorable economic environment and boosted consumer spending. Second, the government’s initiatives to address agricultural product scarcity, including scallions, in early 2019 were followed by the outbreak of the COVID-19 pandemic in late 2019. The pandemic’s impact on the scallion market had a delayed effect, with a turning point in February 2020 when it spread nationwide. The impact of COVID-19 on scallion prices was multifaceted, primarily due to disruptions in logistics, supply chains, and transportation caused by regional epidemic prevention measures. In April 2020, the government implemented macro policies to stabilize the agricultural market, which temporarily restored stability to most agricultural prices. However, a second turning point occurred in June 2020 as the pandemic escalated in major scallion-producing regions, leading to negative sentiments, panic buying, and increased negativity in the market until a peak in October 2020.After October 2020, the impact turned positive as the pandemic was effectively controlled, resulting in relative stability in scallion prices. These factors collectively explain the dynamic relationship between X2 and Y and its sensitivity to economic and pandemic-related fluctuations in the scallion market.
X3: X3 generally has a negative impact on Y’s stability, confirming hypothesis H3. The negative impact is attributed to the pandemic’s effect on the agricultural market. The pandemic disrupted the planting, cultivation, and transplanting of most vegetables, resulting in reduced planting areas, particularly in colder regions. These disruptions created imbalances in the supply and demand of agricultural products, leading to significant price fluctuations. Agricultural product prices experienced both surges and drops due to oversupply and undersupply. Among the 28 major vegetables, the average price increased over time, reaching a nearly decade-high at 4.66 yuan per kilogram during price surges. This price volatility extended to related products, resulting in sustained high prices. These fluctuations also affected scallion prices negatively over an extended period, as they were influenced by the overall instability in the agricultural market caused by the pandemic.
X4: The impact of variable X4 on the stability of variable Y exhibits a specific pattern: it is generally positive in the short term, turns negative in the medium term, and then becomes positive again in the long term, confirming hypothesis H4. This pattern can be attributed to various factors: In the short term, people’s attention to scallion prices can mitigate market failure risks to some extent. As prices rise, stakeholders may perceive opportunities for profit by stockpiling scallions during price drops or selling them during price increases. This behavior can lead to an increase in scallion cultivation across different regions, creating an imbalanced supply and demand in the market. Additionally, activities of dealers, such as price manipulation and speculative trading, can contribute to positive price fluctuations. These factors combined can result in a short-term positive impact on scallion prices; In the medium term, the surge in scallion cultivation driven by profit motives can lead to an oversupply situation, causing prices to decrease. During this period, the interests of various stakeholders might lead to market imbalances and price volatility, explaining the observed negative impact; In the long term, sustained attention and intervention from government authorities or relevant organizations could help correct market imbalances and abnormal price fluctuations. Their actions might aim to balance the interests of growers and dealers and address market failures, contributing to the observed positive impact in the long term.
Overall, the shifting impact of X4 on scallion prices over different time periods is the result of a complex interplay of factors, including market behavior, stakeholder interests, and regulatory interventions.
5.5.2 Conclusion based on time point
Initially selected the adjacent time points of January, February, and March 2021, corresponding to the peak of random fluctuations in Y. This allowed us to examine the effects of the four factors during periods of more pronounced scallion price volatility. The impulse response trends of Y at different time points are influenced to varying extents by the four factors. There is a consistent pattern of convergence in the impulse responses at adjacent time points, yet the strength of the responses varies over time (Figure 10).
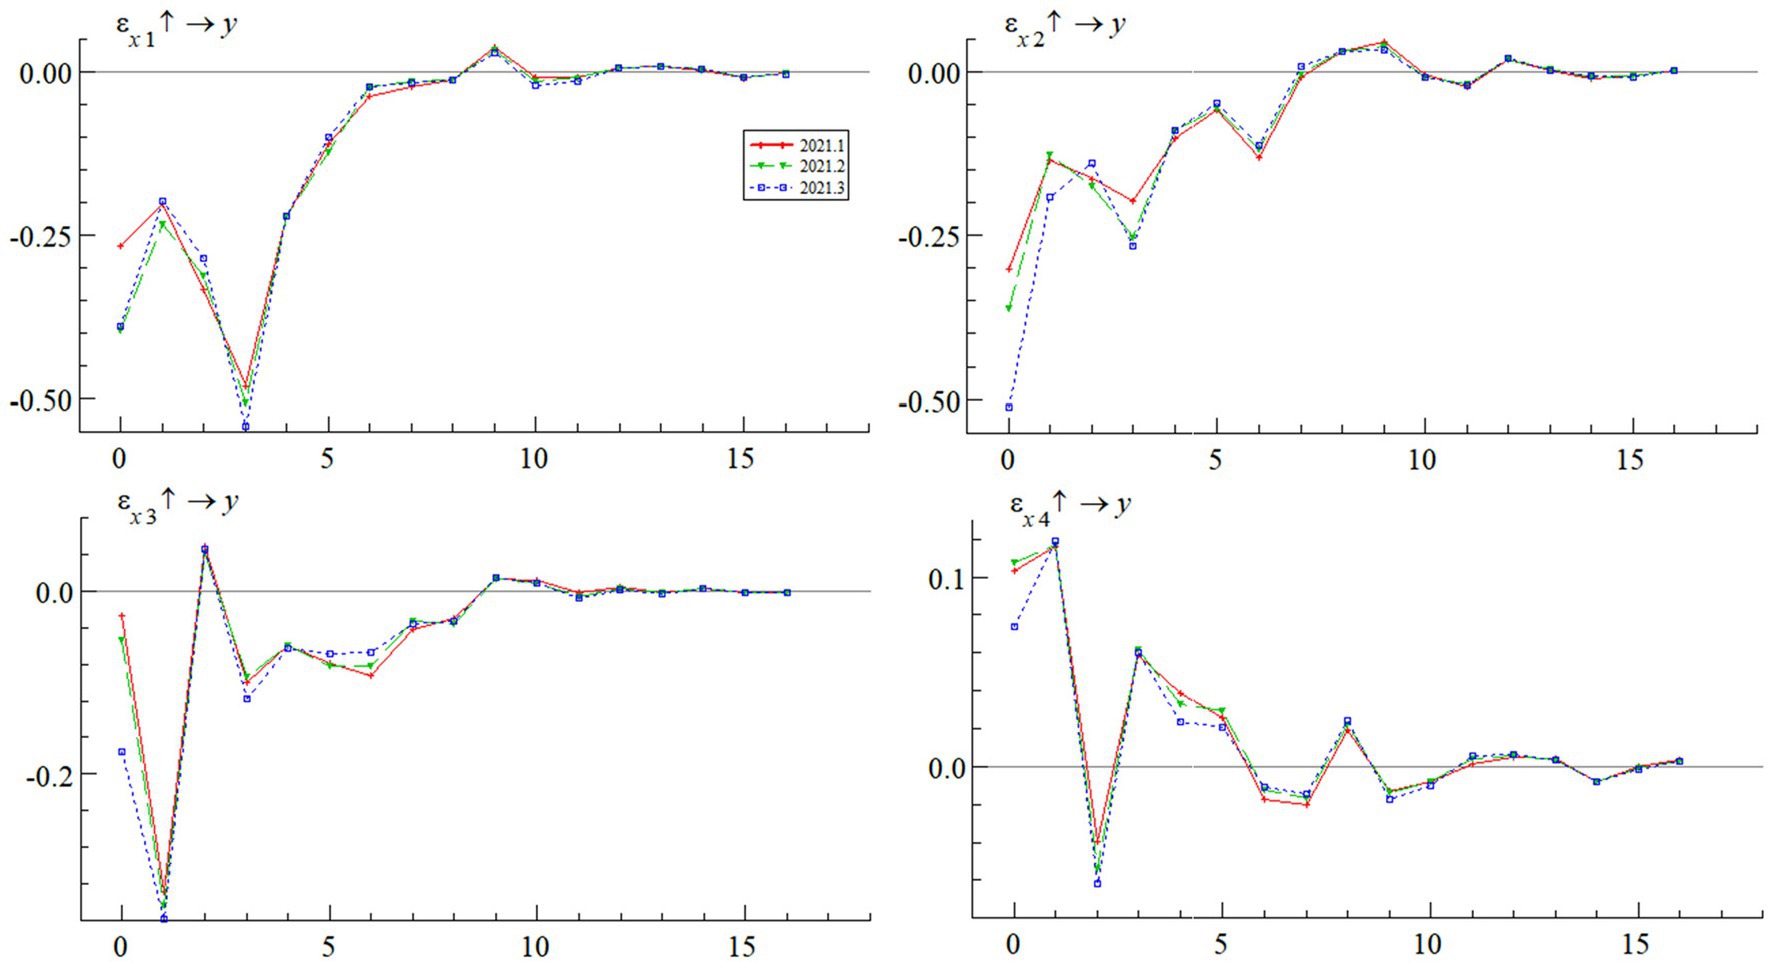
Figure 10. Time-varying characteristics of impulse response at different time points (adjacent).
In terms of impulse response patterns, the impact of different factors on scallion prices (Y) follows specific trends:
X1: Initially, rise then decline in the first period, reaching a peak around the third period, and eventually stabilize with minor fluctuations around zero.
X2: Impulse responses influenced by X2 show an abrupt increase at first, with turning points at the first, third, sixth, and ninth periods, converging to zero around the seventh period.
X3: The impulse response decreases sharply initially, peaks at the first period, undergoes substantial changes, and gradually stabilizes with minor fluctuations around zero by the ninth period.
X4: In the case of X4, the impulse response initially rises slightly, reaches a peak at the first period, experiences a sharp decline to the second period’s peak, abruptly increases to the third period, and gradually decreases to a moderate fluctuation around zero.
Importantly, except for X4, the impulse responses to Y converge to zero around the eighth period. This indicates that the impacts of the first three factors do not extend beyond eight months, emphasizing that unusual fluctuations in scallion prices are most pronounced during this period. On the other hand, the influence of X4 on exceptional fluctuations in Y remains substantial, persisting up to the twelfth period, suggesting that X4’s impact on the unusual volatility of Y lasts for a year or longer. This prolonged impact is mainly attributed to the rapid growth of the internet and the increasing influence of social media on people’s lives.
In terms of the intensity of impulse responses, there are specific trends for each of the factors on their impact on variable Y:
X1 and X2: Both exhibit their maximum negative impacts on Y at the third period, and they consistently lean toward negativity throughout the sample interval. This suggests that during periods of relatively strong price fluctuations, X1 and X2 tend to have negative effects on Y.
X3: X3 reaches its maximum negative impact at the first period, briefly shifts to a positive influence at the second period, and then primarily maintains a negative influence.
X4: X4 achieves its maximum impact at the 1 and 2 periods, with only two negative impacts within the first six periods. Beyond the sixth period, a pattern of alternating positive and negative impacts emerges. This suggests that X4 has a short-term positive effect on Y, while its long-term influence varies, depending on the public’s attitudes and the specific actions of stakeholders (Figure 11).
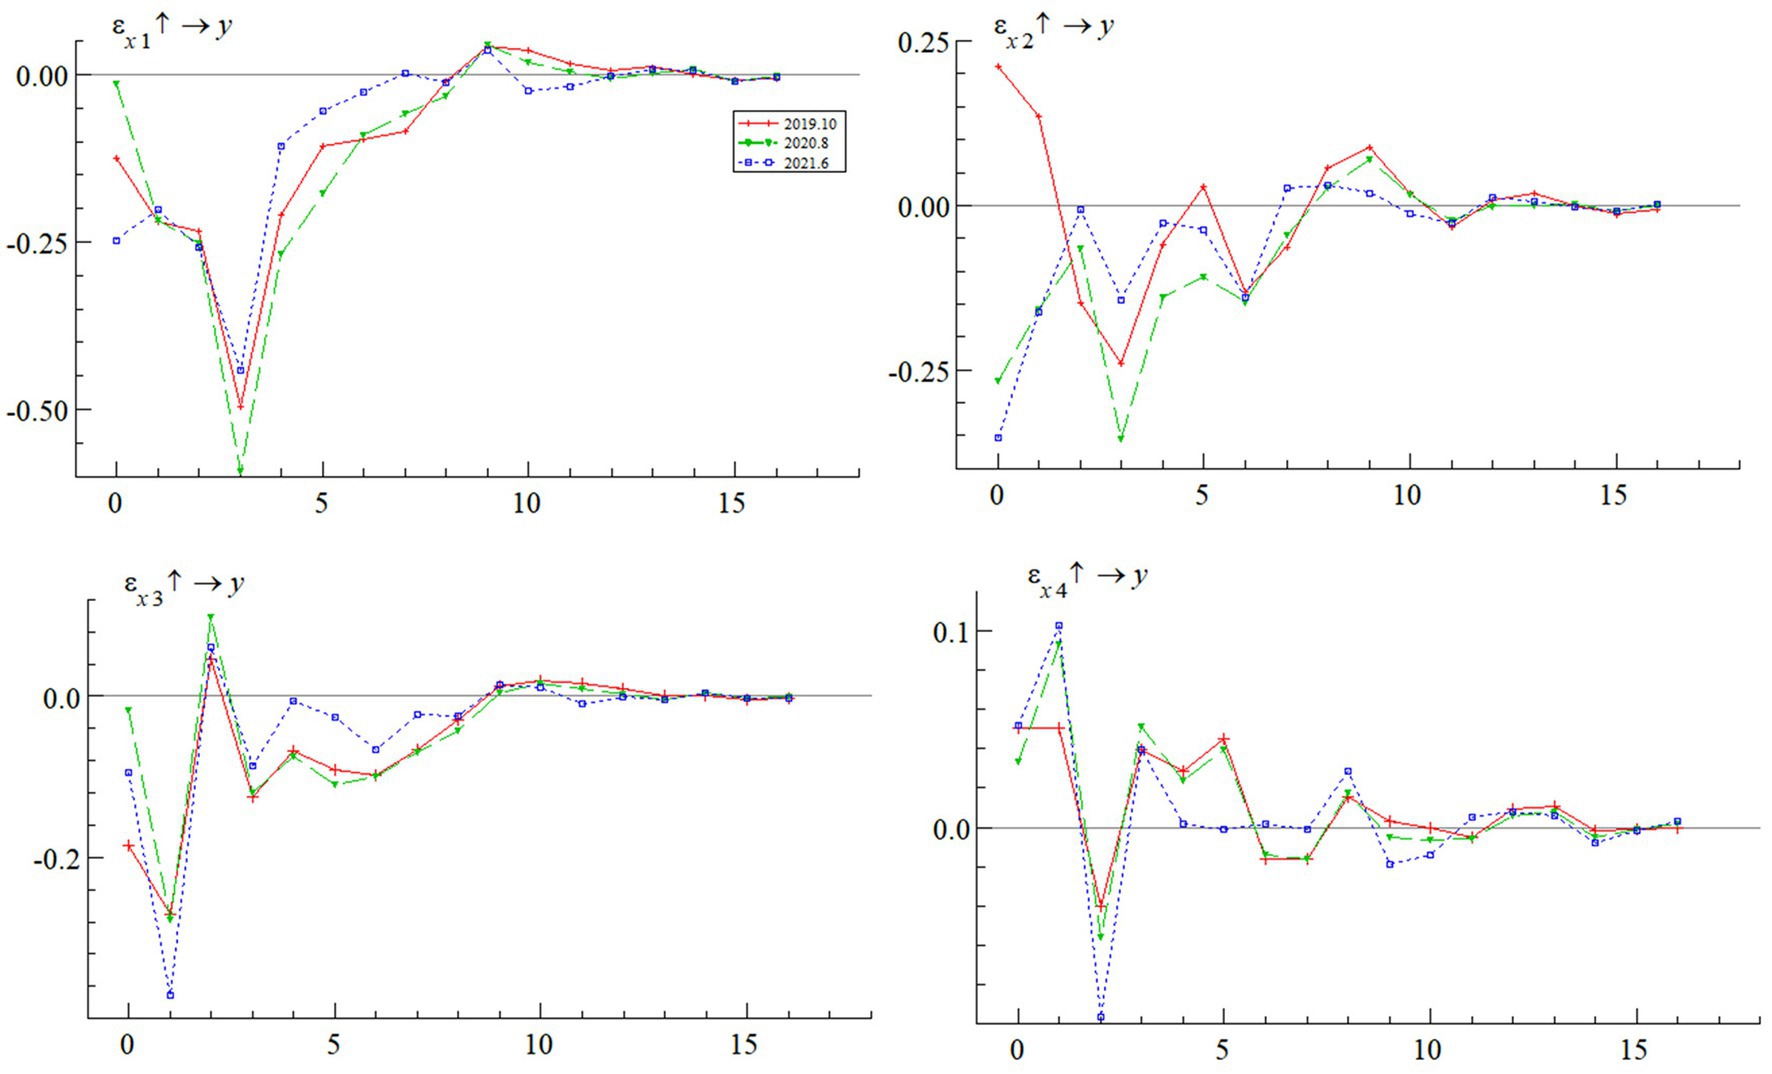
Figure 11. Time-varying characteristics of impulse response at different time points (feature points).
Furthermore, considers three distinct time points, October 2019, August 2020, and June 2021, based on whether variable Y is higher, lower, or near its mean value. Among the factors, X1 and X2 exhibit the most significant heterogeneity across these time points, suggesting that these two factors change in response to shifts in online sentiment, and the differences observed over time continue to expand.
Taking X2 as an example at the selected time point, in the upper-right corner of the graph, its impact is positive at the end of 2019, then turns negative as the COVID-19 pandemic began spreading in early 2020, indirectly influencing price fluctuations. Interestingly, when prices are slightly higher, the impact of X2 is somewhat more pronounced compared to time points with prices near or below the mean value, conversely, the impact of X4 varies due to market trends, unforeseen events, or shifts in public attitudes driven by news, resulting in uncertain effects across different time points. In contrast, the variations in the effects of X1 and X3 are relatively minor across the chosen time points. This is due to the market’s intrinsic self-regulatory capacity, including interventions from relevant authorities and policy adjustments, contributing to a similar trend in direction and intensity.
Throughout these shifts in time points, market factors consistently have the strongest impact, followed by environmental factors and the influence of the agricultural product itself and related products, which are roughly balanced. Attention-related factors have the smallest impact, regardless of the changes in time points.
6 Conclusions and policy implications
The study, using scallions as an example and employing the LDA-NLP-TVP-VAR model from a network perspective, analyzes key factors influencing abnormal fluctuations in small-scale agricultural product prices. The conclusions drawn from the analysis are as follows:
1. Over the past three years, the four factors affecting scallion prices have exhibited distinct changing trends and varying degrees of influence, especially within longer cycles. Market factors, representing supply–demand dynamics and production elements, have remained the primary drivers of agricultural product prices. However, the COVID-19 pandemic has triggered negative emotions among the public, significantly affecting the fluctuations in scallion prices from 2019 to 2022, the result is consistent with the findings by Liu et al. (2022) and Qu et al. (2022). As the pandemic stabilized and is brought under control after 2021, the influence of the socio-economic environment on price fluctuations rapidly diminished.
2. The impact of market, environmental, related agricultural prices, and market attention on scallion prices varies over time, showing lagged patterns. Market and environmental factors have more extended quarterly lag effects, while factors linked to other agricultural prices and market attention have shorter monthly lag effects. Dynamic responses are stronger during times of high scallion price volatility, aligning with the lifecycle theory, the result is consistent with the findings by Shao et al. (2021).
3. Over different times and periods, there is noticeable variation in the impact of the four factors. From mid-2019 to early 2020, during the spread of the COVID-19 pandemic, environmental factors and market attention significantly affected scallion prices, reflecting socio-economic conditions, a similar finding was also obtained by Lamsiyah et al. (2023). As the pandemic came under control, these factors fluctuated but generally decreased. In contrast, market factors had a growing impact over time, emphasizing that short-term price fluctuations are influenced by socio-economic conditions and specific events, while market factors have a stronger influence over longer periods.
Based on the above characteristics, we can propose two recommendations for the government to stabilize onion prices:
Establish a flexible policy control mechanism given that onion prices are influenced by multiple factors, especially during special events such as the COVID-19 pandemic, the socio-economic and market attention factors have a significant impact on price fluctuations. The government can establish a flexible policy control mechanism to promptly respond to market changes. In the short term, emergency measures such as implementing price subsidies and controlling exports can be adopted to stabilize prices. In the long term, the government should conduct market monitoring and investigations to understand the supply–demand situation and formulate more long-term policies to stabilize production and supply.
Enhance market supervision and information transparency considering the time-varying and lagging characteristics of market, environmental, related product prices, and market attention factors, the government can strengthen market supervision and enhance information transparency to increase market visibility. Timely collection and dissemination of market information related to onions, including supply and demand conditions, environmental factors, and prices of related agricultural products, can assist market participants in better predicting market changes. This, in turn, helps adjust production and supply plans, mitigating the impact of market fluctuations. Additionally, the government can prevent market manipulation and unfair competition by strengthening supervision of market behavior, ensuring a fair competitive environment.
Through these two recommendations, the government can better address the volatility of onion prices, taking both short-term emergency measures to respond to special events and long-term actions through information transparency and market supervision to promote the stability of the market.
This study has certain limitations. Firstly, there are constraints in the scope of collecting public opinion information. In addition to the Weibo network platform, platforms for public expression of opinions and viewpoints, as well as media, include various types of news forums, industry-specific websites, and other social platforms. The relevant network information on different types of platforms may encompass a more diverse range of topics. Moreover, information from different platforms possesses distinct dissemination rates and coverage, necessitating the need for further expansion in the collection and analysis of public sentiment information from various network platforms. Additionally, consideration should be given to the impact of different sentiment diffusion ranges and propagation speeds on the fluctuations in prices of small-scale agricultural products. On the other hand, this paper primarily focuses on examining the impact of market operating environments and factors such as public expectations and attention on the prices of small-scale agricultural products from the perspective of online public sentiment. The influence of factors such as market supply and demand based on statistical data has not been considered at this point. In the future, it is crucial to integrate the analysis of market supply and demand, input of production factors, climate change, and other factors with relevant online sentiment, delving into the impact of various factors on the price fluctuations of small-scale agricultural products under different time windows and socio-economic development backgrounds. This will further refine the analysis of the transmission mechanism and the development of prediction and warning mechanisms for small-scale agricultural product prices, providing a scientific basis for decision-making for farmers and the government.
Data availability statement
The raw data supporting the conclusions of this article will be made available by the authors, without undue reservation.
Author contributions
LF: Conceptualization, Funding acquisition, Investigation, Methodology, Project administration, Resources, Supervision, Writing – review & editing. HZ: Data curation, Formal analysis, Software, Validation, Visualization, Writing – original draft.
Funding
The author(s) declare that financial support was received for the research, authorship, and/or publication of this article. This study has received funding support from Heilongjiang Natural Science Research Fund and General Project of Philosophy and Social Science of Heilongjiang Province, grant number: 20SHB080.
Conflict of interest
The authors declare that the research was conducted in the absence of any commercial or financial relationships that could be construed as a potential conflict of interest.
Publisher’s note
All claims expressed in this article are solely those of the authors and do not necessarily represent those of their affiliated organizations, or those of the publisher, the editors and the reviewers. Any product that may be evaluated in this article, or claim that may be made by its manufacturer, is not guaranteed or endorsed by the publisher.
Supplementary material
The Supplementary material for this article can be found online at: https://www.frontiersin.org/articles/10.3389/fsufs.2024.1355853/full#supplementary-material
Footnotes
References
Balcilar, M., Sertoglu, K., and Agan, B. (2022). The COVID-19 effects on agricultural commodity markets. Agrekon 61, 239–265. doi: 10.1080/03031853.2022.2078381
Cabezas, J., Moctezuma, D., Fernández-Isabel, A., and de Diego, I. M. (2021). Detecting emotional evolution on twitter during the COVID-19 pandemic using text analysis. Int. J. Environ. Res. Public Health 18:20. doi: 10.3390/ijerph18136981
Cao, D. L., Ji, R. R., Lin, D. Z., and Li, S. Z. (2016). A cross-media public sentiment analysis system for microblog. Multimedia Systems 22, 479–486. doi: 10.1007/s00530-014-0407-8
Chen, C. R., Ishfaq, M., Ashraf, F., Sarfaraz, A., and Wang, K. (2022). Mediating role of optimism Bias and risk perception between emotional intelligence and decision-making: a serial mediation model. Front. Psychol. 13:9. doi: 10.3389/fpsyg.2022.914649
Diaz, M., and Panangadan, A. (2020). Natural language-based integration of online review datasets for identification of sex trafficking businesses. 2020 IEEE 21st Int. Conf. Inf. Reuse Integr. Data Sci. 2, 259–264. doi: 10.1109/iri49571.2020.00044
Dybowski, T. P., and Adämmer, P. (2018). The economic effects of US presidential tax communication: evidence from a correlated topic model. Eur. J. Polit. Econ. 55, 511–525. doi: 10.1016/j.ejpoleco.2018.05.001
Fan, S. G., Si, W., and Zhang, Y. M. (2020). How to prevent a global food and nutrition security crisis under COVID-19? China Agric. Econ. Rev. 12, 471–480. doi: 10.1108/CAER-04-2020-0065
Guo, F., Liu, P. Z., Zhang, C., Chen, W. J., Han, W., Ren, W. M., et al. (2019). Research on the law of garlic Price based on big data. CMC-Comput. Mat. Contin. 58, 795–808. doi: 10.32604/cmc.2019.03795
Hui, L., and Ninghui, L. (2014). Empirical analysis on the reasons for Price fluctuation of small variety agricultural products: based on a survey of mung bean farmers in Baicheng City, Jilin Province. Agric. Technol. Econ. 2, 76–84. doi: 10.13246/j.cnki.jae.2014.02.008
Jia, C., Chunping, X., and Qiongxia, Q. (2021). The impact of the COVID-19 on China's pork prices. China Agric. Univ. 26, 259–271.
Jun, M., and Xingchen, L. (2021). Research on the characteristics and regularity of Price fluctuation of small agricultural products in China: analysis based on ARCH model. Price Theory Practice 87, 90–197. doi: 10.19851/j.cnki.cn11-1010/f.2021.11.401
Kim, H.-E., Park, Y.-W., Yoo, S.-e., Jeong, S. W., and Yoo, J. (2022). An accurate stock Price forecasting with ensemble learning based on sentiment of news. IEMEK J. Embedded Syst. Appl. 17, 51–58. doi: 10.14372/iemek.2022.17.1.51
Lamsiyah, S., El Mahdaouy, A., Ouatik, S. E., and Espinasse, B. (2023). Unsupervised extractive multi-document summarization method based on transfer learning from BERT multi-task fine-tuning. J. Inf. Sci. 49, 164–182. doi: 10.1177/0165551521990616
Liu, Z. (2018). Simulation study on Price fluctuation mechanism and influencing factors of small agricultural products: taking garlic products as an example. Price Theory Practice, 94–97. doi: 10.19851/j.cnki.cn11-1010/f.2018.01.024
Liu, Z., He, S., and Liu, Y. (2021). A method to identify traffic incidents based on social network data. J. Transport Inform. Safety 39, 53–60.
Liu, J. X., Leu, J. S., and Holst, S. (2023). Stock price movement prediction based on Stocktwits investor sentiment using FinBERT and ensemble SVM. PeerJ Comput. Sci. 9:25. doi: 10.7717/peerj-cs.1403
Liu, Y. Q., Liu, S., Ye, D. P., Tang, H., and Wang, F. (2022). Dynamic impact of negative public sentiment on agricultural product prices during COVID-19. J. Retail. Consum. Serv. 64:16. doi: 10.1016/j.jretconser.2021.102790
Lv, X. C., Meng, J., and Wu, Q. F. (2022). Dynamic influence of network public opinions on Price fluctuation of small agricultural products based on NLP-TVP-VAR model-taking garlic as an example. Sustain. For. 14:21. doi: 10.3390/su14148637
Mittal, V., Gangodkar, D., and Pant, B. (2021). Deep graph-long short-term memory: a deep learning based approach for text classification. Wirel. Pers. Commun. 119, 2287–2301. doi: 10.1007/s11277-021-08331-4
Pan, D., Yang, J. Q., Zhou, G. Z., and Kong, F. B. (2020). The influence of COVID-19 on agricultural economy and emergency mitigation measures in China: a text mining analysis. PLoS One 15:20. doi: 10.1371/journal.pone.0241167
Park, C. S., and Kaye, B. K. (2017). The tweet goes on: interconnection of twitter opinion leadership, network size, and civic engagement. Comput. Hum. Behav. 69, 174–180. doi: 10.1016/j.chb.2016.12.021
Qu, G. L., Lou, Y. Q., Wu, S. Y., Deng, X., and Feng, J. (2022). Impact of novel coronavirus pneumonia on agricultural products prices: a case study of Chengdu. Agric. Basel 12:1688. doi: 10.3390/agriculture12101688
Rao, Y. H., Lei, J. S., Liu, W. Y., Li, Q., and Chen, M. L. (2014). Building emotional dictionary for sentiment analysis of online news. World Wide Web 17, 723–742. doi: 10.1007/s11280-013-0221-9
Shao, X., Li, D., and Liu, Y. (2021). Characteristics of the COVID-19 epidemic Stage,Public sentiment, and agricultural product Price: an empirical study based on the Weibo text mining. J. Sichuan Agric. Univ. 39:688.
Su, H., Liu, Q., and Mu, C. (2019). Research on product reviews hot spot discovery algorithm based on MapReduce. J. Univ. Sci. Technol. China 49, 112–118. doi: 10.3969/j.issn.0253-2778.2019.02.005
Wan, C., Wang, Y. L., Liu, Y. Z., Ji, J. C., and Feng, G. Z. (2019). Composite feature extraction and selection for text classification. IEEE Access 7, 35208–35219. doi: 10.1109/ACCESS.2019.2904602
Wang, X. (2023). How Chinese attitudes toward COVID-19 policies changed between June and early December 2022: risk perceptions and the uses of mainstream media and WeChat. SSM Popul. Health 23:9. doi: 10.1016/j.ssmph.2023.101467
Wang, L., Niu, J. W., and Yu, S. (2020). SentiDiff: combining textual information and sentiment diffusion patterns for twitter sentiment analysis. IEEE Trans. Knowl. Data Eng. 32, 2026–2039. doi: 10.1109/TKDE.2019.2913641
Wani, M. A., Agarwal, N., Jabin, S., and Hussain, S. Z. (2018). User emotion analysis in conflicting versus non-conflicting regions using online social networks. Telemat. Inform. 35, 2326–2336. doi: 10.1016/j.tele.2018.09.012
Weng, W. H., Wagholikar, K. B., McCray, A. T., Szolovits, P., and Chueh, H. C. (2017). Medical subdomain classification of clinical notes using a machine learning-based natural language processing approach. BMC Med. Inform. Decis. Mak. 17:13. doi: 10.1186/s12911-017-0556-8
Yang, Y., Zhang, Y., Zhang, X., Cao, Y., and Zhang, J. (2022). Spatial evolution patterns of public panic on Chinese social networks amidst the COVID-19 pandemic. Int. J. Disaster Risk Reduct. 70:102762. doi: 10.1016/j.ijdrr.2021.102762
Yao, S. (2021). A study on the Price fluctuation characteristics and influencing factors of small agricultural products: taking garlic based durable storage agricultural products as an example. Price Theory Practice 8, 100–103+186. doi: 10.19851/j.cnki.CN11-1010/F.2021.08.252
Yucel, A., Dag, A., Oztekin, A., and Carpenter, M. (2022). A novel text analytic methodology for classification of product and service reviews. J. Bus. Res. 151, 287–297. doi: 10.1016/j.jbusres.2022.06.062
Zhang, Y. X., and Jiaojiao, L. (2022). Research on Price risk identification and response strategies of small agricultural products: taking scallions, gingers, and garlic as examples. Price Theory Practice 10, 111–114+213. doi: 10.19851/j.cnki.cn11-1010/f.2022.10.267
Keywords: small-scale agricultural products, price affecting factors, natural language processing, sentiment analysis, TVP-VAR model
Citation: Fu L and Zhang H (2024) Analysis of factors influencing small-scale agricultural product prices from the perspective of the online public—a case study of China. Front. Sustain. Food Syst. 8:1355853. doi: 10.3389/fsufs.2024.1355853
Edited by:
Petr Prochazka, Czech University of Life Sciences Prague, CzechiaReviewed by:
Josef Abrham, Czech University of Life Sciences Prague, CzechiaJanpriy Sharma, University of Trento, Italy
Jana Soukupová, Czech University of Life Sciences Prague, Czechia
Copyright © 2024 Fu and Zhang. This is an open-access article distributed under the terms of the Creative Commons Attribution License (CC BY). The use, distribution or reproduction in other forums is permitted, provided the original author(s) and the copyright owner(s) are credited and that the original publication in this journal is cited, in accordance with accepted academic practice. No use, distribution or reproduction is permitted which does not comply with these terms.
*Correspondence: Huaxu Zhang, czIxMDcwMjA3NUBuZWF1LmVkdS5jbg==