 Yang Yuan†
 Changshi Ren
 Tian Zhao
 Yinchen Wang
- Department of Pratacultural Research, Guizhou Institute of Animal Husbandry and Veterinary Science, Guiyang, China
The antioxidant activity of honey is mainly evaluated based on its phenolic acid and total flavonoid content, while other parameters are not considered important. The purpose of this study is to comprehensively evaluate the impact of honey's physicochemical indicators and the altitude of the collection site on its quality. This study measured physical and chemical indicators in Dalbergia hainanensis Merr. et Chun honey (DH), blueberry honey (BH), Eriobotrya japonica Lindl. honey (EH), and Rhus chinensis Mill. honey (RH) and then combined them to comprehensively analyze the influencing factors of honey's antioxidant capacity using correlation analysis, principal component analysis (PCA), and regression analysis. The results showed that the 2,2′-azinobis-(3-ethylbenzthiazoline-6-sulfonate) (ABTS+) clearance ability of DH (17.60 ± 4.61 mg/ml) was significantly better than the other three varieties of honey (p <0.05). The results of the correlation analysis showed that the IC50 of the ABTS+ clearance rate was significantly negatively correlated with total flavonoid, Vitamin B1 (VB1), and Vitamin C (VC) content, as well as the a* and b * values, while positively correlated with elevation. The PCA results showed that the principal components (PCs) with eigenvalues exceeding 1 explained 86.28% of the variation. The IC50 of the ABTS+ clearance rate and altitude play an essential role in PC1, suggesting that two indicators are important in distinguishing different honeys. The regression analysis showed that total flavonoid and Vitamins B1 and C content, as well as elevation, are indispensable parameters affecting the antioxidant properties of honey. These results provide a reference method for evaluating the quality of honey from different places and altitudes.
1 Introduction
Honey is a natural sweetener and a health supplement rich in biological activity and possesses nutritional and essential medicinal properties. It is a natural source of nutrients required for human metabolism (Al-Waili et al., 2013; Sakač et al., 2019) and is widely used in food and medicine (Eteraf-Oskouei and Najafi, 2013; Molan and Rhodes, 2015; Johnston et al., 2018). Honey mainly contains carbohydrates (fructose and glucose), functional oligosaccharides, and water, and secondary components such as organic acids, enzymes, vitamins, minerals, and phenolic compounds (Carvalho et al., 2009; Da Silva et al., 2016; Sowa et al., 2017; Cianciosi et al., 2018).
The antioxidant properties of honey are critical indicators for evaluating its value, and previous studies have emphasized that the phenolic acid and flavonoid content of honey determine the strength of its antioxidant properties and quality. Earlier research suggested that honey with higher total phenolic acids possesses higher antioxidant properties such as in Christmas vine [Turbina corymbosa (L.) Raf ], Morning glory (Ipomoea triloba L.), Black mangrove (Avicennia germinans Jacq.), Linen vine (Govania polygama (Jack) Urb), and Singing bean [Lysiloma latisiquum (L.) Benth] (Alvarez-Suarez et al., 2010). The total phenolic content in 39 honey species, such as rosemary, orange, thyme, arbutus, locust pod shrub, and heather, was a key variable explaining the antioxidant activity of bayberry and black locust pod honey in southern Portugal (Alves et al., 2013). The antioxidant properties of 13 varieties of honey, such as that from strawberry tree (Arbutus unedo), buckwheat (Fagopyrum esculetum), chestnut (Castanea sativa), sulla (Hedysarum coronarium), clover (Trifolium incarnatum), dandelion (Taraxacum officinalis), chicory (Chicorium intybus), and acacia (Robinia pseudoacacia), were strictly related to their phenolic content and honey color intensity (Beretta et al., 2005). Honey from Clidemia and Myrcia was found to possess higher levels of total phenols and therefore higher antioxidant activity (Da Silva et al., 2013). The high concentration of phenolic compounds in propolis explains its remarkable antioxidant effects (Saroglu et al., 2023).
Although the phenolic content in honey is an essential reason for its antioxidant activity (Beretta et al., 2005; Wang et al., 2011; Da Silva et al., 2013), the total phenolic content in honey itself is insufficient to determine its complete antioxidant activity (Gül and Pehlivan, 2018). Studies have shown that the total phenolic content alone is inadequate to measure antioxidant activity (Natella et al., 1999; Pekkarinen et al., 1999; Antolovich et al., 2004). Some authors reported that the total phenolic content in honey cannot be positively correlated with its antioxidant activity at any time (Al-Mamary et al., 2002; Küçük et al., 2007). Research shows that the flower source determines honey quality (Castiglioni et al., 2017; Boussaid et al., 2018; Shakoori et al., 2024), along with elevation (Neupane et al., 2015), climate (Liang et al., 2018; Liu et al., 2022), color value (Beretta et al., 2005), vitamins and amino acids (Liu et al., 2023), and other parameters (Gül and Pehlivan, 2018). Another study suggested that the bee hive's geographical locations and plant resources directly and significantly correlate with honey quality (Gül and Pehlivan, 2018; Shakoori et al., 2024). This close relationship is reflected in the fact that, on the one hand, the effective substances in plants follow the collecting bees into the beehive and ferment into honey. On the other hand, the components in honey can be tracked and localized to plant resources (Haidamus et al., 2019; León-Canul et al., 2023). In contrast, the species Rosaceae, Amaranthaceae, Fabaceae, and Asteraceae had the greatest impact on honey's antioxidant activity (Shakoori et al., 2024). However, in existing studies, some underlying factors have been given less importance, and few consider the contribution of various indicators in honey to its antioxidant properties based on an overall perspective, making it difficult to evaluate the value of honey comprehensively.
Guizhou province, located in the southwestern region of China, has a subtropical monsoon climate. The mountainous areas in the province vary significantly in altitude, but the altitudes are below 2,700 m. The vegetation is dense in the Guizhou province, and the forest cover exceeds 62% (Li et al., 2001). Rhus chinensis Mill. (Sapindales: Anacardiaceae), Dalbergia hainanensis Merr. et Chun (Lamiales: Fabales: Fabaceae), and Eriobotrya japonica Lindl. (Rosales: Rosaceae) are widely distributed throughout the province. Guizhou province is the largest area for blueberry cultivation in China (Li et al., 2001). Previous studies showed that Rhus chinensis Mill. honey (RH) contains highly antibacterial active ingredients (Tajima et al., 2016; Sun et al., 2018), while Dalbergia hainanensis Merr. et Chun honey (DH) has a high amino acid content (Pan et al., 2022). Their total phenol and flavonoid content, as well as DPPH• and ABTS+ free radical scavenging abilities of Eriobotrya japonica Lindl. Honey (EH) collected by Apis cerana is relatively high (Zhao et al., 2021), and the total phenolic content is positively correlated with its antioxidant activity (Cao et al., 2005). The polyphenol and total flavonoid content in blueberry honey (BH) is significantly correlated with ABTS+ and DPPH• radical clearance IC50 values (Ran et al., 2020).
Above all, the unique geographical environment prevailing in the Guizhou province endows it with a distinct climate, vegetation distribution, and growth patterns. Therefore, it is crucial to investigate honey's composition and nutritional levels in these unique climate and terrain conditions to support the growth and high-quality development of the honey industry.
This study focused on analyzing the physical and chemical characteristics, composition variations, and their impact on antioxidant performance among four distinctive types of honey in the Guizhou province. The findings may contribute significant data to understand the composition variations and quality of distinctive honey types.
2 Materials and methods
2.1 Experimental honey source
The four honey types used for this study came from beekeepers in Guizhou province from mature Apis cerana. All samples were stored in a 4°C refrigerator for use. The source information for honey is shown in Table 1.
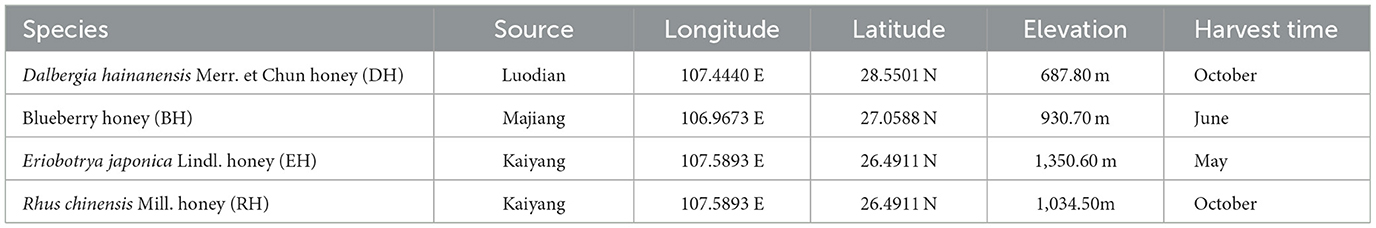
Table 1. Source information for experimental honey.
2.2 Test equipment and reagent
All chemicals and reagents were analytically pure and purchased from Solarbio (Beijing Solarbio Science & Technology Co., Ltd., China). Gallic acid, rutin, glucose, and quercetin were purchased from Sigma-Aldrich (Shanghai) Trading Co., Ltd. The spectrophotometer (UV-2550) and colorimeter (CR-400) were produced by Shimadzu Corporate Management (China) Co., Ltd.
2.3 Determination of total sugar, total phenol acid, and total flavonoid content
The soluble sugar content was measured using Anthone sulfate method, which can decompose sucrose into soluble glucose and fructose in water under the action of sulfuric acid. The specific steps of soluble sugar detection can be found in Liu (2012). The presence of phenolic substances was determined using Folin–Ciocalteu colorimetry (Fonte et al., 2013). A volume of 50 μL of diluted honey, 425 μL of distilled water, and 125 μL of Folin–Ciocalteu reagent were added to a reaction tube, stirred, and left to stand for 6 min. Then, 400 μL of 7.1% sodium bicarbonate solution was then added. After standing for 1 h in dark conditions, the absorbance was read at 760 nm. The standard curve was constructed using gallic acid. The analysis was carried out three times, and the results were expressed as the relative amount of gallic acid (mg GAE/100 g honey). The total flavonoid content was determined using the sodium nitrite–aluminum nitrate method (Du et al., 2019). First, 5% sodium nitrite, 10% aluminum nitrate, and 4% sodium hydroxide solutions were prepared for use. Second, 5 g of each of the above solutions was added to 5 ml of distilled water to prepare a 1 g/ml solution. Third, to 1 ml of solutions from step 2, the following were added: 1 ml of ethanol (70%), 0.5 ml of the prepared sodium nitrite solution, and 0.5 ml of aluminum nitrate solution. After 6 min of reaction, 4 ml of the prepared sodium hydroxide solution was added, and after a further 6 min, 3 ml of ethanol (70%) was added. Finally, the absorbance value was measured at 510 nm after 15 min. The total flavonoid content in the sample was calculated according to the standard curve, expressed as the relative amount of rutin (mg RE/100 g honey).
2.4 Determination of the ABTS+, DPPH•, and hydroxyl radical scavenging rate IC50 values
A modified method based on Zheng et al. (2015) was used to test the ABTS+ scavenging rate IC50. The working ABTS+ solution was obtained by mixing 10 ml of ABTS+ solution (10 mmol/L) and 176 μl of potassium persulfate solution (140 mmol/L). A mass of 1.2 g of different honey samples was weighed and dissolved in 30 ml of distilled water to produce 0.04 g/ml sample solutions, to which 4 ml of working solution was added, mixed well, and allowed to stand for 30 min in the absence of light. The absorption value was measured at 734 nm. ABTS+ free radical semi-inhibition rate was calculated according to the Equation (1):
Note: Ab is the absorption value of the blank control, and As is the absorption value of the test sample.
The DPPH• clearance rate was determined according to Brand-Williams et al. (1995). After absorbing 5 ml DPPH• mother liquor containing 50 ml of 95% ethanol, a 0.1 mmol/L DPPH• ethanol solution was prepared. A volume of 2 ml of honey sample was added to different test tubes, and 2 ml of the above DPPH• ethanol solution was added. After mixing, it was allowed to stand for 30 min in the dark. Then the absorbance value at a wavelength of 517 nm was determined. Each sample's DPPH• free radical clearance rate IC50 value was calculated according to Equation (2):
Note: Ac is the absorption value of the blank control, and As is the absorption value of the test sample.
The hydroxyl radical scavenging rate was determined according to Kunchandy and Rao (1990). A mass of 0.3336 g of ferrous sulfate was weighed and dissolved in 200 ml of distilled water to form a ferrous sulfate solution. A mass of 0.1656 g of salicylic acid was weighed and dissolved in 200 ml of ethanol (95%) to prepare a salicylic acid ethanol solution. A volume of 140 μl of hydrogen peroxide was absorbed and added to 300 ml of distilled water to prepare a hydrogen peroxide solution. A mass of 24 g honey sample was weighed and dissolved in 30 ml of distilled water. Then 2.0, 1.6, 1.2, 0.8, and 0.4 mL of the resulting solution were removed, respectively, into test tubes. Distilled water (2 ml) was added to each test tube, followed by 2 ml of the ferrous peroxide already prepared and 2 ml of hydrogen peroxide already prepared. Each test tube was mixed well and left to stand for 10 min, then 2 ml of the above salicylic acid ethanol solution was added, mixed well, and left to stand for 30 min. The absorbance (recorded as A1) was measured at 510 nm.
In the control group, distilled water was used, and the absorbance was recorded as A2. In the blank group, distilled water was used, and the absorbance was recorded as A3. The IC50 value represented the inhibition rate of the honey sample. The hydroxyl radical semi-inhibition rate was calculated according to Equation (3):
2.5 Determination of Vitamin B1 and Vitamin C content
Vitamin B1 (VB1) content (μg/ml) was determined using ultraviolet and visible light spectrophotometry. First, 100 μL of the honey sample was mixed with 600 μL of the reaction solution from the reagent kit, and 300 μL of distilled water. Then it was heated in a water bath at 80°C for 30 min, and its absorbance value (A1) measured at 704 nm. Secondly, the absorbance values of standard solutions with concentrations of 250 and 62.5 μg/mL, as well as the absorbance values of blank tubes were measured. Then, Y was calculated according to Equation (4). Thirdly, by substituting the difference in absorbance values between A1 and the blank tube as Y, the content X of VB1 can be calculated.
Note: Y represents the difference in absorbance between the standard tube and the blank tube. X is the standard solution concentration.
The Vitamin C (VC) (μg/mL) content was determined using a colorimetric method. Firstly, 0.15 mL of honey sample is diluted 10 times (A1). A1 is mixed with 0.45 mL of the reserve solution provided in the reagent kit and centrifuged for 10 min (3,500–4,000 rpm). Then, 0.4 mL of the supernatant is taken. Secondly, 1.85 mL of the test solution provided by the reagent kit is added to the first supernatant, mixed well, and then heated in a water bath at 37°C for 3 min before measuring its absorbance value (A2) (wavelength 536 nm). Thirdly, the absorbance values of A1 with blank tubes (A3) and standard tubes (A4) with a concentration of 6 μg/mL (A5) were compared. The VC content was calculated according to Equation (5). The VB1 and VC reagent kit was purchased from Solarbio (Beijing Solarbio Science & Technology Co., Ltd., Beijing, China).
2.6 Determination of amino acid content
Determining the amino acid content follows the method reported by Carratù et al. (2011). A volume of 12.5 g of honey was treated with 375 μL of a solution of α-aminobutyric acid, which was used as an internal standard (1 g/L). After isolation, the final volume of the sample was 10 mL. The pH of the solution was adjusted to 3.2, and the sample was refrigerated before derivatization. The derivatization procedure was the same as used by Chicón et al. (2001) for wine and must samples: 30 μl of diethyl ethoxymethylenemalonate, 1.5 mL of methanol, 1 ml of the solution of isolated amino acids, and 3.5 mL of borate buffer were placed in a 10 mL tube with a screw tap. Then the tube was placed in an ultrasound bath for 30 min at room temperature and then analyzed using an amino acid analyzer (Hitachi L-8900, Hitachi Ltd., Tokyo, Japan). The chemical purity of 16 standard single amino acid products is ≥98%.
2.7 Determination of moisture and Baumé degree
A handheld honey sugar meter was used to measure honey's moisture and Baumé degree (Shenzhen Fuxinpeng Electronic Technology Co., Ltd., Shenzhen, China). One to two drops of each honey sample were placed onto the prism of the sugar meter, and the moisture and Baumé value can be viewed through the eyepiece.
2.8 Data analysis
Test data were organized using Microsoft Excel 2021. Statistical analyses of experimental data were conducted using the built-in one-way ANOVA, Pearson correlation analysis, principal component analysis (PCA), and multiple regression methods in SPSS 25.0. The Tukey test was used to test the significance between each experimental group (with a statistical significance level of 95 or 99%). Experimental data were expressed as mean ± standard deviation. The Graph Prism 9.3 and R 4.3.2 (with the corrplot and factoextra packages) software programs (Kassambara and Mundt, 2020; Wei and Simko, 2021) were used to create diagrams.
3 Results
3.1 Determination of total sugar, total phenolic acid, and total flavonoid contents
The total sugar content in four varieties of honey ranged from 76.27 ± 0.80% to 80.76 ± 0.55%. The lowest content was found in RH. EH had the highest content and differed significantly from the other three varieties of honey (p < 0.05). There was no significant difference in the total sugar content among RH, BH, and DH (p > 0.05). The total phenolic acid content ranged from 269.53 ± 1.74 mg GAE/100 g to 331.94 ± 18.83 mg GAE/100 g. EH had the lowest phenolic acid content, while DH honey had the highest content. There was no significant difference between DH and BH (p > 0.05), but their total phenolic acid content was significantly higher than that in EH and RH (p < 0.05). EH and RH showed no significant difference (p > 0.05). The total flavonoid content ranged from 34.48 ± 4.33 mg RE/100 g to 83.99 ± 3.44 mg RE/100 g. DH had a significantly higher content than the other three honey varieties. The flavonoid content of EH was the second highest, and it was significantly higher than BH and RH (p < 0.05). There was no significant difference between BH and RH (p > 0.05) (Table 2).
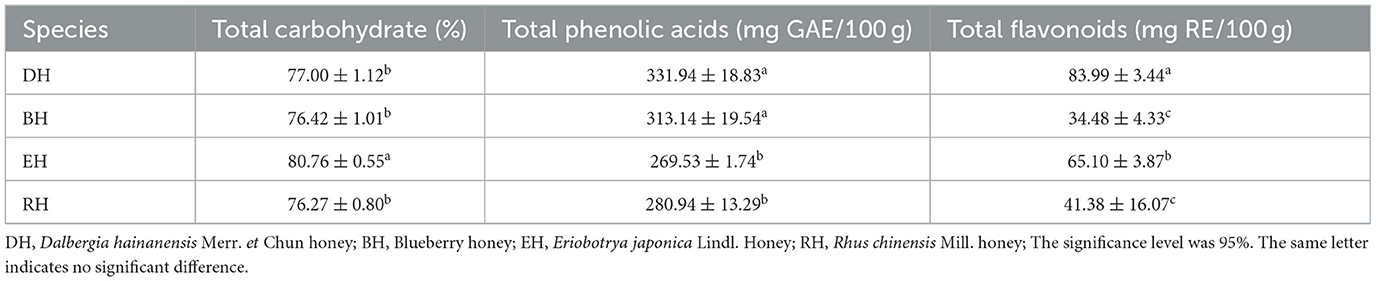
Table 2. Differences in total sugar, total phenolic acid, and total flavonoids contents among the four types of honey.
3.2 ABTS+, DPPH •, and hydroxyl radical clearance IC50
The IC50 of the ABTS+ clearance rates of four honey ranged from 17.60 ± 4.61 to 114.94 ± 41.81 mg/ml. The lowest value was observed for DH, and the highest for RH. There was no significant difference among RH, EH, and BH (p > 0.05). However, the three types were significantly higher than DH (p < 0.05). The IC50 of the DPPH • clearance rate of honey in the four honey varieties ranged from 32.85 ± 0.23 to 56.50 ± 3.07 mg/ml. DH had the highest value, and EH the lowest value. There was no significant difference between DH and BH (p > 0.05). However, both groups had values that were significantly higher than those of EH and RH (p < 0.05). EH and RH displayed no significant difference (p > 0.05). The IC50 of the hydroxyl radical scavenging rate of the four varieties of honey ranged from 254.65 ± 0.31 to 307.54 ± 45.35 mg/ml. BH had the highest value, and DH the lowest value. EH and RH were neither significantly different from BH (p > 0.05) nor DH (p > 0.05) (Table 3).
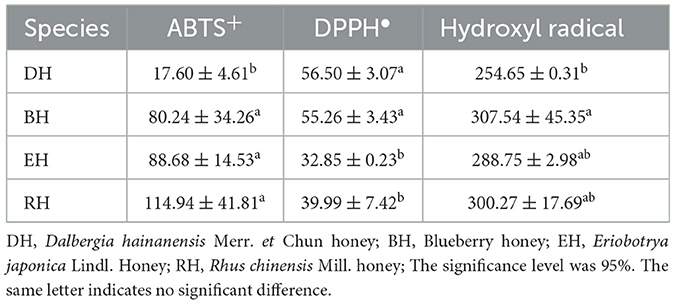
Table 3. ABTS+, DPPH• and hydroxyl radical clearance rate IC50 of four types of honey (mg/ml).
3.3 Amino acid content
The total amino acid content in the four varieties of honey ranged from 153.46 ± 1.02 mg/100 g to 257.91 ± 17.55 g/100 g. RH had the highest content, followed by DH, and EH displayed the lowest content. There were significant differences among the four groups (p < 0.05). The three most abundant amino acids in DH, EH, and RH were phenylalanine, proline (Pro), and aspartic acid, which accounted for 43.48, 34.05, and 49.96% of the total amino acid content (TAA), respectively. The three most abundant amino acids in BH were phenylalanine, leucine, and aspartic acid, accounting for 36.02% of the total amino acid content. The Pro content in the four varieties of honey ranged from 18.05 ± 0.21 g/100 g to 27.99 ± 0.21 g/100 g; the lowest content was in EH, and the highest was in RH. The Pro content differed significantly between RH and the other three groups (p < 0.05). There was no significant difference between BH and EH (p > 0.05). Methionine was only detected in BH and RH. Cysteine was only detected in BH. Arginine was not detected in the four varieties of honey (Table 4).
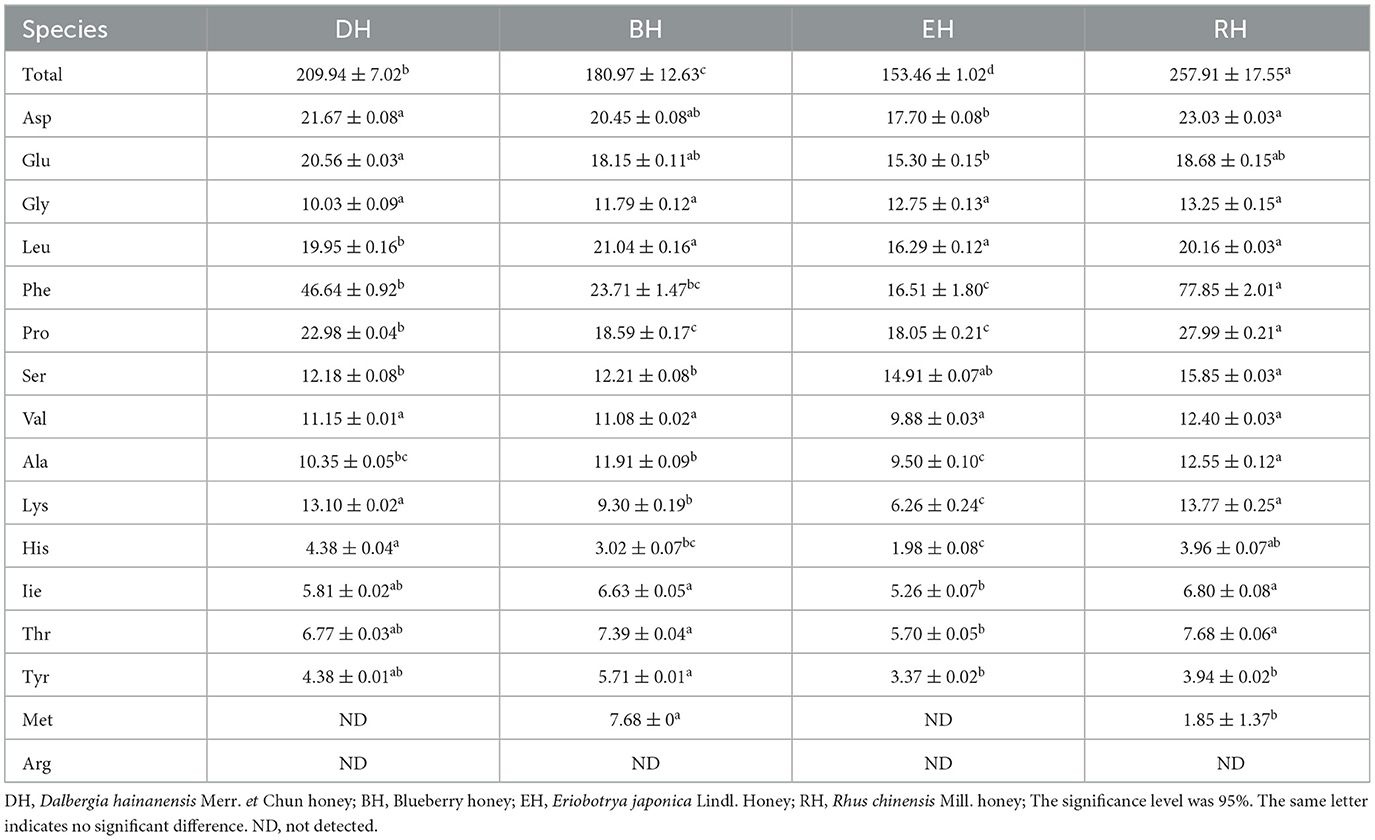
Table 4. Differences in amino acids contents among the four types of honey (mg/100 g).
3.4 Vitamin B1 and Vitamin C content
The four varieties of honey's VB1 content ranged from 86.69 ± 6.98 to 97.63 ± 12.52 μg/ml. The highest content was in BH, and the lowest content was in RH. The four groups showed no significant difference (p > 0.05). The VC content in the groups ranged from 125.55 ± 17.55 to 149.16 ± 5.75 mg/g. The highest content was in DH, and the lowest content was in RH. There was no significant difference among the four groups (p > 0.05) (Table 5).
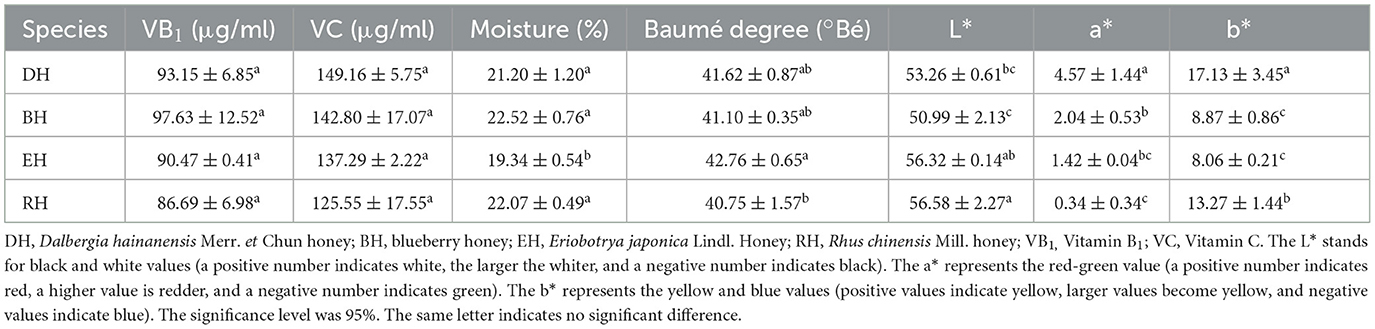
Table 5. Differences in the physical and chemical indicators of the four types of honey.
3.5 Moisture and Baumé degrees
The moisture content of honey in the four groups ranged from 19.34 ± 0.54% to 22.52 ± 0.76%. The lowest content was in EH, and the highest was in BH. There was no significant difference among DH, BH, and RH (p > 0.05), but there were significant differences between them and EH (p < 0.05). The Baumé degree ranged from 40.75 ± 1.57° to 42.76 ± 0.65°. The lowest degree was observed in RH, and the highest in EH. DH and BH showed no significant difference with EH or with RH (p > 0.05) (Table 5).
3.6 Color value
The L* values of the four groups ranged from 50.99 ± 2.13 to 56.58 ± 2.27. BH was lightest in color and RH the darkest. Moreover, the a* values ranged from 0.34 ± 0.34 to 4.57 ± 1.44. The red value of DH honey was the highest and that of RH the lowest. The b* ranged from 8.06 ± 0.21 to 17.13 ± 3.45. The highest yellow value was found for DH and EH had the lowest value (Table 5).
3.7 Correlation between the measured parameters
The correlation analysis showed that the hydroxyl radical scavenging rate IC50 in honey was significantly negatively correlated with total phenolic acid content, total flavonoid content, and the a* and b* values (r = −0.56, −0.43, −0.43, and −0.39, respectively). The IC50 of the DPPH• clearance rate was significantly positively correlated with the a* value (r = 0.64). The IC50 of the ABTS+ clearance rate was significantly negatively correlated with the total flavonoid content, VB1 content, VC content, and the a* and b * values (r = −0.77, −0.43, −0.88, −0.75, and −0.40, respectively), indicating that the antioxidant indexes were significantly affected by the above indexes. The total phenolic acid content was significantly positively correlated with the a* and b* values (r = 0.76 and 0.39, respectively), which shows that the darker the color, the higher the phenolic acid content. There was a significant negative correlation between the total phenolic acid content and the L* value (r = −0.54), which shows that the lighter the color, the lower the phenolic acid content. The total sugar content negatively correlates with the moisture content, DPPH• clearance IC50, total amino acid content, and altitude (r = −0.85, −0.44, −0.40, and −0.62, respectively). Nevertheless, it positively correlated with the Baumé degree and total flavonoid content (r = 0.46 and 0.41, respectively). The total flavonoid content was negatively correlated with the ABTS+ value and elevation (r = −0.77 and −0.49) and positively correlated with the VC content and a* value (r = 0.5 and 0.6). The VB1 content had a significant positive correlation with VC (r = 0.48) but a significant negative correlation with the total amino acid content (r = −0.40). The VC content was positively correlated with the a* value (r = 0.61) and negatively correlated with altitude (r = −0.41). The total amino acid content was significantly positively correlated with the Pro content, L* value, and altitude (r = 0.92, 0.47, and 0.84, respectively). The Pro content was positively correlated with the L* value and altitude (r = 0.6 and 0.71, respectively) (Figure 1).
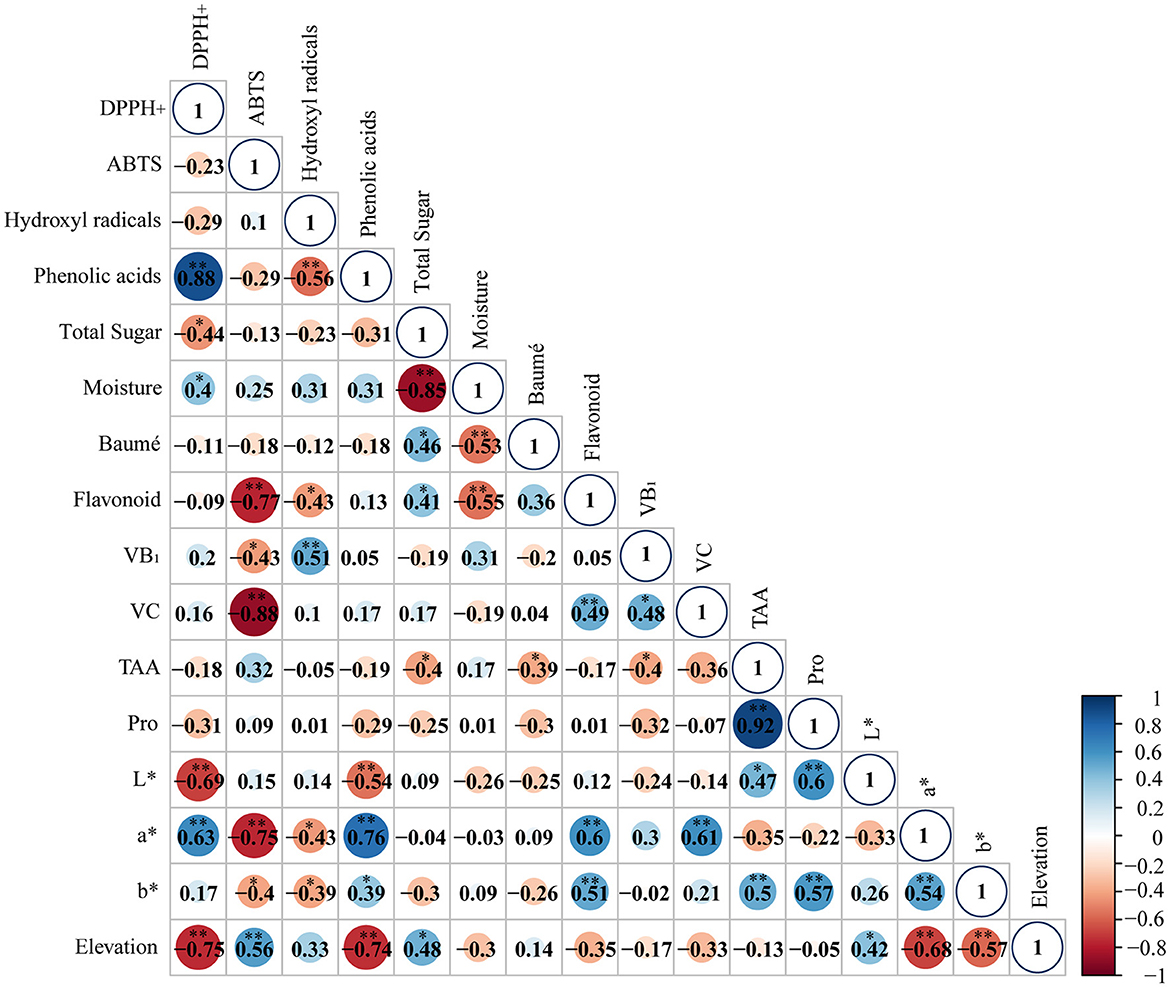
Figure 1. Correlation between variables. * indicates p < 0.05; ** indicates p < 0.01.
PCA is employed to reduce the correlation between data dimensions and visual samples and the analysis considers multiple selected variables. Sixteen parameters consistent with the correlation analysis variables were used in the PCA model (see Figure 2), and four significant principal components (PCs) were obtained with eigenvalues exceeding 1, which explained 86.28% of the total variability (Table 6). The contribution of PC1 is 31.92%, while PC2 contributed 22.26% (Figure 2A). The distribution of variables on the loading plot is shown in Figure 2B.
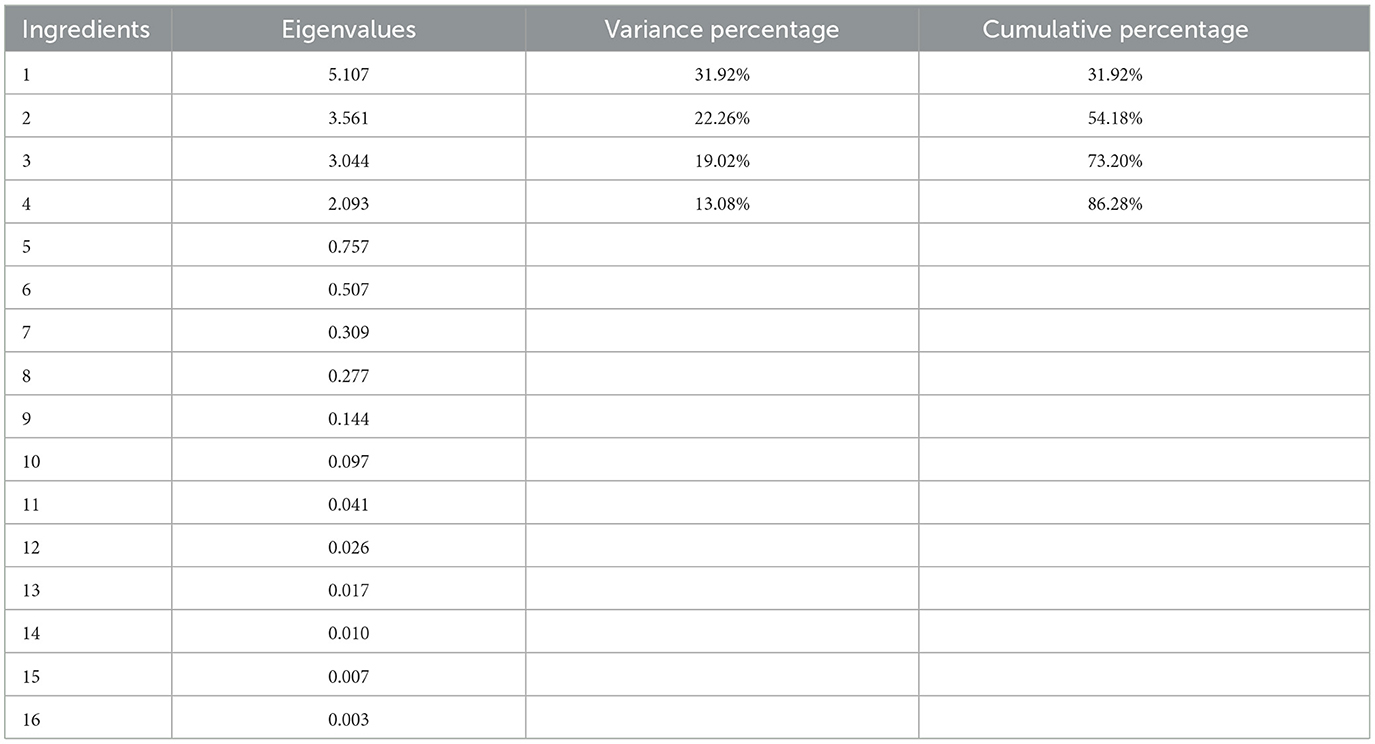
Table 6. Differences in the contribution values of each principal component.
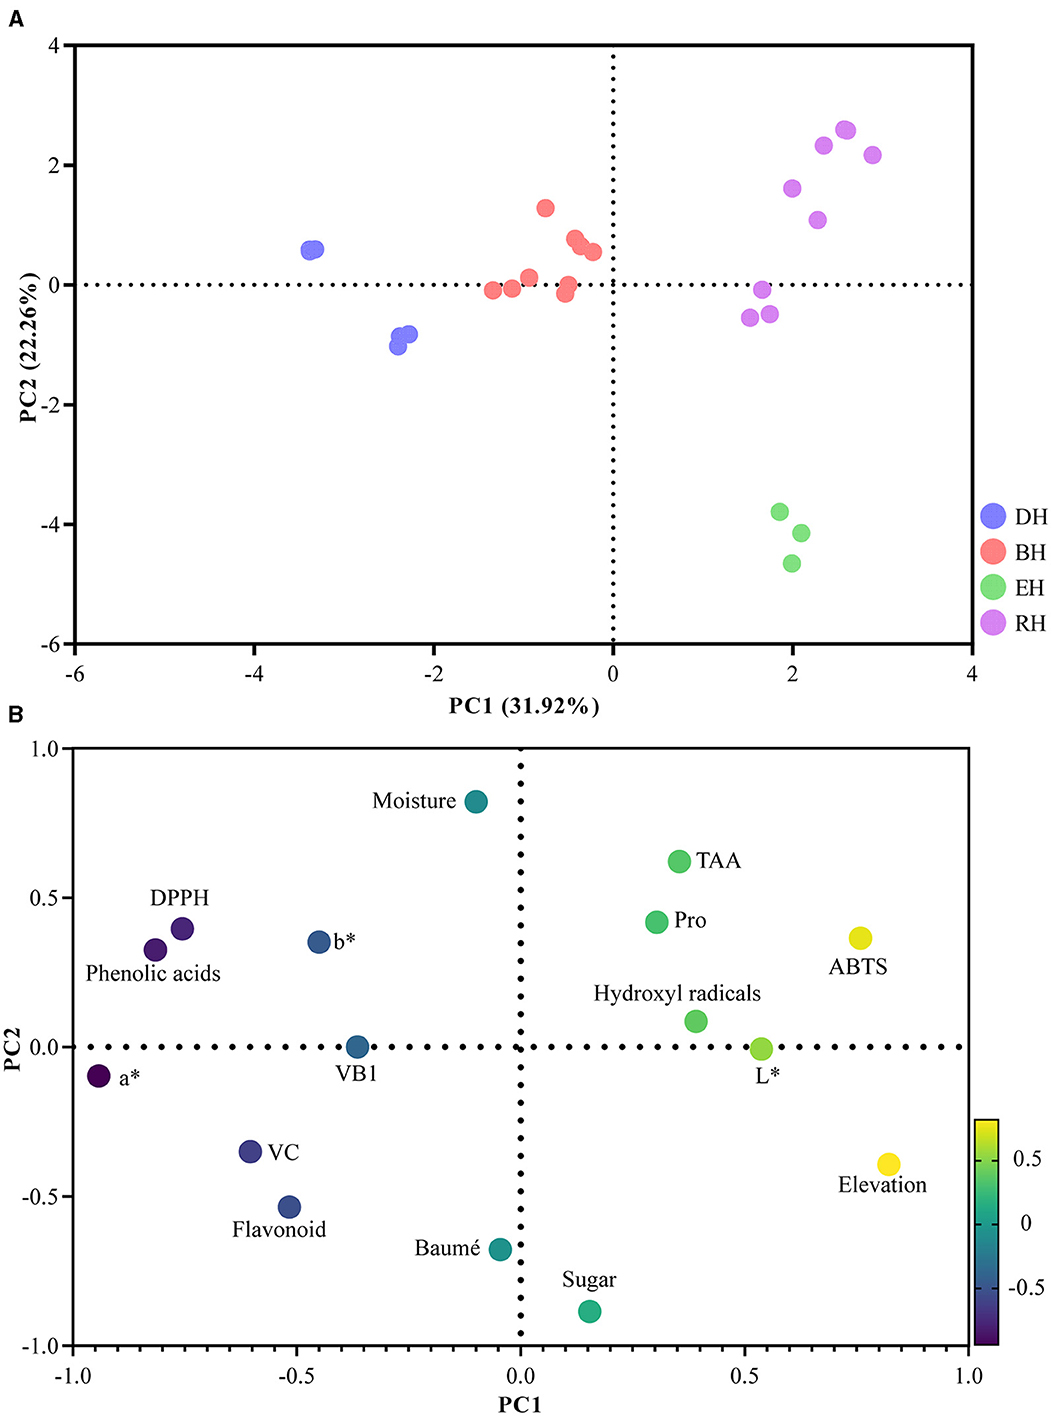
Figure 2. Principal component analysis. (A) Distribution of honey samples on a score plot. (B) Distribution of variables on the loading plot.
As shown in Figure 2A, there was a clear difference in the four honey samples, and they were clearly separated. Specifically, BH and DH were closer together, indicating that the physicochemical indicator fingerprint profiles of these two honey types were almost similar. However, DH, EH, and RH are far apart, indicating that these honey samples possessed different physicochemical fingerprint profiles. All physiochemical parameters were normalized to ensure that all parameters had an equal weight in the outcome. According to Figure 2B, PC1 was closely and positively correlated with elevation, ABTS, L*, TAA, Pro, hydroxyl radicals, and total sugar content but negatively correlated with moisture, Baumé value, total flavonoid content, VB1, b*, VC, DPPH, total phenolic acid content, and the a* value. PC2 was closely and positively correlated with the moisture content, TAA, DPPH, Pro, b* value, ABTS, total phenolic acid content, and hydroxyl radicals, while negatively correlated with the a* value, VC content, elevation, total flavonoid content, Baumé value, total sugar content. VB1 and L* have little effect on PC2.
According to these correlations and PCA results, it was found that there was a significant correlation between the ABTS+ radical scavenging rate IC50 and variables, which could be further regressed for analysis. The stepwise regression analysis selects important variables with high correlation coefficients based on correlation analysis and establishes a prediction or explanation model for regression analysis. The results showed that the ABTS+ radical scavenging IC50 rate was significantly affected by the total flavonoid content, VC content, VB1 content, and elevation. The regression equation showed that the VC content alone explained 76.20% of the variation, which provided a high degree of interpretation. The VC content, total flavonoid content, elevation, and VB1 could explain 96.70% of the variation, indicating that the VC content, total flavonoid content, elevation, and VB1 had a strong effect on the ABTS+ radical scavenging rate (Table 7).
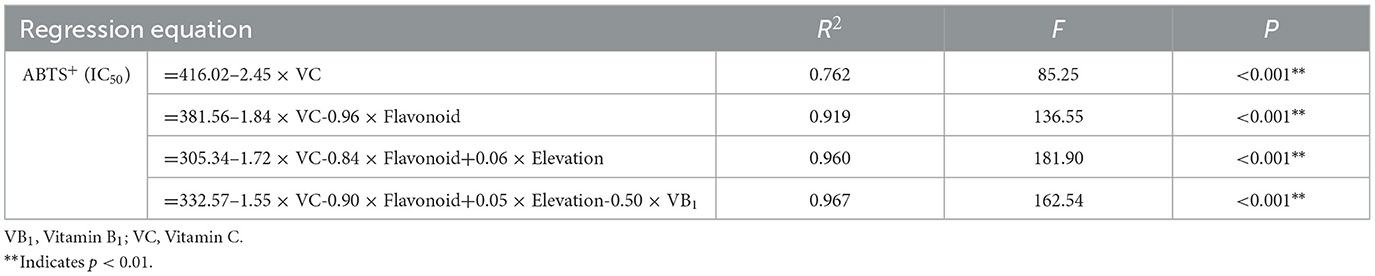
Table 7. Stepwise regression equations of the ABTS+ radical scavenging rate.
4 Discussion
The combination of various physical and chemical components in honey endows it with antibacterial, antioxidant, and other properties. In this study, four types of characteristic honey from Guizhou province were selected for detection of various components and their physical and chemical properties were analyzed. The results showed that honey quality was determined by the total flavonoid content and vitamin content, as well as the elevation. This result would aid a comprehensive evaluation of honey quality by combining multiple indicators.
Previous research showed that total phenolic acid and flavonoid contents are critical bioactive components in honey and play an antioxidant role (Cianciosi et al., 2018; Cheung et al., 2019). However, the total phenolic content in honey is not always positively correlated with its antioxidant activity (Al-Mamary et al., 2002; Küçük et al., 2007), meaning the total phenolic content in honey itself is insufficient for determining the intensity of its antioxidant activity completely (Gül and Pehlivan, 2018). Some studies have shown that free radical scavenging activity is strongly influenced by geographical features and the climatic characteristics of the location (Liang et al., 2018; Liu et al., 2022). In addition, altitude is also an essential factor (Neupane et al., 2015; Kanbur et al., 2021).
The total flavonoid content results from plant pollen, nectar, and propolis (Albu et al., 2022). Some researchers have suggested that the higher the flavonoid content, the more vigorous its antioxidant properties in honey (Moniruzzaman et al., 2013; Baek et al., 2015; Can et al., 2015; Castiglioni et al., 2017). Neupane et al. (2015) reported that the antioxidant compound content in honey from high-altitude areas in Nepal was lower than in low-altitude areas, which is consistent with the results of this study that ABTS+ radical scavenging is inversely correlated with altitude.
VB1 and VC positively impact human metabolism and immune function (Mousavi et al., 2019; Peterson et al., 2020). Medical studies have shown that VC is a potent radical scavenger and a physiological part of the antioxidant system in human skin (Lauer et al., 2013). A participant's intake of 100 mg VC/day resulted in a significant 22% increase in radical-scavenging activity (Lauer et al., 2013). VC can be used as an indicator to evaluate honey's antioxidant performance (León-Ruiz et al., 2012). VB1 possesses strong antioxidant properties. Lukienko et al. (2000) investigated the antioxidant effects of thiamine in rat liver microsomes and its interaction with reactive oxygen species. Their results indicate that thiamine is protective against various toxic agents that promote oxidative stress. The authors explain that in the presence of oxidants, a thiol form of thiamine is oxidized to thiamine disulfide and tricyclic form to the chrome. The antioxidant effect of thiamine is probably related to the two-phase reaction of thiazole ring opening and forming the anionic thiol form of thiamine and unstable tricyclic form (Higashi-Okai et al., 2006). Gliszczyńska-Swigło (2006) examined the antioxidant potential of thiamine, folic acid, and three forms of Vitamin B6 (pyridoxine, pyridoxal, and pyridoxamine) using a Trolox equivalent antioxidant capacity (TEAC) assay and ferric reducing antioxidant power (FRAP) assay and the highest antioxidant activity was found for thiamine. Our study shows the VB1 and VC content in DH was the highest among the four groups. Correspondingly, VB1 and VC were significantly negatively correlated with the ABTS+ free radial clearance IC50 rate. According to Hughes (1999), the polyene structure in these compounds allows the VB and VC molecules to quench or inactivate singlet oxygen and free radicals.
Tryptophan, lysine, methionine, histidine, cysteine, arginine, and tyrosine possess more potent antioxidant activities compared to other amino acids (Xu et al., 2017). Liu et al. (2023) measured these physicochemical indicators in four varieties of honey (three replicates per group). The PCA results show that the correlation coefficient of multiple physical and chemical indicators is 1, and some amino acids are significantly positively correlated with PC1 and can be used to evaluate honey (Liu et al., 2023). Our study shows that RH has a higher content of the above-mentioned amino acids among the four types of experimental honey, but its three antioxidant indicators are all at a disadvantage. DH, which has a lower amino acid content, displays a better antioxidant activity than RH. We used different indicators during the analysis, such as vitamin content and elevation, to determine the antioxidant activity. In addition, we used total amino acid content instead of individual amino acids for analysis. These results suggest that the evaluation of antioxidant properties should be comprehensively balanced and not limited to a single or partial indicator.
In addition, some studies show that the most abundant amino acid in honey is Pro (Escuredo and Seijo, 2019), which is closely related to the honey source (Hermosin et al., 2003; Carratù et al., 2011). In addition, Pro is honey's primary free amino acid and is used as an evaluation indicator for honey maturity standards because of its antioxidant capacity (Iglesias et al., 2006; Escuredo and Seijo, 2019). Although the Pro content in RH in this study was significantly higher than the other three groups, the antioxidant capacity was poor or insignificant compared with the other three groups. In the stepwise multiple regression, the content of Pro is not significant. We speculate that it may be related to factors such as the variety and collection altitude of honey, which may affect the overall quality of honey.
5 Conclusions
This study selected four types of characteristic honey from Guizhou Province, explored the differences in their antioxidant properties based on their physical and chemical properties, and analyzed the correlation between them. The results indicated that IC50 of the ABTS+ radical scavenging rate can be effectively used as an indicator of antioxidant performance and overall quality of the four types of honey. Among all analyzed indicators, the total flavonoid, VB1, and VC content as well as the altitude of the collection site have a significant impact on the overall quality of honey. These results suggested that the analysis of antioxidant activity should be based on carefully considering multiple indicators. It is worth noting that the antioxidant activity of honey samples depends on the flower source and environmental conditions. In the later stage, more factors must be combined to conduct a more in-depth evaluation of the quality of honey.
Data availability statement
The original contributions presented in the study are publicly available. This data can be found here: https://figshare.com/s/ff11b1af39ab8db6171e.
Author contributions
YY: Software, Writing – original draft, Writing – review & editing, Conceptualization, Data curation, Investigation, Methodology. CR: Software, Writing – original draft, Writing – review & editing, Formal analysis. MD: Formal analysis, Software, Writing – original draft. TZ: Funding acquisition, Software, Writing – review & editing. YL: Validation, Writing – review & editing. RR: Data curation, Investigation, Writing – review & editing. HW: Validation, Software, Writing – review & editing. YW: Funding acquisition, Methodology, Supervision, Writing – review & editing.
Funding
The author(s) declare that financial support was received for the research, authorship, and/or publication of this article. This work was funded by the National Key Research and Development Program Project (grant number 2022YFD1601703-3), Guizhou Province Science and Technology Plan Project (grant numbers QKHZC [2020] 1Y110, QKHCG [2022] YB006, and QKHCG [2023] YB 075), and Guiyang Science and Technology Plan Project (grant number ZKH [2023] 2-6).
Acknowledgments
We would like to express our gratitude to Zhiyu Zhu from the Guizhou Institute of Animal Husbandry and Veterinary Science for her investigation.
Conflict of interest
The authors declare that the research was conducted in the absence of any commercial or financial relationships that could be construed as a potential conflict of interest.
Publisher's note
All claims expressed in this article are solely those of the authors and do not necessarily represent those of their affiliated organizations, or those of the publisher, the editors and the reviewers. Any product that may be evaluated in this article, or claim that may be made by its manufacturer, is not guaranteed or endorsed by the publisher.
References
Albu, A., Radu-Rusu, R.-M., Simeanu, D., Radu-Rusu, C.-G., and Pop, I. M. (2022). Phenolic and total flavonoid contents and physicochemical traits of romanian monofloral honeys. Agriculture 12, 1378. doi: 10.3390/agriculture12091378
Al-Mamary, M., Al-Meeri, A., and Al-Habori, M. (2002). Antioxidant activities and total phenolics of different types of honey. Nutr. Res. 22, 1041–1047. doi: 10.1016/S0271-5317(02)00406-2
Alvarez-Suarez, J. M., Tulipani, S., Díaz, D., Estevez, Y., Romandini, S., Giampieri, F., et al. (2010). Antioxidant and antimicrobial capacity of several monofloral Cuban honeys and their correlation with color, polyphenol content and other chemical compounds. Food Chem. Toxicol. 48, 2490–2499. doi: 10.1016/j.fct.2010.06.021
Alves, A., Ramos, A., Gonçalves, M. M., Bernardo, M., and Mendes, B. (2013). Antioxidant activity, quality parameters and mineral content of Portuguese monofloral honeys. Food Compos. Anal. 30, 130–138. doi: 10.1016/j.jfca.2013.02.009
Al-Waili, N., Al Ghamdi, A., Ansari, M. J., Al-Attal, Y., Al-Mubarak, A., and Salom, K. (2013). Differences in composition of honey samples and their impact on the antimicrobial activities against drug multiresistant bacteria and pathogenic fungi. Arch. Med. Res. 44, 307–316. doi: 10.1016/j.arcmed.2013.04.009
Antolovich, M., Bedgood, D. R., Bishop, A. G., Jardine, D., Prenzler, P. D., and Robards, K. (2004). LC-MS investigation of oxidation products of phenolic antioxidants. J. Agric. Food Chem. 52, 962–971. doi: 10.1021/jf0349883
Baek, Y., Kim, Y. J., Baik, M.-Y., Kim, D.-O., and Lee, H. (2015). Total phenolic contents and antioxidant activities of Korean domestic honey from different floral sources. Food Sci. Biotechnol. 24, 1453–1457. doi: 10.1007/s10068-015-0187-8
Beretta, G., Granata, P., Ferrero, M., Orioli, M., and Maffei Facino, R. (2005). Standardization of antioxidant properties of honey by a combination of spectrophotometric/fluorimetric assays and chemometrics. Anal. Chim. Acta 533, 185–191. doi: 10.1016/j.aca.2004.11.010
Boussaid, A., Chouaibi, M., Rezig, L., Hellal, R., Donsì, F, Ferrari, G., et al. (2018). Physicochemical and bioactive properties of six honey samples from various floral origins from Tunisia. Arab. J. Chem. 11, 265–274. doi: 10.1016/j.arabjc.2014.08.011
Brand-Williams, W., Cuvelier, M. E., and Berset, C. (1995). Use of a free radical method to evaluate antioxidant activity. LWT Food Sci. 28, 25–30. doi: 10.1016/S0023-6438(95)80008-5
Can, Z., Yildiz, O., Sahin, H., Akyuz Turumtay, E., Silici, S., and Kolayli, S. (2015). An investigation of Turkish honeys: their physico-chemical properties, antioxidant capacities and phenolic profiles. Food Chem. 180, 133–141. doi: 10.1016/j.foodchem.2015.02.024
Cao, W., Lu, K., Chen, W. J., Suo, Z. R., Zheng, J. B., and Wei, Y. H. (2005). Study on antioxidation effects of different honeys. Food Sci. 26, 352–356.
Carratù, B., Ciarrocchi, M., Mosca, M., and Sanzini, E. (2011). Free amino acids, oxalate and sulphate for honey characterization. J. ApiProd. ApiMed. Sci. 3, 81–88. doi: 10.3896/IBRA.4.03.2.03
Carvalho, C. L., Sodré, G. S, Fonseca, A. O, Alves, R. M. O., Souza, B. A., and Clarton, L. (2009). Physicochemical characteristics and sensory profile of honey samples from stingless bees (Apidae: Meliponinae) submitted to a dehumidification process. An. Acad. Bras. Cienc. 81, 143–149. doi: 10.1590/S0001-37652009000100015
Castiglioni, S., Stefano, M., Astolfi, P., and Carloni, P. (2017). Chemometric approach to the analysis of antioxidant properties and colour of typical Italian monofloral honeys. Int. J. Food Sci. Technol. 52, 1138–1146. doi: 10.1111/ijfs.13397
Cheung, Y.-C., Meenu, M., Yu, X. M., and Xu, B. J. (2019). Phenolic acids and flavonoids profiles of commercial honey from different floral sources and geographic sources. Int. J. Food Prop. 22, 290–308. doi: 10.1080/10942912.2019.1579835
Chicón, R., Hermosin, I., and Cabezudo, M. (2001). Metodo de analisis de los aminoa cidos libres y del io'n amonio en vinos y mostos, por HPLC tras derivatizacion con etoximetile'nmalonato de dietilo (EMMDE). Tecnol Vin 1, 95.
Cianciosi, D., Forbes-Hernández, T., Afrin, S., Gasparrini, M., Reboredo-Rodriguez, P., Manna, P., et al. (2018). Phenolic compounds in honey and their associated health benefits: a review. Molecules 23:2322. doi: 10.3390/molecules23092322
Da Silva, I. A., Da Silva, T. M., Camara, C. A., Queiroz, N., Magnani, M., De Novais, J. S., et al. (2013). Phenolic profile, antioxidant activity and palynological analysis of stingless bee honey from Amazonas, Northern Brazil. Food Chem. 141, 3552–3558. doi: 10.1016/j.foodchem.2013.06.072
Da Silva, P. M., Gauche, C., Gonzaga, L. V., Costa, A. C. O., and Fett, R. (2016). Honey: chemical composition, stability and authenticity. Food Chem. 196, 309–323. doi: 10.1016/j.foodchem.2015.09.051
Du, L., Yang, H., Deng, S. Y., Zeng, X. J., Li, H. Y., Huang, J., et al. (2019). Study on the specificity of total phenolic acids and total flavonoids in Tibetan honey. Biol. Chem. Eng. 5:5.
Escuredo, O., and Seijo, M. C. (2019). Honey: chemical composition, stability and authenticity. Foods 8:577. doi: 10.3390/foods8110577
Eteraf-Oskouei, T., and Najafi, M. (2013). Traditional and modern uses of natural honey in human diseases: a review. Iran. J. Basic Med. Sci. 16, 731–742.
Fonte, L., Diaz, M., Machado, R., Blanco, D., Lorenzo, J., and Garcia, A. (2013). Physical, chemical and organoleptic characterization of Melipona beecheii honey collected in agroforestry systems. Pastos Forrajes 36, 345–349.
Gliszczyńska-Swigło, A. (2006). Antioxidant activity of water soluble vitamins in the TEAC (trolox equivalent antioxidant capacity) and the FRAP (ferric reducing antioxidant power) assays. Food Chem. 96, 131–136. doi: 10.1016/j.foodchem.2005.02.018
Gül, A., and Pehlivan, T. (2018). Antioxidant activities of some monofloral honey types produced across Turkey. Saudi J. Biol. Sci. 25, 1056–1065. doi: 10.1016/j.sjbs.2018.02.011
Haidamus, S. L., Affonso Lorenzon, M. C., Koshiyama, A. S., and Tassinari, W. D. S. (2019). Floral diversity in different types of honey. Braz. Arch. Biol. Technol. 62. doi: 10.1590/1678-4324-2019180241
Hermosin, I., Chicón, R. M., and Dolores Cabezudo, M. (2003). Free amino acid composition and botanical origin of honey. Food Chem. 83, 263–268. doi: 10.1016/S0308-8146(03)00089-X
Higashi-Okai, K., Nagino, H., Yamada, K., and Okai, Y. (2006). Antioxidant and prooxidant activities of B group vitamins in lipid peroxidation. J. UOEH 28, 359–368. doi: 10.7888/juoeh.28.359
Hughes, D. A. (1999). Effects of dietary antioxidants on the immune function of middle-aged adults. Proc. Nutr. Soc. 58, 79–84. doi: 10.1079/PNS19990012
Iglesias, M. T., Martín-Álvarez, P. J., Polo, M. C., De Lorenzo, C., González, M., and Pueyo, E. (2006). Changes in the free amino acid contents of honeys during storage at ambient temperature. J. Agric. Food Chem. 54, 9099–9104. doi: 10.1021/jf061712x
Johnston, M., Mcbride, M., Dahiya, D., Owusu-Apenten, R., and Singh Nigam, P. (2018). Antibacterial activity of Manuka honey and its components: an overview. AIMS Microbiol. 4, 655–664. doi: 10.3934/microbiol.2018.4.655
Kanbur, E. D., Yuksek, T., Atamov, V., and Ozcelik, A. E. (2021). A comparison of the physicochemical properties of chestnut and highland honey: the case of Senoz Valley in the Rize province of Turkey. Food Chem. 345:128864. doi: 10.1016/j.foodchem.2020.128864
Kassambara, A., and Mundt, F. (2020). factoextra: Extract and Visualize the Results of Multivariate Data Analyses. R package version 1.0.7. Available online at: https://CRAN.R-project.org/package=factoextra
Küçük, M., Kolayli, S, Karaoglu, S., Ulusoy, E., Baltaci, C, and Candan, F. (2007). Biological activities and chemical composition of three honeys of different types from Anatolia. Food Chem. 100, 526–534. doi: 10.1016/j.foodchem.2005.10.010
Kunchandy, E., and Rao, M. N. A. (1990). Oxygen radical scavenging activity of curcumin. Int. J. Pharm. 58, 237–240. doi: 10.1016/0378-5173(90)90201-E
Lauer, A.-C., Groth, N., Haag, S. F., Darvin, M. E., Lademann, J., and Meinke, M. C. (2013). Dose-dependent vitamin C uptake and radical scavenging activity in human skin measured with in vivo electron paramagnetic resonance spectroscopy. Skin Pharmacol. Physiol. 26, 147–154. doi: 10.1159/000350833
León-Canul, R. A., Chale-Dzul, J. B., Vargas-Diaz, A. A., Ortiz-Diaz, J. J., Duran-Escalante, K. C., Carrillo-Avila, E., et al. (2023). Identification of floral resources used by the stingless bee Melipona beecheii for honey production in different regions of the state of Campeche, Mexico. Diversity 15:1218. doi: 10.3390/d15121218
León-Ruiz, V., Vera, S., González-Porto, A. V., and San Andrés, M. P. (2012). Analysis of water-soluble vitamins in honey by isocratic RP-HPLC. Food Anal. Methods 6, 488–496. doi: 10.1007/s12161-012-9477-4
Li, Y. D., Jiang, H. T., Zhang, Z. D., and Wu, L. (2001). Prospects for the industrialization of blueberries in China. J. Shenyang Agric. Univ. 3, 39–42. doi: 10.3969/j.issn.1008-9713.2001.01.012
Liang, X. W., Li, Q. Q., Wang, K., and Wu, L. M. (2018). A review of characteristic markers for honey traceability. Food Sci. 39, 343–348. doi: 10.7506/spkx1002-6630-201815049
Liu, B. J. (2012). Determination of Total Sugar Content in Different Varieties of Honey. J. Cangzhou Norm. Univ. 28, 16–18.
Liu, M., Deng, W., Zhang, H., Wu, Y., Wang, L., and Fan, Y. (2023). Analysis of physicochemical components and antioxidants of four kinds of Guizhou honey. Food Sci. Technol. 43. doi: 10.5327/fst.23023
Liu, S. L., Lang, D. D., Meng, G. L., Hu, J. H., Tang, M., and Zhou, X. (2022). Tracing the origin of honey products based on metagenomics and machine learning. Food Chem. 371:131066. doi: 10.1016/j.foodchem.2021.131066
Lukienko, P. I., Mel'nichenko, N. G., Zverinskii, I. V., and Zabrodskaya, S. V. (2000). Antioxidant properties of thiamine. Bull. Exp. Biol. Med. 130, 874–876. doi: 10.1007/BF02682257
Moniruzzaman, M., Sulaiman, S. A., Khalil, M. I., and Gan, S. H. (2013). Evaluation of physicochemical and antioxidant properties of sourwood and other Malaysian honeys: a comparison with manuka honey. Chem. Cent. J. 7:138. doi: 10.1186/1752-153X-7-138
Mousavi, S., Bereswill, S., and Heimesaat, M. M. (2019). Immunomodulatory and antimicrobial effects of Vitamin C. Eur. J. Microbiol. Immunol. (Bp) 9, 73–79. doi: 10.1556/1886.2019.00016
Natella, F., Nardini, M., Di Felice, M., and Scaccini, C. (1999). Benzoic and cinnamic acid derivatives as antioxidants: structure-activity relation. J. Agric. Food Chem. 47, 1453–1459. doi: 10.1021/jf980737w
Neupane, B. P., Malla, K. P., Kaundinnyayana, A., Poudel, P., Thapa, R., and Shrestha, S. (2015). Antioxidant properties of honey from different altitudes of Nepal Himalayas. Pol. J. Food Nutr. Sci. 65, 87–91. doi: 10.1515/pjfns-2015-0024
Pan, C. T., Chen, Z. M., Fan, M. Y., Chen, X. S., Chang, Z. M., and Long, J. K. (2022). Quality analysis of Guizhou Dalbergia odorifera honey. J. Food Saf. Qual. 13, 5747–5753. doi: 10.19812/j.cnki.jfsq11-5956/ts.2022.17.043
Pekkarinen, S. S., Stöckmann, H., Schwarz, K., Heinon-en, I. M., and Hopia, A. I. (1999). Antioxidant activity and partitioning of phenolic acids in bulk and emulsified methyl linoleate. J. Agric. Food Chem. 47, 3036–3043. doi: 10.1021/jf9813236
Peterson, C. T., Rodionov, D. A., Osterman, A. L., and Peterson, S. N. (2020). B Vitamins and their role in immune regulation and cancer. Nutrients 12:3380. doi: 10.3390/nu12113380
Ran, Y. Q., Sun, L. P., Zeng, H. Y., Li, H. J., Lin, L., He, X. J., et al. (2020). Composition analysis and antioxidant activity of blueberry honey from Guizhou. Mod. Food Sci. Technol. 36, 81–87+287. doi: 10.13982/j.mfst.1673-9078.2020.5.012
Sakač, M. B., Jovanov, P. T., Marić, A. Z, Pezo, L. L., Kevrešan, Ž. S., Novaković, A. R., et al. (2019). Physicochemical properties and mineral content of honey samples from Vojvodina (republic of Serbia). Food Chem. 276, 15–21. doi: 10.1016/j.foodchem.2018.09.149
Saroglu, Ö., Ecem Bayram, N., and Özçelik, B. (2023). Comparison of bioactive constituents by HPLC–DAD–ESI-MS and UFLC and in vitro antioxidant activities of blossom honey, bee pollen, and propolis. Eur. Food Res. Technol. 249, 3085–3096. doi: 10.1007/s00217-023-04350-6
Shakoori, Z., Salaseh, E., Mehrabian, A. R., Tehrani, D. M., Dardashti, N. F., and Salmanpour, F. (2024). The amount of antioxidants in honey has a strong relationship with the plants selected by honey bees. Sci. Rep. 14:351. doi: 10.1038/s41598-023-51099-9
Sowa, P., Grabek-Lejko, D., Wesołowska, M., Swacha, S., and Dżugan, M. (2017). Hydrogen peroxide-dependent antibacterial action of Melilotus albus honey. Lett. Appl. Microbiol. 65, 82–89. doi: 10.1111/lam.12749
Sun, K., Song, X., Jia, R. Y., Yin, Z. Q., Zou, Y. F., Li, L. X., et al. (2018). Evaluation of analgesic and anti-inflammatory activities of water extract of Galla Chinensis in vivo models. Evid. Based Complement. Alternat. Med. 2018, 1–7. doi: 10.1155/2018/6784032
Tajima, N., Takasaki, M., Fukamachi, H., Igarashi, T., Nakajima, Y., and Arakawa, H. (2016). Determination of reactive oxygen generated from natural medicines and their antibacterial activity. J. Pharm. Anal. 6, 214–218. doi: 10.1016/j.jpha.2016.04.003
Wang, N. F., Yan, Z., Li, C. Y., Jiang, N., and Liu, H. J. (2011). Antioxidant activity of peanut flour fermented with lactic acid bacteria. J. Food Biochem. 35, 1514–1521. doi: 10.1111/j.1745-4514.2010.00473.x
Wei, T., and Simko, V. (2021). R Package ‘corrplot': Visualization of a Correlation Matrix (Version 0.92). Available online at: https://github.com/taiyun/corrplot
Xu, N. J., Chen, G. Q., and Liu, H. (2017). Antioxidative categorization of twenty amino acids based on experimental evaluation. Molecules 22:2066. doi: 10.3390/molecules22122066
Zhao, H., Yao, L., and Guo, Y. Y. (2021). Analysis of physicochemical characterization and antioxidant activity of loquat honey produced by apiscerana and apismelliferaligustica. J. Food Saf. Qual. 12, 2000–2004. doi: 10.19812/j.cnki.jfsq11-5956/ts.2021.05.061
Zheng, L., Lin, L. Z., Su, G. W., Zhao, Q. Z., and Zhao, M. M. (2015). Pitfalls of using 1,1-diphenyl-2-picrylhydrazyl (DPPH) assay to assess the radical scavenging activity of peptides: its susceptibility to interference and low reactivity towards peptides. Food Res. Int. 76, 359–365. doi: 10.1016/j.foodres.2015.06.045
Keywords: honey, nutrition, antioxidant properties, total flavonoids, total phenols, comprehensive evaluation
Citation: Yuan Y, Ren C, Deng M, Zhao T, Liao Y, Ren R, Wang H and Wang Y (2024) Multi-parameter joint analysis of the quality of honey. Front. Sustain. Food Syst. 8:1359384. doi: 10.3389/fsufs.2024.1359384
Received: 21 December 2023; Accepted: 26 March 2024;
Published: 10 April 2024.
Edited by:
Alexandros Stratakos, University of the West of England, United KingdomReviewed by:
Vesna Dragicevic, Maize Research Institute Zemun Polje, SerbiaJelena Vukadinovic, Maize Research Institute Zemun Polje, Serbia
Copyright © 2024 Yuan, Ren, Deng, Zhao, Liao, Ren, Wang and Wang. This is an open-access article distributed under the terms of the Creative Commons Attribution License (CC BY). The use, distribution or reproduction in other forums is permitted, provided the original author(s) and the copyright owner(s) are credited and that the original publication in this journal is cited, in accordance with accepted academic practice. No use, distribution or reproduction is permitted which does not comply with these terms.
*Correspondence: Yinchen Wang, MTg2ODUxMTE3NTNAMTYzLmNvbQ==
†These authors have contributed equally to this work