 Zhao Yuting1
 Qu Meng2*
- 1College of Economics and Management, Harbin University, Harbin, China
- 2School of Management, Zhengzhou University, Zhengzhou, China
In recent years, the number of countries experiencing a deterioration in food security has been increasing to the detriment of the healthy development of their people. China has made significant achievements in safeguarding food security, but only some studies have comprehensively summarized China’s important initiatives and successful experiences in protecting food security since the 1960s. In this paper, we use qualitative and quantitative methods to determine the food security indicator system and observe the development of China’s food security from 1961 to 2019 to provide a reference for countries threatened by hunger and malnutrition to get out of the predicament. First, 199 pieces of literature were subjected to three-level coding and saturation test using Nvivo software to preliminarily establish an indicator system for measuring China’s food security, which consists of two categories: food chain and external environment, five subsystems: food supply, food circulation, food consumption, international factors, and domestic factors, as well as 12 specific indicators. Subsequently, the entropy weight coefficient and hierarchical analysis methods are used to calculate two different indicator weights. Monte Carlo simulation compares the uncertainty of the indicator weights calculated by the two methods. We found that the uncertainty of the indicator weights determined by the hierarchical analysis method is much higher than that of the entropy coefficient method, so the indicator weights determined by the entropy coefficient method are chosen. Based on the formation of the food security indicator system, the obstacle degree test was carried out for each indicator. We found that the average wage of urban employees before 2015 was the main obstacle to China’s food security. However, the population kept growing after 2015, which became the main obstacle to China’s food security. Secondly, the evolution characteristics of the overall level of China’s food security and the subsystems from 1961 to 2019 were analyzed individually. We found that the overall level of China’s food security has been continuously improving. However, the subsystems still have hidden dangers, and the most prominent one is the food consumption subsystem, whose composite index has been continuously decreasing and has become the main factor undermining China’s food security. The scientific construction of China’s food security indicator system will help to identify and warn of hidden food security problems promptly and, at the same time, will help to summarize and promote China’s successful experience in safeguarding food security. Food security is the foundation of agricultural development, and ensuring food security significantly impacts national security, social stability, people’s livelihoods, and health. A scientifically constructed indicator system for China’s food security can help identify and alert potential food security risks. Based on accurate indicator data and analysis results, more effective food security policies and measures can be formulated, ultimately promoting the sustainable development of the gain industry.
1 Introduction
The Chinese Government has established a national food security strategy that focuses on domestic food production, guaranteed food production capacity, moderate imports, and technical support and has achieved the goals of basic self-sufficiency in grains and absolute security in food rations, providing a more solid guarantee of food security in China. However, food security is a complex and evolving process. China has long faced the problem of insufficient food production, and therefore, the early focus was mainly on food production. However, since the reform and opening up, mainly since 1996, the improvement in food production capacity has led to a diversification and refinement of the focus of previous work (Liang et al., 2021); this includes considerations of grain prices, ecological environment, population issues, economic globalization, and more. Specifically, the rapid development of China’s market economy requires that food security consider the impact of grain prices on supply, demand, production, and trade. The increase in investment in returning farmland to forests by the Chinese government at the end of the 20th century sparked a significant discussion on the relationship between the ecological environment and food security, considering the compatibility between the increased demand for food due to population growth and the potential yield provided by resource environment (Spiertz, 2012; Liang et al., 2021). After joining the WTO, the impact of economic globalization on China’s food security has received widespread attention. From an international perspective, promoting food security work has added essential factors such as food embargoes and international prices (Bonuedi et al., 2020). However, the sharp decline in grain production by 9% in 2000 shifted the focus back to food production capacity (Liang et al., 2022). More detailed issues have brought new challenges to ensuring food security, including regional food reserves, germplasm resources, the “Red Line” of 1.8 billion mu of arable land, rainfall resources, temperature and climate, agricultural technology (Liu et al., 2018).
To ensure food security in China, we should focus on the key points and have a holistic and comprehensive grasp. Each factor will not suddenly appear or disappear in a particular era but will impact food security from a multi-dimensional perspective with the degree of change of influence. This multi-dimensional system requires the evaluation of food security in China, which depends on a complete index system (Caccavale and Giuffrida, 2020). In the early days, scholars directly derived the definition of food security into indicators or directly converted food security objectives into indicators. However, limited by the difficulty of data acquisition, most extracted some indicators from other indicator systems to form a new system (Burchi and De Muro, 2016; Zhang et al., 2022). These practices lead to omissions and the inability to address the issue of indicator sources and their rationality (van Wijk et al., 2020). Based on this, subsequent studies on selecting food security indicators in China have provided a complete description of indicator selection principles, ideas, frameworks, and processes and their interpretations (Leroy et al., 2015; Yao et al., 2015). However, the problem is visualizing the referencing literature process in constructing an indicator system. Therefore, introducing the Nvivo software into selecting food security indicators attempts to address the issue of indicator sources by using three-level coding based on literature materials and presenting the complete process.
There are three main approaches to weight determination with differences in operations. The first is entirely subjective weighting, which assigns weights based on expert ratings and judgments of the relative importance of each indicator. The second is partial, subjective weighting, which involves determining indicators’ relative importance and then analyzing data to determine weights, such as the I-distance method and the analytic hierarchy process. The third approach is objective weighting, which utilizes the entropy weight coefficient method to reflect indicator characteristics and conduct obstacle degree tests (Milenkovic et al., 2016; Wei et al., 2023). Some scholars have attempted to combine different approaches for weighting. However, they need to pay more attention to the differences in uncertainty between different systems, resulting in less convincing weighting results. Additionally, combining multiple pathways may yield less accurate results than a single pathway experiment because the former introduces additional sources of uncertainty based on the latter. Therefore, considering the uncertainty between single pathways is more meaningful. Given the differentiated operations in weight determination and indicator selection for food security, this study introduces Monte Carlo simulation into food security research. It compares and illustrates the uncertainties of indicator systems determined through 10,000 simulation experiments under different single pathways. Furthermore, the involvement of other systems concerns the same indicators but differ in weight. Therefore, comparing uncertainties is essentially the difference in uncertainty between weight determination pathways, and selecting a more stable system will result in more minor errors in long-term evolution analysis. A thought-provoking question is whether the weighting process if based entirely on objective data, can contribute to the stability improvement of the system. If yes, can subjective weighting methods also play a beneficial role in system construction? Therefore, after selecting indicators, this study uses the analytic hierarchy process and entropy weight coefficient method to determine weights, construct two systems, and compare their performances in terms of stability assurance through uncertainty analysis.
This paper makes three contributions. First, from the perspective of indicator system construction, we innovatively use a combination of quantitative and qualitative methods to construct the indicator system and comprehensively examine the impact of external environmental factors and food chain factors on food security. Only some studies on food security are based on a complete combination of qualitative and quantitative. This paper fills this gap by drawing on Woods et al. (2016) in the qualitative research to determine the food security indicators by using Nvivo software coding to code and saturation test 199 literature samples sequentially and by referring to Mahmudiono et al. (2022) in the quantitative study to determine the food security indicators using entropy method, principal component analysis. The food security indicators’ weights will be determined, and the robustness of the indicator system will be verified based on Monte Carlo simulation methods, which can be combined with future studies that use the indicator system as a topic of discussion. At the same time, some researchers have focused on analyzing food supply, circulation, consumption, and other issues that affect food security (Yao et al., 2015) or on the external environmental factors that influence food security (Buks et al., 2016). This paper comprehensively considers the external environment and internal factors that affect food security and can more comprehensively observe the evolution characteristics of food security. Secondly, for a national-level research topic for food security, building on a longer time horizon is necessary. Based on existing studies (Yao et al., 2015; Milenkovic et al., 2016), The starting point of the study was extended to 1961, and the evolution characteristics of China’s food security from 1961 to 2019 and the contribution of various indicators to the overall food security were investigated, which is very important for summarizing and popularizing China’s experience in ensuring food security. Moreover, 1961 was the last year that China suffered from natural disasters for three years, and it was also the first year it began to recover. It took 1961 as the starting point for observation and is of unique significance for studying how to ensure food security gradually under the impact of disasters. The ability of this study to observe the evolutionary characteristics of China’s food security over a more extended period is mainly due to the unique and comprehensive data we obtained from several databases, such as the China Statistical Yearbook, the Compendium of 60 Years of Statistics of New China, the website of the National Bureau of Statistics of China, and the website of FAO Statistics. Thirdly, we should adopt the systematic evaluation method to observe the evolution characteristics of food security in China more comprehensively and carefully. At first, we built a food security measurement index system with the help of qualitative and quantitative methods, including two first-class indicators and five subsystems. To comprehensively investigate the development of food security in China, we use the evaluation method of Viana et al. (2022) to divide subsystems and observe the evolution characteristics of food security in China from 1961 to 2019 from five subsystems: international factors, domestic factors, food supply, food circulation, and food consumption, and explained them in detail in each subsystem.
2 Literature review
The term “food security” first emerged in the policy context of the 1970s. In 1974, it was officially defined at the World Food Conference as “the availability at all times of adequate world food supplies, particularly of basic foodstuffs, to sustain a steady expansion of food consumption and to offset fluctuations in production and prices, even under conditions of widespread crop failure or other emergencies” (Clapp et al., 2022). This definition primarily focused on production or supply and market consumption and considered the impact of extreme situations. However, in the early 1980s, amid economic recession and international instability in food production, demand, and prices, limiting food security to physical supply seemed narrow. In 1982, Edward Saouma, Director-General of the Food and Agriculture Organization (FAO), believed that food security should ensure everyone has access to the basic food they need materially and economically. This definition emphasizes material supply and economic consumption standards to balance supply and demand (Clapp et al., 2022). By the mid-1990s, food security had expanded to include food quality and nutritional health, reflecting concerns about inadequate protein intake and various micronutrients. We can find that the concept has lost its original simplicity and evolved into a group of intermediary behaviors to achieve an active and healthy life (Dobrota et al., 2016). In 2002, the FAO further refined the definition of food security: food security exists when all people, at all times, have physical, social, and economic access to sufficient, safe, and nutritious food that meets their dietary needs and food preferences for an active and healthy life. This definition incorporates multiple dimensions and is currently the most widely applied. A significant change is that food security has shifted from a single dimension to the need for establishment across various dimensions. It has expanded from physical supply to encompass economic access, nutritional utilization, and stability, which are complementary dimensions. Moreover, it has increasingly emphasized human concerns, transitioning from a macro-level examination to a micro-level interpretation compatible with individuals and households.
The concept of food security and its environmental determinants make food security assessment a decision-making process with inherent uncertainty. In general, the lower the uncertainty, the more accurate the decision assessment made by managers. However, in certain specific circumstances, uncertainty may hold high value and reveal potential information (Burgess et al., 2017). Burgess et al. (2017) argues that uncertainty analysis focuses on how uncertainty in input factors propagates through the structure of composite indicators and affects the values of composite indicators (Dobrota et al., 2015). As for uncertainty analysis, Bayes, Monte Carlo, response surface, and sensitivity analysis can be used. Among these, Monte Carlo methods, suitable for complex numerical models, are predominantly used, with the number of simulations generally set at 10,000 (Wang et al., 2023). The Monte Carlo method, born in the 1940s and based on probability statistics theory for nuclear weapon research, has expanded to various fields with the development of computer theory and applications, becoming a widely used simulation approach (Mahmudiono et al., 2022). Therefore, based on the consideration of multidimensional food security concepts and the inherent logic of uncertainty, this study attempts to enrich the research methods of food security in China by conducting Monte Carlo simulations for different food security indicator systems, expanding the paths for selecting and determining indicators, and exploring more precise measures for ensuring food security.
3 Study design
3.1 Data sources
The data of this study comes from CNKI (China National Knowledge Infrastructure), Baidu Search, the Central People’s Government of the People’s Republic of China’s official website, and the Food and Agriculture Organization (FAO). In CNKI, a search using the keywords “food security” and “factors influencing food security” selected 176 literature sources. A search on Baidu and the official website of the Central People’s Government of China for “food security” yielded 21 recent news reports and policy documents. Two documents, “Food Loss and Waste” and “The State of Food Security and Nutrition in the World,” were collected from the FAO website. We obtained 199 samples and randomly selected 2/3 materials as modeling samples and the remaining 1/3 as inspection samples. The primary data for specific indicators, such as the total population at the end of the year, food production, the proportion of the primary industry output value, average wages of urban unit employees, the proportion of employment in the primary industry, and the urbanization rate, were sourced from the “China Statistical Yearbook,” “Statistical Compilation of 60 Years of New China,” and the website of the National Bureau of Statistics. The primary data for determining the weights of indexes such as the change of grain reserves, the waste of grain, the import of grain, the accurate price index of international agricultural products, and the total grain export in the world come from the FAO statistical database. These data cover the period from 1961 to 2019, which helps us to observe more specifically and entirely the evolution characteristics of food security in China in the past half-century. Among them, 1961 was taken as the starting point for data collection. On the one hand, 1961 was the last year when China experienced a three-year difficult period, and it was also the first year when it began to recover. During the three-year difficult period from 1959 to 1961, severe natural disasters caused a severe impact on the food security of Chinese people, and it was only in 1961 that it began to be alleviated with the efforts of the Chinese government. Considering this special background, we take 1961 as the starting point for research to provide China and countries suffering from severe hunger crises with experience and enlightenment to ensure food security. On the other hand, in 1961, China began to ensure national food security by importing food, and international factors became an essential factor affecting China’s food security. To observe the influence of international factors on food security in China, we took 1961 as the starting point for data collection. To sum up, considering that China’s special background and international factors began to affect food security, we took 1961 as the starting point for observation.
3.2 Design of Chinese food security indicators
Firstly, the frequency of indicators mentioned in the 199 literature sources was analyzed using Nvivo software. The 199 literature samples were then subjected to open coding, axial coding, selective coding, and saturation testing to provide data references for determining indicator weights. Secondly, the data obtained from the “China Statistical Yearbook,” “Statistical Compilation of 60 Years of New China,” the website of the National Bureau of Statistics, and the FAO statistical database were used to determine indicator weights using the Analytic Hierarchy Process (AHP) and entropy weight coefficient method. Thirdly, the Monte Carlo simulation method was used to compare the uncertainty of the two indicator systems and obstacle degree testing was conducted for indicators with lower uncertainty to select a more stable indicator system as the evaluation basis. The specific steps are as follows:
(1) Use Nvivo software to analyze the 199 literature samples (Woods et al., 2016). ① Open coding: Exclude original statements with frequencies less than 2 (excluding 2) and statements with contradictory or overlapping content, and retain 96 literature sources and 370 reference points. Merge, reorganize, and extract similar indicators, resulting in five subsystems (international factors, domestic factors, food supply, food circulation, and food consumption). ② Axial coding: Clarify the intrinsic logic between subsystems and summarize them into two major categories (food chain factors and external environmental factors). ③ Selective coding: NRe-examine the original materials, indicators, and subsystems, and identify the core category of this study as food security, as the two major categories describe food security from different perspectives and revolve around the factors influencing food security. ④ Saturation testing: Conduct coding analysis on the remaining 33 validation materials randomly selected.
(2) Determination of Food Security Indicator Weights
Analytic Hierarchy Process (AHP). ① Determining the judgment matrix: In this method, the relative importance of indicators is determined based on the frequency of their appearance in the textual data using Nvivo software; this helps reduce subjective factors and ambiguity when determining the judgment matrix. The judgment matrix is defined based on the indicator frequency and the scaling defined by the judgment matrix. The calculation formula of index frequency is shown in Equation (1):
where fi is the frequency of the i-th indicator, ni is the frequency of the i-th indicator appearing in the textual data, and N is the total frequency of all indicators.
② Consistency testing: The judgment matrix needs to pass consistency testing. The consistency can be tested by utilizing Equations (2) and (3):
When CR < 0.10, the judgment matrix’s consistency is considered acceptable. CI is the consistency index, CR is the consistency ratio, RI is the consistency index, ℷmax is the maximum eigenvalue of the judgment matrix, and n is the number of indicators.
③ Determining weights: The weights of each indicator are calculated using the arithmetic mean method. The weight of each index is calculated using Equation (4):
Entropy Weight Coefficient Method. a. Data standardization: Since the indicators have different dimensions, magnitudes, and positive or negative orientations, the initial data needs to be standardized. The standardization methods for positive and negative indicators differ:
The positive indicators weight can be calculated using Equation (5):
The negative indicators weight can be calculated using Equation (6):
b. Calculation of the weight of the i-th indicator value in the j-th year, as in Equation (7):
c. Calculation of the information entropy of the indicator, as in Equation (8):
Let , then , and when let .
④ Calculate the information entropy redundancy using Equation (9):
⑤ Calculate the index weight using Equation (10):
⑥ Utilize Equation (11) to compute the assessment metric of the food security system and its subsystems:
Where and are the standardized and original values of the i-th indicator value in the j-th year, and are the maximum and minimum values of the j-th indicator among all years, is the evaluation index of each food security subsystem, s is the comprehensive evaluation index of the food security system, m is the number of evaluation years, and n is the number of indicators.
(3) Monte Carlo Simulation Analysis and Obstacle Degree Testing
To select a more stable indicator system as the basis for the assessment, the uncertainty of the two systems was measured by comparing the uncertainty of the two indicator systems using Monte Carlo simulation methodology by simulating the results of 10,000 ratings and transforming them into rankings for each year to make a scatterplot concerning the Mahmudiono’s study. A barrier test is only needed for the system with lower uncertainty, as it involves judging the indicator’s impact on overall food security. Lan et al. (2022) argued that the weight assigned to an indicator does not guarantee its final contribution to the overall value. This process cannot be replaced by weighting analysis (Chesnaye et al., 2022), so the barrier test was conducted by drawing on Lei’s method to determine the impact of each indicator on overall food security (Wei et al., 2023). It is calculated as Equations (12) and (13):
where is the standardized value of the i-th year and j-th indicator, is the weight of the j-th indicator, D is the deviation of the indicator, which represents the difference between the standardized value of each indicator and the optimal condition of food security, and h is the obstacle degree, which represents the degree of impact of each indicator on the overall food security condition.
4 Analysis of the construction of China’s food security indicator system
This section identified 12 individual indicators under the five subsystems of China’s food security indicators. The optimal method was selected to construct the evaluation system for China’s food security. Subsequently, we conducted obstacle degree testing to measure the development trajectory of the indicators and assess the impact of different indicators on overall food security in other years. This lays the foundation for the evolutionary analysis of China’s food security system in the fourth section.
4.1 Nvivo software coding analysis
The results show no new indicators or subsystems were identified after conducting open coding, axial coding, selective coding, and saturation testing on 199 document samples. The main categories, subsystems, and indicators obtained in the current study cover the essential elements of “food security,” indicating that the preliminary constructed system meets the theoretical saturation condition. Based on the indicators and subsystems in the preliminary constructed system and considering the principles for indicator selection, 12 indicators were set, including the average wage of urban employees, urbanization rate, the proportion of primary industry employment, global grain exports, international agricultural absolute price index, grain production, changes in grain reserves, grain imports, the proportion of primary industry output value, turnover of goods, food waste, and total population at the end of the year (see Table 1). Note that we use the change in the average wage of employees in urban units to measure the critical dimension of Chinese people’s food security. The reason is that food nutrition security is closely related to income. With the continuous improvement of Chinese people’s income level, the ability to ensure food nutrition security is getting higher and higher.
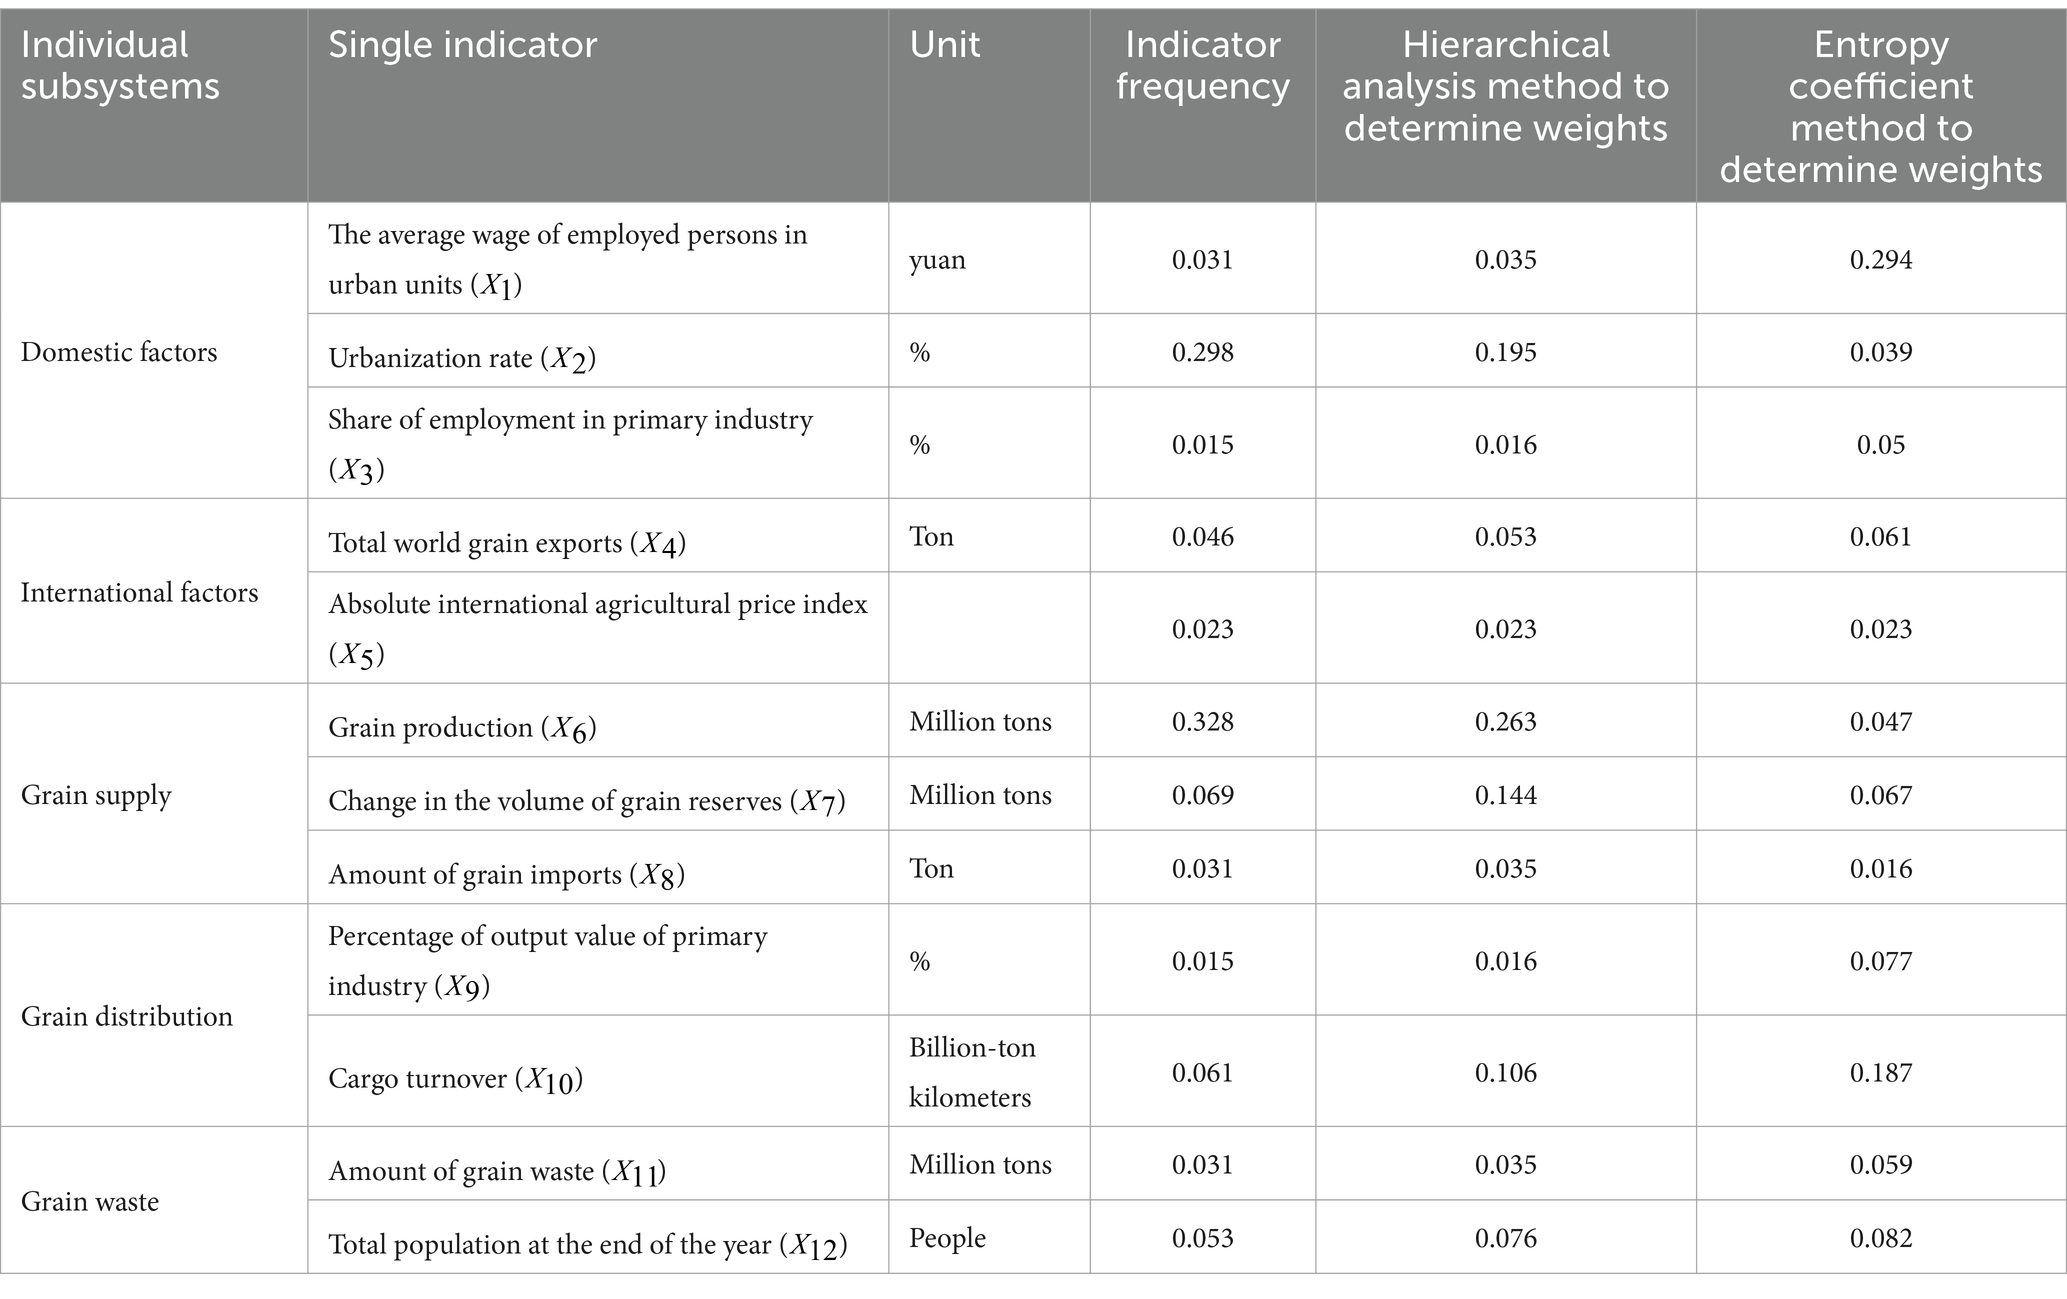
Table 1. Indicator system for food security.
4.2 Determination of weights for China’s food security indicator system
First, the Analytic Hierarchy Process (AHP) was used to construct a judgment matrix and determine indicator frequencies using NVivo software. The indicator frequencies were used as a proxy for relative importance, replacing the subjective expert rating process to expand the scope of the method’s application and reduce errors caused by subjective interference. Based on the indicator frequencies in Table 1, the judgment matrix was determined, and the consistency ratio (CR) was calculated using equations (2) and (3). The obtained CR value of 0.046 < 0.10 indicates that the consistency of the judgment matrix is acceptable, allowing for the determination of indicator weights based on this matrix. AHP provides four methods for calculating indicator weights: geometric mean method, arithmetic mean method, eigenvector method, and least squares method. In this study, the arithmetic mean method was used. The results show that grain production has the highest weight, followed by the urbanization rate. In contrast, the proportion of primary industry employment and primary industry output value has the lowest weights.
Furthermore, the results in Table 1 also indicate that the average wage of urban employees determined by the entropy weight coefficient method has the highest weight, followed by the turnover of goods. In contrast, the grain import volume has the lowest weight. In the AHP, grain production has the highest weight. In contrast, the average wage of urban employees has the lowest weight, and only the international agricultural absolute price index has the same weight in both methods, with significant differences observed for other indicators. It can be observed that different methods yield different systems, and the food security assessment based on various systems will inevitably differ. Therefore, the selected food security indicator system for evaluation should have higher stability to provide more accurate judgment conclusions. Based on this, the following sections use the Monte Carlo method to simulate the two systems 10,000 times and compare the results in scatter plots for further analysis (see Figures 1, 2).
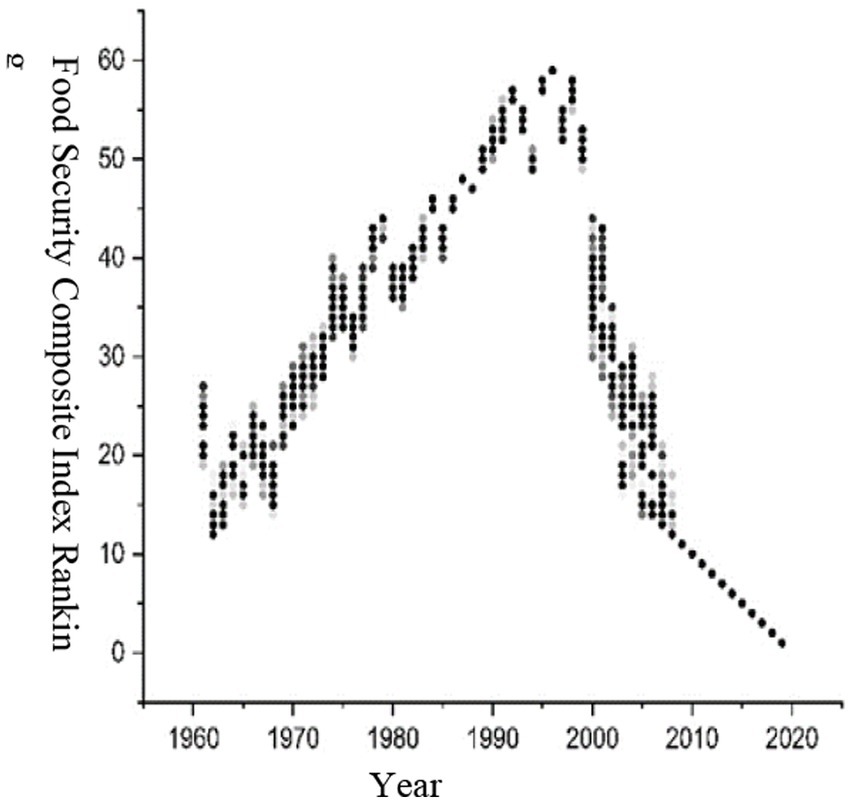
Figure 1. Entropy coefficient method uncertainty Figure 2. Uncertainty of hierarchical analysis method.
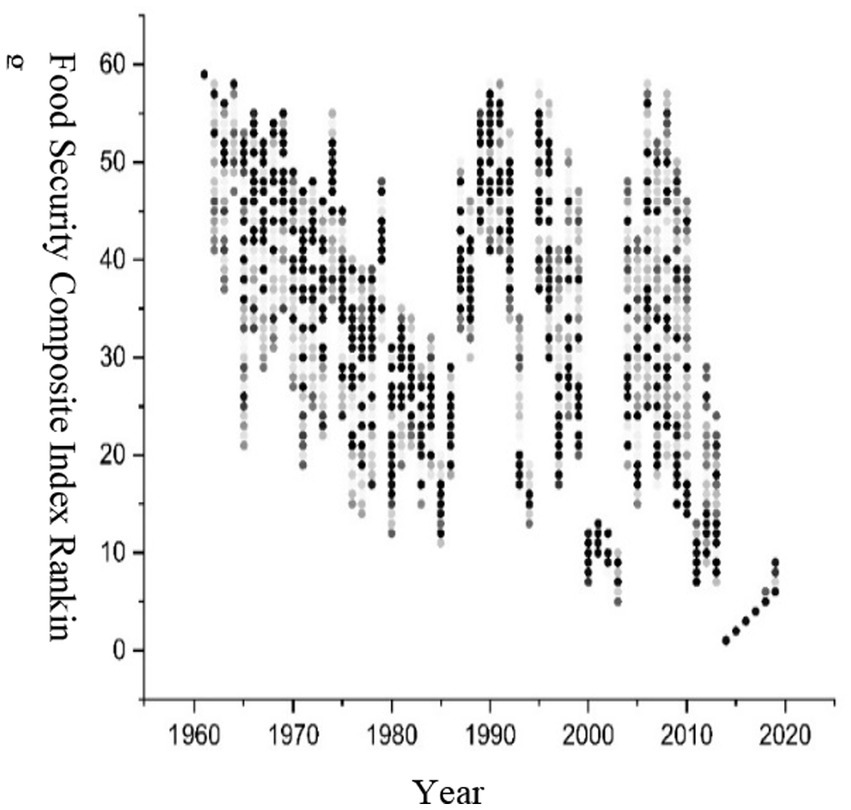
Figure 2. Uncertainty of hierarchical analysis method.
4.3 Monte Carlo simulation analysis
This study constructed two food security indicator systems using the Analytic Hierarchy Process (AHP) and the entropy weight coefficient method. The Crystal Ball Excel plugin was used for the Monte Carlo simulation to compare the uncertainties of the two systems. The system with lower uncertainty was selected as the basis for evolutionary analysis and obstacle degree testing. First, assuming that the weights follow a uniform distribution, the average values of the weights were used as hypothetical inputs. The comprehensive evaluation index for food security was defined as the prediction. Monte Carlo simulation was conducted 10,000 times for the comprehensive evaluation index values under the two systems. The experimental values were transformed into scatter plots for each year (see Figures 1, 2). It was found that the uncertainty of the AHP method was much higher than that of the entropy weight coefficient method, indicating that the system evaluated using the entropy weight coefficient method is closer to reality in assessing food security, while the system evaluated using the AHP method introduces more significant errors. Therefore, based on the uncertainty analysis results, the food security indicator system constructed using the entropy weight coefficient method was chosen for obstacle degree testing.
4.4 Diagnosis and analysis of Key obstacles to food security system
This section examines the degree of obstacles to each food security indicator from 1961 to 2019 and assesses the impact of different indicators on overall food security. The related results are shown in Table 2. The study found that the average wages of urban employees were the main obstacle to China’s food security from 1961 to 2015. However, the impact of this indicator continuously decreased during this period, and by 2019, the obstacle degree of average wages had reached almost zero; this indicates that the indicator had reached an ideal state, with a minimal negative impact on food security. At the same time, it also means that after 2015, the problem of undernutrition faced by the people in China will be significantly reduced because with the continuous improvement of the income level of the people in China, the ability to ensure nutritional security is getting higher and higher. In 2016, the population became the primary obstacle factor, and its degree of difficulty continued to increase from 2016 to 2019; this suggests that additional attention is needed to address the impact of population issues on food security. Furthermore, the degree of obstacle to the proportion of the primary industry’s output value has increased. Since 2010, it has surpassed the turnover of goods to become the third most important factor affecting food security. 2017, it surpassed average wages to become the second most crucial factor; this indicates that the agricultural industry needs more policy support and funding to prevent threats to food security. Another important consideration is that the proportion of employment in the primary sector surpassed the amount of food waste in 2019, which became the third obstacle factor. However, the difference between the two is slight, and the degree of obstacle to the food waste indicator showed no decreasing trend.
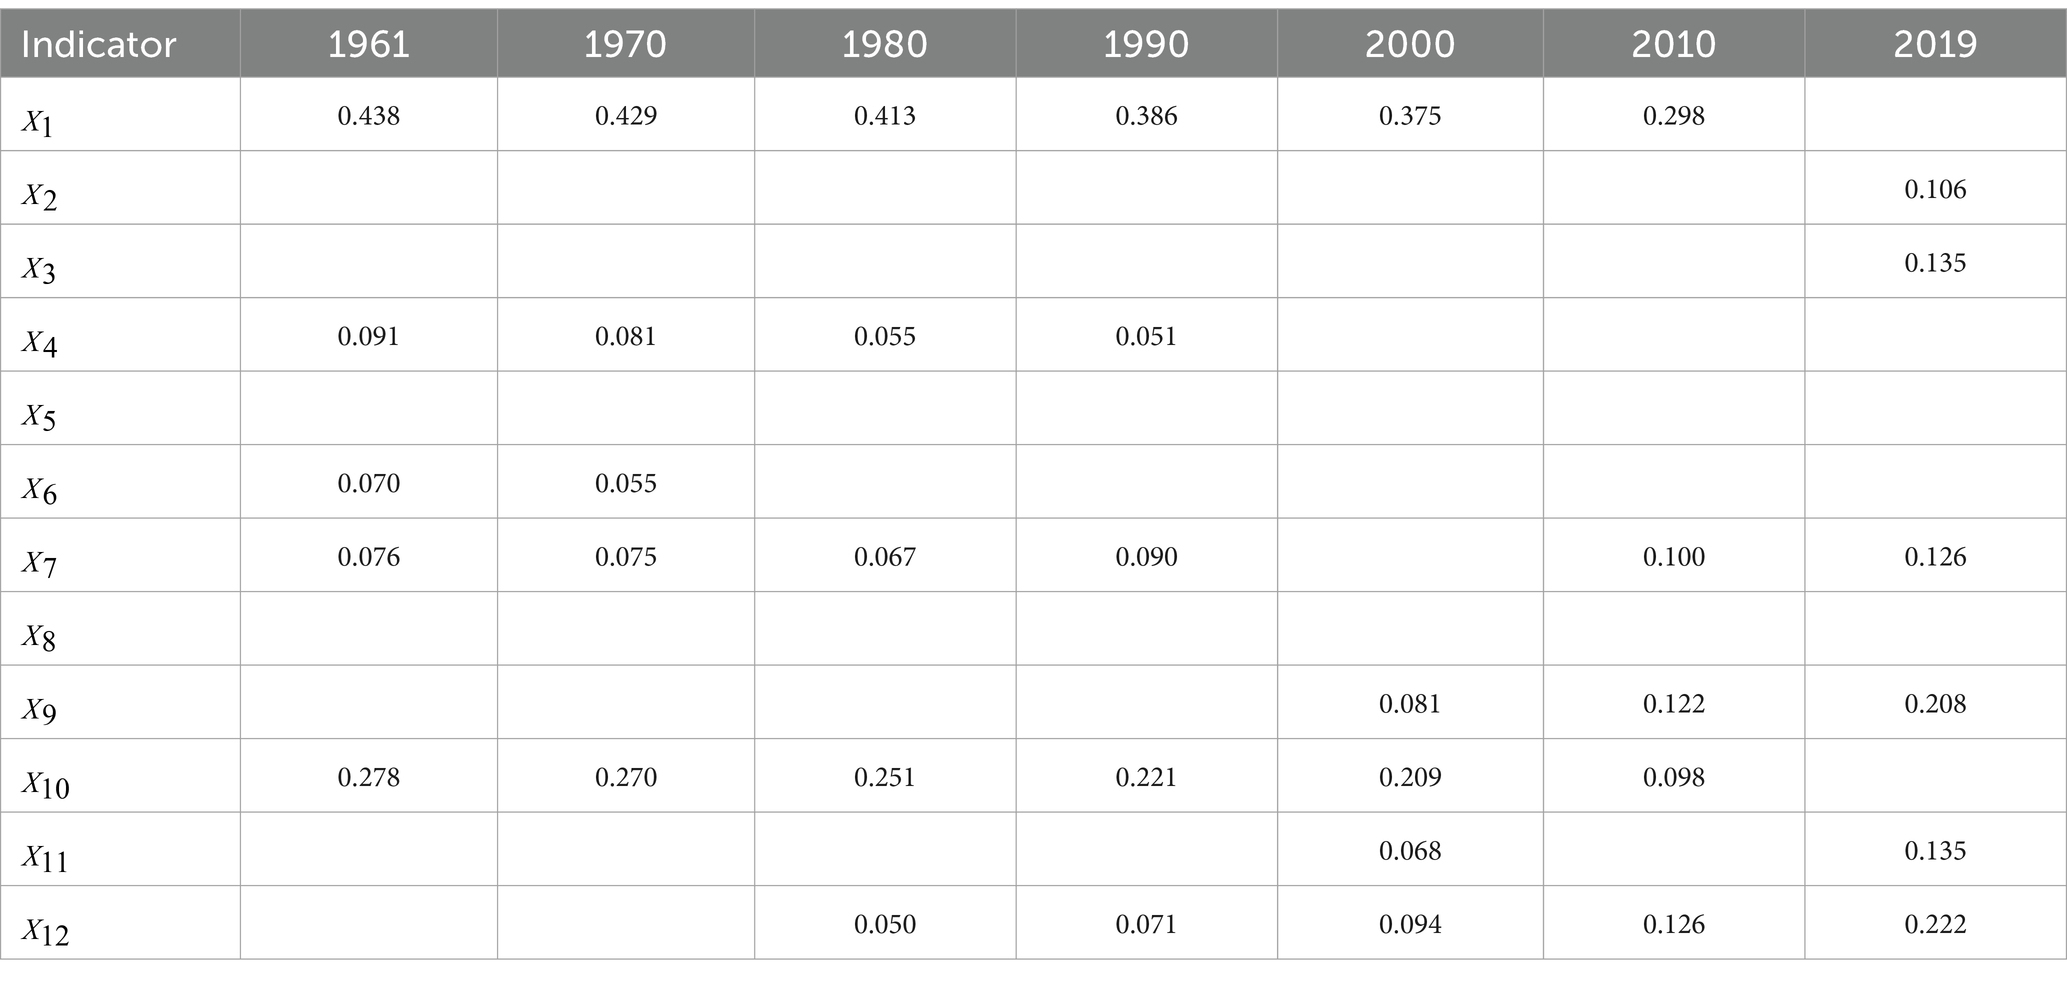
Table 2. The barrier degree of each indicator.
Additionally, since 2010, the obstacle degree of each indicator has been less than 0.3. Overall, the influence of individual indicators on food security has weakened, indicating that under relatively stable levels of overall food security, individual indicators are allowed to have more significant uncertainty; this means that since 2010, overall food security has gained higher stability due to the dispersion of uncertainty and increased tolerance.
5 Analysis of the evolution of food security systems in China (1961–2019)
5.1 General analysis of the evolution of China’s food security system (1961–2019)
The evolution trend of food security index system in China is shown in Figure 3. Overall, China’s food security has undergone two stages: the first stage (1961–1998) showed slight fluctuations and continuous deterioration, while the second stage (1999–2019) exhibited continuous improvement. After experiencing three years of natural disasters, the food security index in 1961–1962 saw a significant increase of 4.46% compared to previous years. However, the situation did not improve over the next three decades and even worsened, with a decrease of 6.54% observed in 1994–1995. The index only experienced an increase exceeding 4% in 1997. From 1999 onwards, China’s food security started to improve. Until 2019, the highest decrease was 2.63% (2003–2004), and the highest increase was 17.93% (2013–2014). There was only one instance of decline, which occurred in 2003–2004. Considering the obstacle degree analysis, the average wage of personnel, turnover of goods, and year-end total population were identified as the top three obstacle factors. Additionally, attention should be given to food reserves because the obstacle degree of the food reserve change indicator increased from 0.012 (in 2003) to 0.064 (in 2004). Before 2003, the degree of obstacle to this indicator had continuously decreased but increased consistently after 2003.
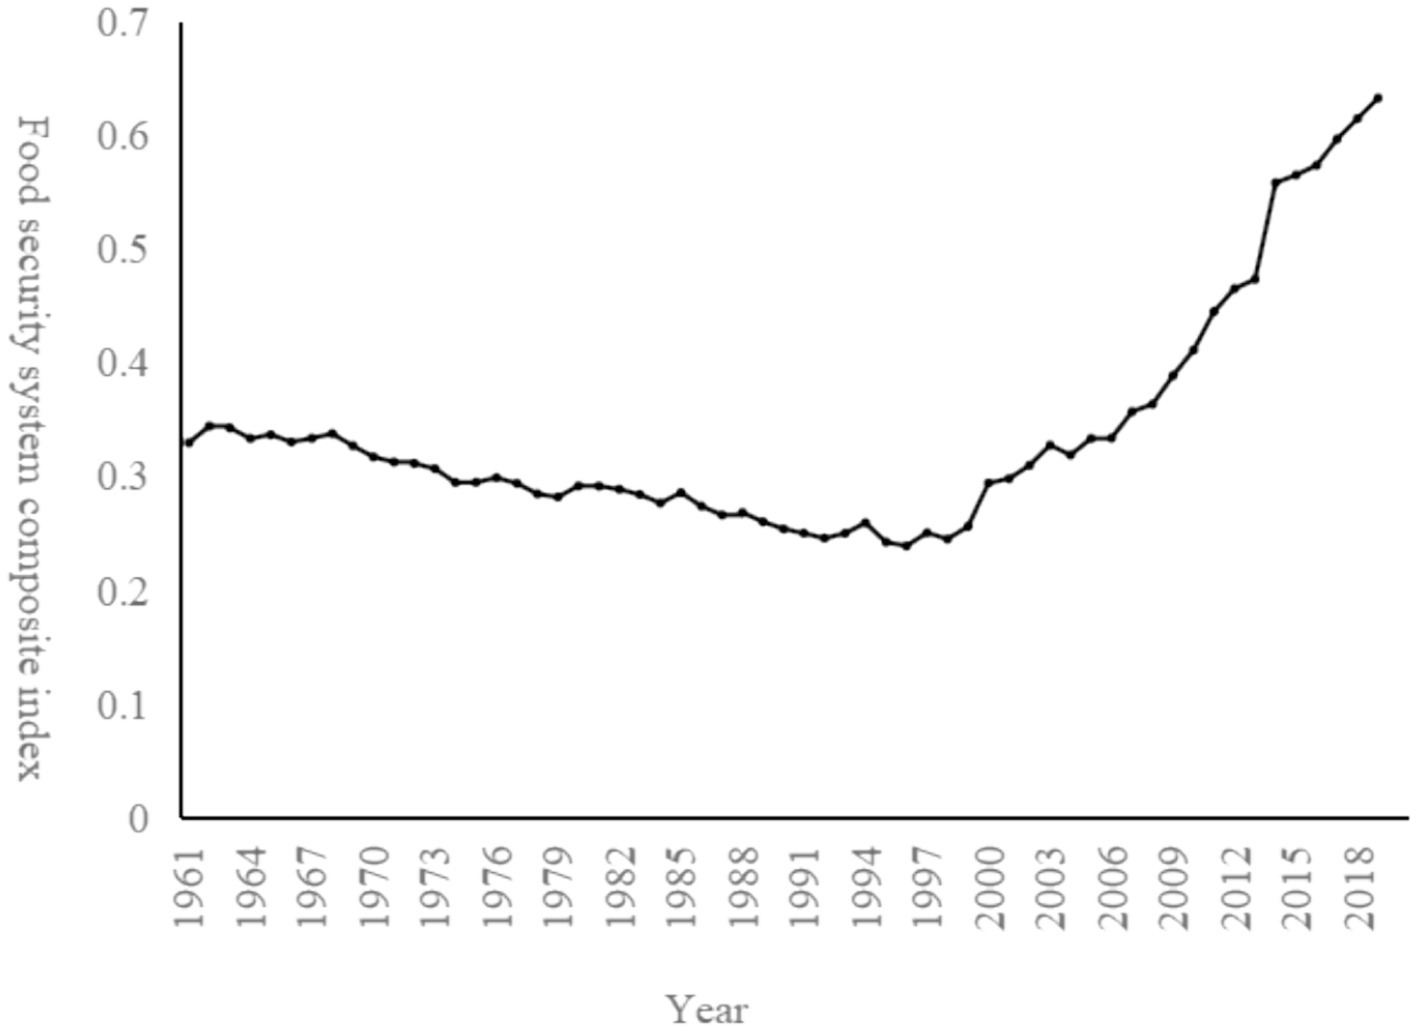
Figure 3. Trends in the evolution of China’s food security system.
5.2 Analysis of the evolution of the various subsystems of food security (1961–2019)
5.2.1 Domestic factors subsystem
The domestic factors subsystem has the highest weight and was the highest obstacle subsystem until 2018. However, as shown in Figure 4, its changes have been the most regular, going through three phases: brief increase (1961–1963), continuous decrease (1964–1997), and rapid increase (1998–2019). During the brief increase phase, the index value of the domestic factors subsystem increased from 0.214 to 0.232, with an annual increase of 0.009 and a growth rate of 8.41%. In the second phase, which lasted for 34 years, the average wage of urban employed individuals increased from 590 yuan to 5,348 yuan, the urbanization rate increased from 17.98 to 29.09%, and the proportion of employment in the primary industry decreased from 82.2 to 52.2%. The index value of the domestic factors subsystem decreased from 0.228 to 0.175, with an average annual decrease of 0.0016 and a decrease of 23.25%. The most significant decrease occurred in 1983–1984, with a decline of 4.66%, which was the highest value in the second phase. The substantial reduction in the proportion of employment in the primary industry implies a weakened enthusiasm for grain cultivation. At the same time, the continuous increase in urbanization has shaped the national background of urban–rural duality over the past half-century. It also implies that the competition for labor and land resources between urban and rural areas will continue to affect food security. However, the improvement in average wages in the second phase indicates that the essential requirement of “affordability” has been met, temporarily balancing social structure issues and decreasing enthusiasm for grain cultivation. Since 1998, the domestic environment has continued to improve. By 2019, it has been increasing at an annual rate of 0.018, with a growth rate of 327.22%. The highest growth rate was 10.9% in 2007–2008. Improving the domestic environment implies weakening other adverse factors’ influence and a higher guarantee level for food security.
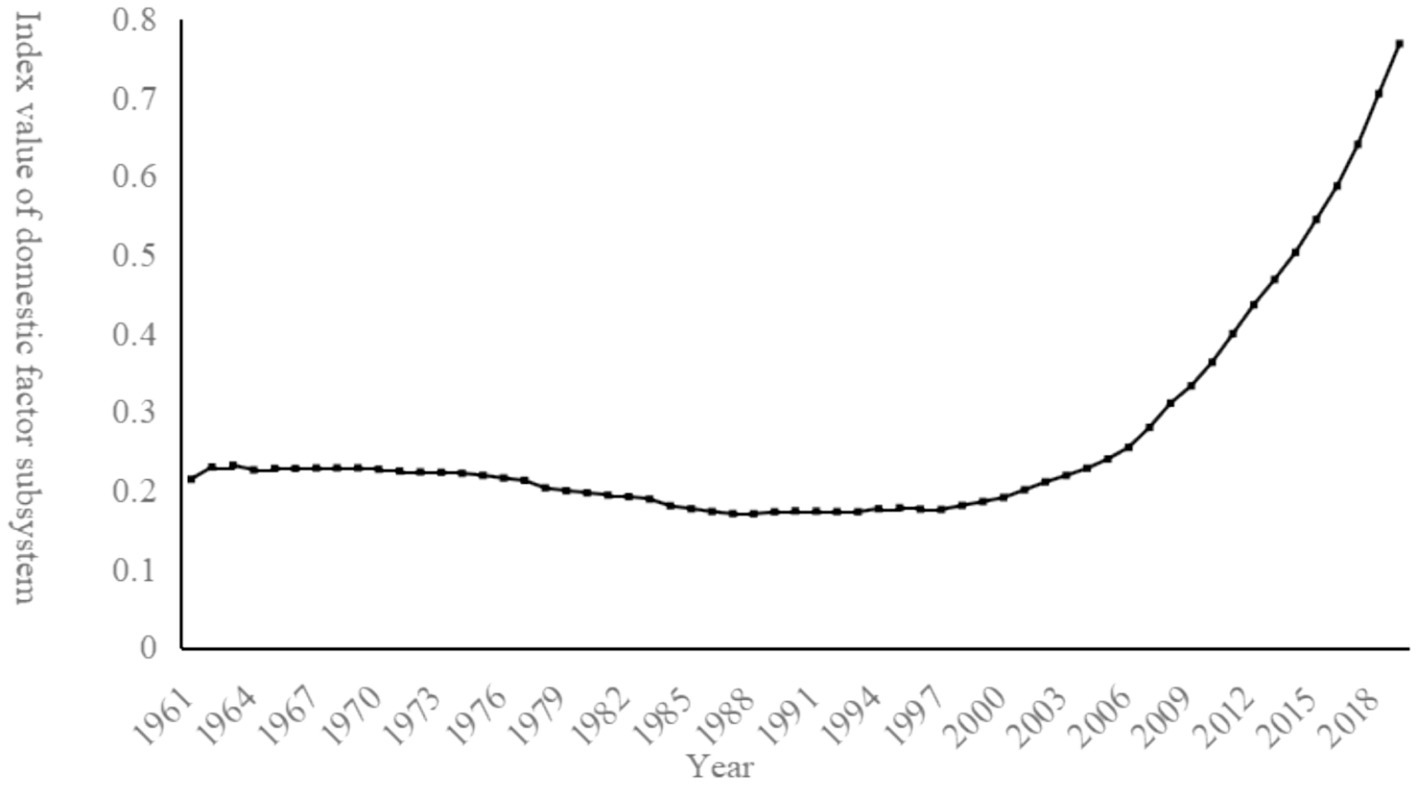
Figure 4. Evolution trend of domestic factor subsystem.
5.2.2 International factors subsystem
The evolution trend of international subsystems is shown in Figure 5. The international environment has undergone frequent changes but has generally maintained an upward trend. From 1961 to 1972, the index value of the international factor subsystem continued to rise but suddenly declined in 1973–1974. In 1974, the actual price index of international agricultural products reached an astonishing 137.38, the highest value from 1961 to 2019. When the international grain prices rise rapidly in the short term, it will be unfavorable to China’s food security, especially considering the underlying reasons for the 1973–1974 grain crisis, such as the oil crisis and deteriorating climate, which led to increased production costs and rising international grain prices. The fluctuation in international grain prices, as an essential indicator of the international environment, represents the volatility of various potential factors, such as wars, climate deterioration, economic crises, etc., demonstrating the multidimensionality of the international environment. After 1974, the international environment improved, but still accompanied by small fluctuations. It reached its highest value in 2018 (0.895), with varying degrees of decline in 1996, 2008, and 2011.
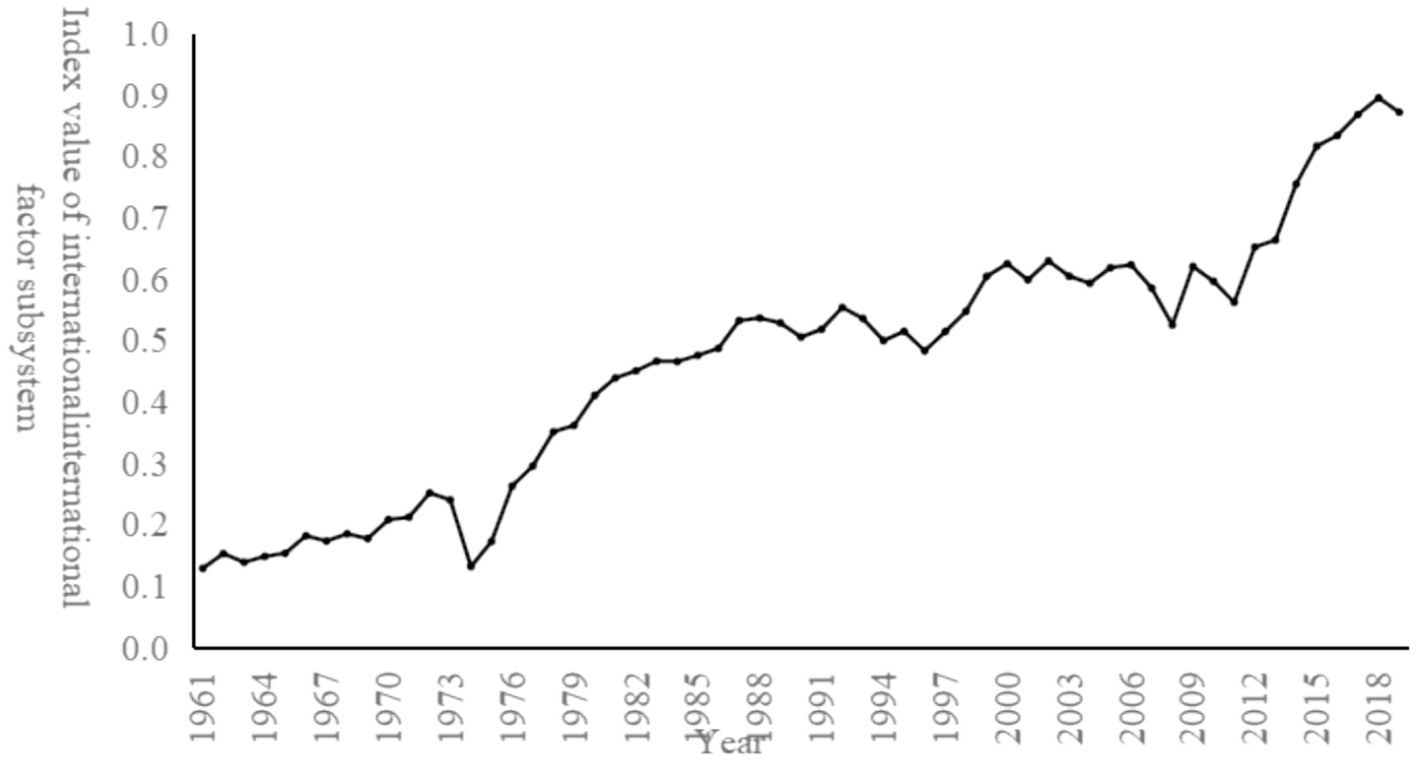
Figure 5. Evolution trend of international factor subsystem.
5.2.3 Grain supply subsystem
The evolution trend of grain supply subsystem is shown in Figure 6. The grain supply subsystem experiences frequent and increasingly significant fluctuations, resulting in low stability. From 1961 to 1977, the grain supply stabilized with an average annual growth rate of 0.006. IT witnessed the most significant increase and decrease in 1964–1965 and 1966–1967, respectively, before 1977. However, in the following half-century, such increases and decreases became common, indicating an increase in the instability of the grain supply subsystem. When examining individual indicators, grain reserves and imports frequently fluctuate, while grain production remains relatively stable because grain production is more closely related to natural environments. Although natural conditions may vary, the profound heritage of thousands of years of agricultural culture in China can offset the deterioration caused by natural factors.
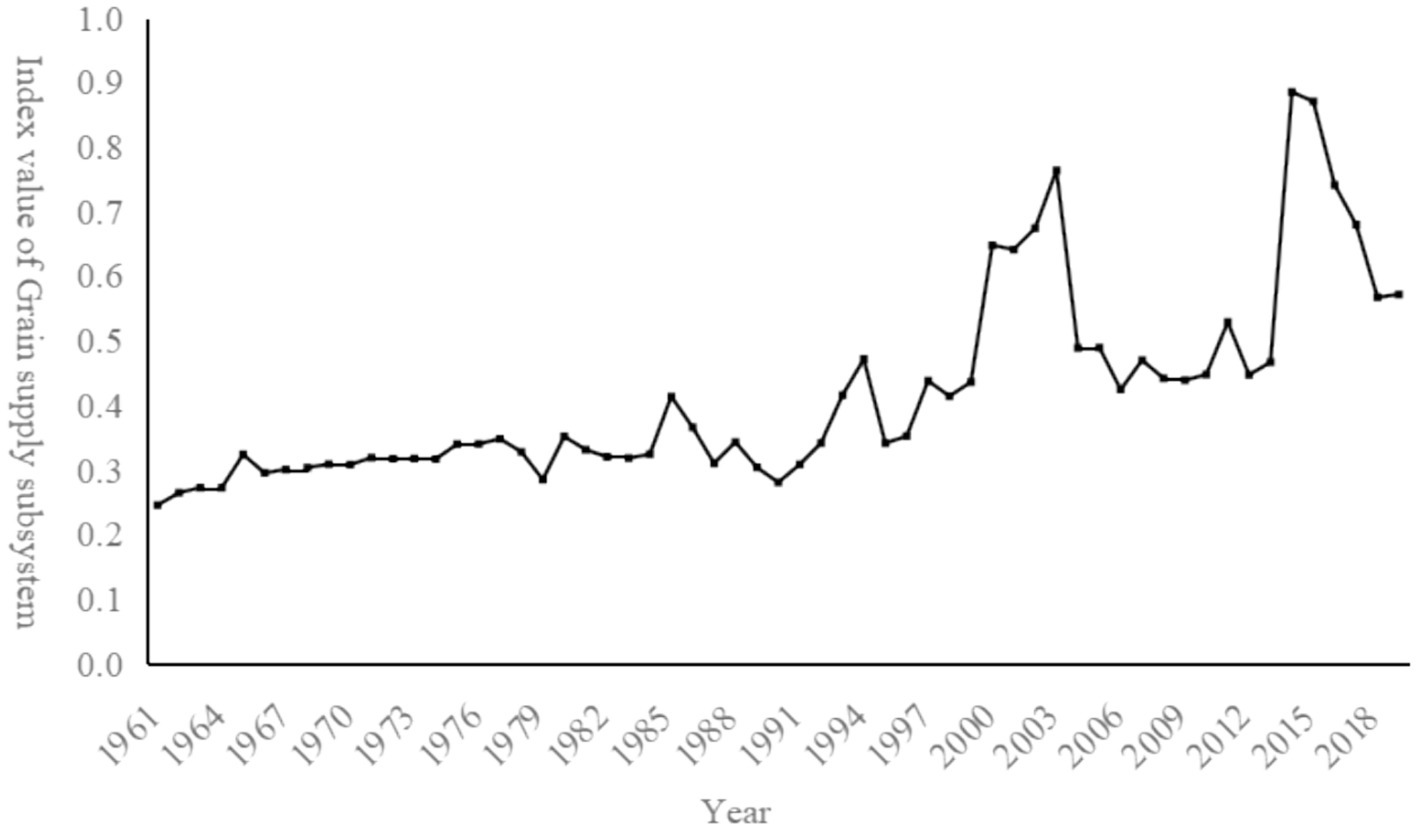
Figure 6. Evolution trend of grain supply subsystem.
On the other hand, grain reserves and imports are often influenced by social factors. With the advancement of globalization and increased international exchanges, social factors have received more attention, which leads to greater complexity in grain reserves and imports. For example, wars may increase imports and reduce exports, and epidemics may prevent the timely replenishment of reserves.
Therefore, the grain supply subsystem is characterized by instability. However, it is essential to note that this instability does not persist continuously but has become more pronounced in recent years; this highlights the need for a stable supply subsystem to ensure long-term food security. From the perspective of barrier analysis, during the period from 1961 to 2003, the barrier level of the grain supply subsystem generally declined. However, it started to rise again from 2004 to 2012 and reached its lowest point in 2014 with a barrier level of only 0.033. From 2014 to 2019, it began to rise again and reached 0.151 in 2019, the highest value since 1961; this indicates an increasing trend in the instability and barrier level of the grain supply subsystem, which poses hidden risks to food security.
5.2.4 Grain circulation subsystem
The evolution trend of grain circulation subsystem is shown in Figure 7. The trend of the evaluation index of the grain circulation subsystem can be divided into two stages: stable development (1961–2003) and continuous growth (2004–2019). In the first stage of stable development, the evaluation index of the grain circulation subsystem fluctuated within the range of 0.2–0.3. On the one hand, this indicates relative stability during this stage. However, on the other hand, it reflects the need for breakthroughs in this subsystem over the 40 years, with low scores and minimal impact on the overall improvement of food security. Looking at individual indicators, 2003 marked a turning point when the turnover volume of goods transitioned from slow growth to rapid growth. However, after 2012, a pattern of “growth-slump-growth” emerged, indicating that challenges and development will be the main themes for improving grain transportation capacity in the future. The proportion of the primary industry’s output continued to decline (relative to the secondary and tertiary sectors), reflecting the decline of the agricultural industry. Without a solid economic foundation, even with outstanding transportation capacity, ensuring the long-term development of grain circulation is not easy. From the perspective of barrier analysis, the grain circulation subsystem maintained a high level from 1961 to 2002. The minimum value within this period was recorded in 1989 (0.265) and the maximum in 2002 (0.304). After 2002, the barrier level started declining, indicating an improvement in grain circulation.
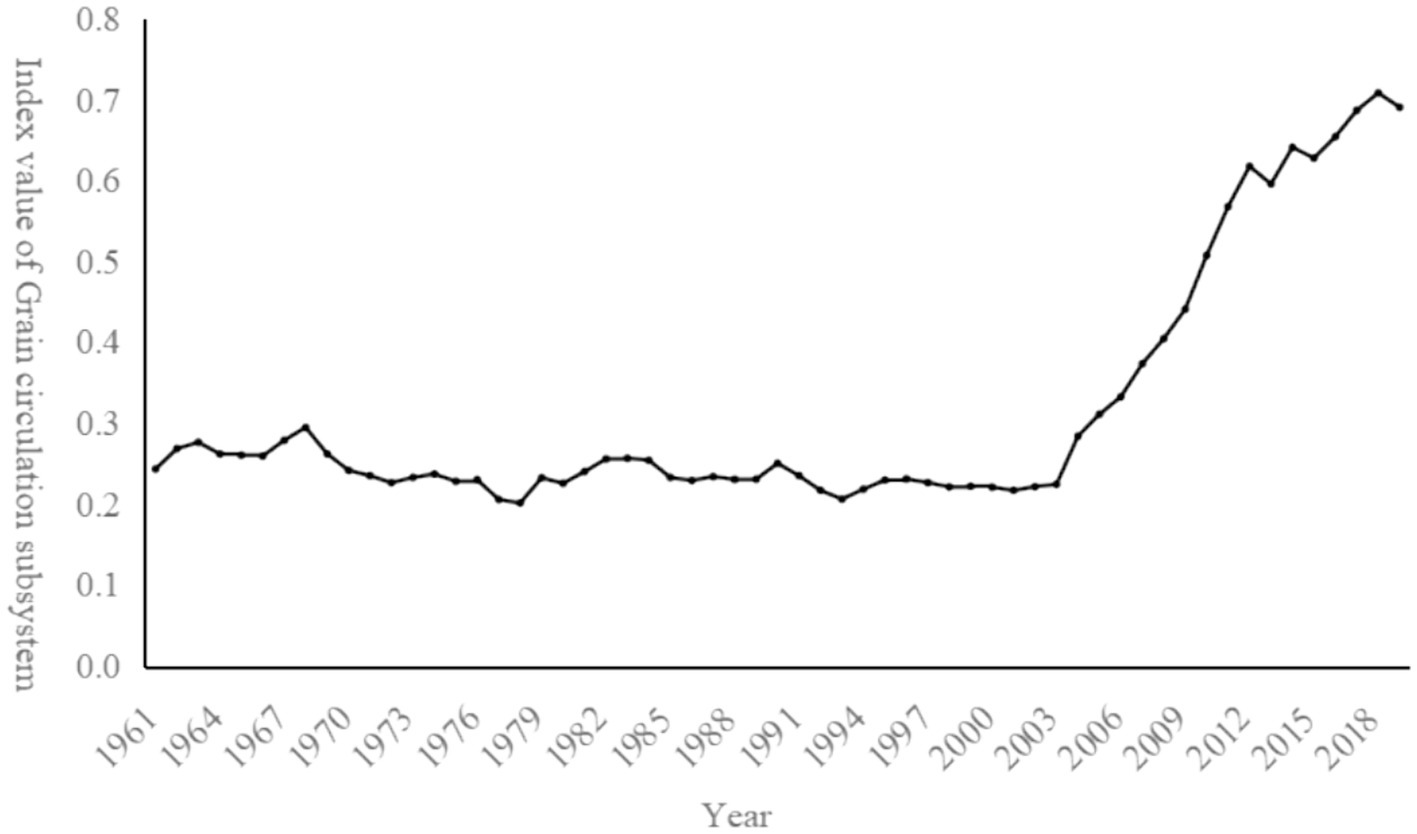
Figure 7. Evolution trend of grain circulation subsystem.
5.2.5 Grain consumption subsystem
The evolution trend of grain consumption subsystem is shown in Figure 8. From 1961 to 1998, the index value of the grain consumption subsystem continued to decline. Examining various indicators, this is attributed to the increase in the year-end total population from 658.59 million people in 1961 to 1,247.61 million people in 1998, representing a growth rate of 89.44% and an average annual increase of 15.5 million people. The total increase of 58.902 million people is close to the combined population of the United States and Indonesia. While rapid population growth does bring more labor force, the proportion of employment in the primary industry decreased from 77.2% in 1961 to 49.8% in 1998; this indicates an increased burden on agricultural labor per unit and implies that with each reduction in agricultural labor, a particular portion of the population will face a crisis in grain consumption at a certain point in time, this, in turn, can lead to grain supply and distribution crises, subsequently affecting the domestic environment and threatening national food security. Furthermore, grain waste increased from 5.88 million tons in 1961 to 27.29 million tons in 1998, an increase of 21.41 million tons or 364.12%. In 1998, grain waste reached its highest value between 1961 and 2019. Grain waste often follows grain consumption. For example, when an individual finishes a meal at a restaurant, they may discard the food because a particular dish does not meet their taste preferences. This continuous cycle of “consumption-waste” behavior, the more prevalent it becomes, the greater the amount of waste, which is detrimental to food security. Therefore, it is necessary to break this cycle of behavior, such as displaying slogans promoting grain conservation in restaurants or improving the taste of meals.
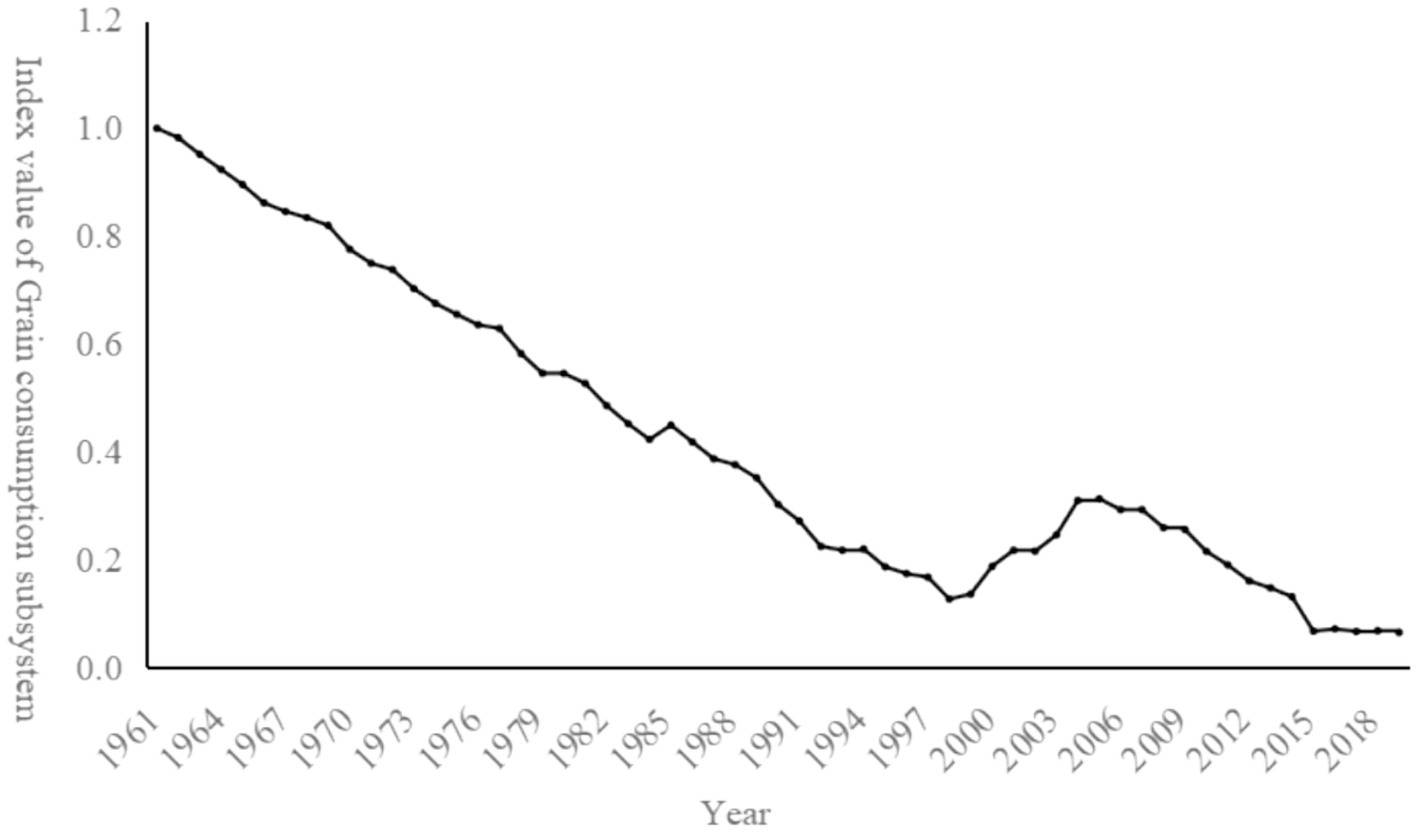
Figure 8. Evolution trend of grain consumption subsystem.
From 1999 to 2005, the index value of the grain consumption subsystem increased from 0.135 to 0.312, with an average annual growth of 0.025, representing a growth rate of 131.11%. During this period, grain waste decreased from 26.421 million tons to 15.32 million tons. The year-end total population increased from 1,257.86 million to 1,307.56 million people, with a growth of 49.7 million and an average annual increase of 8.283 million. With a slowdown in population growth, these factors contributed to the development of the subsystem index value. However, from 2006 onwards, the grain consumption situation did not show improvement, and the amount of waste began to increase again, reaching 24.94 million tons in 2015. Although there was a slight decrease afterward, it remained at a relatively high level (around 24 million tons), resulting in a continuous decline in the index value of this subsystem.
6 Conclusion and discussion
6.1 Discussion
Food security is essential to national security, and its significance is particularly far-reaching for China, a populous country. In recent years, China has made remarkable progress in food production, reserves, and distribution, but at the same time, it faces many challenges (Lee et al., 2024). Constructing a reasonable food security indicator system and analyzing its systematic evolution is significant for guaranteeing China’s food security. Our findings also leave room for interpretation. Especially after 2006, food waste in China has continued to deteriorate, and this deteriorating trend remained the same even in 2019, which has been observed, so how to mitigate the amount of food waste in China is one of the essential topics to explore. In addition, we also observe that the reduction of the labor force in the primary industry has become the number one obstacle factor to China’s food security since 2019, so a critical topic for future discussions on issues related to China’s food security will be how to use non-labor factors to guarantee food security.
6.2 Conclusion
The construction and selection of a more rigorous indicator system for China’s food security, exploring the precise expression of indicators and analyzing their actual contribution to food security, is an urgent issue to be addressed in the new era of food security guarantee work (Gil et al., 2019). Based on this, this study introduces the Nvivo software into the research framework of food security to visualize the system construction process. The Analytic Hierarchy Process (AHP) and Entropy Weight Coefficient (EWC) methods determine the indicator weights. Uncertainty analysis is conducted using Monte Carlo simulation, and the obstacle degree test is optimized based on the results of the Monte Carlo simulation, analyzing the evolution of China’s food security system. The following findings and policy recommendations are made: (1)The indicator system for China’s food security can be divided into two main categories: the external environment and the food chain. It consists of five subsystems: international factors, domestic factors, grain supply, grain circulation, and grain consumption. There are 12 specific indicators, including average wages of urban employees, urbanization rate, the proportion of primary industry employment, world grain export volume, international agricultural commodity price index, grain production, changes in grain reserves, grain imports, the proportion of primary industry output value, goods turnover, grain waste, and year-end total population. (2) The results of the Monte Carlo simulation indicate that the uncertainty of the weights of the indicator system constructed by the AHP method is much higher than that built by the EWC method. Therefore, this study selects the weights determined by the EWC method to analyze further obstacle degrees and the evolution of China’s food security. (3) The diagnosis of obstacles to food security shows that after 2010, the obstacle degree of each indicator is less than 0.3. Before 2015, the average wages of urban employees were the main obstacle to China’s food security. However, after 2015, the obstacle level of this indicator decreased significantly, and the population became the main obstacle factor. The degree of obstacles to the proportion of primary industry output value and the number of primary industry employees ranked second and third in 2019 indicate that issues related to agricultural economic development and grain production enthusiasm need extra attention. (4) In the analysis of the evolution of China’s food security, it is found that overall food security has been improving since 1999, but there are still risks. For example, the stability of the grain supply subsystem is low, with increasing obstacle degrees, the consumption situation has not improved, and the international environment is showing a deteriorating trend.
Based on the above research conclusions, the following policy recommendations are proposed. (1) Food security guarantee work should not be limited to food production alone but should also consider changes in the external environment; this includes timely utilization of the domestic market to offset the potential negative impact of food embargoes and sudden price increases on China’s food security. (2) Emphasis should be placed on addressing the impact of human factors on food security while avoiding imbalances in food security caused by population structure. It is essential to accurately identify various population groups’ ability to access food, including the influence of wages on food accessibility. Each food security subsystem should proactively adapt to population trends and make timely adjustments. (3) Efforts should improve grain supply stability and cultivate grain production’s risk resilience. They are ensuring synchronized development with other food security subsystems, exploring low-cost and efficient allocation of production materials such as fertilizers and pesticides, improving the process of grain insurance claims, reducing grain production costs, and utilizing convenient methods such as the Internet to disseminate practical and production-friendly grain production techniques and theories to farmers, stimulating grain production enthusiasm. (4) Fourth, accurately diagnose and timely suspend food waste behaviors, promote food security while analyzing the causes of food waste, and combine the nutritional status of the dining staff and restaurant evaluations with focused follow-up visits to schools, enterprises, and other significant cafeteria locations.
Data availability statement
The raw data supporting the conclusions of this article will be made available by the authors, without undue reservation.
Author contributions
ZY: Data curation, Investigation, Methodology, Software, Visualization, Writing – original draft. QM: Conceptualization, Formal analysis, Funding acquisition, Methodology, Supervision, Writing – review & editing.
Funding
The author(s) declare that financial support was received for the research, authorship, and/or publication of this article. This research was funded by the China Postdoctoral Foundation (grant number 2023 M733243) and the Henan Province Philosophy and Social Science Annual Program (grant number 2023CJJ185) and Heilongjiang Province Philosophy and Social Sciences Program (grant number 23GJD065).
Conflict of interest
The authors declare that the research was conducted in the absence of any commercial or financial relationships that could be construed as a potential conflict of interest.
Publisher’s note
All claims expressed in this article are solely those of the authors and do not necessarily represent those of their affiliated organizations, or those of the publisher, the editors and the reviewers. Any product that may be evaluated in this article, or claim that may be made by its manufacturer, is not guaranteed or endorsed by the publisher.
References
Bonuedi, I., Kamasa, K., and Opoku, E. E. O. (2020). Enabling trade across borders and food security in Africa. Food Secur. 12, 1121–1140. doi: 10.1007/s12571-020-01095-y
Buks, J., Obiedzińsk, A. A., and Prandecki, K. (2016). Environmental externalities and food security. J. Agribus. Rural Dev. doi: 10.17306/jard.2016.29
Burchi, F., and De Muro, P. (2016). From food availability to nutritional capabilities: advancing food security analysis. Food Policy 60, 10–19. doi: 10.1016/j.foodpol.2015.03.008
Burgess, M. J., Halpern, B. S., Nicholson, E., and Milner-Gulland, E. J. (2017). Navigating uncertainty in environmental composite indicators. Ecol. Indic. 75, 268–278. doi: 10.1016/j.ecolind.2016.12.034
Caccavale, O. M., and Giuffrida, V. (2020). The Proteus composite index: towards a better metric for global food security. World Dev. 126:104709. doi: 10.1016/j.worlddev.2019.104709
Chesnaye, N. C., Stel, V. S., Tripepi, G., Dekker, F. W., Fu, E. L., Zoccali, C., et al. (2022). An introduction to inverse probability of treatment weighting in observational research. Clin. Kidney J. 15, 14–20. doi: 10.1093/ckj/sfab158
Clapp, J., Moseley, W. G., Burlingame, B., and Termine, P. (2022). The case for a six-dimensional food security framework. Food Policy 106:102164. doi: 10.1016/j.foodpol.2021.102164
Dobrota, M., Bulajic, M., Bornmann, L., and Jeremic, V. (2016). A new approach to the QS university ranking using the composite I-distance indicator: uncertainty and sensitivity analyses. J. Assoc. Inf. Sci. Technol. 67, 200–211. doi: 10.1002/asi.23355
Dobrota, M., Martic, M., Bulajic, M., and Jeremic, V. (2015). Two-phased composite I-distance indicator approach for evaluation of countries’ information development. Telecommun. Policy 39, 406–420. doi: 10.1016/j.telpol.2015.03.003
Gil, J. D. B., Reidsma, P., Giller, K., Todman, L., Whitmore, A., and van Ittersum, M. (2019). Sustainable development goal 2: improved targets and indicators for agriculture and food security. Ambio 48, 685–698. doi: 10.1007/s13280-018-1101-4
Lan, J., Khan, S. U., Sadiq, M., Chien, F., and Baloch, Z. A. (2022). Evaluating energy poverty and its effects using multi-dimensional based DEA-like mathematical composite indicator approach: findings from Asia. Energy Policy 165:112933. doi: 10.1016/j.enpol.2022.112933
Lee, C. C., Zeng, M., and Luo, K. (2024). How does climate change affect food security? Evidence from China. Environ. Impact Assess. Rev. 104:107324. doi: 10.1016/j.eiar.2023.107324
Leroy, J. L., Ruel, M., Frongillo, E. A., Harris, J., and Ballard, T. J. (2015). Measuring the food access dimension of food security: a critical review and map** of indicators. Food Nutr. Bull. 36, 167–195. doi: 10.1177/0379572115587274
Liang, L., Chen, M., Luo, X., and Xian, Y. (2021). Changes pattern in the population and economic gravity centers since the reform and opening up in China: the widening gaps between the south and north. J. Clean. Prod. 310:127379. doi: 10.1016/j.jclepro.2021.127379
Liang, X., Jin, X., Han, B., Sun, R., Xu, W., Li, H., et al. (2022). China’s food security situation and key questions in the new era: a perspective of farmland protection. J. Geogr. Sci. 32, 1001–1019. doi: 10.1007/s11442-022-1982-9
Liu, Y., Li, J., and Yang, Y. (2018). Strategic adjustment of land use policy under the economic transformation. Land Use Policy 74, 5–14. doi: 10.1016/j.landusepol.2017.07.005
Mahmudiono, T., Yasin, G., Jasim, S. A., Alghazali, T. A. H., Kadhim, M. M., Iswanto, A. H., et al. (2022). Analyzing food production risk with Monte Carlo simulation. Food Sci. Technol. 42:e03522. doi: 10.1590/fst.03522
Milenkovic, M. J., Brajovic, B., Milenkovic, D., Vukmirovic, D., and Jeremic, V. (2016). Beyond the equal-weight framework of the networked readiness index: a multilevel I-distance methodology. Inf. Dev. 32, 1120–1136. doi: 10.1177/0266666915593136
Spiertz, H. (2012). Avenues to meet food security. The role of agronomy on solving complexity in food production and resource use. Eur. J. Agron. 43, 1–8. doi: 10.1016/j.eja.2012.04.004
van Wijk, M., Hammond, J., Gorman, L., Adams, S., Ayantunde, A., Baines, D., et al. (2020). The rural household multiple Indicator survey, data from 13,310 farm households in 21 countries. Sci. Data 7:46. doi: 10.1038/s41597-020-0388-8
Viana, C. M., Freire, D., Abrantes, P., Rocha, J., and Pereira, P. (2022). Agricultural land systems importance for supporting food security and sustainable development goals: a systematic review. Sci. Total Environ. 806:150718. doi: 10.1016/j.scitotenv.2021.150718
Wang, L., Xiao, T., Liu, S., Zhang, W., Yang, B., and Chen, L. (2023). Quantification of model uncertainty and variability for landslide displacement prediction based on Monte Carlo simulation. Gondwana Res. 123, 27–40. doi: 10.1016/j.gr.2023.03.006
Wei, Z., Ji, D., and Yang, L. (2023). Comprehensive evaluation of water resources carrying capacity in Henan Province based on entropy weight TOPSIS—coupling coordination—obstacle model. Environ. Sci. Pollut. Res. 30, 115820–115838. doi: 10.1007/s11356-023-30456-1
Woods, M., Paulus, T., Atkins, D. P., and Macklin, R. (2016). Advancing qualitative research using qualitative data analysis software (QDAS)? Reviewing potential versus practice in published studies using ATLAS. Ti and NVivo, 1994–2013. Soc. Sci. Comput. Rev. 34, 597–617. doi: 10.1177/0894439315596311
Yao, C., Teng, Y., and Huang, L. (2015). Evaluation index system construction and empirical analysis on food security in China. Trans. Chin. Soc. Agric. Eng. 1092–1093, 1576–1580. doi: 10.4028/www.scientific.net/amr.1092-1093.1576
Keywords: food security, China’s food security indicator system, Monte Carlo simulation, obstacle degree test, evolution analysis
Citation: Yuting Z and Meng Q (2024) Construction and system evolution analysis of China’s food security indicator system. Front. Sustain. Food Syst. 8:1363340. doi: 10.3389/fsufs.2024.1363340
Edited by:
Albie F. Miles, University of Hawaii–West Oahu, United StatesReviewed by:
Ingrid Kelling, Heriot-Watt University, United KingdomSaleem Mustafa, Universiti Malaysia Sabah, Malaysia
Copyright © 2024 Yuting and Meng. This is an open-access article distributed under the terms of the Creative Commons Attribution License (CC BY). The use, distribution or reproduction in other forums is permitted, provided the original author(s) and the copyright owner(s) are credited and that the original publication in this journal is cited, in accordance with accepted academic practice. No use, distribution or reproduction is permitted which does not comply with these terms.
*Correspondence: Qu Meng, cXVtZW5nQHp6dS5lZHUuY24=