 Jongjit Rittirong
 Pattraporn Chuenglertsiri
 Sirinya Phulkerd
- Institute for Population and Social Research, Mahidol University, Salaya, Nakhon Pathom, Thailand
The overall status of the food system in Thailand is currently unknown. Although several national and international reports describe Thailand food system, they are not accurate and relevant to inform policies. This study aims to develop indicators which measure Thailand’s sustainable food system. We adopted seven-dimensional metrics proposed by Gustafson to facilitate a comparative analysis of food systems, namely (1) food nutrient adequacy; (2) ecosystem stability; (3) food availability and affordability; (4) sociocultural well-being; (5) food safety; (6) resilience; and (7) waste and loss reduction. Three rounds of the Delphi method were convened to assess the proposed indicators using the Item Objective Congruence (IOC) by 48 Thai stakeholders recruited from the government, NGOs, and academia. IOC is a procedure used in test development for evaluating content validity at the item development stage. In each round, the average IOC for each item was carefully considered, together with stakeholders’ comments on whether to retain, remove, or recruit new indicators. The communication through mail and email was sent out so that stakeholders could assess independently. A total of 88 and 73 indicators went to the first and second round Delphi assessment; this resulted in 62 final indicators after the third round. In conclusion, these 62 indicators and 190 sub-indicators are too many for policy uses. As an ongoing indicator development, we plan that these 62 indicators will be further tested in different settings to assess data feasibility. After field tests, the final prioritized indicators will be submitted for policy decisions for regular national monitoring and informing policy toward sustainable food systems in Thailand.
1 Introduction
A sustainable food system is essential for national and global food security in ensuring nutrition for all populations as committed in the sustainable development goal (SDGs) Goal 2: “End hunger, achieve food security and improved nutrition and promote sustainable agriculture” (Grosso et al., 2020). Food system refers to the “entire range of actors and their interlinked value-added activities in the production, aggregation, processing, distribution, consumption, and disposal of food products (Food and Agriculture Organization of the United Nations, 2018e).” The food system should not only create economic benefits but prevent social impacts and environmental harm from upstream to downstream and sustain the well-being of all stakeholders in the food chain. Without a thorough understanding of the current status, achieving a sustainable food system is not possible. Thus, indicators are needed to monitor the situation, identify problems and prioritize solutions.
Thailand is a major exporter of food commodities, including rice and poultry. In 2020, Thailand was the second-largest global rice export after India and the third global largest export of poultry after Brazil and the United States (Food and Agriculture Organization of the United Nations, 2022), however, the export value has declined over the years (Bank of Thailand, 2022; Bureau of Agricultural Economics, 2022). In terms of malnutrition, in 2019, 13.3% of Thai children under age five were stunted, 7.7% were wasted, and 9.2% were overweight (National Statistical Office, 2020b), all with an increasing trend. Food safety continues to be challenging, as pesticide residues in fruits and vegetables, both imported and domestically produced, exceeded the standard by 58.7% among 509 samples from all over the country (Thaipan, 2020), and 40% of the chicken meat and chicken livers surveyed contained antibiotic residues (Greenpeace Thailand, 2020). 17.9% of red meat using growth promoters (Beta-Agonist) were detected in 378 samples (Bureau Of Promotion And Support Of Food Safety, M. O. P. H, 2019).
Thailand’s food production was more frequently affected by climate change and rainfall. During 2009–2018, natural disasters damaged more than 22,400 km2 of agricultural land, with the economic cost of the drought of more than 6 billion baht (USD176 million; Leknoi, U., 2019), especially rice production. In addition, El Niño resulted in increased water use for off-season farming areas. During 2009–2018, floods damaged agricultural areas and caused economic losses of more than 50 billion baht (USD1,466 million). Climate change resulted in limited food supplies, increased food prices, and food insecurity, especially among the poor. Challenges are complicated by the lack of the government’s clear climate mitigation policy toward strengthening the resilience of food and agricultural production.
The food price index (of raw material) had increased from 86.9 in 2012 to 100.7 in 2021 [base year 2019] (Ministry Of Commerce, 2021). Household Socio-Economic Survey 2011–2019 reported food spending was a major share, 37.98% of total monthly household consumption expenditure; it was highest in the poorer Northeastern region (42.8%) and lowest in the affluent Greater Bangkok area (33.1%; National Statistical Office, 2020a). Poverty results in regional disparities in access to adequate nutrition. The COVID pandemic, lockdown and job losses increased food insecurity, which disproportionally affected the poor and vulnerable populations in urban areas (Business Prachachat, 2020a,b; Office of the Consumer Protection Board, 2021).
Despite increasing challenges, the comprehensive status of the food system is unknown and not monitored regularly and systematically using standardized tools. Different ministries, such as the Ministry of Agriculture and Cooperatives, Ministry of Public Health, and Ministry of Natural Resources and Environment, collected data relevant to their legal and institutional mandates, which resulted in fragmentation, lack of interoperability and limited policy use to meet the national challenges.
Despite numerous international indicators (Food and Agriculture Organization of the United Nations, 2018c,d; International Dietary Data Expansion Project, 2021), they are not aligned with the national context. For instance, Economist Impact (2022) assesses Thailand’s food safety by enacting food safety legislation, with a 0 score, despite the fact that Thailand has numerous legislations on the controlled use of chemicals in agricultural produce and regulations related to food safety, though challenges are effective enforcement and outdated legislation. This contradicts Economic Impact, which reported that Thailand scored high (80 out of 100) in food safety mechanisms. A set of holistic food system indicators will contribute to the country’s ability to identify areas for improvement. It is, therefore, crucial for Thailand to develop country-specific indicators. With the application of the food metrics framework, this study aims to develop a Thai context-specific framework and indicators and identify data sources. Understanding the broader picture of Thailand’s food system can inform legislation, policy and enforcement toward a sustainable food system.
2 Materials and methods
2.1 Study design
This study used mixed methods approaches. There are three parts; first, a literature review to identify food system indicators; second, in-depth interviews of stakeholders with an aim to understand the existing situation, the complexity of the food system and form the design contents of Delphi assessment; and finally, the Delphi method to seek stakeholders’ assessment of relevant to the context, data feasibility and availability in Thailand of the proposed indicators which are categorized by seven food metric framework.
2.1.1 Food metric framework
The framework for assessing the food system should encompass the entire spectrum, from production to consumption, health and ecological impacts. Having reviewed various frameworks, we decided to apply the Gustafson’s framework (2016) with seven dimensions, namely: (1) food nutrient adequacy; (2) ecosystem stability; (3) food affordability and availability; (4) sociocultural well-being; (5) food safety; (6) resilience; and (7) waste and loss reduction (Gustafson et al., 2016). This framework covers relevant dimensions of the food system from upstream to downstream of the food supply chain. It quantifies and provides a visual presentation to facilitate comparisons across countries and communities, such as a global-scale analysis of the national food system in 156 countries (Chaudhary et al., 2018).
2.1.2 Selecting indicators
We applied three rounds of the Delphi method, which enables diverse stakeholders to independently and anonymously assess all indicators without biases. The evaluation period took place between September 2021 and January 2022. Each round took at least 2 weeks or up to a month. Figure 1 shows the initial process for the proposed set of indicators.
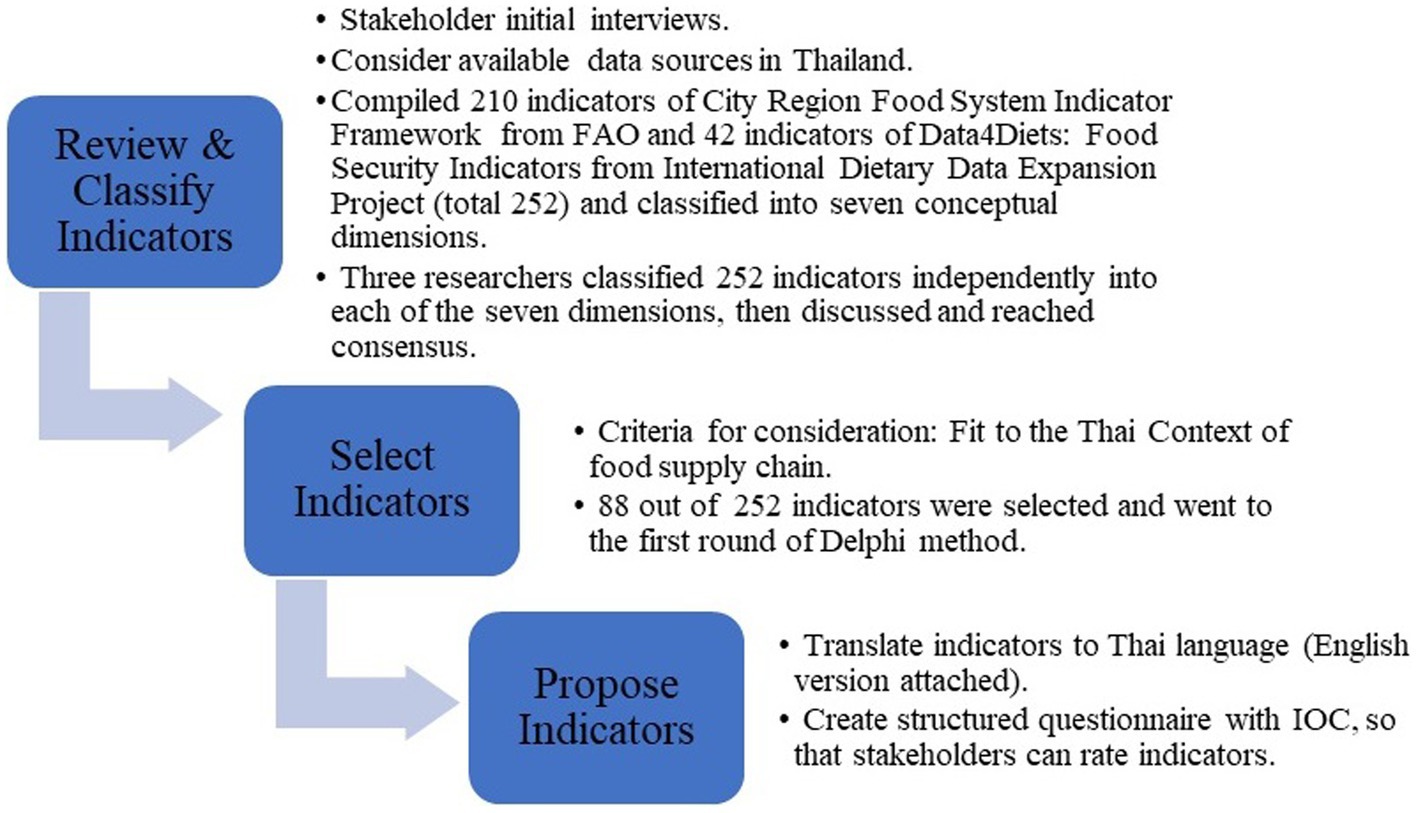
Figure 1. The initial process for the proposed set of indicators.
2.1.3 Participants
There are two groups of participants: (1) stakeholders for the initial interview in order to form the design of Delphi, and (2) stakeholders for the Delphi method.
2.1.3.1 Stakeholders for the initial interviews
Firstly, stakeholder interviews were conducted during the initial phase to better understand the existing food system and ensure the indicators were framed properly and well captured the status. The key expectations from the interviews include (1) Thailand’s food system from their perspectives, (2) mechanisms in food systems, (3) players/stakeholders in each mechanism, push and pull factors that cause both positive and negative consequences, and (4) important or concerned issues in the food system and possible solutions.
We invited four purposively selected informants who are key actors in agriculture and food at the national and regional levels and are involved with Thailand policy development for in-depth interviews. They were (1) the chair of the steering committee (age range 70–74) on food security in the national food board who is directly in charge of national food security, (2) a senior researcher in agricultural economics (age range 70–74) working for a national think tank institute who play roles in agricultural research budget allocation, (3) a professor in agricultural economics (age range 40–44) from a public university who an expert in agricultural-, climate- and economic-related researches, and (4) a professor in the environmental department (age range 45–49) from a public university who experiment agriculture suitable for drought context in the northeast region, and organize training workshop for biodiversity farming and ecological agriculture. The results from these interviews were used to ensure the comprehensiveness and relevance of indicators in our study.
2.1.3.2 Stakeholder recruitment for the Delphi method
Stakeholders with expertise in food systems or experience in policy processes were listed from the literature review in the first few months of the project; this ensured their experiences were relevant to this study. They were identified and recruited from government agencies, non-government organizations (NGOs), and university academia, covering expertise in the Gustafson’s seven dimensions. We invited and successfully recruited 48 stakeholders to review the proposed indicators and rate IOC (see Table 1). We have reviewed the track records of all 48 stakeholders; they have substantive expertise and experiences on food system (see their affiliations in Supplementary material 3. Only affiliations were shown to protect their confidentiality.) Their expertises are relevant to the seven dimensions of Gustafson’s framework; further, we managed to have adequate numbers in each of the seven dimensions. IOC is a procedure used in test development to evaluate content validity at the item development stage (Turner and Carlson, 2003). The expertise of some stakeholders may fit more than one dimension. We ensured that we had at least three stakeholders in each dimension. However, some stakeholders withdrew from the second or third round assessment, so we recruited additional stakeholders to fill the area of expertise.
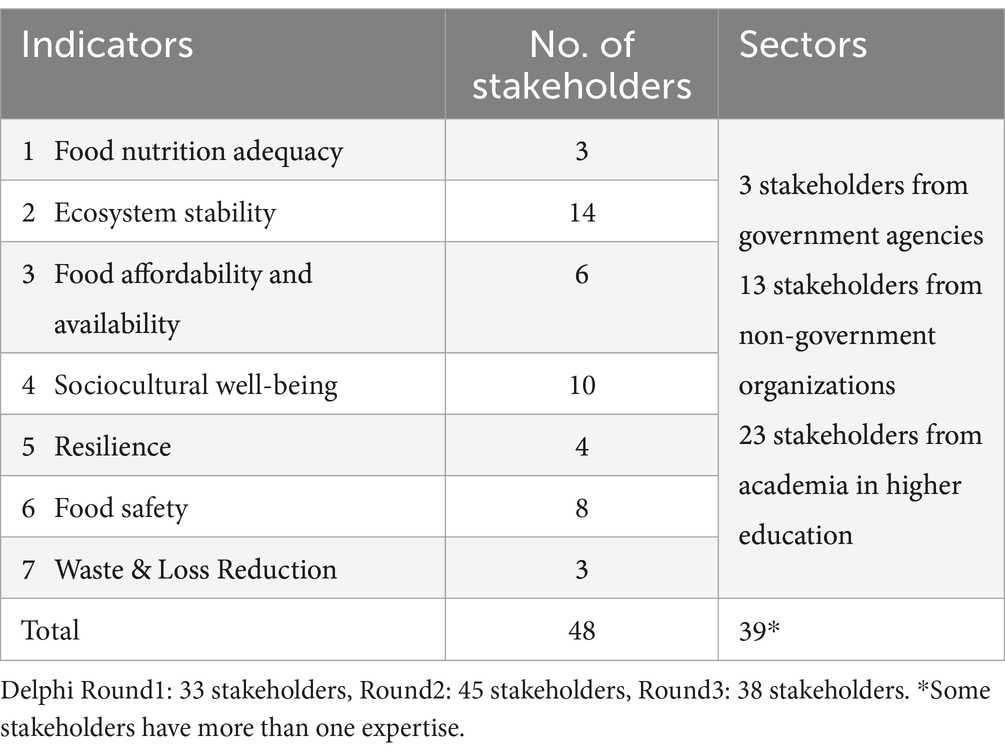
Table 1. Stakeholders participated in Delphi classified by their expertise, work experiences and sectors.
2.1.4 Initial food system indicators
We conducted the literature review to synthesize existing food indicators, such as indicators from FAO (Food and Agriculture Organization of the United Nations, 2018d) and INDDEX (International Dietary Data Expansion Project, 2021). The indicators were ranked and identified if they were suitable to the Thai context. Some indicators are also modified to be more suitable. All these potential indicators were categorized into seven dimensions as potential set of indicators for Delphi assessment.
The initial 88 indicators were sent out to 33 stakeholders (who agreed to participate) in the first round of Delphi. They were asked to indicate the relevance by rating the IOC with comments and suggesting data sources. After returning the questionnaire with responses, each stakeholder’s IOC score for each indicator was averaged. We consider quantitatively and qualitatively to remove, retain, and include additional indicators as proposed by them.
Quantitatively, indicators with an average IOC below 0.5 are removed. Qualitatively, all three researchers considered stakeholders’ comments on whether the indicators should be removed, retained, or additional indicators should be needed. We repeat the same process for the second and third rounds with 73 and 63 indicators, respectively.
2.2 Data collection and analysis
2.2.1 Stakeholder interviews
2.2.1.1 Opportunities and challenges
Stakeholder interviews show that the food system involves numerous actors and stakeholders in each stream of the food supply chain. As an exported-oriented economy, the food system is also interconnected with the global market, e.g., requirements by international trade organizations and major exporting markets, which can influence food and production standards. Stakeholders pointed out that Thailand has great opportunities due to strong local communities and culture, food surplus, exporter capacity, and crop varieties. However, challenges remain in the local market and trade system, wage and labor issues, climate change, requirements, standards and regulations posed by international trade organizations and exporting markets, inadequate investment in the upstream food supply chain, lack of up-to-date research and development and technologies and monopoly by a few conglomerates, contract farming’s, and the excessive use of chemicals with inadequate regulation.
Furthermore, Thailand experiences an increased frequency and severity of drought and flooding, which affects the farmers and consumers who are poor and vulnerable. All these challenges should be taken into account as monitoring indicators of the food system.
2.2.1.2 Impact of COVID-19 pandemic
Stakeholders have mentioned the impacts of COVID-19 pandemic; health and economic shocks affect access to food and nutrition, disproportionately affecting the poor, the vulnerable population and the urban population who do not have their own food production and rely on the retail and ready-to-eat food market. This requires sensitive indicators to monitor food security, resilience and food self-reliance in the community during public health emergencies and frequent disasters.
From the interviews, we concluded that to develop the indicators for a resilient and sustainable food system, we need to cover the whole range of the food system and identify key actors who can influence or are affected by the food system. We also consider food sovereignty to ensure the rights of agriculture stakeholders by strengthening community self-management using resources in the community, recognizing the importance of preserving the environment and agroecology, and mitigating climate change. Moreover, the concept of crisis resilience is also included in developing indicators.
2.2.2 Delphi method
The initial set of 252 indicators, of which 210 were from FAO City Region Food System Indicator Framework and 42 from Data4Diets: Food Security Indicators from International Dietary Data Expansion Project (Food and Agriculture Organization of the United Nations, 2018c,d; International Dietary Data Expansion Project, 2021), were compiled, reviewed and categorized independently and reach consensus by the three researchers, into seven conceptual dimensions [1. food nutrient adequacy; 2. ecosystem stability; 3. food availability and affordability; 4. sociocultural well-being; 5. food safety; 6. resilience; and 7. waste and loss reduction]. After compilation, the three researchers prioritized these 252 indicators by using only one criterion: indicators must be relevant to Thailand’s food systems context. Out of 252 indicators, 88 were selected as relevant and proceeded to the first round of Delphi assessment. As the criterion used by the three researchers is clear and objective which requires no interpretation by the three researchers in selecting indicators. Therefore, we do not have third-party validation in the process of selecting 88 out of 252 indicators.
At the first round of Delphi, the proposed 88 indicators were assessed by stakeholders. We requested them to consider if the sub-indicators and indicators were relevant to Thailand’s food system, the feasibility of data collection, and data availability in Thailand. These (sub)indicators were in the form of an Item Objective Congruence index (IOC). The stakeholders were asked whether they agreed with the indicator on data availability with following scores: −1 not agree; 0 somewhat agree; 1 agree. We applied the same IOC throughout the three rounds of the Delphi assessment. The indicators would be dropped if the average IOC was less than 0.5. Not only scoring, they were also asked to provide reasons and suggestions for improving the narrative or description of indicators and suggest the data sources and responsible agencies for those sources. The number of indicators entering into each of the three rounds of the Delphi assessment was illustrated in Supplementary material 1 with a summary at the three last three rows of the table in Figure 2 and Table 2.
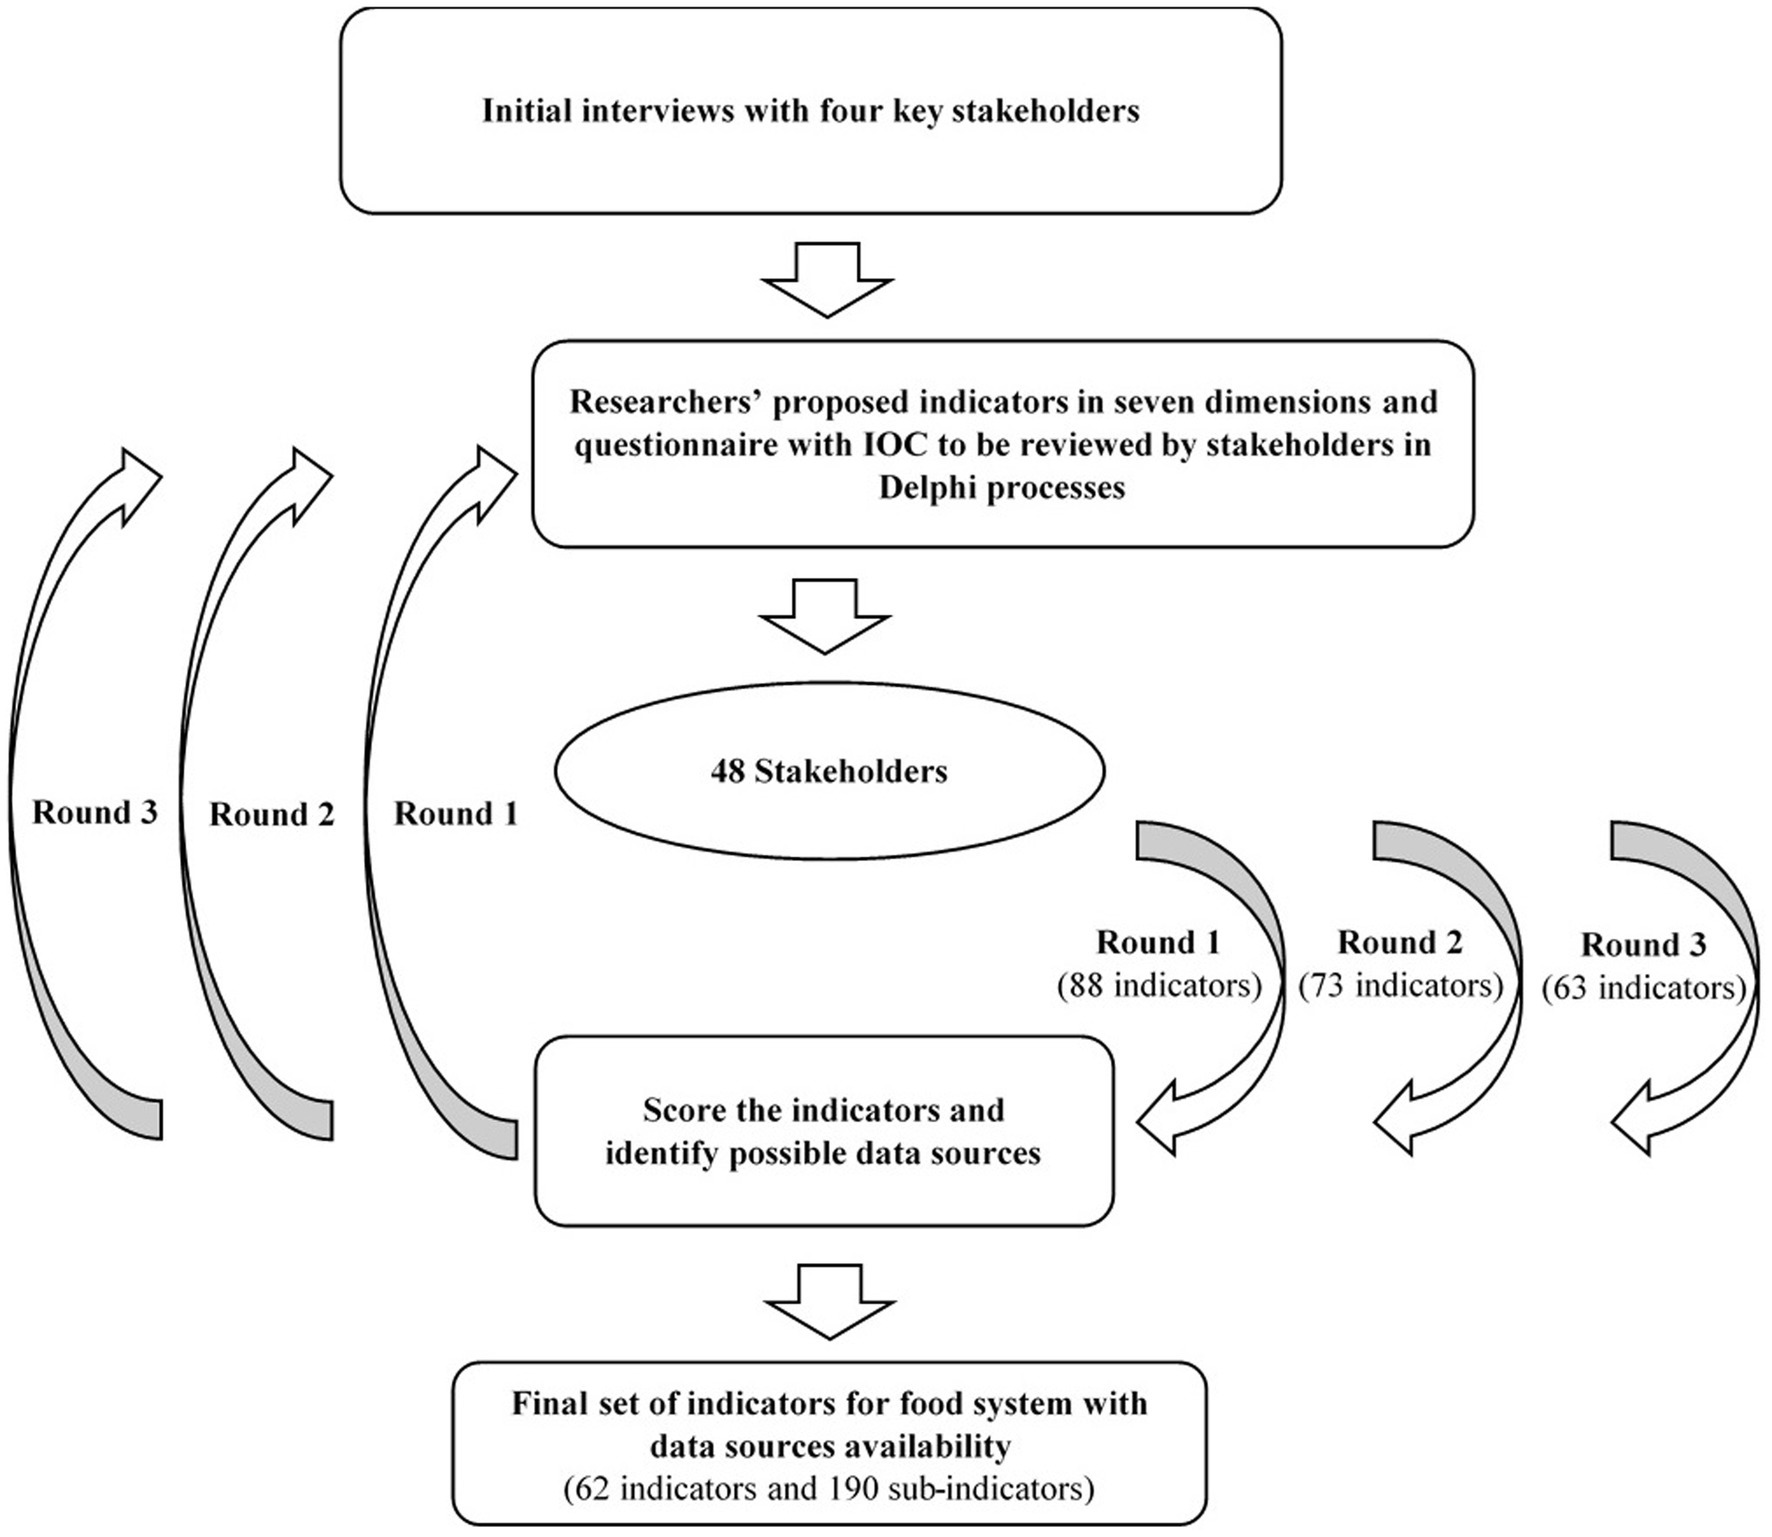
Figure 2. The procedure of the three-round Delphi method to develop indicators for Thailand food system.
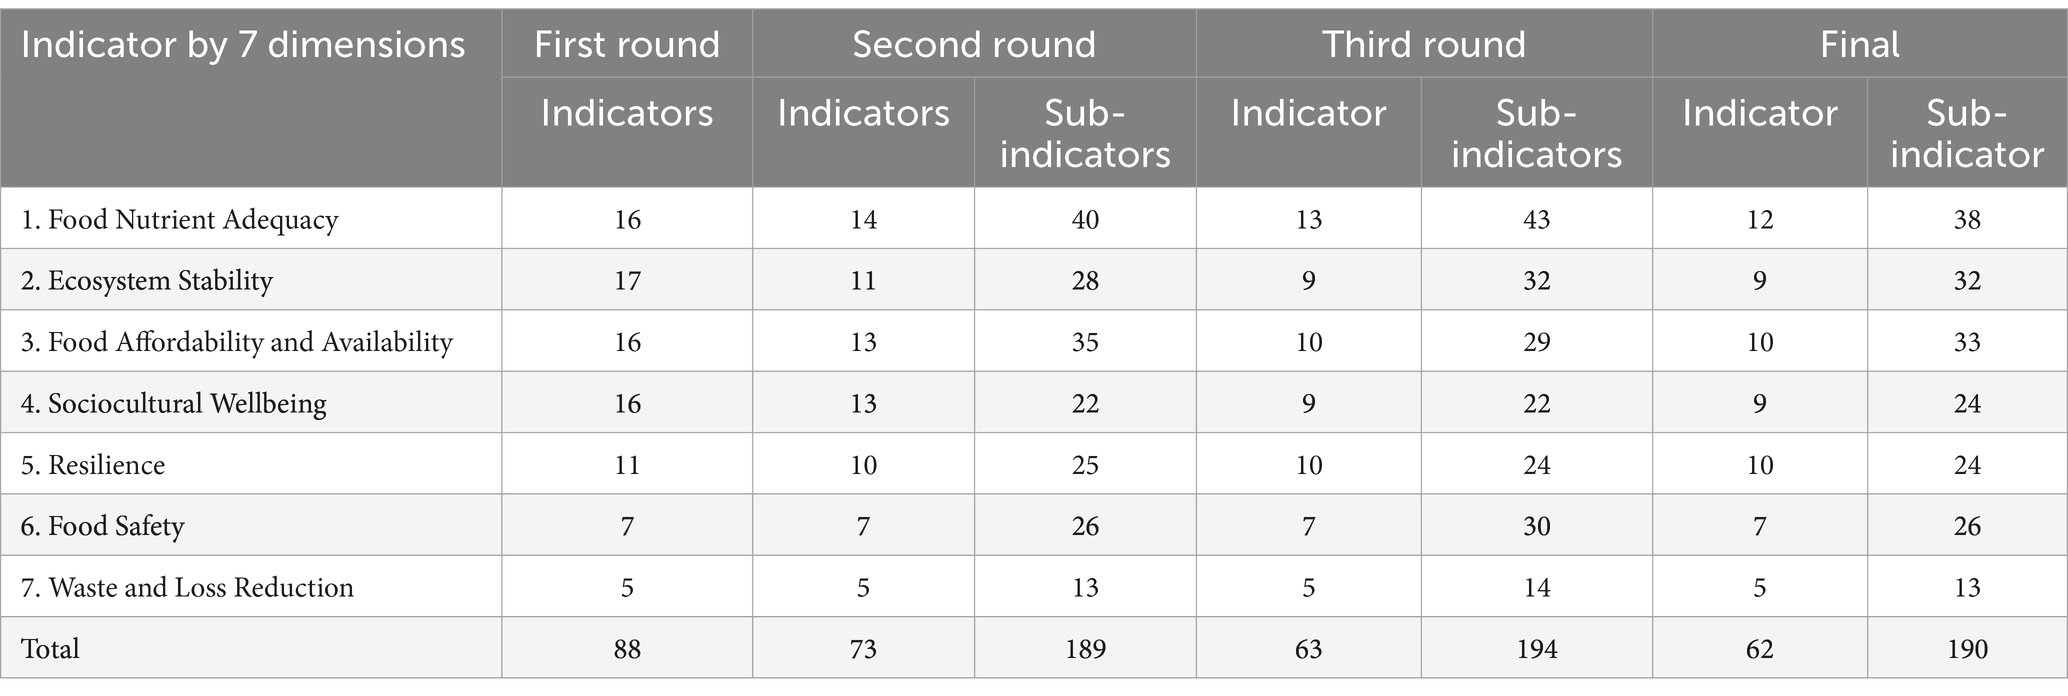
Table 2. Indicators and sub-indicators entering to round 1, 2 and 3 and final results, by seven dimensions.
At the first round of Delphi, 33 stakeholders rated all 88 indicators using IOC. The indicators with an average IOC below 0.5, indicating as irrelevant, were removed. At the research meeting, the three researchers thoroughly reviewed stakeholders’ comments and suggestions on whether the indicators should be removed, retained, revised, or additional indicators are needed. As a result, 15 indicators were removed from the first round. The remaining 73 indicators were sent out to stakeholders in the second round of Delphi (see Table 2).
We thoroughly considered stakeholders’ suggestions (see summary suggestions in Table 3 and suggestion of each indicator in Supplementary material 1) to concisely revise or add new indicators if all three researchers agreed. After we received certain indicators from the first round, we added sub-indicators illustrating the measurement into the questionnaire and sent it out in the second round of the Delphi process. All stakeholders in round 2 and 3 were asked to rate the IOC of sub-indicators using the same criteria (−1 not agree; 0 somewhat; 1 agree). The revision of indicators with sub-indicators was proposed in the next round of Delphi assessment.
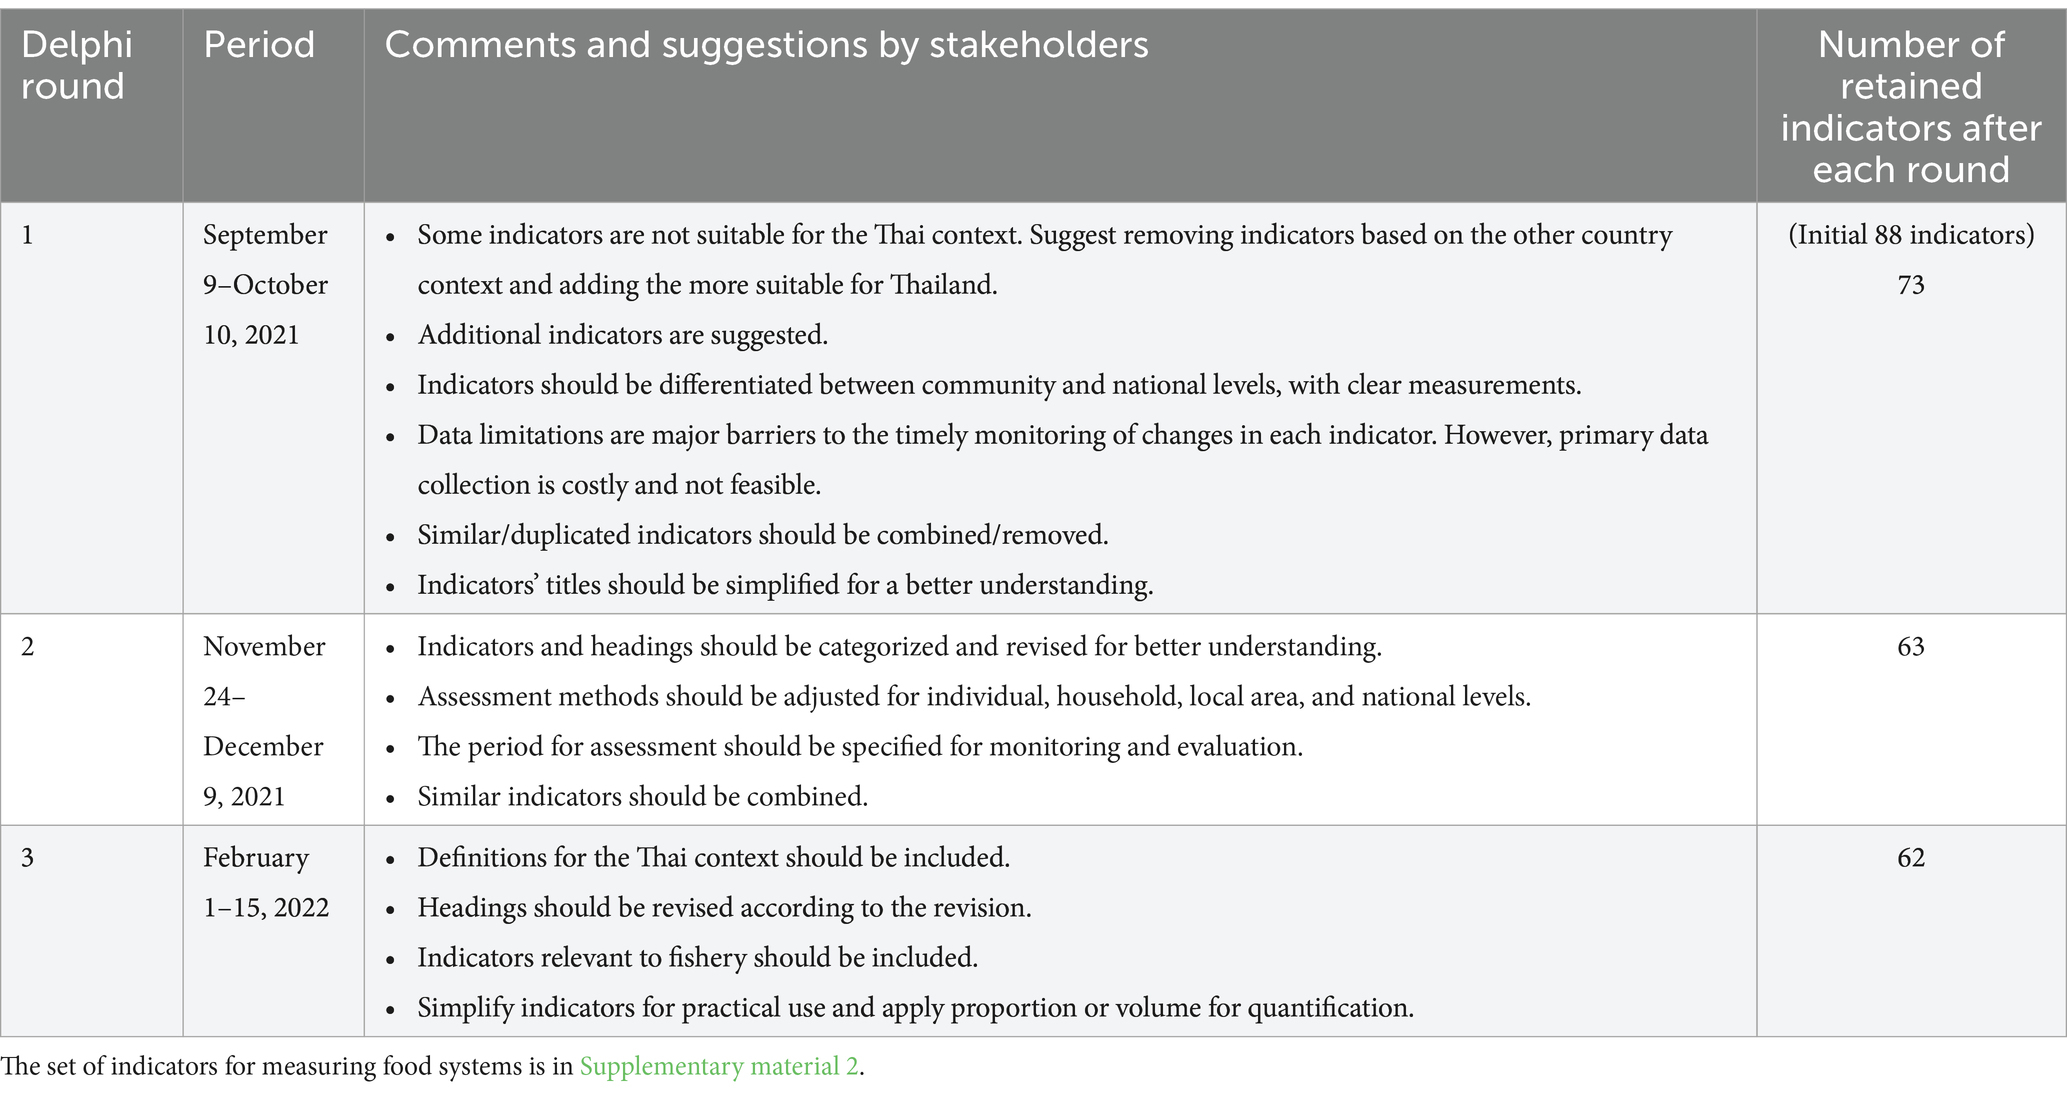
Table 3. Summary of suggestions and remaining number of indicators.
In the second round, three stakeholders could not participate for personal reasons; we recruited additional 15 stakeholders for replacement. Forty-five stakeholders provided Delphi assessment in the second round. In this round, stakeholders were asked to rate 189 sub-indicators and provide suggestions. With the same process of rating and considering the average IOC of sub-indicators (an average IOC less than 0.5) and suggestions, 10 indicators were removed (see summary suggestions in Table 3 and suggestion of each indicator in Supplementary material 1).
In the third round, the remaining 63 indicators with 194 sub-indicators were sent out to 38 stakeholders (seven stakeholders could not participate due to health conditions and personal reasons and that we decided no replacement). After the third round of Delphi’s research meeting, one indicator was removed, and the final 62 indicators with 190 sub-indicators were retained.
Postmail and email were the main communication channels with each stakeholder. They had at least 2 weeks to return documents at their convenience channels, typically by post mail and email.
3 Results
3.1 Developing the final set of indicators
At the research team meeting, we carefully reviewed the average IOC for each item together with comments made by stakeholders on whether to retain, remove or consider additional indicators for the subsequent round of Delphi assessment. In all three rounds of Delphi assessment, the indicators were dropped if the average IOC was less than 0.5. New indicators drawn from the literature were added to the next round with agreement by all three researchers. This similar process was applied until we concluded the third round. From 88 indicators entered in the first round, only 73 were inputs for the second round, and 62 indicators remained after the third round. Table 3 summarizes stakeholders’ suggestions and the number of retained indicators for each round. The detailed three-round Delphi method is shown in Supplementary material 1.
3.2 Stakeholders in three rounds of Delphi assessment
We invited stakeholders to the Delphi process. Thirty-three stakeholders participated in the first round and successfully provided Delphi results. Three stakeholders could not provide an assessment in the second round, so we recruited additional stakeholders from the food system-related agencies (see Supplementary material 3) who have expertise relevant to all seven dimensions when some stakeholders could not join in subsequent rounds. In addition to 30 out of 33 stakeholders from the first round who can participate, we successfully recruited additional 15 stakeholders to the second round; there were a total of 45 stakeholders who completed the second round. In the third round, 38 stakeholders successfully provided their assessments, respectively. The response rate in round one, two and three were 68.8% (33/48), 93.8% (45/48) and 79.1% (38/48) out of the total 48 stakeholders, respectively.
3.3 The final set of indicators
After the third round, we reached a final set of 62 indicators with 190 sub-indicators were classified by seven dimensions:
1. Food nutrient adequacy (12 indicators with 38 sub-indicators).
2. Ecosystem stability (9 indicators with 32 sub-indicators).
3. Food affordability and availability (10 indicators with 33 sub-indicators).
4. Sociocultural well-being (9 indicators with 24 sub-indicators).
5. Resilience or recovery (10 indicators with 24 sub-indicators).
6. Food safety (7 indicators with 26 sub-indicators).
7. Waste and loss reduction (5 indicators with 13 sub-indicators).
After three rounds of assessments, we found these 62 indicators relevant to Thailand food systems context and ensured data feasibility to compute indices for policy uses. Though they are distributed in all seven dimensions, we felt certain indicators were limited, for example, food safety and waste and loss reduction domains with 7 and 5 indicators, respectively. Further, we also felt that 62 indicators with 190 sub-indicators, though academically interesting, are too many for policy use; there is a need to prioritize further, as proposed in the Conclusion section. We plan to apply these 62 indicators for a larger field test, prioritize indicators, and assess the availability, quality and frequency of the survey dataset, as well as routine administrative data. Findings have fulfilled the objectives of this study in applying and prioritizing global indicators into Thailand food systems context.
3.4 Weighting indicators
Prioritizing seven dimensions of indicators helps policymakers to focus on the most impactful indicators. We asked stakeholders to evaluate the necessity of Thailand’s situation of each dimension and weigh them at each round of the Delphi method. Each stakeholder in each round was asked to score by giving weight for each of the seven dimensions to add up to 100. Scores of each of the seven dimensions were averaged from participants at each round and weighted to a total of 100. The same process was applied to all three rounds of Delphi. Then, we averaged these three round weights up to 100.
The weighting somehow represents the severity of the condition of Thailand’s food system from the perspectives of Delphi participants, as shown in Table 4. The sum of each dimension with weighting can present the food system’s holistic situation.
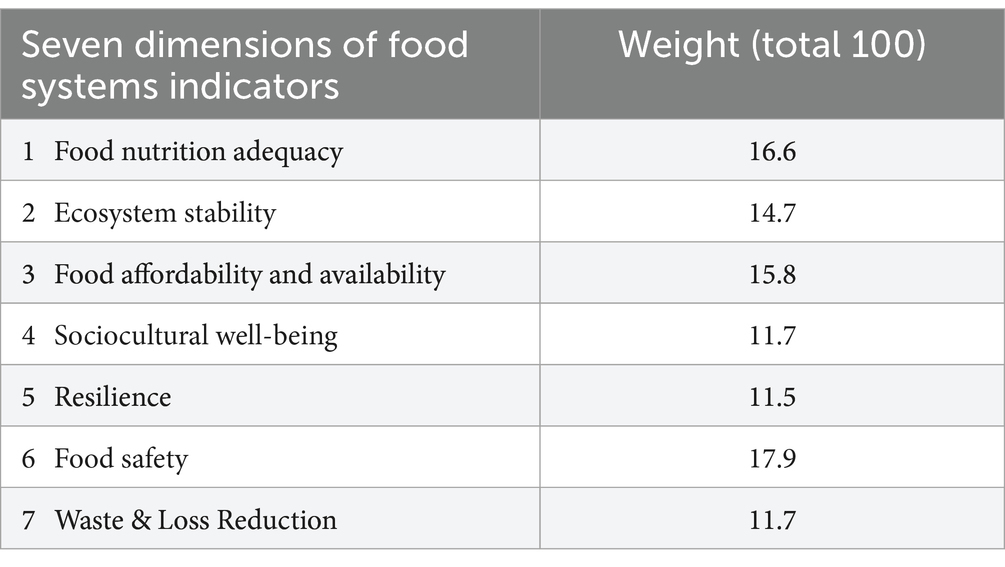
Table 4. Weight for indicators: results from three rounds of Delphi assessment.
From Delphi participants’ perspectives, the priority to improve the food system can be classified into group 1) critical dimensions with higher weight, including food safety (17.9 weight), food and nutrition adequacy (16.6), affordability and availability (15.8), and ecosystem stability (14.7), and group 2) essential dimensions with lower weight, including sociocultural well-being (11.7), waste & loss reduction (11.7), and resilience (11.5). Note that no dimension has a weight lower than 10, meaning none can be ignored. However, with resource limitations, higher-weight dimensions should be prioritized.
4 Discussion
This study is Thailand’s pioneer using valid and reliable protocols engaged with stakeholders’ participation that contributes to a set of indicators for monitoring progress toward a sustainable food system; it was developed to suit Thailand context as a tropical and upper-middle-income country with an export-led economy, with an application of Gustafson’s framework in seven dimensions covering the food supply chain from upstream to downstream and from local to national levels (Rittirong et al., 2022). After stakeholder and expert interviews, which shaped the framework and inform the design of Delphi surveys, the three-round Delphi method was conducted to seek various stakeholders’ independent views on the proposed indicators. The context in which these indicators were developed in 2021–2022, during which the COVID-19 pandemic, a significant public health emergency causing economic shock that affected food security, especially among the poor, also shaped the construct of indicators. Therefore, the exceptional virtue of this study is that stakeholders have witnessed and taken into account these unusual events that may happen in the future, especially food resilience among the poor.
This study also contributes to the weight of seven dimensions (see Table 4) based on country-specific context aiming to effectively guide the allocation of resources. Employing a composite index with a weighting scheme similar to the Global Food Security Index (GFSI) benchmarks holistic situations and facilitates policy analysis and public communication. The composite index amalgamates weighted sub-indicators into four key categories: Affordability (30%), Availability (25%), Quality and Safety (22.5%), and Sustainability and Adaptation (22.5%), collectively totaling 100 in a single indicator for a country (Economic Impact, 2022). However, it is crucial to interpret these weighted composite indices with caution due to their subjectivity to expert opinions, context-dependency, and susceptibility to misrepresentation to influence policy decisions (Chen et al., 2019). Alternatively, an equal-weight approach is recommended for monitoring and enhancing each indicator’s performance. Examples of this include the Sustainable Development Goal Index (SDG) and the RAND Food-Energy-Water Security Index (Venghaus and Dieken, 2019).
Prior to this study, various indicators related to the food system were available but for different purposes. Adopting them without adjudicating with the Thai context can be inappropriate; it can neither reflect the holistic situation at national and community levels nor be appropriate for policy to improve performance.
The Global Food Security Index reports the overall score for countries with four aspects: affordability, availability, quality and safety, and sustainability and adaptability. A country can be scored high even without actual implementation; such an index does not help identify policies and strategies for improvement (Economist Impact, 2022). Moreover, data sources used for the measurement of the global food security index are questionable. This study found that the City Region Food System Toolkit for Assessing and Planning Sustainable City Region Food Systems (Food and Agriculture Organization of the United Nations, 2018d) and country reports from Toronto (Miller and Blay-Palmer, 2018), Utrecht (Haenen et al., 2018), Colombo (Food and Agriculture Organization of the United Nations, 2018a), and Kitwe (Food and Agriculture Organization of the United Nations, 2018b) are useful for the initial stage of indicators development for sustainable food system. However, adaptation is needed for particular contexts, especially in terms of climate, agricultural landscape, and bureaucratic politics. INDDEX (International Dietary Data Expansion Project, 2021) focuses on diets and food security with technical and comprehensive methods. Thus, only practical techniques, such as food diversity, can be applied to data collection in the community. Indicators in other Asian countries like China focused on food consumption (Li et al., 2023) and national food safety standards (Wu et al., 2021), which do not cover the whole food supply chain.
With extensive reviews of available food system indicators, we selected and applied items that are applicable to the Thai context to fit with the Gustafson framework. Then, we deployed the three-round Delphi method—a common and reliable tool utilized widely for developing indicators and policy planning (Freitas et al., 2018; Tudisca et al., 2018; Musa et al., 2019; Bajo Marcos et al., 2023). With this method, we developed a food system indicator specific to Thailand.
Although key stakeholder interviews and those involved in the Delphi processes framed and contributed to the development of the Thai food system indicators, the indicators have not yet been tested to measure the status of the food system. They need to be tested with available datasets, and appropriate amendments are needed. Further, the final list of 62 indicators is far too large, where prioritization is needed for practical application, and aspirational indicators with no database backup are unrealistic and should be removed; otherwise, efforts should be made to develop and sustain a new database. For this purpose, the Thai Health Promotion Foundation is in the process of using our indicators for pilot testing in different settings across the country. If field tests successfully prioritize indicators, they will be submitted to the National Food Board for their consideration so that they can apply for regular monitoring and guide relevant local and national policies. Thus, further action research should include applying and evaluating these indicators for appropriate amendment.
A few challenges need to be addressed, especially where certain existing datasets are not publicly available and maximized their use for policy despite the fact that they are publicly funded surveys. This is hampered by a defensive bureaucratic mentality (Tangcharoensathien et al., 2010; van Panhuis et al., 2014). A Memorandum of Understanding (MOU) for sharing data, at least for most essential indicators and datasets, should be initiated among different government stakeholders and academia. This should be initiated by the National Food Board of Thailand.
Despite the usefulness of this study, a few limitations were identified. Firstly, we could not maintain the same stakeholders throughout the three rounds of the Delphi process. Additional 15 new stakeholders recruited from the same agencies with diverse expertise in the 7 dimensions participated in the second round. However, this may not introduce too much biases, as the replacements were from the same agencies and assessment criteria of availability of data is objective and requires no interpretation. Though this may somehow affect the reliability of the indicator assessment. Secondly, though the final list of 62 indicators and 190 sub-indicators is comprehensive, it is not a simple tool for monitoring Thailand’s food system. This set of indicators implies that it needs criteria (Aurino, 2014) to select minimum indicators to reflect the situation of the food system based on its ecological and agricultural characteristics in the targeted area. Therefore, an amendment to the food system indicators can be expected with recommendations for selecting core indicators. Our next project will apply these indicators the field testing and develop criteria for indicator selection to further prioritize for policy-friendly application.
5 Conclusion
A set of food system indicators was developed to measure the status of Thailand context-specific food systems, particularly at local and national levels, to inform policy for improvement and achieve sustainable food systems as committed by SDGs 2 in ending hunger, achieving food security and improved nutrition and promoting sustainable agriculture.
This set of indicators had been applied from the global indicators and framework in seven dimensions; data availability was assessed to suit Thailand’s food system. While this ensures Thailand’s food system indicators are internationally comparable, it also supports monitoring and informing policy interventions for sustainable food systems. These indicators offer a comprehensive quantitative status of the food system, support regular monitoring of trends and timely policy actions; for example, emerging impacts from climate changes and other unforeseen challenges. Additionally, publicly available indicators promote transparency and accountability by responsible government agencies.
Given the nature of connectedness of these indicators across seven dimensions, it promotes multi-stakeholder collaboration to achieve sustainable food systems in a holistic manner by improving sectoral performance with a shared common goal. These indicators are versatile and applicable to local and national level food system. Local implementation through community engagement, supported by training and technical assistance, enhances community resilience and resource management capabilities, empowers them to address challenges at the grassroots level.
Our ongoing work is to apply these 62 indicators for larger field testing, prioritize indicators, assess availability, quality and frequency of survey dataset and routine administrative data through full engagement by relevant stakeholders in this field. The context-specific food system indicators would guide policy to achieve sustainable food systems in Thailand.
Data availability statement
The original contributions presented in the study are included in the article/Supplementary material, further inquiries can be directed to the corresponding author.
Ethics statement
This research has been approved by the Institutional Review Board, Institute for Population and Social Research, Mahidol University (IPSR-IRB-2021-156), dated 29 July 2021.
Author contributions
JR: Conceptualization, Formal analysis, Funding acquisition, Methodology, Project administration, Resources, Supervision, Validation, Visualization, Writing – original draft, Writing – review & editing, Investigation. PC: Conceptualization, Formal analysis, Methodology, Validation, Writing – review & editing, Investigation. PN: Data curation, Formal analysis, Validation, Visualization, Writing – review & editing, Investigation, Project administration. SP: Writing – review & editing.
Funding
The author(s) declare that financial support was received for the research, authorship, and/or publication of this article. This research received funding from Thai Health Promotion Foundation [64–00234].
Conflict of interest
The authors declare that the research was conducted in the absence of any commercial or financial relationships that could be construed as a potential conflict of interest.
Publisher’s note
All claims expressed in this article are solely those of the authors and do not necessarily represent those of their affiliated organizations, or those of the publisher, the editors and the reviewers. Any product that may be evaluated in this article, or claim that may be made by its manufacturer, is not guaranteed or endorsed by the publisher.
Supplementary material
The Supplementary material for this article can be found online at: https://www.frontiersin.org/articles/10.3389/fsufs.2024.1367221/full#supplementary-material
References
Aurino, E. (2014). Selecting a Core set of indicators for monitoring global food security a methodological proposal. Rome, Italy: Food and Agriculture Organization of the United Nations.
Bajo Marcos, E., Ordóñez-Carabaño, Á., Rodríguez-Ventosa Herrera, E., and Serrano, I. (2023). Identifying the Core indicators of migrant and refugee Children’s integration using the Delphi method: a multi-input strategy for definition of consensus. Int J Qual Methods 22:16094069221149487. doi: 10.1177/16094069221149487
Bank of Thailand (2022). Value and quantity of exported products classified by production activities. Bangkok: Bank of Thailand.
Bureau of Agricultural Economics (2022). Statistics of trade in Thai agricultural products with foreign countries in 2021. Bangkok: Ministry of Agriculture and Cooperatives.
Bureau Of Promotion And Support Of Food Safety, M. O. P. H (2019). Food safety situation report, fiscal year 2010–2017. Nonthaburi: Office of the Permanent Secretary, Ministry of Public Health.
Business Prachachat . (2020a). Covid-19 exacerbates food insecurity, 265 million people at risk of starvation this year [updated 21 May. Business Prachachat. Available: https://www.prachachat.net/d-life/news-467756 [Accessed 2022].
Business Prachachat . (2020b). Food security in Thailand: worrying or not in a situation where the world is at risk of scarcity in 2020. Business Prachachat. Available: https://www.prachachat.net/d-life/news-472768 [Accessed June 2 2022].
Chaudhary, A., Gustafson, D., and Mathys, A. (2018). Multi-indicator sustainability assessment of global food systems. Nat. Commun. 9:848. doi: 10.1038/s41467-018-03308-7
Chen, P.-C., Yu, M.-M., Shih, J.-C., Chang, C.-C., and Hsu, S.-H. (2019). A reassessment of the global food security index by using a hierarchical data envelopment analysis approach. Eur. J. Oper. Res. 272, 687–698. doi: 10.1016/j.ejor.2018.06.045
Leknoi, U. (2019). Disaster situation and trend 2019 Bangkok: center for knowledge linkage and disaster innovation research, social research institute. Chulalongkorn University. 4–6.
Economist Impact . (2022). Global food security index: Thailand. Available: https://impact.economist.com/sustainability/project/food-security-index/explore-countries/thailand [Accessed].
Food and Agriculture Organization of the United Nations (2018a). Assessment and Planning City region food system: Colombo Sri Lanka synthesis report. Rome: Food and Agriculture Organization of the United Nations, Research Program on Water, Land, and Ecosystems, International Water Management Institute, and Ruaf Foundation.
Food and Agriculture Organization of the United Nations (2018b). Assessment and Planning City region food system: Kitwe Zambia synthesis report. Rome: Food and Agriculture Organization of the United Nations and Ruaf Foundation.
Food and Agriculture Organization of the United Nations (2018c). Assessment and planning of the Kitwe (Zambia) City region food system. Rome: Food and Agriculture Organization of the United Nations.
Food and Agriculture Organization of the United Nations (2018d). City region food system toolkit: Assessing and planning sustainable city region food systems. Rome: Food and Agriculture Organization of the United Nations and Ruaf Foundation and Wilfrid Laurier University, Centre for Sustainable Food Systems.
Food and Agriculture Organization of the United Nations (2018e). Sustainable food system: concept and framework. Nations, F. A. A. O. O. T. U. (ed.) https://www.fao.org/sustainable-food-value-chains/en/. Food and Agriculture Organization of the United Nations.
Food and Agriculture Organization of the United Nations (2022). Trade of agricultural commodities 2000–2020. UN: Food and Agriculture Organization of the United Nations.
Freitas, Â., Santana, P., Oliveira, M. D., Almendra, R., Bana Costa, J. C., and Bana Costa, C. A. (2018). Indicators for evaluating European population health: a Delphi selection process. BMC Public Health 18, 1–20. doi: 10.1186/s12889-018-5463-0
Grosso, G., Mateo, A., Rangelov, N., Buzeti, T., and Birt, C. (2020). Nutrition in the context of the sustainable development goals. Eur. J. Pub. Health 30, i19–i23. doi: 10.1093/eurpub/ckaa034
Gustafson, D., Gutman, A., Leet, W., Drewnowski, A., Fanzo, J., and Ingram, J. (2016). Seven food system metrics of sustainable nutrition security. Sustain. For. 8, 1–17. doi: 10.3390/su8030196
Haenen, I., Renting, H., Dubbeling, M., and Hoekstra, F. (2018). Assessment and planning of the Utrecht City region food system. Leusden, The Netherlands: Ruaf Foundation, Leusden, The Netherlands.
International Dietary Data Expansion Project . (2021). Data4Diets: food security indicators [online]. Available: https://inddex.nutrition.tufts.edu/sites/default/files/Data4Diets%20Entire%20Framework.pdf [Accessed February 26 2021].
Li, Y., Filimonau, V., Wang, L.-E., and Cheng, S. (2023). A set of preliminary indicators for holistic sustainability assessment of household food consumption in rural and urban China. Resour. Conserv. Recycl. 188:106727. doi: 10.1016/j.resconrec.2022.106727
Miller, S., and Blay-Palmer, A. (2018). Assessment and planning of the Toronto City region food system. Toronto, Canada: Ruaf Foundation and Wilfrid Laurier University, Centre for Sustainable Food Systems and the Food and Agriculture Organization of the United Nations.
Musa, H. D., Yacob, M. R., and Abdullah, A. M. (2019). Delphi exploration of subjective well-being indicators for strategic urban planning towards sustainable development in Malaysia. J. Urban Manag. 8, 28–41. doi: 10.1016/j.jum.2018.08.001
National Statistical Office (2020a). Household socio-economic survey 2019. Bangkok: National Statistical Office.
National Statistical Office (2020b). Multiple Indicator cluster survey 2019. Bangkok, Thailand: Unicef.
Office of the Consumer Protection Board . (2021). Food security: Food crisis amid the Covid-19 pandemic 2021. Office of the Consumer Protection Board,. Available: https://www.scbeic.com/th/detail/product/7400 [Accessed 2022].
Rittirong, J., Chuenglertsiri, P., Phulkerd, S., and Nitnara, P. (2022). 7-dimensional food system indicators. Nakhorn Pathom, Thailand: Institute for Population and Social Research, Mahidol University.
Tangcharoensathien, V., Boonperm, J., and Jongudomsuk, P. (2010). Sharing health data: developing country perspectives. Bull. World Health Organ. 88, 468–469. doi: 10.2471/BLT.10.079129
Thaipan . (2020). Comparison of pesticide residues in imported and domestic fruits and vegetables equally bad in 2020. Thaipan. Available: https://thaipan.org/data/2333 [Accessed 2022].
Tudisca, V., Valente, A., Castellani, T., Stahl, T., Sandu, P., Dulf, D., et al. (2018). Development of measurable indicators to enhance public health evidence-informed policy-making. Health Res. Policy Syst. 16, 1–13. doi: 10.1186/s12961-018-0323-z
Turner, R. C., and Carlson, L. (2003). Indexes of item-objective congruence for multidimensional items. Int. J. Test. 3, 163–171. doi: 10.1207/S15327574IJT0302_5
Van Panhuis, W. G., Paul, P., Emerson, C., Grefenstette, J., Wilder, R., Herbst, A. J., et al. (2014). A systematic review of barriers to data sharing in public health. BMC Public Health 14:1144. doi: 10.1186/1471-2458-14-1144
Venghaus, S., and Dieken, S. (2019). From a few security indices to the few security index: consistency in global food, energy and water security assessment. Sustain. Product. Consump. 20, 342–355. doi: 10.1016/j.spc.2019.08.002
Keywords: sustainable food system, indicator, food security, resilience, agriculture, Delphi method
Citation: Rittirong J, Chuenglertsiri P, Nitnara P and Phulkerd S (2024) Developing key indicators for sustainable food system: a comprehensive application of stakeholder consultations and Delphi method. Front. Sustain. Food Syst. 8:1367221. doi: 10.3389/fsufs.2024.1367221
Edited by:
Gabrielle Roesch-McNally, American Farmland Trust, United StatesReviewed by:
Barbara Sawicka, University of Life Sciences of Lublin, PolandKevan W. Lamm, University of Georgia, United States
Copyright © 2024 Rittirong, Chuenglertsiri, Nitnara and Phulkerd. This is an open-access article distributed under the terms of the Creative Commons Attribution License (CC BY). The use, distribution or reproduction in other forums is permitted, provided the original author(s) and the copyright owner(s) are credited and that the original publication in this journal is cited, in accordance with accepted academic practice. No use, distribution or reproduction is permitted which does not comply with these terms.
*Correspondence: Jongjit Rittirong, am9uZ2ppdC5yaXRAbWFoaWRvbC5lZHU=