Abstract
Introduction:
Enhancing cost efficiency and minimizing production expenses are pivotal for the long-term sustainability of China’s rapeseed industry. This study takes a comprehensive approach by integrating the Cobb–Douglas production function model with an advanced cost function model to empirically assess the influence of farm operation scale on the cost efficiency of rapeseed cultivation. Results reveal a non-linear relationship between the scale of operation and the average cost per mu: as the operational scale expanded, the average cost per mu initially decreased, then increased. Furthermore, economies of scale exhibit regional and topographical heterogeneity.
Methods:
Drawing on a robust dataset from 3,144 farmers across 14 key rapeseed-producing provinces in China, spanning from 2018 to 2021, our analysis uncovers a nuanced relationship between operational scale and production costs.
Results and discussion:
The findings indicate that as the scale of operation increases, the unit production cost initially declines, reaching a critical threshold before rising again, reflecting shifts in the production cost structure. This pattern is mirrored in the average cost efficiency loss per kilogram of rapeseed, which also shows an initial decrease followed by a subsequent increase. An analysis of regional heterogeneity reveals that in the eastern plains, the expansion of farm scale effectively curtails the excessive use of labor and seed inputs, leading to greater cost efficiency. Moreover, the findings also reveal that cost efficiency losses are consistently lower in the eastern regions compared to their central and western counterparts, and similarly, plains regions outperform non-plains regions in terms of cost efficiency. These insights offer valuable implications for policymakers and agricultural stakeholders aiming to optimize production practices and enhance the economic sustainability of rapeseed farming in China.
1 Introduction
Rapeseed is the most important oilseed crop in China, and its robust development is crucial for ensuring the security of the country’s edible vegetable oil supply (Li et al., 2022; Xiao et al., 2022). Recognizing this, the Chinese government has emphasized rapeseed production, proposing strategic initiatives to vigorously develop and utilize winter fallow fields for rapeseed cultivation and to enhance rapeseed production capacity (Shah and Wu, 2019). Despite these efforts, domestic production costs for rapeseed in China have remained high in recent years, leading to a significant price inversion. This has resulted in concurrent increases in both total domestic rapeseed production and imports (Sheng and Song, 2018). The influx of imported rapeseed and rapeseed oil has consequently eroded domestic market share, severely impacting the competitiveness of China’s rapeseed industry and diminishing farmers’ incentives to cultivate the crop (Liang et al., 2023). Therefore, effectively reducing production costs is critical for the sustainable development of the Chinese rapeseed industry.
Cost efficiency entails achieving a specific level of output using the minimal combination of costly inputs (e.g., labor, capital) given prevailing price and technological conditions (Walters, 1963; Ferrier and Lovell, 1990). It encompasses both technical efficiency and the cost of input factors (Tingley et al., 2005). However, China’s rapeseed production has long suffered significant cost efficiency losses, undermining its international competitiveness (Naylor and Higgins, 2017; Zhang et al., 2022). Addressing the reduction of cost efficiency loss and enhancing the cost efficiency of rapeseed production has thus become a pivotal focus for the industry’s development. This study aims to analyze the impact of farm operation scale expansion on the cost efficiency of rapeseed at the farmer level, with findings that may offer valuable insights for the sustainable production of rapeseed in other developing countries.
The relationship between the scale of agricultural households and the cost of agricultural production is a widely debated topic in academia, with mixed results reported in the literature. Some studies suggest that the cost curve of farmers exhibits an “L-shaped” trend, indicating that small-scale farmers can achieve economies of scale by expanding their operations, while large-scale farmers have limited incentives to further reduce costs through expansion (Hall and LeVeen, 1978; Alvarez and Carlos, 2003; Sumner, 2014). This phenomenon arises from two main sources of economies of scale. Internally, the expansion of operational land, proportionate changes in factor inputs, and the consolidation of fragmented land contribute to cost reductions. Externally, market agglomeration, industrial linkages, and public facilities also play a role in achieving economies of scale (Chavas et al., 2010; Cai and Li, 1990; Xu et al., 2011).
Several factors contribute to the decline in average unit costs. Firstly, the indivisibility of certain fixed assets, such as seeders, harvesters, and agro-processing equipment, means that as the scale of operations increases, the per-unit cost of these inputs decreases (Sims and Kienzle, 2016). Additionally, large-scale enterprises benefit from bulk purchasing, which provides discounts and enhances bargaining power, thereby reducing average costs (Alvarez and Carlos, 2003). Furthermore, large-scale operations enjoy lower capital costs, more efficient resource utilization, and better risk management capabilities (Avillez, 2011). Banks are also more willing to extend credit to large-scale farmers, enabling them to invest in technology and achieve economies of scale (Tweeten et al., 2002).
Compared to the United States, China’s agricultural sector is characterized by land-intensive production, and the inefficiencies in factor markets exacerbate the challenge of reducing production costs without expanding the scale of land use. Besides advancing productivity through scientific and technological innovations (Huang and Ma, 2000), expanding land operation scales is critical to addressing these challenges. This issue has attracted considerable academic attention. For instance, He and Feng (2012) explored economies of scale in rapeseed production, revealing through empirical analysis that expanding the production scale significantly reduces per-unit production costs. Similarly, Li et al. (2015) found that once the operational scale exceeds 80 mu, the total cost per unit of production declines.
In contrast, some scholars argue that expanding the scale of operations does not necessarily lead to lower unit costs. For instance, Zhang et al. (2017) found a “U-shaped” relationship between the unit cost of rice production and planting scale in Jiangsu Province, where costs initially decrease with scale but begin to rise beyond a certain threshold. Similarly, Xu et al. (2011) noted diminishing returns to scale in the production of various crops in China, suggesting that large-scale operations do not always reduce unit costs. Liang et al. (2020) highlighted the challenges of achieving economies of scale due to land fragmentation, which complicates the expansion of operational scale. Xu et al. (2024) found that the plot-level “size-yield” relationship was “inverted U-shaped” for both rice and maize, but the farmer-level “size-yield” relationship was “inverted U-shaped” for rice and “U-shaped” for maize. The “scale-yield” relationship at the farm level was found to be “inverted U-shaped” for rice and “U-shaped” for maize. Zheng et al. (2024) found that the size-productivity relationship of Chinese farmers has moved or is moving towards an inverted U-shaped relationship, with either too large or too small a land operation scale being detrimental to productivity.
Efficiency losses significantly impact farmers’ ability to compete in the market. Studies in the U.S. dairy industry demonstrate that large-scale farms are generally more efficient, leading to the exit of inefficient small-scale farms and the survival of efficient large-scale operations (Tauer, 2001; Álvarez et al., 2008; Dong et al., 2013). Wu and Prato (2006) used stochastic frontier methodology to show that inefficiencies in diversified and specialized farms in Missouri are linked to inappropriate scale and input misallocation. Maietta (2000) found that cost inefficiencies accounted for 69% of total costs, with technical inefficiencies being the primary driver. However, Mosheim and Lovell (2009) observed that both technical and allocative inefficiency losses decrease with scale, but allocative inefficiencies are more costly. If the impact of efficiency loss on production cost of different scale farmers can be analysed from different dimensions, then the space for agricultural growth can be estimated without increasing factor inputs through appropriate policy design and land system reform (Lau and Yotopoulos, 1971; Yotopoulos and Lau, 1973; Ye et al., 2023).
Although economies of scale have been widely studied, three limitations remain: Firstly the academic community has not reached a consensus on the relationship between the scale of agricultural operations and production costs, necessitating further systematic and multidimensional analysis. Key questions include how changes in scale affect the cost structure of rapeseed production, whether high production costs are due to inefficient input use, and how scale impacts efficiency losses. Secondly,most studies use the standard stochastic frontier cost function model to explore the cost structure problem. But cannot address the impact of external factors such as climate change. Thirdly, most existing studies rely on macro-level data, overlooking the heterogeneity among individual farmers and regions.
This study aims to contribute to the literature by employing the Cobb–Douglas production function to assess the marginal value of inputs, using an improved cost function model to disaggregate production costs, and investigating the heterogeneity of scale effects on rapeseed production costs. These findings hold significant theoretical and practical implications for promoting scale operations and sustainable development in China’s rapeseed industry.
2 Materials and methods
2.1 Model and variables
2.1.1 Rapeseed production function model
Since the rural reform in 1978, the growth of China’s total agricultural output value cannot be separated from the increase of agricultural productivity and the increase of the input of production factors (Wu, 2000; Gong, 2022). However, China’s agricultural production is faced with the constraint of more people and less land. Farmers overcome the scarcity of land resources by increasing labor input (Carter, 2011), which leads to the serious excessive use of fertilizer but low efficiency in China (Wu, 2011; Chen, 2015; Zhang and Luo, 2022). Excessive costs may be related to improper allocation of related elements resulting to excessive use of some elements.
In addition, this paper decomposed the intermediate inputs, mainly including chemical fertilizer, agricultural machinery, pesticides, seeds and other (Gong, 2018). From 2018 to 2021, the pesticide and energy data of micro farmers had more missing values, and the standards were not unified (Zhang et al., 2017). In addition to labor and land, this paper will only include the three most important intermediate inputs of fertilizer, agricultural machinery and seeds. These five elements are also the most applied inputs in Chinese agricultural productivity research (Kalirajan et al., 1996; Chen, 2006; Wang et al., 2010; Zhou and Zhang, 2013). Combined with previous studies (Chari et al., 2021; Adamopoulos et al., 2022), the Cobb–Douglas (C-D) production function has significant practical rationality in the study of Chinese agricultural economics, despite the fact that it sets strong constraints on the factor elasticity of substitution (constant at 1) and technology-neutral progress. In conclusion, this paper will measure whether the factor is overused by the ratio of the marginal product value of the factor to the factor price. The marginal product value of the element can be calculated by the production function, such as Equation (1):
In Equation (1), Yi is the rapeseed output level of the i farmer; fert, machi, land, labor and seed represent the inputs of fertilizer, machinery, land, labor, and seed elements, respectively.
2.1.2 Improved cost function model
The econometric model used in this paper originates from the stochastic front production function model (Aigner et al., 1977). According to the needs of the research topic, the stochastic front cost function model will be used for the analysis. The standard stochastic forward cost function model is as follows:
In Equation 2, y is the output level, w is the price of factors of production, and x is the quantity of factors of production input.
To decompose the cost, this paper uses the method of to Tauer and Mishra (2006) construct the cost function and efficiency parameters as functions of land scale. At the same time, the difference in the factor price of farmers in different regions is measured by regional virtual variables. Therefore, the improved cost function model has two advantages. On the one hand, exogenous land scale variables are used to replace output variables, which can address the influence of external factors such as climate change. On the other hand, according to the research of Tauer and Mishra (2006), we will adopt the index of business scale. The measurement model in this paper is as follows:
In Equation 3, is the cost of rape per 100 kg of rapeseed of the i farmer is expressed, is the land scale of the i rapeseed farmer is expressed. represent the random error parameter and efficiency loss parameter of the i farmer are expressed respectively, and the efficiency loss parameter is further expressed as:
The random error parameter follows the standard normal distribution, which is , the efficiency loss parameter in Equation 4 follows a semi-normal distribution, which is . For specific functional forms, this paper selects quadratic functional shapes and logarithmic forms, namely:
Finally, we use the method of Tauer and Mishra (2006) to operate on Equations 5, 6, respectively, and choose the model with the smaller of as the final model.
2.2 Data collection
The data utilized in this study were derived from the micro-farmer dataset of the National Rapeseed Industry Technology System of China, covering the years 2018 to 2021. This dataset comprises 3,208 farm household samples across 14 provinces and 87 counties. The survey provinces were selected based on the research methodology proposed by Wang (2020). The data generation process involved three steps: first, three counties within the jurisdiction of the integrated experimental station were randomly chosen; second, three villages within each sample county were randomly selected; third, three rapeseed growers from each sample village were randomly selected as sample households. The survey obtained data in accordance with the stratified random sampling method, and the investigators went deep into the countryside, combining field visits to the fields, centralized talks and door-to-door visits, and the descriptive statistics showed that the values of the core variables in the sample data were relatively similar to the national values in the macro statistics, reflecting the good representativeness of the data source. The distribution of the study area is shown in Figure 1.
Figure 1
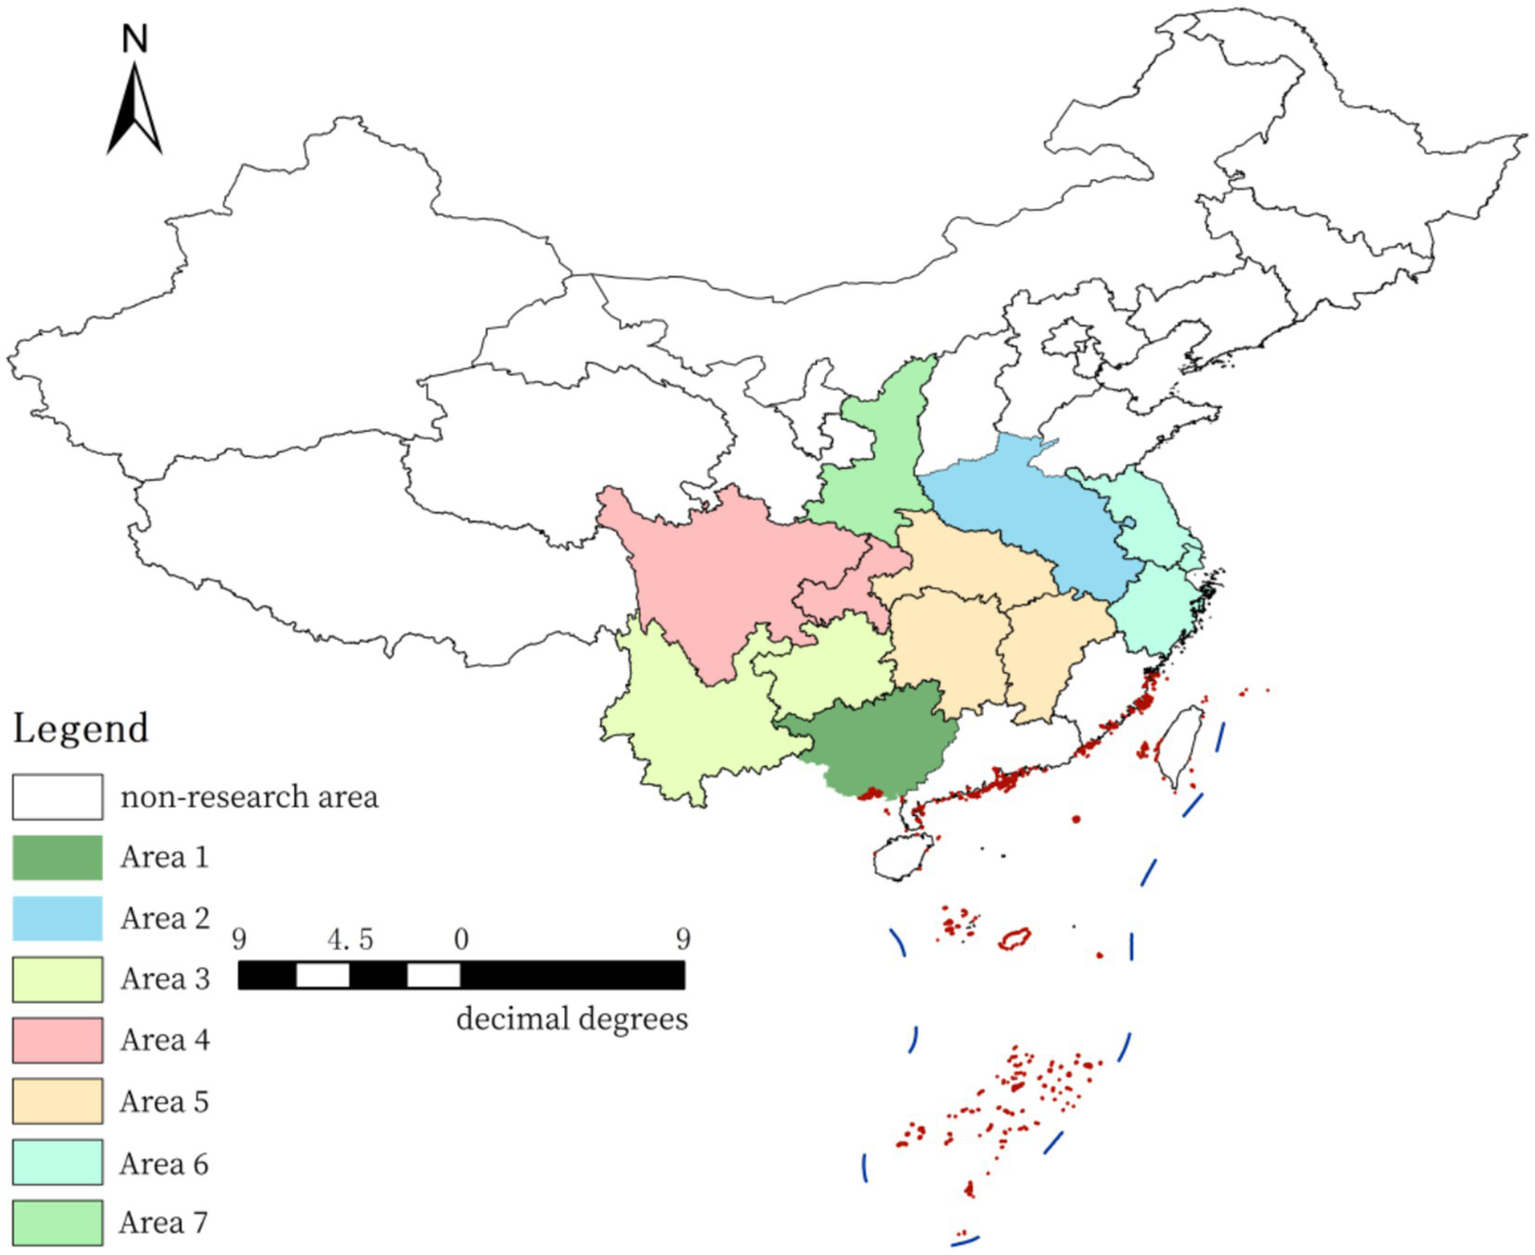
Distribution map of the main winter rapeseed producing areas in china Area 1: South China coastal winter rapeseed production area, including Guangxi. Area 2: Huanghuai Plain winter rapeseed production area, including Anhui and Henan. Area 3: Yunnan-Guizhou Plateau winter rapeseed production area, including Yunnan and Guizhou. Area 4: Sichuan Basin winter rapeseed production area, including Sichuan, Chongqing. Area 5: winter rapeseed production area in the middle reaches of Yangtze River, including Hubei, Hunan and Jiangxi. Area 6: winter rapeseed production area in the lower reaches of the Yangtze River, including Zhejiang, Jiangsu and Shanghai. Area 7: Loess Plateau winter rapeseed production area, including Shaanxi.
Once established, the sample households remained consistent across subsequent survey rounds. If a sample household was lost due to force majeure events (e.g., death, relocation), similar growers from the same village were selected based on key characteristic indicators to maintain sample stability. The questionnaire surveys were conducted by the staff of the integrated experimental station for rapeseed, who have extensive experience in the rapeseed industry and have established robust communication mechanisms with growers through long-term engagement in the sector. The surveys were carried out during the rapeseed harvest period, enabling farmers to provide accurate data. This approach ensures the validity and representativeness of the dataset from fixed observation points. Following the requirements of the empirical study, 64 farmers who did not cultivate rapeseed in a given year were excluded, resulting in an effective sample size of 3,144 farmers.
2.3 Descriptive statistics of variables
Table 1 presents the descriptive statistics of the primary variables in this study. The data reveal changes in the cost structure of rapeseed production and the prices of factor inputs. Notably, the seed input costs per 100 kg of rapeseed have decreased, likely due to the centralized procurement by large-scale households. Fertilizer input costs dropped from 92.43 Yuan per 100 kg in 2018 to 69.45 Yuan per 100 kg, reflecting the impact of the national “double carbon” target and the “fertilizer reduction” policy (Liu et al., 2024; Li et al., 2024).
Table 1
| Variable index | 2018 | 2019 | 2020 | 2021 | ||||
|---|---|---|---|---|---|---|---|---|
| Average value | Standard deviation | Average value | Standard deviation | Average value | Standard deviation | Average value | Standard deviation | |
| Rapeseed output (kg) | ||||||||
| output | 1109.96 | 4305.37 | 1172.73 | 4379.98 | 2885.48 | 9359.11 | 3373.80 | 12160.69 |
| Production cost per 100 kg of rape | ||||||||
| Material and service charges (yuan) | ||||||||
| Seed into | 13.59 | 13.23 | 19.41 | 13.86 | 12.80 | 22.05 | 12.72 | 12.56 |
| Fertilizer input | 92.43 | 106.19 | 115.94 | 50.42 | 66.35 | 74.78 | 69.45 | 44.06 |
| Mechanical operation fee | 41.01 | 53.62 | 55.84 | 52.97 | 39.59 | 42.84 | 45.31 | 76.66 |
| Labor cost (yuan) | ||||||||
| Family employment discount | 481.68 | 452.93 | 571.32 | 328.12 | 311.98 | 325.24 | 358.95 | 498.29 |
| Cost of employment | 4.32 | 28.73 | 7.58 | 27.57 | 7.81 | 53.19 | 6.32 | 33.50 |
| Land cost (yuan) | ||||||||
| Rentals from the transfer site | 21.48 | 43.40 | 35.87 | 56.25 | 26.58 | 51.19 | 27.93 | 51.30 |
| Fold rent from camp | 96.61 | 86.64 | 124.44 | 84.15 | 70.14 | 85.76 | 73.88 | 101.30 |
| Input factor price (yuan/kg, yuan/mu, yuan day) | ||||||||
| Seed price | 99.41 | 89.91 | 73.14 | 75.07 | 80.21 | 200.49 | 87.39 | 241.19 |
| Fertilizer price | 3.35 | 3.19 | 2.86 | 3.47 | 3.21 | 30.20 | 2.22 | 1.22 |
| Mechanical operation price | 58.05 | 73.78 | 92.21 | 635.23 | 53.33 | 52.57 | 177.45 | 3461.94 |
| Local agricultural labor prices | 104.34 | 23.08 | 98.45 | 22.53 | 87.34 | 23.21 | 94.17 | 23.88 |
| Local circulation price | 500.76 | 280.06 | 446.76 | 246.34 | 386.16 | 239.00 | 401.56 | 251.10 |
Descriptive statistical results for the main variables.
The cost data in the table is based on 2018, and the price index of agricultural production means is used for the decrease.
Mechanical operation costs have risen, attributed to the increasing mechanization of rapeseed production, the promotion of high-efficiency cultivation techniques for machine planting and harvesting, and pandemic-related factors (Zhang et al., 2021). Labor costs exhibit a mixed trend; while household labor costs have decreased, the cost of hiring labor has increased, resulting in an overall decline in labor costs. This trend aligns with findings from related studies. Liu et al. (2014) also noted a strong substitution elasticity between machinery and labor inputs, irrespective of the machinery type.
Regarding land costs, the acceleration of land transfers has led large rapeseed growers to expand their operations by leasing land. Consequently, the cost of self-operated land rent has decreased, whereas the rent for transferred land has increased. As the scale of operations expands, rapeseed growers gain stronger market bargaining power, causing seed and fertilizer prices to decline. Conversely, with the rising mechanization rate, the cost of mechanical operations has increased, substituting labor costs (Ji and Zhong, 2013). Local labor and land transfer prices have remained relatively stable.
3 Empirical results
3.1 Results of the rapeseed production function
Table 2 presents the regression results of the rapeseed production function. The regression coefficients of each input factor in the Cobb–Douglas production function indicate its output elasticity. Analysis of the sample data reveals that land factors exhibit the highest output elasticity. The output elasticity of labor and fertilizer is also substantial and aligns with expectations, following closely behind land.
Table 2
| Variable | Coefficient | Standard error |
|---|---|---|
| Land | 0.648*** | 0.054 |
| Labor force | 0.283*** | 0.038 |
| Machinery | 0.029*** | 0.008 |
| Seed | 0.048*** | 0.015 |
| Chemical fertilizer | 0.178*** | 0.032 |
| constant | 2.146*** | 0.210 |
| N | 3,144 | |
| R2 | 0.7162 | |
Results of rapeseed production function regression.
*** indicates significant at the 1% level.
The prominent output elasticity of labor and fertilizer can be attributed to two main factors. Firstly, the mechanization rate of rapeseed production in China remains relatively low, necessitating significant labor investment across various stages of the production process. Secondly, the accelerated urbanization in China has led to a substantial migration of rural labor to urban areas, contributing to a steady increase in agricultural labor costs. Consequently, rapeseed farmers are more inclined to use chemical fertilizers as a substitute for labor inputs to mitigate rising labor costs.
This trend underscores the critical role of land and labor in rapeseed production and highlights the need for policies that enhance mechanization and optimize input use to improve productivity and sustainability in the sector.
Table 2 presents the regression results of the rapeseed production function. The regression coefficients of each input factor in the Cobb–Douglas production function denote their output elasticity. Analysis of the sample data reveals that all input factors are statistically significant, indicating a significant relationship between each variable and yield.
The sum of the input factor coefficients, which represents the scale reward parameter, is greater than 1. This suggests that there is an incremental phenomenon of scale reward for the sample farmers under current conditions (Li et al., 2015; Hayami and Ruttan, 1985; Feder et al., 1992; Su and Wang, 2002). It also indicates that there is no loss of scale efficiency, implying that the efficiency losses of farmers primarily stem from technical efficiency and allocative efficiency losses (Xu et al., 2011; Zhang et al., 2017).
To further explore the differences across various scales, the total sample was categorized based on the size of the business scale. Specifically, farmers were divided into two groups: those with less than 20 mu and those with 20 mu or more. This classification is justified by several factors. Firstly, the characteristics of winter rapeseed production and its primary cultivation in the Yangtze River Basin, where the planting area is generally smaller than that of rice, were considered. Secondly, the classification standards set by the China Development and Reform Commission (CDRC) for large-scale rapeseed farmers in the south were referenced. The results of this classification are shown in Table 3.
Table 3
| Variable | Full sample | Below 20 mu | More than 20 mu |
|---|---|---|---|
| Land | 0.648***(0.054) | 0.848***(0.054) | 0.457**(0.209) |
| Labor force | 0.283***(0.038) | 0.274***(0.031) | 0.273**(0.132) |
| Machinery | 0.0293***(0.008) | 0.0298***(0.007) | −0.0637(0.045) |
| Seed | 0.0482***(0.015) | 0.0343**(0.015) | 0.0591*(0.033) |
| Chemical fertilizer | 0.178***(0.032) | 0.149***(0.030) | 0.422***(0.123) |
| Constant | 2.146***(0.210) | 2.170***(0.187) | 1.548(0.978) |
| N | 3,207 | 2,869 | 338 |
| R2 | 0.7162 | 0.6202 | 0.2948 |
Results of regression of rapeseed production function at different sizes.
*, **, and *** are significant at 10, 5 and 1%, respectively.
By refining the text to match the style of Nature, the focus is placed on clarity, precision, and the rationale behind the empirical findings, ensuring that the explanation is thorough and comprehensible.
Table 3 presents the regression coefficients of each input factor in the Cobb–Douglas (C-D) production function, representing their respective output elasticities. Analysis of the sample data indicates that the output elasticity of the land factor is the largest across all samples, including those below 20 mu and those above 20 mu. This underscores the significant role of land in the production process of rapeseed, aligning closely with the findings of Xu et al. (2011), Zhang and Zhou (2019) and Zhang et al. (2017).
The output elasticities of labor, seed, and fertilizer are consistent with expectations, with labor and fertilizer following closely behind land. This trend can be attributed to the high labor demands throughout rapeseed production in China and the rising cost of agricultural labor due to the rural-to-urban labor transfer. Consequently, as labor costs increase annually, rapeseed farmers are more inclined to substitute labor with chemical fertilizers.
Additionally, it is noteworthy that the coefficient for machinery use is negative for farmers with operations exceeding 20 mu, although this result is not statistically significant. This suggests that machinery use may reduce rapeseed yields for these larger farms. This outcome could be due to two primary reasons: firstly, the sample size of larger farmers (over 20 mu) might be insufficient to provide robust results. Secondly, there may be poor adaptability of mechanized harvesting in rapeseed production. Our research indicates that farmers often prefer manual harvesting due to the high loss rates associated with mechanical harvesting. This analysis highlights the critical role of land, labor, and fertilizer in rapeseed production, while also pointing to challenges with mechanization for larger-scale farms.
3.2 Measurement of input factor excess
This study assumes that the goal of rapeseed farmers is not to maximize yield but to maximize income. When market prices of rapeseed products and various input prices change, farmers can adjust their production behavior accordingly. In practice, they compare the income from rapeseed cultivation with the costs of inputs such as labor, land, fertilizers, and seeds. To analyze whether there is an excess of each input factor in rapeseed production in China, this paper utilizes the ratio of marginal product value to the price of fertilizer. The results are presented in Table 4.
Table 4
| Variable | Full sample | Below 20 mu | More than 20 mu | |
|---|---|---|---|---|
| Marginal product value | Land | 210.556 | 220.099 | 131.327 |
| Labor force | 41.895 | 20.273 | 221.397 | |
| Machinery | / | 0.155 | / | |
| Seed | 57.502 | 45.437 | 157.659 | |
| Chemical fertilizer | 1.783 | 1.055 | 7.679 | |
| Factor price | Land | 150.299 | 154.147 | 118.361 |
| Labor force | 95.960 | 95.547 | 99.390 | |
| Machinery | 95.631 | 95.442 | 97.196 | |
| Seed | 85.496 | 83.816 | 99.444 | |
| Chemical fertilizer | 4.633 | 2.578 | 8.358 |
Marginal product value and factor price of each factor of production.
Marginal product value and factor price units are: yuan / unit. That is, land is measured in yuan / mu; labor in yuan / workday; machinery in yuan / mu; seed in yuan / kg; and fertilizer in yuan / kg.
According to Table 4, which reports the marginal product output value and price of each factor for the entire sample, there is an overuse of fertilizers, labor, and seeds in the rapeseed production process. This finding indicates that there is still significant potential for optimizing factor inputs among farmers in China.
For farmers with less than 20 mu, the data in Table 4 shows overuse of fertilizers, labor, seeds, and machinery. Notably, the overuse of machinery even in smaller plots aligns with Zhang et al. (2017), who observed that machine harvesting operations in narrow or irregular plots increase harvesting time and costs per unit area. Furthermore, in non-plain areas, large and medium-sized machinery is often unsuitable for field operations, while small machinery operates inefficiently, leading to higher costs (Tang J. et al., 2023; Tang Y. et al., 2023). However, the unit product value of land factors exceeds the price of land, indicating no excess in land factors. Thus, increasing land inputs, while keeping other factors constant, could yield additional economic benefits.
For farmers with more than 20 mu, Table 4 reveals that the marginal product output value of labor and seeds exceeds their purchase prices, suggesting no overuse of these factors. Zhang and Luo (2022) pointed out that small plot sizes might increase the use of pesticides and other inputs, but this effect diminishes when the land operation size exceeds 16.667 mu. These findings suggest that farmers operating more than 20 mu can optimize the input ratios of labor, seeds, fertilizers, and machinery, providing insights into moderate-scale operations in China.
Moreover, while studies have explored the issue of excessive input factors in rapeseed production (Liu et al., 2018; Tang J. et al., 2023; Tang Y. et al., 2023), this paper suggests that the problem of excessive labor use has been addressed, yet the overuse of fertilizers still requires further improvement.
3.3 Regression results of rapeseed farmers’ cost function
To explore the relationship between scale and frontier cost, this study employs an improved stochastic frontier-based cost function model. The regression results indicate that the frontier cost and efficiency loss cost of rapeseed farmers do not exhibit a continuous downward trend with scale expansion, consistent with the findings of Tauer and Mishra (2006). This raises the question of how frontier cost and efficiency loss cost trends change with the expansion of farmers’ operational scale.
To analyze the relationship between farm household business scale and efficiency loss cost, we follow the methodology of Tauer and Mishra (2006), performing the analysis in two steps. First, we use the regression results in Table 5 to calculate the efficiency loss value for each farm household. Second, we conduct a weighted regression of land scale against the efficiency loss value to estimate the efficiency loss cost.
Table 5
| Variable name | Least square method | Stochastic front cost function model | ||
|---|---|---|---|---|
| Coefficient | Standard error | Coefficient | Standard error | |
| The scale of farmers | 0.0291*** | 0.011 | 0.155*** | 0.021 |
| Middle part | −0.140*** | 0.037 | −0.119*** | 0.045 |
| East | −0.183*** | 0.044 | −0.152*** | 0.036 |
| Constant term | 2.153*** | 0.030 | 2.230*** | 0.042 |
| Rape production efficiency loss item | ||||
| The scale of farmers | 0.694*** | 0.067 | ||
| constant | −3.608*** | 0.443 | ||
| statistics | F = 9.67 | Wald chi2 = 73.81 | ||
| sample capacity | 3,144 | 3,144 | ||
Results of the regression of the cost function of rapeseed farmers.
*** indicates significant at the 1% level.
As shown in Table 5, there is a positive correlation between the cost of efficiency loss and scale in the production process of rapeseed, indicating that scale expansion does not necessarily lead to reduced production costs. This conclusion aligns with the findings of Liu et al. (2017) and Zhang and Liu (2018). Additionally, Table 5 reveals that the efficiency loss cost in the eastern region is lower than in the central and western regions. This suggests that the relatively favorable topographic conditions, well-developed farmland water conservancy and irrigation facilities, and sound policies for rapeseed production in the eastern region contribute to reduced efficiency loss costs.
3.4 Decomposition of total cost per 100 kg of rapeseed for farmers of different sizes
In this study, using the formulas for frontier cost and efficiency loss cost, the sample farmers are categorized into six size intervals as outlined in Chapter 5. The analysis focuses on the actual total cost, frontier cost, and efficiency loss cost for different farm sizes. Detailed data are presented in Table 6. By decomposing the total cost into its components, we can better understand the cost dynamics and the impact of farm size on production efficiency. This analysis provides valuable insights into optimizing resource allocation and improving cost efficiency in rapeseed production.
Table 6
| Scale | Frontier cost | Cost of efficiency loss | Actual total cost | Cost differences due to scale |
|---|---|---|---|---|
| Below 10 mu | 788.38 | 17.56 | 813.75 | 197.19 |
| 10–30 mu | 603.72 | 12.32 | 616.56 | 0 |
| 30–50 mu | 722.21 | 18.85 | 735.23 | 118.67 |
| About 50–100 mu | 734.12 | 37.14 | 789.76 | 173.2 |
| About 100–200 mu | 738.54 | 36.79 | 790.33 | 173.77 |
| More than 200 mu | 921.41 | 40.37 | 973.81 | 357.25 |
The total cost per 100 kg of rape for farmers of different sizes.
Table 6 reports the values of three types of costs—actual total cost, frontier cost, and efficiency loss cost—for farmers producing 100 kg of rapeseed across different size intervals. It highlights how cost differences arise from variations in farm size.
From the perspective of cost structure, the proportion of efficiency loss cost is relatively low. However, with the expansion of farmers’ operational scale, the proportion of efficiency loss tends to increase. This suggests that while expanding the scale of operations may initially reduce efficiency loss, achieving the expected cost savings requires matching the operational scale with appropriate factor inputs.
Examining frontier costs, we observe a trend of “first decreasing and then increasing” as the scale of farmers’ operations expands. Among the six size ranges, farmers operating within the 10–30 mu range exhibit the lowest frontier costs and efficiency loss costs.
From the standpoint of efficiency loss cost, there is a similar “first decline and then rise” trend with the expansion of operational scale. This finding resonates with the conclusions of Liu et al. (2017) and Zhao et al. (2021), who noted an “inverted U-shaped” relationship between scale and efficiency. The initial decrease in efficiency loss cost may be attributed to improved terrain conditions, specialized labor division, and enhanced management capabilities among farmers (Zhang et al., 2022).
Furthermore, considering the actual total cost, which aggregates the frontier and efficiency loss costs, the total cost for producing 100 kg of rapeseed for farmers with less than 10 mu is 813.75 Yuan. As the operational scale increases, the total cost rises to 973.81 Yuan for farmers with more than 200 mu, reflecting a 24.23% increase.
4 Discussion
4.1 Marginal product value of each input factor and factor prices of rapeseed production for farmers in different regions
Gong (2018) suggests that enhancing the efficiency of agricultural production and reducing regional disparities is a potential growth point for China’s agricultural modernization, particularly in the central and western regions, where significant room for improvement exists. Given China’s extensive geographical diversity, this study analyzes the marginal product value of each input factor and factor prices across the eastern, central, and western regions.
In the eastern region, as detailed in Table 7, the marginal product value of labor, seed, and fertilizer for farmers with over 20 mu of land surpasses the purchase price of these factors. This indicates that farmers with over 20 mu in the eastern region do not overuse labor, seed, and fertilizer in rapeseed production. This finding suggests that large-scale growers in the eastern region allocate labor, seeds, and other resources efficiently, thereby optimizing the cost structure of rapeseed production. This provides a practical foundation for improving the cost-effectiveness of rapeseed production. Additionally, the eastern region likely benefits from a more mature market for production services. This maturity is attributable to the region’s plain topography, which facilitates continuous planting and creates a sufficiently large service market capacity, attracting service providers (Zhang and Luo, 2018). This leads to a pattern of continuous specialized production, yielding external economies of scale through specialized agglomeration (Liang et al., 2021).
Table 7
| Variable | Below 20 mu in the east | Over 20 mu in the east | |
|---|---|---|---|
| Marginal product value | Land | 218.746 | 142.615 |
| Labor force | 20.239 | 385.012 | |
| Machinery | 0.202 | / | |
| Seed | 45.149 | 352.376 | |
| Chemical fertilizer | 1.094 | 14.021 | |
| Factor price | Land | 219.109 | 141.152 |
| Labor force | 101.853 | 99.735 | |
| Machinery | 107.138 | 102.64 | |
| Seed | 78.907 | 134.071 | |
| Chemical fertilizer | 2.619 | 13.824 |
Marginal product value and factor price of each input factor in eastern region.
Conversely, for farmers with less than 20 mu in the eastern region, the marginal product output value of land is lower than the purchasing price. This discrepancy may be related to the high population density and land scarcity in the eastern region, where land costs have been rising annually.
Table 8 presents the marginal product value of each input factor and factor prices in the central region. As reported, the marginal product value of labor and fertilizer for farmers with over 20 acres exceeds the purchasing price, indicating that these farmers do not overuse labor and fertilizer in rapeseed production. Two primary factors contribute to this conclusion. Firstly, recent state policies aimed at reducing fertilizer usage align with Wang and Li’s (2022) findings that medium-sized farms benefit from such reductions. Secondly, with an increasing number of farmers in the central region seeking employment elsewhere, the government has vigorously promoted environmental protection and resource conservation. Additionally, special subsidy policies for organic and formulated fertilizers have been implemented. As a result, farmers’ environmental awareness has risen, and the adoption of green agricultural technologies has deepened, leading to more scientific fertilizer application (Tang J. et al., 2023; Tang Y. et al., 2023).
Table 8
| Variable | Central area of 20 mu below | Central area of more than 20 mu | |
|---|---|---|---|
| Marginal product value | Land | 227.258 | 107.037 |
| Labor force | 28.241 | 170.227 | |
| Machinery | 0.141 | / | |
| Seed | 31.693 | 66.117 | |
| Chemical fertilizer | 1.072 | 5.976 | |
| Factor price | Land | 132.348 | 86.855 |
| Labor force | 101.861 | 112.133 | |
| Machinery | 94.241 | 98.754 | |
| Seed | 62.212 | 67.114 | |
| Chemical fertilizer | 2.464 | 5.72 |
Marginal product value and factor price of each input factor in central region.
Table 9 presents the marginal product value of each input factor and corresponding factor prices in the western region. The data indicate that for farmers with more than 20 acres, the marginal product value of labor exceeds its purchasing price, suggesting that there is no overuse of labor in the rapeseed production process for these farmers. This finding may be attributed to the sparse population in the western region and the prevalence of migrant labor.
Table 9
| Variable | Below 20 mu in the west | Western area of more than 20 mu | |
|---|---|---|---|
| Marginal product value | Land | 214.295 | 144.329 |
| Labor force | 12.343 | 108.953 | |
| Machinery | 0.123 | / | |
| Seed | 59.472 | 54.483 | |
| Chemical fertilizer | 1.004 | 3.041 | |
| Factor price | Land | 110.983 | 127.076 |
| Labor force | 83.967 | 86.309 | |
| Machinery | 84.951 | 90.194 | |
| Seed | 110.338 | 97.144 | |
| Chemical fertilizer | 2.653 | 5.532 |
Marginal product value and factor price of each input factor in western region.
4.2 Marginal product value of each input factor and factor prices of rapeseed production for farmers with different terrain conditions
Recent studies have investigated the impact of initial resource endowment on cost efficiency, highlighting that the topographic characteristics of farmland significantly influence technical and cost efficiency (Zhang et al., 2022; Zheng and Xu, 2017). According to Table 10, the marginal product value of labor and seed inputs for large-scale households with more than 20 acres in the plains region exceeds their purchasing prices. This indicates that these farmers do not overuse labor and seeds in the rapeseed production process. The rational allocation of labor, seeds, and other resources by large-scale growers in the plains region optimizes the cost input structure of rapeseed production. Additionally, as farm size expands, the issue of fertilizer overuse is mitigated, suggesting that topographic conditions significantly influence input allocation (Tang J. et al., 2023; Tang Y. et al., 2023).
Table 10
| Variable | Plain of 20 mu below | Plain of more than 20 mu | |
|---|---|---|---|
| Marginal product value | Land | 230.159 | 121.85 |
| Labor force | 23.332 | 228.132 | |
| Machinery | 0.147 | / | |
| Seed | 38.263 | 193.094 | |
| Chemical fertilizer | 1.068 | 5.987 | |
| Factor price | Land | 165.817 | 134.317 |
| Labor force | 101.662 | 101.239 | |
| Machinery | 67.993 | 104.087 | |
| Seed | 74.652 | 70.411 | |
| Chemical fertilizer | 2.336 | 6.457 |
Marginal product value and factor price of each input factor of plain area.
Conversely, the marginal product value of land in the plains region is lower than its purchasing price. This discrepancy can be attributed to two factors: the limited sample size, which may affect the results, and the inclusion of samples from the eastern region. The eastern region is characterized by high population density and increasing land costs, which elevate the average land cost in the sample. This results in a higher mean value for land costs, reflecting the challenges faced by farmers in regions with more people and less land.
The marginal product value and price of each factor in non-plains terrain are detailed in Table 11. For large-scale households with more than 20 acres, the marginal product value of labor exceeds its purchasing price, suggesting that there is no over-utilization of labor in rapeseed production in these regions. This finding may be attributed to the regional distribution of the sample, which includes 298 households in the east, 749 in the center, and 873 in the west. Notably, many farm households in the central and western regions have members who work outside the farm, particularly in the sparsely populated western region.
Table 11
| Variable | Non-plain is below 20 mu | Non-plain more than 20 mu | |
|---|---|---|---|
| Marginal product value | Land | 210.023 | 140.806 |
| Labor force | 17.214 | 214.65 | |
| Machinery | 0.163 | / | |
| Seed | 52.612 | 122.216 | |
| Chemical fertilizer | 1.046 | 9.371 | |
| Factor price | Land | 142.478 | 102.413 |
| Labor force | 89.43 | 97.547 | |
| Machinery | 122.891 | 90.296 | |
| Seed | 92.983 | 128.472 | |
| Chemical fertilizer | 2.821 | 10.257 |
Marginal product value and factor price of each input factor of non-plain area.
In contrast, for households with less than 20 mu in non-plains areas, the marginal product values of labor, machinery, seeds, and fertilizers are lower than their respective purchase prices. This indicates a need for further optimization of these inputs in rapeseed production for smaller farms in non-plains regions. This finding may be influenced by the topographic features and plot sizes in the Midwest. For example, machinery substitution for labor is affected not only by the relative prices of factors but also by the difficulty of substitution (Zheng and Xu, 2017). Agricultural machines require space for reciprocal cycling and steering movements, and the narrow, scattered plot locations in non-plains areas increase the difficulty of mechanical substitution for labor (Guo et al., 2019).
4.3 Decomposition of rapeseed production costs for farmers in different regions
Table 12 provides a breakdown of the production costs per 100 kg of rapeseed for farmers in different regions. The data indicate that the cost of efficiency loss in the eastern region is generally lower than that in the central and western regions. Specifically, the efficiency loss and the actual total cost are lowest for farmers with 10–30 mu in the eastern region, suggesting that these farmers experience the least efficiency loss in rapeseed production. The superior infrastructure, favorable topographic conditions, and stronger resource allocation capacity of farmers in the eastern region create favorable conditions for continuous specialized production and the achievement of external economies of scale through specialized agglomeration (Liang et al., 2021).
Table 12
| Scale | Frontier cost | Cost of efficiency loss | Actual total cost |
|---|---|---|---|
| Below 10 mu | 863.98 | 14.46 | 878.44 |
| 10–30 mu | 573.36 | 10.45 | 583.81 |
| 30–50 mu | 578.89 | 12.97 | 591.86 |
| 50–100 mu | 587.71 | 14.24 | 601.95 |
| Between 100 and 200 mu | 595.04 | 15.05 | 610.09 |
| More than 200 mu | 724.07 | 15.44 | 739.51 |
Production cost per 100 kg of rapeseed for farmers in eastern China.
Table 13 presents the cost per 100 kg of rapeseed production for farmers in the central region. The data reveal that the cost and actual total cost are lowest for farmers with 10–30 mu, indicating minimal efficiency loss in this group. This finding corroborates the cost-efficiency optimization conclusions discussed with Zhang et al. (2024). The presence of major rapeseed-producing provinces, such as Hubei and Hunan, plays a significant role in this outcome. These regions are prominent winter rapeseed producers and benefit from superior farmland infrastructure and enhanced resource allocation capacity among farmers, creating favorable conditions for reducing efficiency loss costs (Zhang et al., 2022).
Table 13
| Scale | Frontier cost | Cost of efficiency loss | Actual total cost |
|---|---|---|---|
| Below 10 mu | 641.07 | 16.38 | 657.45 |
| 10–30 mu | 595.03 | 12.68 | 607.71 |
| 30–50 mu | 608.01 | 19.17 | 627.18 |
| About 50–100 mu | 674.61 | 49.51 | 724.12 |
| About 100–200 mu | 813.56 | 54.86 | 868.42 |
| More than 200 mu | 1073.95 | 56.37 | 1130.32 |
Production cost per 100 kg of rapeseed for farmers in central region.
Table 14 presents the cost per 100 kg of rapeseed production for farmers in the western region. The data indicate that the cost of efficiency loss and total real cost are lowest for farmers with 10–30 mu, suggesting minimal efficiency loss in this group. Interestingly, the efficiency loss cost for those with 100–200 mu is also relatively low. This phenomenon can be attributed to two factors. Firstly, the regional distribution of the sample plays a role; in Sichuan Province and Chongqing Municipality, significant improvements in farmland infrastructure have led to high sown areas, total yields, and rapeseed yields, ranking among the highest in the country. Secondly, the introduction of colorful rapeseed by the Sichuan Academy of Agricultural Sciences, through hybrid technology, has bolstered rural tourism and ornamental uses. This innovation has facilitated the deep integration of cultural, tourism, and agricultural industries, promoting the green and characteristic development of ecological and leisure industries. Consequently, this has increased the enthusiasm of farmers with 100–200 mu to engage in rapeseed cultivation (Wang, 2020; Ren et al., 2018).
Table 14
| Scale | Frontier cost | Cost of efficiency loss | Actual total cost |
|---|---|---|---|
| Below 10 mu | 883.54 | 21.84 | 905.38 |
| 10–30 mu | 644.33 | 13.84 | 658.17 |
| 30–50 mu | 962.21 | 24.41 | 986.62 |
| 50–100 mu | 995.53 | 47.68 | 1043.21 |
| Between 100 and 200 mu | 851.86 | 40.45 | 892.31 |
| More than 200 mu | 1002.31 | 49.31 | 1051.62 |
Production cost per 100 kg of rapeseed for farmers in western China.
4.4 Decomposition of rapeseed production costs for farmers in different terrain conditions
Table 15 illustrates the cost of production per 100 kg of rapeseed for farmers in the plains. Two primary factors explain the observed cost structure. Firstly, the sample distribution in the plains region plays a significant role. A larger proportion of farmers in the east-central plains region, particularly large-scale growers, effectively allocate inputs of labor, seeds, and other resources, enhancing the cost input structure of rapeseed production and achieving higher allocation efficiency (Liu et al., 2017). Secondly, the eastern region benefits from a higher mechanization rate and superior farmland infrastructure, attributable to its gentler topography, which helps reduce the cost of efficiency losses.
Table 15
| Scale | Frontier cost | Cost of efficiency loss | Actual total cost |
|---|---|---|---|
| Below 10 mu | 740.36 | 15.36 | 755.72 |
| 10–30 mu | 486.95 | 10.41 | 497.36 |
| 30–50 mu | 656.26 | 17.62 | 673.88 |
| 50–100 mu | 699.95 | 25.74 | 725.69 |
| Between 100 and 200 mu | 486.83 | 24.15 | 510.98 |
| More than 200 mu | 636.95 | 32.69 | 669.64 |
Production cost per 100 kg of rapeseed for farmers of plain area.
Table 16 presents the cost of production per 100 kg of rapeseed for farmers in non-plains regions. The data indicate that efficiency loss costs are higher for farmers in non-plains regions across all six size scenarios compared to those in plains regions. This finding can be attributed to two main factors. Firstly, the regional distribution of the sample shows a larger proportion of farm households in the central and western parts of the country, including 897 households in the central region and 917 in the western region. The overall water conservancy infrastructure and mechanization rates in these areas are lower than in the eastern plains. Secondly, non-plains areas comprise plateaus, hills, and mountains, leading to narrow and fragmented plot sizes. These challenging topographic conditions increase the cost of efficiency losses (Zhang et al., 2022; Guo et al., 2019).
Table 16
| Scale | Frontier cost | Cost of efficiency loss | Actual total cost |
|---|---|---|---|
| Below 10 mu | 851.93 | 19.72 | 871.65 |
| 10–30 mu | 721.37 | 14.25 | 735.62 |
| 30–50 mu | 776.43 | 20.13 | 796.56 |
| About 50–100 mu | 804.98 | 48.53 | 853.51 |
| About 100–200 mu | 1020.32 | 49.43 | 1069.75 |
| More than 200 mu | 1230.05 | 48.07 | 1278.12 |
Production cost per 100 kg of rapeseed for farmers of non-plain area.
5 Conclusion
This study investigates the relationship between the scale of operation and the cost structure of rapeseed production using microdata from fixed observation points of farmers in the National rapeseed Industry Technology System from 2018 to 2021. The research results are as follows.
A non-linear relationship between the scale of operation and the average cost per mu: as the operational scale expanded, the average cost per mu initially decreased, then increased. Notably, the average cost per mu for farmers managing over 200 mu was comparable to those operating within the 10–30 mu range, confirming a “decrease-then-increase” cost pattern per unit of production. There are similarities between the findings of this study and those of previous scholars (Li et al., 2015), but this paper explores them in a more comprehensive and in-depth manner.
Over-input of chemical fertilizers, machinery, seeds, and labor among farmers operating less than 20 mu. With increasing scale, excessive labor input was mitigated, but overuse of fertilizers and seeds persisted. Regional analysis indicated significant improvements in the eastern region regarding over-input of labor and seeds, moderate improvements in the central region, and some alleviation of labor over-input in the western region, although other input excesses remained. The present findings are a useful addition to previous studies that have looked more into the relationship between farm household size and cost efficiency (Zhang et al., 2024).
Further analysis distinguished that in plains areas, the over-input problems of labor and seeds diminished with expanding scale, whereas in non-plain areas, primarily labor input issues were resolved. Overall, land input demonstrated the highest output elasticity, followed by labor and fertilizers. Efficiency loss was primarily attributed to technical and allocative inefficiencies.
Evaluating frontier costs, efficiency loss costs, and actual costs across the full sample, the results showed lower efficiency loss costs in the eastern region compared to central and western regions, and in plains compared to non-plains. The smallest efficiency loss costs were found in the 10–30 mu interval. These results suggest that superior infrastructure and robust resource allocation in the eastern region facilitate continuous and specialized production, thereby realizing economies of scale.
6 Policy recommendations
To promote the sustainable development of the rapeseed industry, optimizing the input of production factors is crucial. Rationalizing resource inputs can reduce production costs, improve allocative efficiency, and minimize agricultural surface pollution. Our study indicates that the scale of rapeseed cultivation should not expand indefinitely, as excessive inputs of chemical fertilizers, pesticides, and labor can lead to environmental pollution. It is advisable to maintain the rapeseed planting area in the eastern and central regions within the 10–30 mu range to optimize the input factor ratio.
Leveraging big data technology platforms can enhance agricultural data functions, closely monitor market dynamics, share input factor prices, and assist farmers in optimizing input amounts. Utilizing modern information technologies and online meeting platforms can strengthen internal training and communication, track global rapeseed industry trends, and guide farmers in scientific planting practices.
Enhancing the international competitiveness of the rapeseed industry requires focusing on improving technical efficiency and allocative efficiency. Promoting mechanization throughout the entire rapeseed production process can significantly reduce labor costs. This includes advancing mechanical sowing, management, and harvesting, increasing agricultural machinery subsidies, and developing socialized services. Furthermore, strengthening scientific and technological innovation and promoting technological advancements throughout rapeseed production can help develop high-quality varieties and scientific management methods, thereby reducing costs and improving efficiency. Integrating new technologies with farmers’ experience through technology promotion and the transformation of scientific achievements can achieve higher production efficiency.
Optimizing the factor market is essential for improving allocative efficiency. The government should minimize intervention in the factor market, provide fair access to factors, ensure consistent pricing, and facilitate equal lending opportunities for both small and large-scale farmers through financial market reforms. Additionally, the government should enhance the multifunctional attributes of rapeseed, optimize field layout and facility supply, promote land transfers, and establish an efficient market for agricultural factors and products. Provincial and municipal governments should devise development strategies based on regional characteristics to foster healthy symbiotic development. Efforts should also be made to enhance land improvement and technical research to elevate the level of comprehensive mechanization and adapt rapeseed mechanization through land consolidation and efficient production techniques.
6.1 Limitations of the study and future prospects
This study elucidates the relationship between the scale of rapeseed production and cost efficiency by analyzing microdata from 2018 to 2021. However, several limitations should be acknowledged. Firstly, the data encompass only specific years and regions, which may not adequately capture the diversity and dynamic evolution of rapeseed production across China. Secondly, the study primarily addresses production costs and efficiency, without delving deeply into the impacts of market demand, policy shifts, and environmental factors on rapeseed production. Additionally, soft factors such as individual farmer differences and social capital were insufficiently considered.
Future research should aim to expand the data sample range and temporal span to include a broader spectrum of regions and years, thereby enhancing the study’s representativeness and applicability. Concurrently, developing a more comprehensive analytical model that incorporates multiple dimensions such as market dynamics, policy changes, and environmental impacts is imperative. Further investigation is also needed into the roles of technology promotion, farmer training, and social capital in enhancing rapeseed production efficiency, leading to more targeted policy recommendations. Moreover, research should intensify focus on the environmental impacts of rapeseed production, exploring sustainable agricultural development pathways to ensure the harmonious progression of agricultural production and ecological conservation.
Statements
Data availability statement
The original contributions presented in the study are included in the article/supplementary material, further inquiries can be directed to the corresponding author.
Author contributions
QZ: Conceptualization, Formal analysis, Funding acquisition, Investigation, Methodology, Resources, Supervision, Validation, Visualization, Writing – original draft, Writing – review & editing. FY: Methodology, Validation, Visualization, Writing – original draft, Writing – review & editing. TT: Funding acquisition, Methodology, Project administration, Resources, Validation, Writing – original draft. ZF: Software, Writing – original draft.
Funding
The author(s) declare that financial support was received for the research and/or publication of this article. This work was supported by the China Agriculture Research System of MOF and MARA (Project No. CARS-0012), Hunan Provincial Department of Education Scientific Research (Project No. 23B0857), and Humanities and Social Sciences Research Program for Universities in Jiangxi Province (No. JC23214).
Conflict of interest
The authors declare that the research was conducted in the absence of any commercial or financial relationships that could be construed as a potential conflict of interest.
Generative AI statement
The authors declare that no Gen AI was used in the creation of this manuscript.
Publisher’s note
All claims expressed in this article are solely those of the authors and do not necessarily represent those of their affiliated organizations, or those of the publisher, the editors and the reviewers. Any product that may be evaluated in this article, or claim that may be made by its manufacturer, is not guaranteed or endorsed by the publisher.
References
1
AdamopoulosT.BrandtL.LeightJ.RestucciaD. (2022). Misallocation, selection, and productivity: a quantitative analysis with panel data from China. Econometrica90, 1261–1282. doi: 10.3982/ECTA16598
2
AignerD.LovellC. K.SchmidtP. (1977). Formulation and estimation of stochastic frontier production function models. J. Econ.6, 21–37. doi: 10.1016/0304-4076(77)90052-5
3
AlvarezA.CarlosA. (2003). Diseconomies of size with fixed managerial ability. Am. J. Agric. Econ.85, 134–142. doi: 10.1111/1467-8276.00108
4
ÁlvarezA.Del CorralJ.SolísD.PérezJ. A. (2008). Does intensification improve the economic efficiency of dairy farms. J. Dairy Sci.91, 3693–3698. doi: 10.3168/jds.2008-1123
5
AvillezR. (2011) A detailed analysis of the productivity performance of the Canadian primary agriculture sector. Centre for the Study of Living Standards. Available online at: https://core.ac.uk/download/pdf/6266329.pdf (Accessed February 18, 2020).
6
CaiF.LiZ. (1990). The existence and utilisation of economies of scale in China's agriculture. Contemp. Econ. Sci.2, 25–34.
7
CarterC. A. (2011). China’s agriculture: achievements and challenges. ARE14, 5–7.
8
ChariA.LiuE. M.WangS. Y.WangY. (2021). Property rights, land misallocation, and agricultural efficiency in China. Rev. Econ. Stud.88, 1831–1862. doi: 10.1093/restud/rdab067
9
ChavasJ.RobertG.ChambersR. (2010). Production economics and farm management: a century of contributions. Am. J. Agric. Econ.92, 356–375. doi: 10.1093/ajae/aaq004
10
ChenW. (2006). Productivity growth, technical Progress and efficiency change in Chinese agriculture: 1990-2003. China Rural Survey16, 203–222. doi: 10.1111/j.1467-8268.2004.00089.x
11
ChenX. (2015). The direction of China's food policy adjustment. China Econ. Rep.12, 19–21.
12
DongF.HennessyD. A.JensenH. H. (2013) Size, productivity and exit decision in dairy farms, selected paper prepared for presentation at the agricultural and applied economics associations 2013 AAEA and CAES joint annual meeting, Washington DC. Available online at: http://ageconsearch.umn.edu (Accessed March 15, 2020).
13
FederG.LauL. J.LinJ. Y. (1992). The determinants of farm investment and residential construction in post-reform China. Econ. Dev. Cult. Chang.41:1. doi: 10.1086/451992
14
FerrierG.LovellC. (1990). Measuring cost efficiency in banking: econometric and linear programming evidence. J. Econ.46, 229–245. doi: 10.1016/0304-4076(90)90057-Z
15
GongB. (2018). Study on the contribution of input factors and productivity to China's agricultural growth. Agric. Technol. Econ.6, 4–18. doi: 10.13246/j.cnki.jae.2018.06.001
16
GongB. (2022). Diffusion of agricultural technology and regional gaps in productivity in China. Econ. Res.57, 102–120.
17
GuoY.ZhongF.JiY. (2019). Economy of scale and the preferences of scale households for arable land transfer-an analysis based on the plot level. China Rural Econ.4, 7–21.
18
HallB.LeVeenE. (1978). Farm size and economic efficiency: the case of California. Am. J. Agric. Econ.60, 589–600. doi: 10.2307/1240243
19
HayamiY.RuttanV. W. (1985). Agricultural development: An international perspective. Publisher: Johns Hopkins University Press.
20
HeY.FengZ. (2012). Economy of scale and moderate scale operation in agriculture--an empirical study based on oilseed rape production in China. Rural Econ. Sci. Technol.23, 33–35.
21
HuangJ.MaH. (2000). Differences in scale of operation--an international comparison of production costs of major agricultural products in China. Int. Trade4, 41–44. doi: 10.14114/j.cnki.itrade.2000.04.010
22
JiY.ZhongF. (2013). Non-farm employment and Farmers' utilisation of agricultural machinery services. J. Nanjing Agric. Univ.13, 47–52.
23
KalirajanK. P.ObwonaM. B.ZhaoS. (1996). A decomposition of Total factor productivity growth: the case of Chinese agricultural growth before and after reforms. Am. J. Agric. Econ.78, 331–338. doi: 10.2307/1243706
24
LauL. J.YotopoulosP. A. (1971) A test for relative efficiency and application to Indian agriculture. Am. Econ. Rev., 61: 94–109. Available online at: https://www.jstor.org/stable/1910544.
25
LiF.GuoK.LiaoX. (2022). Risk assessment of China rapeseed supply chain and policy suggestions. Int. J. Environ. Res. Public Health20:465. doi: 10.3390/ijerph20010465
26
LiW.LuoD.ChenJ.XieY. (2015). Adequate scale operation in agriculture: scale efficiency, output level and production cost - based on the survey data of 1552 rice farmers. China Rural Econo.3, 4–17+43.
27
LiC.WangY.WangL. (2024). Guided by the goal of “double carbon”, what is the carbon emission reduction effect of the promotion and application of green technology in China?Environ. Res.245:117974. doi: 10.1016/j.envres.2023.117974
28
LiangJ.LiH.LiN.YangQ.LiL. (2023). Analysis and prediction of the impact of socio-economic and meteorological factors on rapeseed yield based on machine learning. Agronomy13:1867. doi: 10.3390/agronomy13071867
29
LiangZ.ZhangL.ZhangJ. (2020). Land transfer, plot size and fertiliser reduction - an empirical analysis based on the main rice production area in Hubei Province. China Rural Observ.5, 73–92.
30
LiangZ.ZhangL.ZhangJ. (2021). Land improvement and Fertiliser reduction-quasi-natural experimental evidence from China's high-standard basic farmland construction policy. China Rural Econ.4, 123–144.
31
LiuY.HuW.Jetté-NantelS.TianZ. (2014). The influence of labor price change on agricultural machinery usage in Chinese agriculture. Canad. J. Agric. Econ.62, 219–243. doi: 10.1111/cjag.12024
32
LiuQ.LiuQ.YangW. (2017). Analysis of the impact of farmers' land operation scale on the cost efficiency of rice production in China. J. China Agric. Univ.22, 153–161.
33
LiuC.YangX.ZhouX.FengZ.ZhangZ.CongR. (2018). Effects of fertiliser inputs on cost efficiency of oilseed rape in China. Resour. Sci.40, 2487–2495.
34
LiuZ.ZhuH.WilsonJ.AdamsM.WalkerT. R.XuY.et al. (2024). Achieving China's ‘double carbon goals’, an analysis of the potential and cost of carbon capture in the resource-based area: northwestern China. Energy292:130441. doi: 10.1016/j.energy.2024.130441
35
MaiettaO. W. (2000). The decomposition of cost inefficiency into technical and allocative components with panel data of Italian dairy farms. Eur. Rev. Agric. Econ.27, 473–495. doi: 10.1093/erae/27.4.473
36
MosheimR.LovellC. K. (2009). Scale economies and inefficiency of U.S. dairy farms. Am. J. Agric. Econ.91, 777–794. doi: 10.1111/j.1467-8276.2009.01269.x
37
NaylorR. L.HigginsM. M. (2017). The rise in global biodiesel production: implications for food security. Glob. Food Sec.16, 75–84. doi: 10.1016/j.gfs.2017.10.004
38
RenY.ZhuJ.MaS.YeG.HuaS. (2018). Breeding of colourful oilseed rape in China and its application in ecological agriculture. Zhejiang Agric. Sci.59, 165–167+170. doi: 10.16178/j.issn.0528-9017.20180201
39
ShahF.WuW. (2019). Soil and crop management strategies to ensure higher crop productivity within sustainable environments. Sustain. For.11:1485. doi: 10.3390/su11051485
40
ShengY.SongL. (2018). Agricultural production and food consumption in China: a long-term projection. China Econ. Rev.53, 15–29. doi: 10.1016/j.chieco.2018.08.006
41
SimsB.KienzleJ. (2016). Making mechanization accessible to smallholder farmers in sub-Saharan Africa. Environments3:11. doi: 10.3390/environments302001118
42
SuX.WangX. (2002). Agricultural land fragmentation and Farmers' food production-an analysis on the case of Laixi City, Shandong Province. China Rural Econ.4, 22–29.
43
SumnerA. (2014). American farms keep growing: size, productivity, and policy. J. Econ. Perspect.28, 147–166. doi: 10.1257/jep.28.1.147
44
TangJ.LiuC.YuC. (2023). Economic analysis and evaluation of fertiliser input in oilseed rape production in China. Chinese J. Oilseed Crops45, 654–663. doi: 10.19802/j.issn.1007-9084.2022132
45
TangY.XiongC.WuM. (2023). Influencing factors and development countermeasures of mechanisation of oilseed rape production in Hunan Province. Agric. Mech. Res.45, 1–7+29. doi: 10.13427/j.cnki.njyi.2023.07.010
46
TauerL. (2001). Efficiency and competitiveness of the small New York dairy farm. J. Dairy Sci.84, 2573–2576. doi: 10.3168/jds.S0022-0302(01)74710-8
47
TauerL. W.MishraA. K. (2006). Can the small dairy farm remain competitive in US agriculture?Food Policy31, 458–468. doi: 10.1016/j.foodpol.2005.12.005
48
TingleyD.PascoeS.CoglanL. (2005). Factors affecting technical efficiency in fisheries: stochastic production frontier versus data envelopment analysis approaches. Fish. Res.73, 363–376. doi: 10.1016/j.fishres.01.008
49
TweetenL.GrayR.Salcedo-BacaS. (2002) Structure of farming under freer trade among NAFTA countries. Available online at: http://www.farmfoundation.org/news/articlefiles/902-teal.pdf (Accessed March 19, 2020).
50
WaltersA. (1963). Production and cost functions: an econometric survey. Econometrica31:1. doi: 10.2307/1910949
51
WangF. (2020). Research on key technology of landscape design and implementation of rapeseed sea. Anhui Univ. Sci. Technol. doi: 10.27869/d.cnki.gakjx.2020.000072
52
WangJ.LiD. (2022). Scale of agricultural land, socialised services and agrochemical input reduction. Agric. Resour. Zoning China43, 20–27.
53
WangJ.SongW.HanX. (2010). Spatial econometric analysis of regional agricultural total factor productivity and its influencing factors in China - based on provincial spatial panel data from 1992 to 2007. China Rural Econ.8, 4–35.
54
WuF. (2000). Growth and efficiency of Chinese agriculture. Shanghai, China: Shanghai University of Finance and Economics Press.
55
WuY. (2011). Chemical fertilizer use efficiency and its determinants in China's farming sector: implications for environmental protection. China Agric. Econ. Rev.3, 117–130. doi: 10.1108/17561371111131272
56
WuS.PratoT. (2006). Cost efficiency and scope economies of crop and livestock farms in Missouri. J. Agric. Appl. Econ.38, 539–553. doi: 10.1017/S1074070800022604
57
XiaoZ.PanY.WangC.LiX.LuY.TianZ.et al. (2022). Multi-functional development and utilization of rapeseed: comprehensive analysis of the nutritional value of rapeseed sprouts. Food Secur.11:778. doi: 10.3390/foods11060778
58
XuQ.YinR.ZhangH. (2011). Economies of scale, scale rewards and adequate scale operation in agriculture--an empirical study based on China's grain production. Econ. Res.3, 59–71.
59
XuZ.ZhangD.ChengB. (2024). The logic of farmland scale operation for China's food security guarantee--an analytical perspective based on dual scale economies of farmers and plots [J]. Manage. World40, 106–122. doi: 10.19744/j.cnki.11-1235/f.2024.0059
60
YeF.QinS.NisarN.ZhangQ.TongT.WangL. (2023). Does rural industrial integration improve agricultural productivity? Implications for sustainable food production. Front. Sustain. Food Syst.7:1191024. doi: 10.3389/fsufs.2023.1191024
61
YotopoulosP. A.LauL. J. (1973). A test for relative economic efficiency: some further results. Am. Econ. Rev.63, 214–223. https://www.jstor.org/stable/1803137 (Accessed March 24, 2020).
62
ZhangQ.LenB.ChenX.ChenZ.WeiM.FengZ.et al. (2021). Impact analysis and countermeasures of the new crown pneumonia epidemic on oilseed rape industry in China. Chinese J. Oilseed Crops43, 551–561. doi: 10.19802/j.issn.1007-9084.2020332
63
ZhangX.LiuY. (2018). Has large-scale operation reduced the cost of agricultural production?--based on the perspectives of frontier cost and efficiency loss cost. J. Agric. Forestry Econ. Manag.17, 520–527. doi: 10.16195/j.cnki.cn36-1328/f.2018.05.60
64
ZhangL.LuoB. (2018). How does smallholder production fit into the modern agricultural development track?--empirical evidence from China's Main wheat producing areas. Econ. Res.53, 144–160.
65
ZhangL.LuoB. (2022). The logic of reduction in agriculture: an analytical framework. Agric. Econ.508, 15–26. doi: 10.13246/j.cnki.iae.2022.04.002
66
ZhangQ.RazzaqA.QinJ.FengZ.YeF.XiaoM. (2022). Does the expansion of farmers’ operation scale improve the efficiency of agricultural production in China? Implications for environmental sustainability. Front. Environ. Sci.10:918060. doi: 10.3389/fenvs.2022.918060
67
ZhangQ.YeF.RazzaqA.FengZ.LiuY. (2024). The impact of land consolidation on rapeseed cost efficiency in China: policy implications for sustainable land use and food security. Front. Sustain. Food Syst.8:1390914. doi: 10.3389/fsufs.2024.1390914
68
ZhangX.ZhouY. (2019). Impact of mismatch between farm size and efficiency level on rice production cost. China Rural Econ.2, 81–97.
69
ZhangX.ZhouY.YanB. (2017). Scale of farmland management and cost of rice production: the case of Jiangsu. Problems Agric. Econ.38, 48–55+2. doi: 10.13246/j.cnki.iae.2017.02.007
70
ZhaoJ.LiuL.LiG. (2021). Analysis of meat duck farming efficiency under the perspective of scale farming and regional differences. Res. Agric. Modern.42, 713–723. doi: 10.13872/j.1000-0275.2021.0084
71
ZhengZ.GaoY.HuoX. (2024). Re-examination of the relationship between farm size and land productivity--evidence from the third national agricultural census of large-scale farm households [J]. Manage. World40, 89–108. doi: 10.19744/j.cnki.11-1235/f.2024.0013
72
ZhengX.XuZ. (2017). Resource endowment constraints, factor substitution and induced technological change - the case of mechanisation of grain production in China. Economics16, 45–66. doi: 10.13821/j.cnki.ceq.2016.04.02
73
ZhouL. I.ZhangH. P. (2013). Productivity growth in China's agriculture during 1985 to 2010. J. Integr. Agric.12, 1896–1904. doi: 10.1016/S2095-3119(13)60598-5
Summary
Keywords
farmers’ scale of operation, rapeseed production costs, sustainable development, cost efficiency, China
Citation
Zhang Q, Ye F, Tong T and Feng Z (2025) Enhancing cost efficiency and promoting sustainable development of rapeseed in China: the role of scale operations and management. Front. Sustain. Food Syst. 9:1502049. doi: 10.3389/fsufs.2025.1502049
Received
26 September 2024
Accepted
13 March 2025
Published
04 April 2025
Volume
9 - 2025
Edited by
Andrea Marchini, University of Perugia, Italy
Reviewed by
Deborah Paola Rondanini, National Scientific and Technical Research Council (CONICET), Argentina
Mohanraj Thangamuthu, Amrita Vishwa Vidyapeetham, India
Updates
Copyright
© 2025 Zhang, Ye, Tong and Feng.
This is an open-access article distributed under the terms of the Creative Commons Attribution License (CC BY). The use, distribution or reproduction in other forums is permitted, provided the original author(s) and the copyright owner(s) are credited and that the original publication in this journal is cited, in accordance with accepted academic practice. No use, distribution or reproduction is permitted which does not comply with these terms.
*Correspondence: Feng Ye, yexiwen1995@jxau.edu.cn
Disclaimer
All claims expressed in this article are solely those of the authors and do not necessarily represent those of their affiliated organizations, or those of the publisher, the editors and the reviewers. Any product that may be evaluated in this article or claim that may be made by its manufacturer is not guaranteed or endorsed by the publisher.