Abstract
In the areas affected by soil erosion and water scarcity, watershed management involves all aspects of land and water resources for sustainable development. This study evaluates the effectiveness of the applied climate-resilient practices in a semi-arid watershed in Western India using different indices. The Soil Erosion Control Index credited the increased vegetation cover and contour bunding in farmers' fields as responsible for reducing the average annual soil erosion rate from 12.0 t/ha/year to 6.0 t/ha/year in 3 years. Their farmer's training program resulted in more engagement of local rural youth, which influenced a 12% improvement in the score from 68 to 80. The community-based water resource infrastructure aimed at improving water harvesting efficiency increased storage capacity by 40%. The index went up from 50% to 64%, achieving community engagement and water use efficiency in agriculture. The infiltration rates under different land uses varied from 4.5 to 6.5 mm/h, and therefore, helped in groundwater recharge by improving the opportunity time for infiltration into the soil through soil and water conservation structures. It was found that an increase in the vegetation restoration index of 3.78% was associated with improved vegetation under double-cropped and agroforestry systems adopted in the watershed. Farmers in the watershed living their livelihoods through conservation-based agricultural practices have increased their income significantly by 12%. The watershed management programs achieved a rise in the Integrated Climate Resilience Index from 44.76% to 64.39%. The integrated effect of different management strategies implemented in the watershed shows the significance of the watershed program in achieving the multiple sustainable development goals related to water and food security. These findings demonstrate that targeted soil and water conservation practices can have tremendous benefits by reducing soil erosion substantially, ensuring adequate water availability, and improving resilience to climate variability. Such measures, based on a watershed scale, can provide a model for other vulnerable areas to follow for sustainable development to achieve food security and adapt to the vagaries of climate change.
1 Introduction
India is one of the 120 nations that have pledged to meet the United Nations Convention to Combat Desertification (UNCCD) sustainable development target of becoming land degradation neutral by 2030. The goal must be achieved in a way that is both cost-effective and synergistic, considering each country's unique national context and development aspirations (Singh et al., 2020). Watershed management has emerged as a critical strategy for achieving multiple Sustainable Development Goals (SDGs), particularly those related to land degradation neutrality (SDG 15), climate action (SDG 13), clean water and sanitation (SDG 6), and zero hunger (SDG 2). In the context of increasing climate variability, natural resource degradation, and water scarcity, especially in rainfed and ecologically fragile regions, integrated watershed approaches offer a holistic framework for sustainable land and water management (Riahi et al., 2024). The impact of climate change on ecosystems, agriculture, and human lifestyles is detrimental in areas with limited natural resource endowments. The higher temperatures, weather extremes, and more precipitation will result in soil degradation, lack of water, and loss of biodiversity (Kingra et al., 2018). Climate change threatens food security and the stability of agriculture due to environmental stress, particularly in already vulnerable regions. One of the top means of guaranteeing climate protection is food production, which comes from plowing soil and putting water to use (Tripathi et al., 2016). Soil and water conservation (SWC) technology has been recognized as one appropriate strategy to offset the impact of climate change by helping enhance the availability of water and erosion of fertile land (Dumanski, 2009). Some of these practices are terracing, contour farming, agroforestry, mulching, rainwater harvesting, and cover crops to keep soil healthy and manage moisture as well as runoff. Studies reveal how the productivity of current agriculture can be intensified through soil and water conservation techniques, improving carbon retention and biodiversity while reducing soil moisture loss and enhancing sustainable ecosystems over the long term (Lal, 2020). It is also crucial for sustainable land-management practices that will be required to respond to climate change, in which mitigation and adaptation to its effects are pivotal (Rosenzweig and Tubiello, 2007; Rosenzweig et al., 2007). Singh G. et al. (2024) developed a hybrid vulnerability index for identification of critical areas for the implementation of soil and water conservation measures on degraded lands of Western India. The studies suggest that the combination of tree and annuals (agroforestry) along with soil water conservation measures enhanced agroecosystem resilience to extreme weather and improved the carbon stock and sequestration potential (Jinger et al., 2023). In addition to offering a variety of ecosystem services, growing trees, either alone or in conjunction with crops (agroforestry), has the potential to reduce energy consumption, control erosion, produce sustainable economic yields, and sequester more atmospheric carbon dioxide in biomass and soil carbon pools (Jinger et al., 2022). By increasing crop yield and soil moisture, in-situ moisture conservation strategies may be crucial to the restoration of degraded lands (Jinger et al., 2024). Panwar et al. (2023) found that water harvesting through tanks/ponds is a feasible approach that can increase crop production as well as diversification in rainfed areas of India. Jinger et al. (2025) have found that with the use of soil moisture conservation (SMC) techniques along with a suitable agroforestry system, the productivity of rainfed lands can be increased in Western India. Kumar et al. (2021) have investigated how trenching and terracing affect runoff, soil loss, and soil characteristics, as well as the growth, fruit yield, biomass, and carbon stock of sapota (Achras zapota) in Western India's degraded rainfed land. Globally, large areas of both agricultural and non-agricultural land are at risk from soil erosion and loss. On already degraded soils, high soil erosion has a significant impact on plant development and productivity, which hinders the establishment of vegetation (Kumar et al., 2021). In Bam province, stone ribbons might have reduced runoff by 13.4%, demonstrating their efficacy in reducing flood risk and promoting climate resilience. All things considered, supporting the implementation of SWCMs is a viable strategy for reducing climate-related risks and fostering resilience (Naba et al., 2024). The success of technologies such as irrigation, fertilizer, and improved seeds frequently depends on whether these investments are combined with SWC initiatives. SWC investments also work differently in Ethiopia's various rainfall areas and regions. These findings highlight how crucial it is to choose the right technology combinations and target specific geographic areas when promoting and expanding SWC technologies for climate change adaptation (Kato et al., 2011). A coordinated effort utilizing technologies from multiple scientific fields is required to adapt soils to climate change. Adopting water-smart tactics is necessary for stakeholders to preserve the right soil–water balance. They ought to concentrate on controllable intrinsic soil characteristics that regulate farming systems' vulnerability and adaptability to climate change. Many of these methods give the soils the tools they need to better absorb surplus water in flood-prone locations and hold more water in drought-prone ones. To preserve water for later use, governments, farmers, and other stakeholders must also invest in both basic and sophisticated water collecting and rerouting infrastructure (Brempong et al., 2023). Food security, cropping system sustainability, soil and water quality, and environmental preservation all depend on management for climate change adaptation and mitigation. Based on an analysis of the literature, this study proposes that to address climate change and associated issues such as food security, management choices that enhance soil functions, quality, and health by reducing soil erosion, increasing carbon sequestration, and enhancing cropping system and soil resilience will be required. According to our study, it will be more difficult to ensure food security for the world's expanding population if management choices do not promote soil and water conservation (Lal et al., 2011). The negative effects of climate change on the availability of water resources can be mitigated through watershed management, river health, equitable policies for water supply and distribution, and increasing storage capacity (or rainwater storage). Similarly, by boosting agricultural productivity, climate-smart agriculture adaptation, climate change-resistant crop development, irrigation water management, and the promotion of indigenous knowledge, food security can be guaranteed. The scientific evaluations of the climatic parameters needed for the management of sustainable agriculture can be provided to farmers through technical intervention. To lessen the risks of climate change on agricultural and water resources, stakeholders—including farmers, local society, academia, scientists, policymakers, NGOs, and others—can work together holistically (Singhal et al., 2024). One important tool that could help with greater yields, groundwater and surface water quality conservation, erosion prevention, atmospheric carbon (C) sequestration, and better soil health and quality throughout the tropics is cover crops (Delgado et al., 2021). The initiatives that were put into place [Soil and Water Conservation Practices (SWCPs), infrastructure, credit & saving, and capacity building] were seen by approximately 65% of the households as being beneficial for adapting to shocks connected to climate change. Thus, it can be said that SWCPs as specialized technologies and integrated watershed management as a comprehensive strategy play important roles in decreasing climate change, enhancing soil quality, minimizing land degradation, and raising crop yield (Mekonnen et al., 2021). In the protected sub-watershed, SWC interventions dramatically decreased surface runoff by 19–50% and soil erosion by 57–81%. Reducing soil erosion can improve soils' capacity to sequester carbon, preserve the soil's organic carbon pool, and lower the risk of land degradation. Adopting SWC techniques can thereby improve farmers' capacity to mitigate emissions and adjust to climate change. However, the conserved sub-watershed has not yet adopted SWC measures that are both protective and productive enough. Therefore, in addition to soil fertility amendments suitable for the location, it is crucial that SWC structures be complemented with other biological and agronomic approaches (Lal et al., 2011). More scientific studies are unquestionably required to improve food production while reducing the negative effects of human activity on the environment. Given the growing world population, more research is needed to create sustainable food production systems on the fragile and scarce soil systems that sustain human life. For sustainable production, which is crucial for future generations, more conservation will be needed, with a focus on minimizing soil disturbance and optimizing carbon management (Delgado et al., 2011). In this study, we have developed a novel integrated climate resilience index by integrating multiple indices to evaluate the effectiveness of different watershed interventions in achieving climate resilience.
2 Materials and methods
2.1 Location of study area
The Bhadroli Khurd-Karada watershed, having a 659.85 ha total geographical area, is located in Kalol Taluka in the Southwest part of Panchmahal district in Gujarat. The watershed falls in two villages, Bhadroli Khurd (22° 1' 50” N Latitude and 73° 0' 23” E Longitude) and Karada (Latitude 22° 0' 26” N and 73° 0' 23” E Longitude), as shown in Figure 1. The watershed was taken up for implementation during financial year 2020–21 by Indian Council of Agricultural Research (ICAR)-Indian Institute of Soil and Water Conservation, Research Center-Vasad, District-Anand, Gujarat for development under Tribal Sub-Plan (TSP) scheme funded by the Ministry of Agriculture and Farmers Welfare, Government of India. The reasons for selecting the watershed are that it is completely rainfed, and the entire population in the watershed is tribal with subsistence agriculture practices. The tribal farmers were using indigenous crop seeds of Maize, Cotton, Castor, Pigeon pea, and Pearl millet, which had poor production potential. The tribal farmers in the watershed were cultivating only Kharif crops due to poor water resource availability and irrigation facilities. The problems of crop damage by the stray animals were also reported by the tribal farmers. The crop yield was significantly lower than the state average yield due to high soil erosion, poor water resources, irrigation infrastructure, and the absence of soil and water conservation in the farmers' field. The farm mechanization was poor, with most tribal farmers cultivating their fields using traditional bullocks. The livestock population in the watershed was meager, and the milk productivity of the existing livestock was low due to poor health and the non-availability of green fodder. The seasonal migration of rural youth in the watershed was observed during the participatory rural appraisal to nearby cities for better income to fulfill their needs, leading to a loss of interest in agricultural activities. The literacy rate of both men and women was below the state average, and they were not aware of the soil and water conservation practices. Therefore, to address these multi-dimensional problems in the watershed, suitable interventions were implemented for the holistic socio-economic development of the watershed.
Figure 1
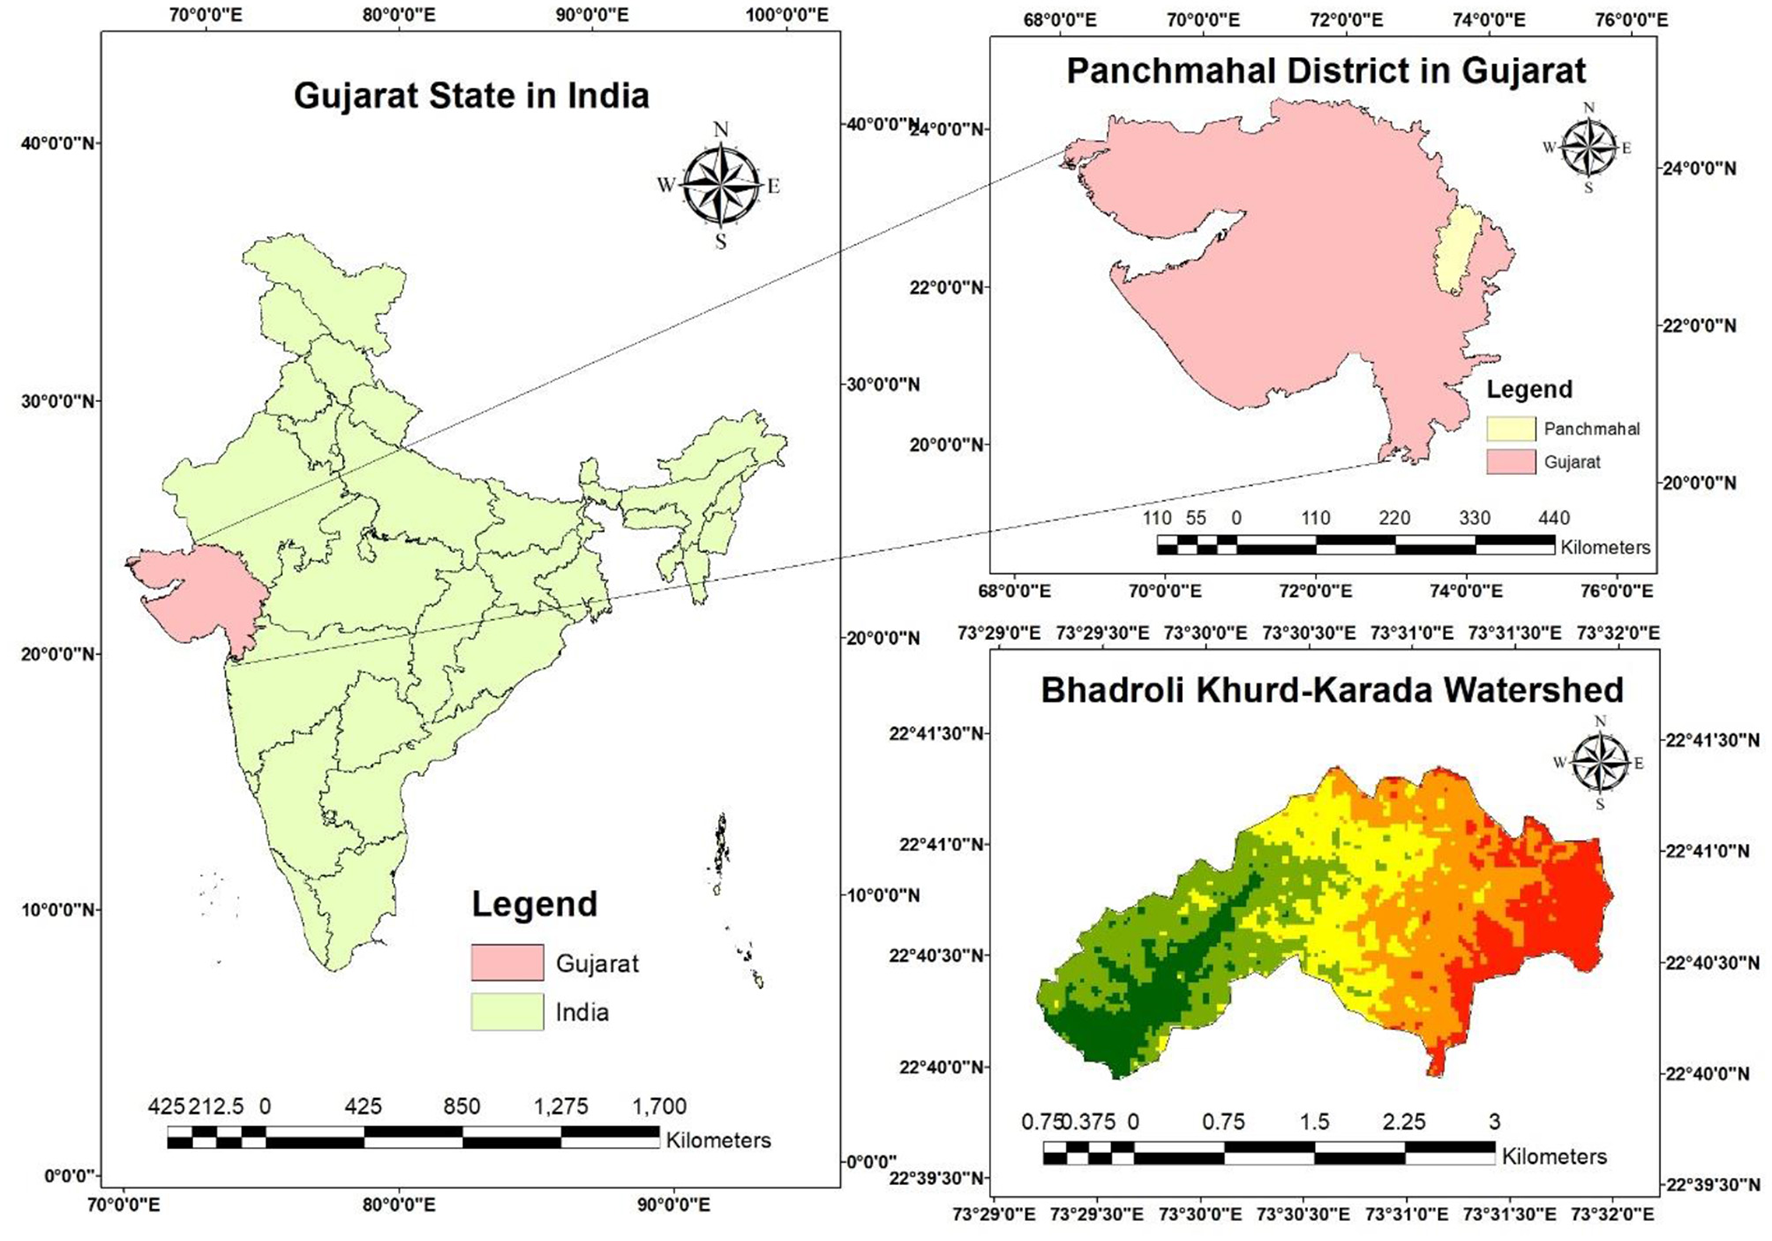
Location of Bhadroli Khurd-Karada watershed in Panchmahal district of Gujarat in Western India.
2.2 Topography and drainage
The watershed's topography is comparatively flat, with a maximum inclined slope of 11%. The watershed's drainage network is sub-dendritic, and it has an elongated shape. The relatively flat topography and sub-dendritic drainage pattern result in a longer concentration time, which lowers the peak flow at the watershed's outlet, as shown in Table 1. At multiple points within the watershed, the trunk order streams meander due to the comparatively flat topography, as shown in Figures 2, 3. After the monsoon season ends, the hard rock that is present at a shallower depth in the drainage channel contributes significantly to the base flow in the streams. Gully head extension and caving at multiple stream locations are caused by severe soil erosion brought on by the coarse soil texture and sparse vegetation cover, as shown in Figure 4. Early soil saturation and increased runoff generation from the watershed are caused by the presence of hard rocks at shallow depths. Even during typical rainfall or storm events, heavy flow is caused by the sub-surface's rapid saturation. The trunk stream order in the watershed is five. Approximately 527.88 ha (80%) of the watershed area is treatable with different types of soil and water conservation measures for climate resilience of the watershed against climate change.
Table 1
| Input parameters | Output parameters | |||||||||||
|---|---|---|---|---|---|---|---|---|---|---|---|---|
| Stream order (Su) | Number of streams(Nu) | Stream length (Lu) (Km) | Mean stream length (Lsm) (Km) | Stream length ratio (Lur) | Stream length used in the ratio(Lur-r) | Lur * Lur-r | Weighted mean stream length ratio(Luwm) | Bifurcation ratios (Rb) | Number of streams used in the ratio (Nu-r) | Rb * Nu-r | Weighted mean bifurcation ratios (Rbwm) | Rho coefficient (ρ) |
| 1st order | 82 | 140.6 | 1.71 | |||||||||
| 2nd order | 31 | 65.8 | 2.12 | 1.24 | 113 | 139.89 | 1.52 | 2.65 | 113 | 298.9 | 3.09 | 0.47 |
| 3rd order | 7 | 34.8 | 4.97 | 2.34 | 38 | 89 | 4.43 | 38 | 168.29 | 0.53 | ||
| 4th order | 3 | 22.6 | 7.53 | 1.52 | 10 | 15.15 | 2.33 | 10 | 23.33 | 0.65 | ||
| 5th order | 1 | 1.5 | 1.5 | 0.2 | 4 | 0.8 | 3 | 4 | 12 | 0.07 | ||
| Total | 124 | 265.3 | 17.84 | 165 | 244.84 | 165 | 502.52 | 1.71 | ||||
Drainage characteristics of Bhadroli Khurd-Karada watershed, Panchmahal, Gujarat.
Figure 2
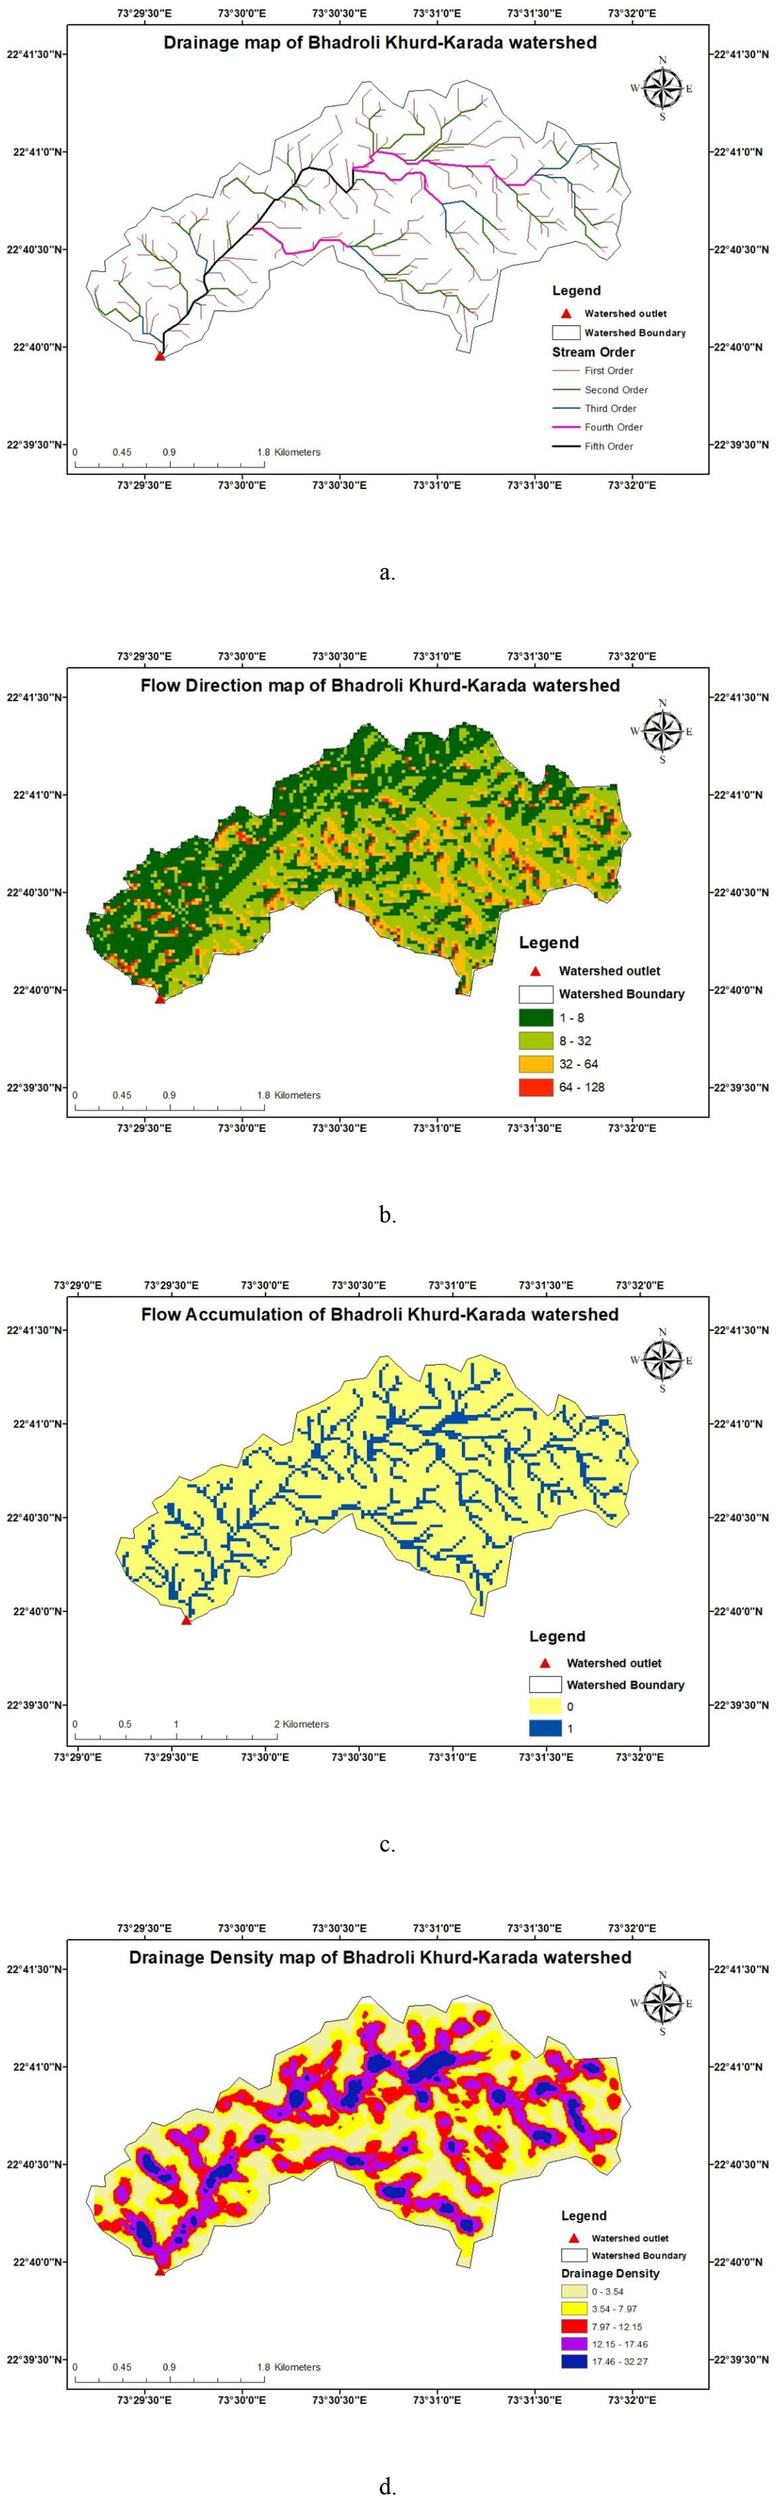
Drainage characteristics of Bhadroli Khurd-Karada watershed. (a) Drainage map, (b) flow direction map, (c) flow accumulation map, and (d) drainage density map.
Figure 3
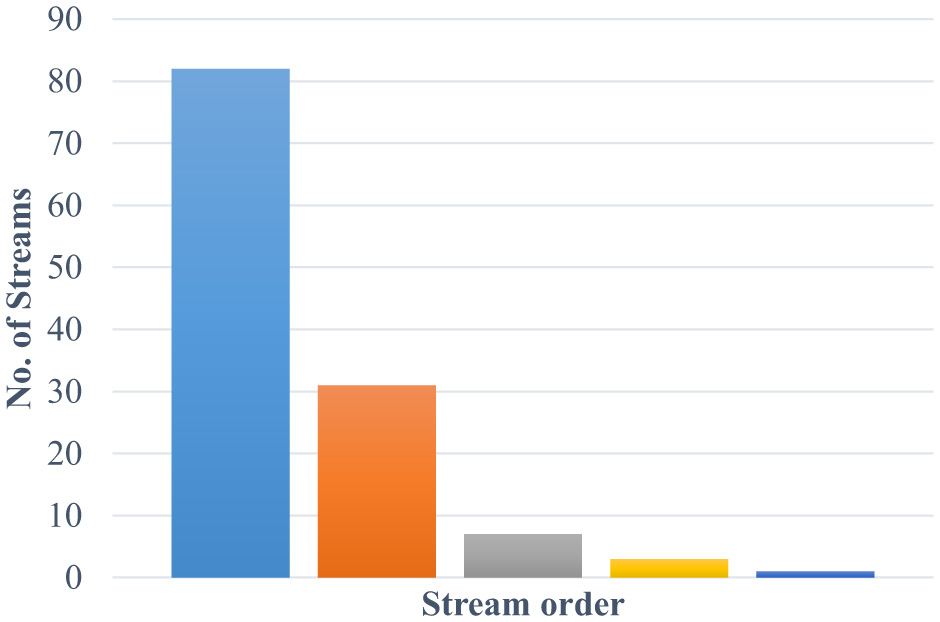
Number of streams of different order in the watershed.
Figure 4
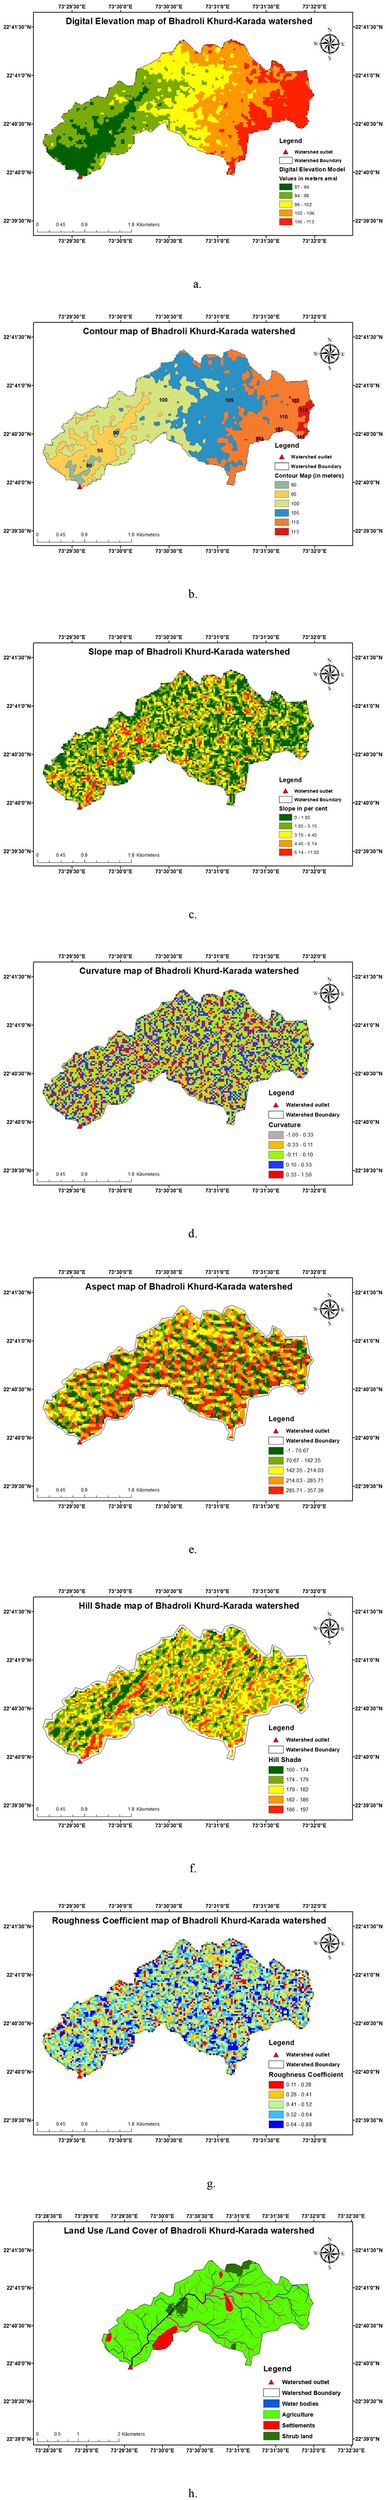
Morphometric characteristics of Bhadroli Khurd-Karada watershed. (a) Digital elevation model, (b) contour map, (c) slope map, (d) curvature map, (e) aspect map, (f) Hill shade map, (g) roughness coefficient map, and (h) land use/land cover map.
2.3 Soil and cropping pattern
The agro-ecological region no. 4 contains the Bhadroli Khurd-Karada watershed, which is characterized as a hot, semi-arid region with alluvium-based soils. The watershed has a growing season of 90–150 days, an average annual precipitation of 500–800 mm, and a potential evapotranspiration of 1,400–1,900 mm. The watershed has mixed granite and trap rock formation, and it has a wide variety of soil types. The fertility of the soils in the watershed varies from location to location, with “Goradu” soil being the most fertile. Maize, cotton, paddy, wheat, pigeon peas, and castor make up the majority of the watershed's arable land. These crops' relative profitability and ease of cultivation in accordance with land suitability were reflected in the notable area shift toward them.
2.4 Climate
Annual rainfall in the watershed occurs during the southwest monsoon season from June to September, with July being the highest rainfall month. The annual rainfall varies greatly from year to year. The minimum recorded rainfall is 259 mm and the maximum rainfall is 1,550 mm. The average rainfall is 1,026 mm in the watershed, which is very irregular and unpredictable in nature, with uncertain long dry periods leading to crop damage on a very large scale in some years. The humidity varies between 38% and 63%. The measured average wind speed is 16.30 km/h. The average amount of sunshine per year is 7.7 h per day. The temperature varies between 10°C and 44°C. December and January are the coldest months, while April and May are the hottest months of the year.
2.5 Land use
Table 2 shows the land use of the Bhadroli Khurd-Karada watershed. Only 1.2 ha (0.18%) of the watershed is irrigated during the Rabi season using groundwater from bore wells and dug wells within the watershed, while the remaining 425 ha (64.41%) of the watershed is rainfed and used for single crops. Horticulture or agroforestry systems cover 0.21 ha (0.03%) of the watershed. Approximately 6.23 ha (0.94%) of the watershed is made up of the current water bodies. Grazing land is present in 9.8 ha (1.49%) of the watershed. Three and a half hectares (0 and 58%) of the watershed are covered by open forest; 131.97 ha (20%) of the watershed is wasteland, and 81.64 ha (12.37%) is government-owned or panchayat land.
Table 2
| Land use | Area (in ha) | Area (%) |
|---|---|---|
| Single cropped (rainfed) | 425 | 64.41 |
| Double cropped | 1.2 | 0.18 |
| Agro-forestry/horticulture | 0.21 | 0.03 |
| Water body | 6.23 | 0.94 |
| Grazing land | 9.8 | 1.49 |
| Open forests | 3.8 | 0.58 |
| Govt./Panchayat land | 81.64 | 12.37 |
| Wasteland | 131.97 | 20.00 |
| Total | 659.85 | 100 |
Land use of Bhadroli Khurd-Karada watershed.
2.6 Morphometric parameters of watershed
Morphometric analysis helps to understand landform processes, hydrological behavior, and environmental management by quantifying watershed features such as stream network, slope, and relief. Planning for watersheds, land use, conserving soil, and estimating the risk of erosion all depend on this. It offers a thorough explanation of the physical characteristics of the watershed, which is crucial for comprehending its behavior. Predicting surface runoff, infiltration capacity, and groundwater potential is aided by morphometric analysis. It facilitates the evaluation of erosion and sedimentation by illuminating the connection between drainage networks and landforms. It backs soil conservation, erosion prevention, and land use planning. It supports natural resource management, flood frequency analysis, and drainage basin evaluation. Watersheds can be prioritized for conservation and management initiatives using morphometric metrics to evaluate erosion risk. The morphometric analysis of the watershed was carried out using the standard methods as described by Nehra et al. (2024), Sahoo et al. (2024), and Singh et al. (2023c).
There are many streams in the watershed, and the drainage system is well-established (Singh et al., 2023c). There may be little groundwater infiltration and quick runoff because of the high drainage density and stream frequency. Flood peaks are delayed but last longer because of the elongated shape. Soil erosion may occur in the area, particularly in areas with higher slopes. Because of the low relief, floods may last longer because water circulation is slow. The low form factor (0.05) and elongation ratio (0.24) both show that the watershed is extended, as shown in Table 3. Low infiltration and high runoff potential are indicated by high drainage density (40.26 km/km2) and stream frequency (18.82), which may be caused by an impermeable surface. The considerable relief indicated by the roughness number (0.64), erosion, and sediment transport may be substantial. In steep terrain, the Melton Ruggedness Number (6.23) suggests a risk of soil erosion, especially at steeper slopes. The compactness coefficient (1.22) and circularity ratio (0.52) indicate that the basin is relatively elongated, which results in a longer duration for peak discharge. A flat basin with moderate water movement is indicated by the low relief ratio (0) and gentle channel gradient (1.02 m/km), which may lessen erosion but lengthen flood duration, as shown in Table 3.
Table 3
| S. No. | Morphometric parameters | Method/formula | Reference | Result | Unit |
|---|---|---|---|---|---|
| Input parameters | |||||
| 1 | Main channel length (Cl) | GIS analysis | Length | 10.5 | km |
| 2 | Valley length (Vl) | GIS analysis | Length | 8 | km |
| 3 | Basin length (Lb) | GIS analysis | Schumm (1956) | 12 | km |
| 4 | Basin area (A) | GIS analysis | Schumm (1956) | 6.59 | km2 |
| 5 | Basin perimeter (P) | GIS analysis | Schumm (1956) | 12.6 | km |
| 6 | Longest dimension parallel to the principal drainage line (Clp) | GIS analysis | Length | 10 | km |
| 7 | Minimum aerial distance (Adm) | GIS analysis | Length | 8 | km |
| 8 | Length from watersheds center to mouth (Lcm) | GIS analysis | Black (1972) | 5 | km |
| 9 | Width of watershed at the center of mass WS@CM | GIS analysis | Black (1972) | 4.5 | km |
| 10 | Total contour length (Ctl) | GIS analysis | Length | 65,900 | m |
| 11 | Contour interval (Cin) | GIS analysis | Interval | 100 | m |
| 12 | Height of basin mouth (z) | GIS analysis/DEM | Height | 112 | m |
| 13 | Maximum height of the basin (Z) | GIS analysis/DEM | Height | 128 | m |
| A. Linear analysis | |||||
| 1 | Channel Index (Ci) | Ci = Cl/Adm (H&TS) | Miller (1953) | 1.31 | |
| 2 | Valley Index (Vi) | Vi = Vl/Adm (TS) | Miller (1953) | 1 | |
| 3 | Rho coefficient (ρ) | ρ = (Lur1/Rb1) + (Lur2/Rb2) + (Lur3/Rb3) +....+ (Lurn/Rbn) | Horton (1945) | 1.71 | |
| B. Areal analysis | |||||
| 1 | Mean basin width (Wb) | Wb = A/Lb | Horton (1932) | 0.55 | km |
| 2 | Relative perimeter (Pr) | Pr = A/P | Schumm (1956) | 0.52 | |
| 3 | Length area relation (Lar) | Lar = 1.4 * A 0.6 | Hack (1957) | 5.54 | |
| 4 | Lemniscate's (k) | k = Lb∧2/A | Chorley (1957) | 21.85 | |
| 5 | Form factor ratio (Rf) | Ff= A/Lb∧2 | Horton (1932) | 0.05 | |
| 6 | Shape factor ratio (Rs) | Sf = Lb∧2/A | Horton (1945) | 21.85 | |
| 7 | Elongation ratio (Re) | Re = 2/Lb*(A/π)∧0.5 | Schumm (1956) | 0.24 | |
| 8 | Ellipticity Index (Ie) | Ie = π*Vl∧2/4A | Schumm (1956) | 7.62 | |
| 9 | Texture ratio (Rt) | Rt = N1/P | Schumm (1956) | 6.51 | |
| 10 | Circularity ratio (Rcn) | Rcn=A/P | Strahler (1964) | 0.52 | |
| 11 | Circularity ratio (Rc) | Rc = 12.57*(A/P2) | Miller (1953) | 0.52 | |
| 12 | Drainage texture (Dt) | Dt = Nu/P | Horton (1945) | 9.84 | |
| 13 | Compactness coefficient (Cc) | Cc = 0.2841*P/A∧0.5 | Gravelius (1914) | 1.22 | |
| 14 | Fitness ratio (Rf) | Rf = Cl/P | Melton (1957) | 0.83 | |
| 15 | Wandering ratio (Rw) | Rw = Cl/Lb | Smart and Surkan (1967) | 0.88 | |
| 16 | Watershed eccentricity (τ) | τ = [(|Lcm∧2- Wcm∧2|)]∧0.5/Wcm | Black (1972) | 0.48 | |
| 17 | Hydraulic Sinuosity Index (Hsi) | Hsi = [(Ci-Vi)/(Ci-1)]*100 | Mueller (1968) | 1 | |
| 18 | Topographic Sinuosity Index (Tsi) | Tsi = [(Vi-1)/(Ci-1)]*100 | Mueller (1968) | 0 | |
| 19 | Standard Sinuosity Index (Ssi) | Ssi = Ci/Vi | Mueller (1968) | 1.31 | |
| 20 | Stream frequency (Fs) | Fs = Nu/A | Horton (1932) | 18.82 | |
| 21 | Drainage density (Dd) | Dd = Lu/A | Horton (1932) | 40.26 | km/km2 |
| 22 | Constant of channel maintenance | Unit A/Unit Lu | Schumm (1956) | 0.02 | km/km2 |
| 23 | Drainage intensity (Di) | Di = Fs/Dd | Faniran (1968) | 0.47 | |
| 24 | Infiltration number (If) | If = Fs*Dd | Faniran (1968) | 757.51 | |
| 25 | Length of overland flow (Lg) | Lg = A/2 *Lu | Horton (1945) | 874.16 | km |
| C. Relief Analysis | |||||
| 1 | Total basin relief (H) | H = Z–z | Strahler (1952) | 16 | m |
| 2 | Relief ratio (Rhl) | Rhl = H/Lb | Schumm (1956) | 0 | |
| 3 | Relative relief ratio (Rhp) | Rhp = H*100/P | Melton (1957) | 0.13 | |
| 4 | Channel gradient (Cg) | Cg = H/{(π/2)*Clp} | Broscoe (1959) | 1.02 | m/km |
| 5 | Gradient ratio (Rg) | Rg = (Z-z)/Lb | Sreedevi et al. (2005) | 1.33 | m/km |
| 6 | Watershed slope (Sw) | Sw = H/Lb | Degree | 1.33 | m/km |
| 7 | Ruggedness number (Rn) | Rn = Dd*(H/1,000) | Melton (1957) | 0.64 | |
| 8 | Melton Ruggedness number (MRn) | MRn = H/A∧0.5 | Melton (1965) | 6.23 | |
| 9 | Average slope (S) | S = (Z *(Ctl/H))/(10*A) | Wentworth's (1930) | 34.48 | |
| 10 | Mean slope of overall basin (Ѳs) | Ѳs = (Ctl*Cin)/A | Chorley and Dale (1972) | 1,000,000 | |
Morphometric analysis of Bhadroli Khurd-Karada watershed, Panchmahal, Gujarat.
3 Climate resilient practices implemented in watershed
To address the multifaceted problems observed during the participatory rural appraisal conducted in the watershed and for overall socio-economic development of tribal farmers, different interventions were implemented in the Bhadroli Khurd-Karada watershed for climate resilience of the watershed. The components of the watershed development plan, specific interventions, their quantity, and possible impacts on the watershed are given in Table 4. The watershed development intervention was carried out in an integrated and participatory manner with an emphasis on natural resource management, livelihood support, and capacity development. Capacity development activities such as farmer meetings, training programs, exposure visits, and awareness generation programs were conducted in association with nearby agriculture universities and research institutions to sensitize and empower the community toward sustainable practices. Water resource development works, such as gully plug and drop structure constructions, field bunding, spillway constructions, and lift irrigation, were designed based on topographical surveys and hydrological studies to maximize water conservation and use. Soil conservation practices, such as cover cropping, mulching, organic manuring, vermicomposting, and green manuring, were practiced in farmers' fields, as guided by soil tests and cropping calendars to conserve soil health and retain moisture. Demonstrations of high-yielding varieties, agroforestry systems, and horticulture plantations were carried out to enhance climate-resilient plant-based systems with protective functions such as bamboo planting and solar fencing to lower environmental stress and crop damage. Farm mechanization equipment, such as sprayers, irrigation pumps, tarpaulin sheets, and small tools, were provided to enhance efficiency in operations and lower labor burdens. Animal-based systems were also fortified through routine veterinary health camps, dispersal of mineral mixtures, fodder seeds, and dairy support machinery to increase livestock productivity. Livelihood interventions entailed the development of self-help groups, income-generating training, such as tailoring and raising a nursery, and provision of toolkits to facilitate rural employment. All interventions were conducted with active participation from local communities, NGOs, and stakeholders, under regular technical guidance in such a way that each activity was synchronized to the overall watershed management objectives to ensure sustainability, resilience, and enhanced livelihoods.
Table 4
| Component | Activities/interventions | Quantity | Impact |
|---|---|---|---|
| Capacity development programs | Farmer meetings | 25 meetings | Improved knowledge sharing and farmer engagement |
| Exposure visits to ICAR/SAUs | 10 visits | Enhanced awareness of best practices and innovation | |
| Farmers training programs | 10 trainings | Capacity building on modern farming and conservation techniques | |
| Farmers fairs | 2 fairs | Knowledge dissemination and community mobilization | |
| Skill development programs | 8 programs | Improved off-farm and farm-based livelihoods | |
| Awareness campaigns | 15 campaigns | Increased awareness of water, soil, and climate resilience practices | |
| Water resource development and conservation | Gully plugs | 40 structures | Reduced gully erosion and land degradation |
| Drop structures | 12 units | Controlled runoff and reduced soil erosion | |
| Field bunds with minor leveling | 150 ha | Enhanced in-situ moisture conservation and reduced water loss | |
| Peripheral bunding | 60 ha | Controlled runoff and improved soil stability | |
| Spillways for earthen bunds | 20 units | Safe disposal of excess runoff | |
| Construction of new open wells | 10 wells | Increased water availability for irrigation | |
| Renovation of existing open wells | 8 wells | Improved reliability and recharge potential | |
| Lift irrigation systems with pipeline | 6 systems | Assured irrigation and better water use efficiency | |
| Soil resource conservation measures | Cover crops | 15 ha | Reduced soil erosion and improved organic matter |
| Mulching | 8 ha | Conserved soil moisture and weed control | |
| Use of organic fertilizers | 200 farmers | Improved soil fertility and microbial activity | |
| Vermicomposting | 20 units | Recycling of organic waste and enhanced compost use | |
| Green manuring | 40 ha | Improved soil nitrogen and organic matter | |
| Vegetative grass barriers | 5 km | Reduced surface runoff and erosion | |
| Plant-based production systems | HYV crop seed demonstration | 65 ha | Increased yield and adoption of improved varieties |
| Agroforestry systems | 30 ha | Diversified income and enhanced resilience | |
| Horticultural plantations with tree guards | 20,000 plants | Income generation and land stabilization | |
| Bamboo for erosion control and gully protection | 10,000 plants | Gully stabilization and biomass production | |
| Farm mechanization and ergonomic efficiency | Knapsack sprayers for agro-chemicals | 50 units | Efficient pest and disease control |
| Single-phase electric pumps | 20 pumps | Improved water access for irrigation | |
| Winnowing fans | 50 units | Labor efficiency in post-harvest processing | |
| Tarpaulin sheets | 120 sheets | Reduction in post-harvest losses | |
| Solar fencing machines | 10 machines | Crop protection from stray animals | |
| Diesel engine pump-sets | 08 units | Expanded irrigation reach | |
| Flexible irrigation pipes | 2,000 m | Efficient water conveyance and distribution | |
| Chaff cutters | 25 units | Improved fodder processing and livestock feeding | |
| Small agricultural tools and implements | 250 kits | Improved efficiency in field operations | |
| Animal-based production systems | Animal health camps | 06 camps | Improved livestock health |
| Medicines and mineral mixtures | 1,500 kits | Enhanced livestock productivity | |
| Fodder seeds distribution | 20 ha | Increased fodder availability | |
| Milk cans for dairy farmers | 50 cans | Support for milk hygiene and marketing | |
| Livelihood and employment enhancement | Formation of self-help groups (SHGs) | 02 SHGs | Women empowerment and access to micro-finance |
| Support to water user groups (WUGs) | 08 groups | Improved irrigation governance | |
| Distribution of sewing machines | 50 machines | Non-farm income opportunities for rural households | |
| Promotion of kitchen gardening | 25 gardens | Improved household nutrition and food security | |
| Establishment of model nurseries | 01 nurseries | Income generation and local plant supply | |
| Provision of mason kits | 25 kits | Employment through construction and repair of SWC structures |
Watershed development interventions with quantity and impact.
4 Data, tools, and indices used for assessing the climate resilience of watershed
The evaluation of soil and water conservation (SWC) structures in a watershed for climate resilience is a multifaceted approach. Indicators related to vegetation, soil quality, water availability, and socioeconomic conditions are often part of the evaluation. The different indices developed by Chaves and Alipaz (2007), Sharda et al. (2012), and Kim and Chung (2014) for the impact assessment of watershed development projects were used to assess the climate resilience of watersheds, which are discussed below in detail. The data of different parameters used for assessing the climate resilience of the watershed were collected using various methods, as given in Table 5.
Table 5
| S. no. | Data source | Information generated | Method/tools | Utility |
|---|---|---|---|---|
| 1. | Survey of India (Administrative boundaries) | Index map | Arc GIS 10.3 Software | For showing the location of the study area |
| 2. | ASTER Global DEM (30 m) | Digital Elevation Model Flow Direction Flow accumulation Stream network Stream order Drainage Density Contour Slope Aspect Hill shade Roughness coefficient Curvature |
Arc GIS 10.3 Software | For the morphometric analysis of the watershed |
| 3. | Sentinel 2A (10 m) | Land use/Land Cover | Arc GIS 10.3 Software | For the land use/land cover of the watershed |
| 4. | ICAR-IISWC, Research Center-Vasad, Anand, Gujarat | Rainfall | Siphon-type recording rain gauge | For calculating the different indices for assessing the climate resilience of watershed |
| Runoff | Broad crested weir at the outlet of the watershed with stage level recorder | |||
| Soil loss | Runoff samples collected manually at the outlet of the watershed | |||
| Water harvested | Measured using the contour survey | |||
| Groundwater level | Measuring tape | |||
| Water demand for irrigation | Crop water requirement using CROPWAT | |||
| Water input for irrigation | Measuring the irrigation applied under the different crop field | |||
| Infiltration rates of soil | Double ring infiltrometer | |||
| Crop yield | Standard cropping cutting samples | |||
| Biomass | Standard allometric equations developed for different plants and dry matter for crops | |||
| House hold income | Farmers survey in the watershed |
Data source, information generated, tools used, and their utility in the study.
4.1 Soil Erosion Control Index (SECI)
The Soil Erosion Control Index (SECI) is a soil erosion measurement tool that utilizes the assessment of soil erosion reduced by the use of different soil conservation techniques in natural resource management. The SECI tool measures the soil erosion risks in the watershed as well as indicators of effective soil and water conservation measures for reducing the risk of soil erosion. It is particularly beneficial in sectors such as land and water management, forestry, and agriculture, where the mitigation of soil erosion risk is important for agricultural productivity, the health of the soil, and the sustainability of the environment. The Soil Erosion Control Index can be calculated using the Equation 1 given below.
Where SECI is the Soil Erosion Control Index (%), Abefore is annual soil loss before the installation of SWC structures (tons/ha/year), and Aafter is annual soil loss after the installation of SWC structures (tons/ha/year).
4.2 Water Harvesting Efficiency (WHE)
Water Harvesting Efficiency (WHE) is a metric used to evaluate the effectiveness of water harvesting systems that collect, store, and utilize surface runoff or rainwater. This index is especially invaluable in regions that regularly need to deal with limited water availability, where maximizing the use of all available water resources is essential for municipal, urban, and industrial consumption, agricultural production, and ecosystem health. It calculates the effective rainfall captured by water harvesting systems, considering losses due to overflow or collection failure. The Water Harvesting Efficiency of structures can be calculated using Equation 2 given below.
Where WHE is Water Harvesting Efficiency (%), Vharvested is the volume of water harvested by SWC structures (m3), and Vrainfall is the total volume of rainfall in the watershed (m3).
4.3 Water utilization efficiency (WUE)
Water utilization efficiency is the proportion of stored water that is efficiently used for its intended use, such as drinking, irrigation, and groundwater recharge. Any significant aquatic evaporation from storage induced by external climatic conditions or structural imperfections would lower the total efficiency of the harvesting system. In water-scarce regions, this index, which assesses the productivity obtained per unit of water used, is essential. The sum of all water applied to the crop or system through irrigation, rainfall, and other means and the desired outcome of water use are usually expressed in agricultural terms as yield per crop. The water utilization efficiency can be calculated using the Equation 3 given below.
Where WUE is the water use efficiency (kg/m3), crop yield (kg), and total water Input (m3).
4.4 Infiltration rates
In enhancing climate resilience via soil and water conservation measures, one of the aspects is the rate at which water enters and moves through the soil. Improved infiltration rates maintain vegetation, agricultural productivity, and ecosystem stability (particularly under climate stressors, e.g., droughts and extreme rainfall events) by supporting water retention and minimizing runoff when it is coupled with good soil quality traits such as soil organic matter content. Essentially, it tests the soil absorbency after SWC treatments. The use of cover crops and organic soil amendments reduces soil compaction and improves the content of organic matter and the structure of soil. It prevents soil erosion, increases soil water storage (less runoff), etc. The infiltration rates of soil under different land uses can be calculated using Equation 4 given below.
Where dwater is the depth of water infiltrated (mm) and t is the time taken for the water to infiltrate (hours).
4.5 Groundwater Recharge Index (GRI)
The replenishment of groundwater resources, conducted either through natural means or by artificial means, is determined using the GRI. This index needs to be specifically emphasized while assessing sustainable groundwater management in regions with overexploitation due to intensive agricultural practices, human population increases, or climatic changes that lead to little or no recharge. To some degree, it assesses how effective SWC structures are to enhance groundwater recharge. Recharge rates are influenced by the amount, timing, and distribution of rainfall. Infiltration is typically advanced by constant low or moderate-level rain, and it is heavy rain that results in loss of infiltration and promotes runoff. Soil and water conservation works reduce wastage by ensuring more moisture to infiltrate into the soil. The groundwater recharge index for the watershed can be calculated using Equation 5 given below.
Where GRI is the groundwater recharge index (%), Δ increase in groundwater level after SWC interventions (m3), and A is the area of the watershed (m2).
4.6 Runoff Reduction Index (RRI)
The Runoff Reduction Index (RRI) shows the effect of soil and water conservation measures in lowering surface runoff in a watershed. This index plays an important role in controlling surface runoff, preventing soil erosion, and reducing flood hazards in the watershed. The runoff rate in a watershed is affected by a set of major land uses (urban, agricultural, or forest). Infiltration rates and, therefore, runoff are influenced by compaction levels, soil structure, and texture. Well-structured soils have higher levels of organic matter and, because of that, are able to absorb more water, reducing runoff. The frequency, duration, and intensity of rainfall events directly impact the runoff. Equation 6 can be used to calculate the RRI, which measures the decrease in surface runoff brought on by SWC structures.
Where RRI is the Runoff Reduction Index (%), Rbefore is runoff before the SWC interventions (m3), and Rafter is runoff after the SWC interventions (m3).
4.7 Vegetation Restoration Index (VRI)
The Vegetation Restoration Index (VRI) is a metric designed to be evaluated and tracked across degraded or altered ecosystems to assess and gauge the efficacy of vegetation rehabilitation efforts. This index is especially important when assessing the success of reforestation, afforestation, and ecological restoration projects aimed at increasing ecosystem services, improving biodiversity, and stopping land degradation. The success of restoration is measured by an increase in vegetation cover. Restoration of this area will support ecosystems by having a wide range of plant species. The ability of replanted vegetation to deliver ecosystem services, including water retention, carbon sequestration, and serving as wildlife habitat. The vegetation restoration index can be calculated using Equation 7.
Where VRI is the vegetation restoration index (%), Cafter is the vegetation cover after SWC interventions (%), Cbefore is the vegetation cover before SWC interventions (%), and Ctotal is the total possible vegetation cover in the area (%).
4.8 Drought Resilience Index (DRI)
The Drought Resilience Index (DRI) measures the watershed's capacity to tolerate and recover from drought conditions by adjusting. This index is needed to plan for managing water resources, understand drought impacts, and improve ecological and agricultural resilience in watersheds susceptible to water scarcity. Plants are more likely to survive and produce during drought when the soil keeps more moisture. Healthy, diversified vegetation gives us returns from the water and stabilizes and protects against the drought effect because different root systems improve water uptake and maintain soil structure. The drought vulnerability index for the watershed can be calculated using Equation 8 given below.
Where DRI is the drought resilience index (%), Wavailable is available water during drought conditions (m3), and Wdemand is water demand during drought conditions (m3).
4.9 Land Productivity Index (LPI)
Land Productivity Index (LPI) is a measure of land productivity, computed as it relates to the quality of producing agricultural yield, plant growth, and ecological health. LPI is used extensively in land use planning, environmental management, and agriculture to assess land quality, track changes over time, and provide guidance for sustainable land management techniques. Water is always needed for plant growth, and when it is there at all times, plant growth and productivity get increased. The Land Productivity Index can be calculated using Equation 9 given below.
Where LPI is the land productivity (%), Yafter is crop yield after SWC interventions (tons/ha), and Ybefore is crop yield before SWC interventions (tons/ha).
4.10 Carbon Sequestration Index (CSI)
The Carbon Sequestration Index (CSI) is a metric that examines how much a set of ecosystems, land areas, or management practices can store carbon from the atmosphere. Since the index is so relevant to the global climate change issue, effective carbon sequestration not only acts to reduce greenhouse gas emissions, lower the CO2 levels of the atmosphere, and store carbon in the long term but also provides a great opportunity to sell carbon credits on the open market. Carbon storage capacities and rates vary by different ecosystems, such as forests, wetlands, grasslands, and agricultural lands. On average, forests absorb more carbon than grasslands or croplands. The carbon sequestration index can be calculated using the Equation 10 given below.
Where CSI is the carbon sequestration index, Bafter is the biomass after SWC intervention (tons), and Bbefore is the biomass before SWC intervention (tons).
4.11 Livelihood Improvement Index (LII)
The Livelihood Improvement Index (LII) is comprised of a single number that measures the quality and stability of the livelihoods of a community or region. Drawing on these factors, it evaluates factors that contribute to an individual or household's wellbeing, income security, and access to resources and helps us understand what poverty reduction, economic development, and social resilience mean. Sustainable practices mean that livelihoods can be maintained with the environment for a long time. The LII can be calculated using the Equation 11 given below.
Where LII is the livelihood improvement index, Iafter is the income after SWC interventions, and Ibefore is the income before SWC interventions.
4.12 Integrated Climate Resilience Index (ICRI)
The Integrated Climate Resilience Index (ICRI) is a composite index being used to measure component-level resilience of communities, ecosystems, and infrastructure to the impacts of climate-related hazards. ICRI combines different indicators that measure the extent of exposure, sensitivity, and adaptive capacity of an area to respond to climate impacts, including extreme weather events, sea level rise, and changes in agricultural conditions. It measures economic diversification, income, social cohesion, and employment security. To obtain an overall assessment of climate resilience, a weighted composite index can be developed using the Equation 12 given below.
Where ICRI is the Integrated climate resilience index, Ii is the individual index value, and wi is the weight assigned to each index based on its relative importance to climate resilience.
5 Results and discussion
5.1 Soil Erosion Control Index (SECI)
The climate resilience of the watershed was assessed through different indices after the implementation of different soil and water conservation measures. SECI measures the effectiveness of reducing soil erosion by soil conservation structures/measures in the watershed. The SECI is applied in watershed management, where soil erosion prevention is essentially required to preserve soil productivity, soil health, and sustainability. Rainfall in the watershed varied from 820 mm in 2021 to 850 mm in 2023, which was not significant. However, the number of rainy days has decreased from 38 to 32, and rainfall intensity has increased significantly from 75 mm/day to 125 mm/day in the watershed. A higher SECI was observed with an increase in the vegetation cover and soil and water conservation practices applied in the watershed, as shown in Table 6. The variations in rainfall exaggerate the amount of soil erosion, but the effects can be minimized by soil and water conservation. Contour bunding and minor leveling in 64 ha in the farmer's field reduced the slope factor from 4 in 2021 to 3 in 2023 to decrease the risk of erosion in the watershed and reduce the SECI. The average gully slope pre- and post-project in different stream orders of the watershed is shown in Figure 5. The reduction in gully slope was observed in all the stream orders due to the construction of new drainage line treatment structures in the watershed, such as 06 gully plugs, 2500 m of peripheral bunding for protection of gully heads, and 10 drop structures resulting in the reduction of soil loss from the watershed. Besides, several temporary structures, such as earthen bunds and bund outlets, were constructed and repaired during the project period. The improved crop yields were observed in the farmer's field near these drainage line treatment structures due to the increased availability of water for irrigation to the crops and an improvement in the soil moisture in the crop fields. A number of water user groups were created based on a diesel pump set-based lift irrigation system with the underground pipeline, besides the drop structures, to improve the irrigation facilities and water use efficiency in the watershed. The average annual soil erosion measured by averaging the soil loss observed in the runoff samples at the outlet of the watershed from 2021 to 2023 decreased significantly from 12.0 t/ha/year in 2021 to 6.0 t/ha/year in 2023, which is similar to the findings reported by Senanayake and Pradhan (2022). This shows the effectiveness of the implemented erosion control measures in the watershed. The impact of increasing erosion control measures from 30% of the watershed area in 2021 to 50% of the watershed area in 2023, as shown in Table 6. The agricultural land use changes were found to increase from 55% to 65% vegetation cover in the watershed due to an increase in the water availability in the watershed, which is similar to the findings reported by Wang et al. (2023). The improvement in the farmers' knowledge and skills, as well as the adoption rate, has led to preventing soil erosion due to the number of training sessions imparted to farmers of watershed on soil conservation. In comparison to 2021, soil and water conservation measures taken on watersheds have greatly improved the Soil Erosion Control Index from 68 to 80 in 2023, implying the effect of soil and water conservation practices on soil erosion. According to Kumar et al. (2016), the most successful soil conservation method in the Babina watershed of Bundelkhand was the use of Saccharum munja vegetative barriers, which were followed by land leveling, field bunding, and contour bunding. According to Sahoo et al. (2018), bioengineering techniques such as earthen bunding with broom grass successfully decreased runoff in Odisha's sloping plains to 11.6% from 24.5% under traditional farming. In the Mahi Ravine Watershed in Gujarat, contour bunding and bench terracing greatly decreased soil erosion and runoff in sapota orchards (Kumar et al., 2020a,b).
Table 6
| Year | Rainfall (mm) | Vegetation cover (%) | Soil conservation measures (%) | Slope factor (1–5) | Erosion Control Index (SECI) |
|---|---|---|---|---|---|
| 2021 | 820 | 55 | 30 | 4 | 68 |
| 2022 | 780 | 60 | 40 | 3 | 72 |
| 2023 | 850 | 65 | 50 | 3 | 80 |
Soil Erosion Control Index of Bhadroli Khurd-Karada watershed.
Figure 5
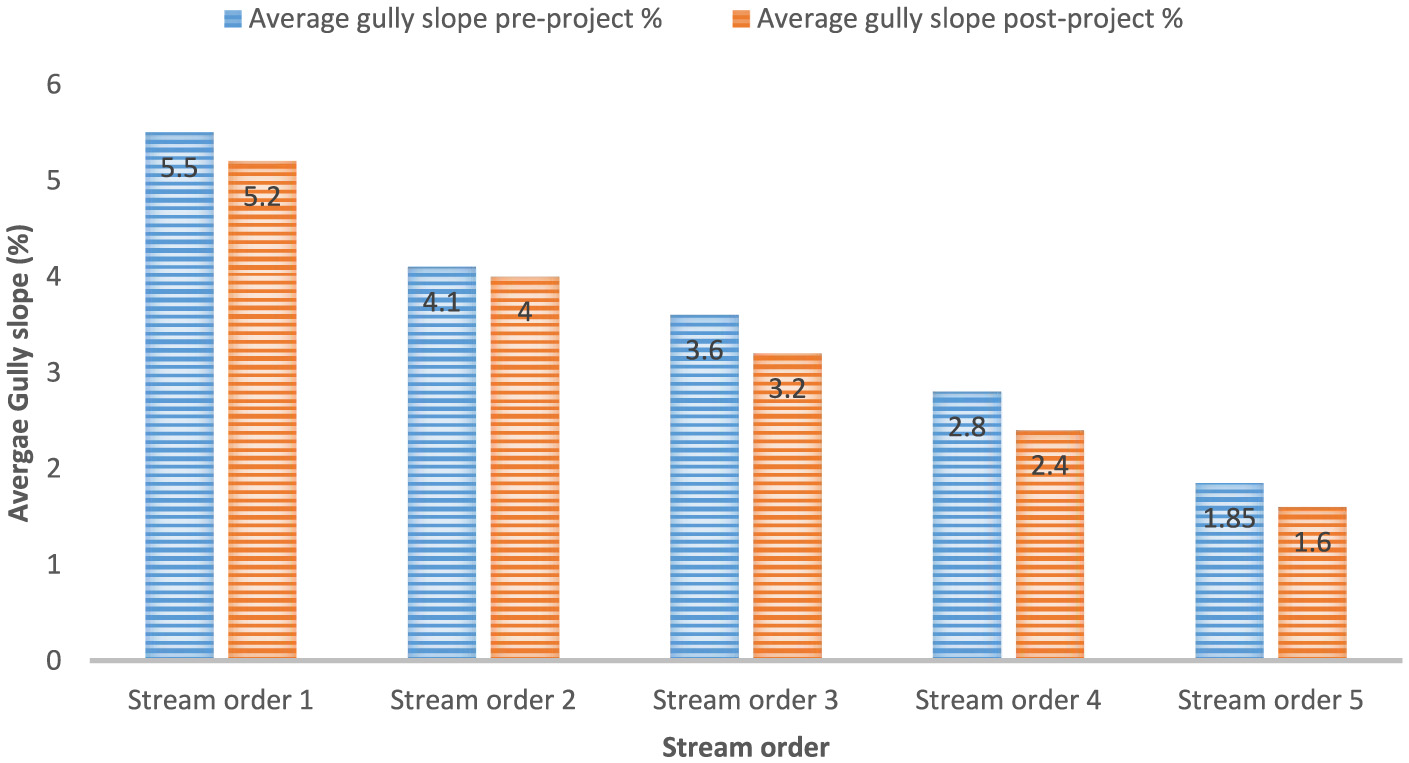
Average gully slope pre- and post-project in Bhadroli Khurd-Karada watershed.
5.2 Water Harvesting Efficiency (WHE)
Water Harvesting Efficiency (WHE) metric is the efficiency of water harvesting systems created in watersheds to collect, store, and use rainwater or runoff in the watershed for different purposes in the watershed. In arid and semi regions where water scarcity is a threat, this index is indispensable for dispersing the available water resources to irrigation, agriculture, domestic uses, and other ecological services of the watershed (Sikka et al., 2022). The improved collection of runoff generated in the watershed has increased slightly from 820 mm in 2021 and 850 mm in 2023, possibly indicating improved rainfall patterns. However, a number of water harvesting structures were created in the watershed, and the existing open wells used for irrigation and drinking purposes were renovated resulting in an increase in storage of harvested rainwater and a 40% growth of the water storage capacity from 25,000 m3 in 2021 to 35,000 m3 in 2023, as given in Table 7. The water storage capacity increased from 40,000 m3 to 50,000 m3, and the demand also increased from 50,000 m3 to 55,000 m3 due to an increase in crop acreage during the Kharif and Rabi seasons in the watershed. The farming community in the watershed is becoming more efficient in the use of the harvested water for both agricultural and domestic purposes through the installation of an underground pipeline with a lift irrigation system, so the water use efficiency has risen from 55% to 65%, which is also shown in a study conducted by Garg et al. (2020). It shows a growing number of water user group members participating in water harvesting initiatives in the watershed, from 65 to 250. The overall success was observed in the water harvesting strategies in the drainage line of the watershed through construction of new drop structures, which has increased Water Harvesting Efficiency from 50% in 2021 to 64% in 2023, supported by a similar finding in a study conducted by Jain et al. (2024). According to Phand et al. (2007), an integrated watershed initiative in Hiware Bazar raised the standard of living for farmers by increasing milk production, fodder supply, and water availability. To stop erosion and collect 28,950 m3 of runoff water, check dams were built in the Shekta watershed in Maharashtra. Over the course of 4–8 months, this intervention created 48% more wells overall, 51% more wells that were seasonally functioning, and 128% to 223% more wells that were perennially operating (Wani et al., 2011).
Table 7
| Year | Annual rainfall (mm) | Harvested water volume (m3) | Total storage capacity (m3) | Water demand (m3) | Water Harvesting Efficiency Index (WHEI) (%) |
|---|---|---|---|---|---|
| 2021 | 820 | 25,000 | 40,000 | 50,000 | 50% |
| 2022 | 780 | 30,000 | 45,000 | 52,000 | 58% |
| 2023 | 850 | 35,000 | 50,000 | 55,000 | 64% |
Water Harvesting Efficiency Index of Bhadroli Khurd-Karada watershed.
5.3 Water utilization efficiency (WUE)
The efficiency of stored water is assessed by water utilization efficiency or the amount of stored water used for its intended purpose, e.g., irrigation, drinking, or groundwater recharge. Water losses due to seepage and evaporation are unavoidable factors that lead to poor water utilization efficiency. In semi-arid areas where water conservation is important, this index allows for the estimate of productivity gained per unit of water used and for comparison between areas of different productivity per unit of water used. The key factor that has increased water utilization efficiency in the watershed was the creation of organized water users group, which has led to judicious utilization of stored water in the structures similar to the finding reported by Singh et al. (2009). The installation of an underground pipeline network of 5,280 m with multiple outlets in the farmer's field has reduced the water losses due to the conveyance of irrigation water to the crop fields. The agricultural activities and the expansion in irrigated areas have increased the volume of water used for irrigation to 46,000 m3 in 2023 as compared to 38,000 m3 in 2021, as given in Table 8. The average crop yield has increased from 2.5 tons/ha in 2021 to 3.0 tons/ha in 2023, which shows a positive trend in the land productivity of the watershed, as also reported by Rao et al. (2014). This also implies that water use efficiency (relative to crop productivity) is increasing, perhaps related to improved irrigation management practices and crop management, as supported by similar findings by Sikka et al. (2018). The growth of irrigated area in the watershed is observed to have increased from 100 ha to 120 ha during the 3 years, partly due to the improvement of the access to irrigation resources, which explains the overall agricultural productivity. Water utilization efficiency in terms of tons of crop yield per cubic meter of water used improved from 1.67 tons/m3 in 2021 to 1.76 tons/m3 in 2023. This is a more enticing water return for irrigation, as was observed by Sikka et al. (2018). The water utilization efficiency index has increased from 45% in 2021 to 60% in 2023, due to the efficient utilization of irrigation water by the farmers in the watershed.
Table 8
| Year | Water supply (m3) | Water usage (m3) | Water demand (m3) | Water Utilization Efficiency Index (WUEI) (%) |
|---|---|---|---|---|
| 2021 | 55,100 | 38,000 | 56,000 | 45 |
| 2022 | 64,680 | 42,000 | 65,000 | 54 |
| 2023 | 73,600 | 46,000 | 75,000 | 60 |
Water utilization efficiency index of Bhadroli Khurd-Karada watershed.
5.4 Infiltration rates
The infiltration rates of land use are a key factor in enhancing climate resilience through soil and water conservation measures in the watershed. The improved infiltration rates hold water more effectively, decrease surface runoff, and help keep soils saturated, all of which are critical for sustaining agricultural productivity under climate extremes such as drought or heavy rainfall (Kumar et al., 2022; Sinha et al., 2023). The organic fertilizer was distributed to the selected farmers as an input for the demonstration of high-yielding varieties in the watershed. The organic material added to the soil from the crop residues and cover crops has improved soil structure, increased organic matter, and reduced soil compaction, which were also reported by Choudhury et al. (2022). The infiltration rates measured for different land uses in the watershed from 2020 to 2023 are shown in Figure 6. The infiltration rates has increased from 15.2 to 16.3 mm/h for maize crop, which shows the impact of increased addition of crop residues in the soil. The infiltration rates for Pigeon Pea, Sorghum, Cotton, Castor, Wheat, Okra, Chili, and Tomato remain almost constant. The infiltration rates in the Brinjal crop field were observed lowest at approximately 4.68–4.9 mm/h, followed by the Mango plantation with an infiltration rate of 5.05 mm/h and Lime at 5.1 mm/h. Paddy remains stable at ~5.6 mm/h, which may be due to less incorporation of crop residues in these crops and soil preparation techniques, such as puddling employed in the paddy fields, supported by the findings of Sahu and Siddha (2022) (Chinnasamy et al., 2021). The 4-year trend of infiltration rate under different land uses generally shows an increasing trend, which shows the impact of organic soil amendment supplied to the farmers for the crop demonstrations. This trend is a positive indication of improved soil structure and management practices, less runoff, and better water retention. The field bunds and leveling in the crop field have slowed down water movement across the sloped land, which provides more time for runoff to infiltrate. The contour plowing across the slope of the land, which was demonstrated to the farmers, has resulted in better interception of runoff across the land slope in the watershed. The demonstration of conservation tillage methods has reduced soil disturbance, kept soil in good structure, and promoted organic matter and root network development (Jat et al., 2025). The adoption of good practices of cultivation has resulted in more infiltration, reduction in soil compaction, and an increase in soil porosity. The rainfall and runoff interception and runoff flow were reduced by incorporating trees through agroforestry systems and providing vegetative barriers in agricultural fields (Jinger et al., 2022). The perennial trees and shrubs' roots create channels for the entry of water into the soil, resulting in better soil moisture in the soil profile, the addition of leaf litter for the improvement in soil organic matter, and soil cover for protection against the raindrops or splash erosion in the agricultural fields (Jinger et al., 2024). Additionally, several parameters, including canopy cover, root system dispersion, and soil SOC condition, primarily affected soil moisture and infiltration rate (He et al., 2020). According to Kumar et al. (2015), sweet potatoes' capacity for deep roots enhanced the porosity and structure of the soil and decreased runoff loss by increasing the rate of infiltration.
Figure 6
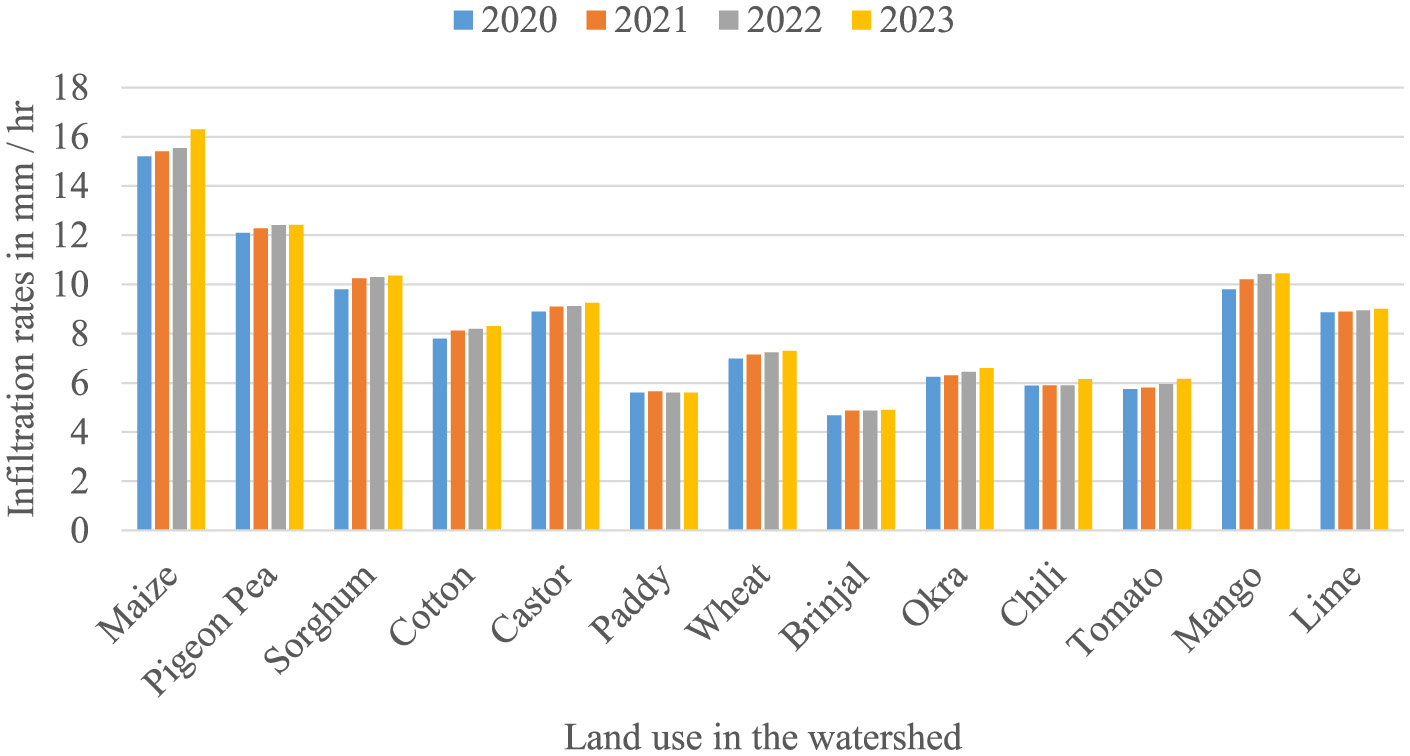
Changes in the infiltration rates of different land uses in Bhadroli Khurd-Karada watershed.
5.5 Groundwater Recharge Index (GRI)
This index is necessary for assessing the sustainability of groundwater in arid and semi-arid regions having hard rock formation at high threat of groundwater susceptibility to climate change, population growth, or intensive agriculture because of over-extraction of groundwater or low natural recharge rates in the watershed (Siddha and Sahu, 2024). The high infiltration rates increase groundwater recharge potential, and impermeable or compacted surfaces decrease recharge potential. The dense vegetation also reduces surface runoff, providing more opportunity time for the water to infiltrate and reach groundwater levels, as reported by Chinnasamy et al. (2015). The flat topography in the watershed provides more opportunity for the runoff to infiltrate into the soil and contribute to groundwater. The quantity, frequency, and distribution of rainfall affect the groundwater recharge rates in the watershed, as demonstrated by Patel et al. (2020). The soil infiltration is often driven by rainfall, surface runoff, and intense downpours due to changing rainfall patterns, as reported by Sahu and Siddha (2022). The rainfall varied slightly from 2021 to 2023, but the number of rainy days has decreased from 38 to 32, and rainfall intensity has increased significantly from 75 mm/day to 125 mm/day in the watershed. The effective recharge coefficient for the watershed improved from 0.15 in 2021 to 0.16 in 2023. The slight increase in the effective recharge coefficient may be due to the number of water storage structures created in the watershed and the improvement in the infiltration rates of the soil, as also reported by Siddha and Sahu (2023). These water management strategies lead to increased storage of runoff from 810,903 m3 in 2021 to 897,396 m3 in 2023, providing resilience against the impacts of drought and water scarcity in the watershed in line with the similar finding reported by Siddha and Sahu (2023). The average groundwater depth in the watershed has increased from 10.6 m in 2021 to 4.2 m in 2023 across the watershed, as is shown in Figure 7, which was due to the additional storage created behind the structures in the drainage line of the watershed and implementation of artificial groundwater recharge filters in the watershed. The improvement in the groundwater recharge was possible during the project period due to an increase in the average infiltration rates from 4.5 mm/h to 6.5 mm/h in the watershed. The watershed's improved capacity to recharge its groundwater resources and respond to changing climatic patterns are emphasized by the GRI, which increased from 67.6 in 2021 to 69.0 in 2023, as is given in Table 9. In a similar vein, Singh et al. (2023b) found that the installation of runoff filters raised the village's average groundwater table by 1.84 m, but it also reduced rainfall in the farmer's field by 115 mm, compared to the average annual rainfall of 845 mm in Gujarat's Halol taluka of Panchmahal district. Additionally, Singh et al. (2023a) found that recharge filters also improved well discharge and prolonged water availability. In the Vejalpur-Rampura watershed in Kapadvaj Taluka, District-Kheda, Gujarat, the average water table rose by 0.84 m, allowing farmers to irrigate the rabbi crops.
Figure 7
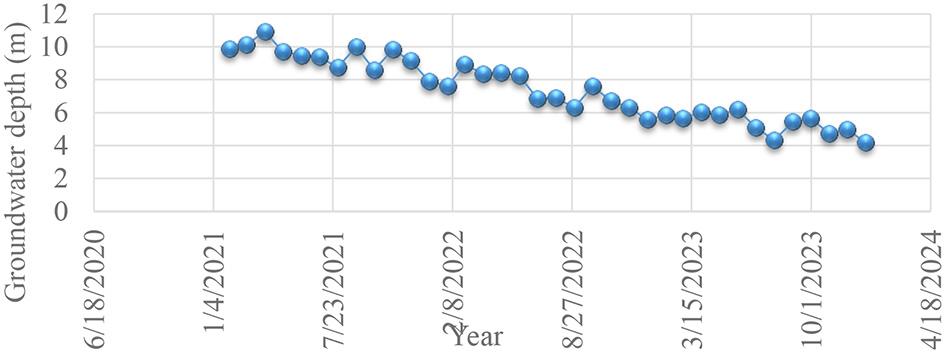
The variation of groundwater depth in the watershed from 2021 to 2023.
Table 9
| Year | Annual rainfall (mm) | Effective recharge coefficient | Recharge volume (m3) | Groundwater demand (m3) | Groundwater Recharge Index (GWRI) (%) |
|---|---|---|---|---|---|
| 2021 | 820 | 0.15 | 810,903 | 1,200,000 | 67.6 |
| 2022 | 780 | 0.14 | 720,285 | 1,250,000 | 57.6 |
| 2023 | 850 | 0.16 | 897,396 | 1,300,000 | 69.0 |
Groundwater recharge index of Bhadroli Khurd-Karada watershed.
5.6 Runoff Reduction Index (RRI)
Runoff Reduction Index (RRI) is an index to measure the performance of various conservation measures in reducing surface runoff in watersheds. This index is important for water resource management, soil erosion control, and flood mitigation in watersheds. A significant variation in runoff rates, which is attributed to different land uses in the watershed, was reported by Singh et al. (2019b). The watershed having dense vegetation has lower runoff compared to urban areas having impervious surface and compact soil, as shown by Sahu and Siddha (2022). The runoff generated from a watershed depends on soil infiltration rates, soil texture, soil structure, and the compaction levels, as illustrated by Tiwari et al. (2013). The high organic matter content results in well-structured soils that have the capability to absorb more water and less runoff potential. Runoff is directly related to the rainfall intensity, duration, and frequency in a watershed, as explained by Chinnasamy et al. (2021). The high-intensity rainfall is more likely to become runoff than a prolonged rainfall event of low intensity. The shape and the slope of the watershed determines how quickly the runoff travels over the surface and joins the streams of the watershed, as also shown by Tiwari et al. (2013). The watershed practices, such as field bunding with minor leveling, cover crops, and agroforestry systems, can significantly increase infiltration rates and reduce runoff, as reported by Chinnasamy et al. (2021). The total rainfall in the watershed increased by 30 mm in 2023, upsiding the opportunities for runoff management. Significantly reducing the surface runoff and water infiltration practices resulting in runoff volume reduction from 539,897 m3 in 2021 to 482,381 m3 in 2023, indicating successful implementation of field bunding, cover crops, and agroforestry systems, as well as artificial groundwater recharge measures that take advantage of water infiltration. From 2021 to 2023, the watershed's capacity to manage and reduce runoff effectively increased, with the RRI improving from 28.60 in 2021 to 23.90 in 2023, as shown in Table 10. Comparing the sole tree and agroforestry practices to sole crops, the total soil loss also decreased by 63% and 37.7%, respectively (Jinger et al., 2022). The same pattern was seen in the average annual soil loss. Compared to a solitary crop, the soil in the agroforestry and sole tree systems was less exposed and disturbed since zero and strip tillage (conservation tillage) were used in these treatments, respectively. Additionally, in lone tree and agroforestry systems, the canopy of crops and trees decreased raindrop kinetic energy, decreased soil dislodging and dispersion, and increased the stability of soil aggregates (Yong et al., 2006). Prior research also supports reduced runoff in agroforestry systems, which help to preserve soil productivity and quality (Adhikary et al., 2017; Beliveau et al., 2017).
Table 10
| Year | Annual rainfall (mm) | Runoff coefficient (before) | Runoff coefficient (after) | Potential runoff volume (m3) | Reduced runoff volume (m3) | Runoff Reduction Index (RRI) (%) |
|---|---|---|---|---|---|---|
| 2021 | 820 | 0.35 | 0.25 | 1,889,637 | 1,349,740 | 28.6 |
| 2022 | 780 | 0.34 | 0.24 | 1,779,741 | 1,269,409 | 28.7 |
| 2023 | 850 | 0.36 | 0.26 | 2,022,246 | 1,539,865 | 23.9 |
Runoff Reduction Index of Bhadroli Khurd-Karada watershed.
5.7 Vegetation Restoration Index (VRI)
This index measures the vegetative restoration efforts on degraded or wastelands in the watershed. The vegetation health and growth rates in the watershed as measured by height, biomass, and leaf area show the successful restoration efforts as reported by Bhatt et al. (2023). Soil health improvements related to restoration activities, such as increased organic matter, enhanced nutrient levels, and soil structure, improved in the watershed. Vegetation restoration has the ability to sequester carbon, retain water, and provide habitat for essential flora and fauna for ecosystem service, as reported by Thakkar et al. (2017). Table 9 provides data on different types of land use, showing areas as of 2020, improvements in vegetation area from 2021 to 2023, and the Vegetation Restoration Index (VRI) percentage, which indicates the relative change in vegetation for each land use. The vegetation cover in single-cropped land use increased by 16.06 ha in the watershed, which leads to a positive change of 3.78% in the VRI, as given in Table 11. The increase in single-cropped areas in the watershed was due to an increase in the irrigated area due to increased water harvesting structures in the watershed, as reported by Bandyopadhyay et al. (2016). There was a tremendous increase in the double-cropped area by 75.72 ha in 2023 as compared to 1.2 ha during 2020, which is due to the increase in the water availability during the Rabi season. The installation of an underground pipeline system with a lift irrigation system was created for five water user groups of farmers in the watershed, with a total of 250 farmers beneficiaries through the watershed program implemented under the TSP program. A significant increase in the vegetation restoration index was observed, as the area under agroforestry and horticulture increased from 0.21 ha in 2020 to 11.02 ha in 2023, showing the concentrated effort of plantation activities and crop intensification in the watershed. The area under the water bodies also increased from 6.23 ha to 7.47 ha due to the creation of water harvesting structures in the drainage channel passing through the watershed. However, the wastelands in the watershed declined by 27.1 ha, followed by grazing land by 4.01 ha and government land by 1.06 ha. This indicates a shift toward sustainable or intensified agriculture practices, potentially to improve agricultural productivity in the watershed due to increased water availability for irrigation. Afforestation initially decreases vegetation richness and changes composition compared to grasslands; however, there is a significant comeback after thinning and tree harvest, according to Six et al. (2014). According to earlier studies, overall vegetation richness declines as tree cover increases (Alrababah et al., 2007). Similarly, total species richness declined during afforestation.
Table 11
| Land use type | Area in 2020 (ha) | Improved vegetation area (ha) | Total | Vegetation Restoration Index (VRI) (%) | ||
|---|---|---|---|---|---|---|
| Year | 2021 | 2022 | 2023 | Percentage change | ||
| Single-cropped | 425 | 3.24 | 4.26 | 8.56 | 16.06 | 3.78 |
| Double-cropped | 1.2 | 12.64 | 22.46 | 40.62 | 75.72 | 6,310.00 |
| Agroforestry/ horticulture | 0.21 | 0.02 | 4.8 | 6.2 | 11.02 | 5,247.62 |
| Water body | 6.23 | 0.2 | 0.46 | 0.58 | 1.24 | 19.90 |
| Grazing land | 9.8 | −0.39 | −1.22 | −2.4 | −4.01 | −40.92 |
| Open forest | 3.8 | 0 | 0 | 0 | 0 | 0.00 |
| Government land | 81.64 | −0.02 | −0.46 | −0.58 | −1.06 | −1.30 |
| Wasteland | 131.97 | −3.26 | −9.06 | −14.8 | −27.1 | −20.52 |
| Total | 659.85 | |||||
Vegetation restoration index of Bhadroli Khurd-Karada watershed.
5.8 Drought Resilience Index (DRI)
This metric is used for assessing the ability of watersheds to cope with, adapt to, and recover from drought conditions. This index is crucial for interpreting drought impacts, planning water management, and promoting water resource, as well as agricultural and ecological resilience in the watershed, as reported by Singh et al. (2019b). It estimates the number of available water resources in the watershed in a water storage infrastructure that could support the needs of the watershed during drought, as explained by Bhukya et al. (2023). It also measures soil capacity to hold water, and includes the ability of soil type, the content of organic matter, and the land management practice, as reported by Shah et al. (2021). Plant survival and productivity in the face of drought are, in part, explained by higher soil moisture retention. Vegetation that is healthy and diverse acts as a steadying force and as a buffer to drought impacts, as diverse root systems better take up water and help provide soil structure. The sustainable practices that were used in agriculture are no-till farming, crop rotation, and mulching, which help to improve soil's condition, decrease water need, and also make the land to be more drought resilient, as shown by Bandyopadhyay et al. (2016). The agroforestry system was implemented in the watershed, which provided resilience to cope against frequent dry spells in the watershed. The water harvesting and recycling through a lift irrigation system, created in the watershed, and the climate resilient varieties of crops were introduced to mitigate the drought effects, which was also reported by Singh et al. (2019a). The total annual rainfall in the watershed increased slightly from 820 mm in 2021 to 850 mm in 2023, resulting in the overall water availability from 8,50,000 m3 in 2021 to 8,80,000 m3 in 2023, in which led to improved crop productivity in the watershed. Soil moisture levels are, on average, 3% higher than they were in 2021 at 68%, which translates to a better soil's ability to hold water and support vegetation, even during dry times. The agricultural productivity has also increased from 1,200 kg/ha in 2021 to 1,800 kg/ha in 2023, making food security important during droughts. The DRI has increased substantially, increasing from 68.3 to 70.0 over the period of 2021 to 2023, demonstrating higher overall resilience of the watershed to drought impacts, as given in Table 12. Furthermore, Hussain et al. (2018) noted that the importance of K and Zn in improving WUE and overcoming drought is widely acknowledged under water availability and water shortage. Reduced transpiration and better leaf rolling resulted from the balanced K application in maize under normal and 30% water deficit conditions. This improved drought tolerance, reduced irrigation water use, and increased WUE by 30.0% when compared to when K was not applied (Martineau et al., 2017). In a similar vein, crop diversification via double cropping (maize-horsegram) and intercropping (groundnut+pigeonpea) was proposed as a very helpful strategy for improving rainwater use efficiency, along with drought mitigation and yield stabilization in Odisha's upland rice ecosystem (Kar et al., 2004).
Table 12
| Year | Annual rainfall (mm) | Soil moisture retention (%) | Crop yield stability (%) | Water availability (m3) | Drought Resilience Index (DRI) |
|---|---|---|---|---|---|
| 2021 | 820 | 65 | 70 | 850,000 | 68.3 |
| 2022 | 780 | 60 | 65 | 820,000 | 63.3 |
| 2023 | 850 | 68 | 72 | 880,000 | 70.0 |
Drought resilience index of Bhadroli Khurd-Karada watershed.
5.9 Land Productivity Index (LPI)
Land Productivity Index (LPI) is a quantitative measure of productive land capacity to support plant growth and maintain agricultural yield and ecological health, as also reported by Choudhury et al. (2022). Land productivity in the watershed has been gradually expanding each year with a consequent expansion of the cultivated area. It is evident that productivity is increasing each year due to better agricultural practices, crop selection, or input, in agreement with similar findings reported by Kumar and Raj Gautam (2014). The trend toward improving soil fertility and LPI is congruent with successes in land and crop management. Continuous increase in soil fertility improvement could be associated with changes in soil management practices, i.e., crop rotation, diversification, and organic amendments, also reported by Abeysingha et al. (2016). The water availability from rainfall has gone slightly down in 2022 but increased in 2023. The variability may be due to climate, water conservation efforts, or changes in water demand. However, the increase in 2023 could be the result of better management of water resources, which should, in turn, be better for crop yields. In 2022, the amount of water that became available fell, but crop yields nevertheless remained high. That means the system could withstand some moderate fluctuations in water supply, because of perhaps, efficient water management or the use of drought-tolerant varieties of crops, as also reported by Meena et al. (2022). Further yield improvement was likely supported by increased water availability in 2023. The LPI increases steadily, accompanying improved productivity of the land. It concurs with patterns of cultivated area expansion, crop improvement, and soil fertility improvement, as given in Table 13. The productivity of the degraded ravine land was enhanced by the dragon fruit-based horti-silviculture system, according to Jinger et al. (2024), which increased net returns (30,705 USD/ha) and gross returns (48,127 USD/ha) in comparison to the other treatments. According to Chandana et al. (2020), the agri-silviculture system of Melia + pearl millet in the rainfed region of Andhra Pradesh, India, also produced higher gross and net revenue with a B:C ratio of 3.71. Similarly, in Karnataka state, India, finger millet with Melia dubia produced higher net returns with a B:C ratio of 3.96 compared to other multipurpose tree species-based agroforestry systems, according to (Anusha et al., 2015).
Table 13
| Year | Total cultivated area (ha) | Average crop yield (t/ha) | Soil fertility improvement (%) | Water availability (m3) | Land Productivity Index (LPI) |
|---|---|---|---|---|---|
| 2021 | 425 | 1.2 | 5 | 850,000 | 70.3 |
| 2022 | 430.20 | 1.6 | 6 | 820,000 | 72.6 |
| 2023 | 441.06 | 1.8 | 7 | 880,000 | 75.3 |
Land Productivity Index of Bhadroli Khurd-Karada watershed.
5.10 Carbon Sequestration Index (CSI)
CSI is a measure to assess how well a watershed is at storing carbon from the atmosphere. In the context of climate change, this is an essential index, as it is through effective carbon sequestration to mitigate greenhouse gas emissions, lower atmospheric CO2, and long-term carbon storage. It measures the amount of carbon that is stored in above-ground (trees and shrubs) and below-ground (roots), as reported by Kumar (2023). Increasing carbon sequestration includes conservation practices such as no-till farming, agroforestry, reforestation, and cover cropping. To the contrary, activities such as deforestation or soil degradation lower sequestration potential. Carbon storage in different ecosystems (forests, wetlands, grasslands, and agricultural lands) has different storage capacities and rates, as explained by Kumar (2023). In general, wetlands and forests sequester more carbon than grasslands and croplands do. Carbon sequestration rates have moderately improved in cropland and horticulture lands use for the 2 years and are believed to be a result of improved land and crop management, as given in Table 12. Even as forest land use continues to sequester the most carbon, they have also improved slightly, perhaps because of continuing reforestation or afforestation. Improvements are seen in grazing land use, which may be associated with the improvement of grazing management practices supportive of soil health, also reported by Jodhani et al. (2023). It was constant through time as a change in carbon sequestration, consistent with a lack of change in cover or management of vegetation that implies the absence of serious reclamation efforts in this land type within this period. Overall, the data show generally increasing carbon sequestration for all land use types with evidence of the combined effect of sustainable land management practices in the watershed, as given in Table 14. The highest CSI index was observed under agroforestry/horticulture land use, showing that this land use is the most effective at carbon sequestration per hectare in the watershed, as given in Table 15. The croplands contribute to carbon sequestration but at a lower rate. A significant improvement in the CSI index was observed for the forest land use, which may be due to joint forest management in the watershed and other land uses showing areas with declining vegetation and did not contribute to the CSI in the watershed, as given in Table 13, and also supported with the similar finding made by Mandal et al. (2020). Jinger et al. (2024) reported that M. dubia-based agroforestry system improved above- and below-ground carbon stocks by 256.1% and 253.9%, respectively, compared to the sole Melia dubia plantation. Total carbon stock across treatments ranged from 7.86 to 70.1 Mg/ha. This trend extended to above-, below-, and total carbon sequestration, which varied from 28.8 to 257.5 Mg CO2 equivalent/ha. Similarly, Chopra et al. (2023) observed Melia composita accumulating total biomass of 104.2, 115.7, 129.1, and 145.1 Mg/ha over 4, 5, 6, and 7 years, respectively, in the Tarai region of Uttarakhand, India.
Table 14
| ( t CO 2 /ha/yr) | ||
|---|---|---|
| Land use type | 2021 | 2023 |
| Croplands | 0.5 | 0.7 |
| Horticulture | 1.5 | 1.8 |
| Forest lands | 5.0 | 5.4 |
| Grazing lands | 0.8 | 0.8 |
| Wasteland | 0.2 | 0.2 |
Changes in carbon sequestration under different land use of watershed.
Table 15
| Land use type | Improved vegetation area (ha, 2021–2023) | Total carbon sequestered (t CO2) | Carbon sequestration index (CSI, t CO2/ha) |
|---|---|---|---|
| Croplands | 16.06 | 9.64 | 0.6 |
| Agroforestry/ horticulture | 11.02 | 18.18 | 1.65 |
| Forest lands | 0 | 0 | 0 |
| Grazing land | −4.01 (decline) | - | - |
| Wasteland | −27.08 (decline) | - | - |
Carbon sequestration index for major land use of the watershed.
5.11 Livelihood Improvement Index (LII)
The LII is an index of stability and quality of livelihoods in a watershed. It examines those determinants of people's or households' wellbeing and income security, based on available resources, so that it can understand how poverty is reduced, economic development, and social resilience, as shown by Singh et al. (2022)—the orientation toward community networks, social support systems, community organization, and participation. In most cases, the correlation is between your social capital (as measured by figures of dependency between members) and the stability of livelihoods, as explained by Kumar and Mohanasundari (2025). The sustainable use of natural resources (land, water, and forests) is necessary for the people in agriculture, fishing, and forestry-dependent communities to have a sustainable livelihood, with similar findings reported by Singh et al. (2019b). The farmer's family average income rose from ₹1,12,500 in 2021 to ₹1,26,000 in 2023 at the household level and naturally exposed the rural youth in the watershed to new opportunities as the rate of employment increased from 22% in 2021 to 40% by 2023, as given in Table 16. In addition, it has improved life quality from the farmers' point of view living in the watershed. Improved access to all social infrastructure in the watershed between 2021 and 2023 (60%) to 2023 (70%) now opens the farmers up to basic services. The livelihood improvement index rose from 53.3% in 2021 (or 70.7%) in 2023. Watershed villages had better infrastructure facilities in terms of the physical dimension, such as regular electricity supply and water availability, with a mean score of 17.9, followed by basic sanitation facilities (12.89) (Rawat et al., 2024). Results show increased productivity with cost-effective water harvesting structures, enhanced livelihood through crop intensification, and increased diversification through high-value crops (Wani et al., 2008).
Table 16
| Year | Average household income (INR) | Access to resources score | Livelihood diversification index | Community development initiatives | Livelihood Improvement Index (LII) |
|---|---|---|---|---|---|
| 2021 | 112,500 | 60 | 40 | 5 | 53.3 |
| 2022 | 119,000 | 65 | 50 | 7 | 62.3 |
| 2023 | 126,000 | 70 | 60 | 10 | 70.7 |
Livelihood improvement index of Bhadroli Khurd-Karada watershed.
5.12 Integrated Climate Resilience Index (ICRI)
This index is a measure to assess the effect of climate change on watersheds. The ICRI takes a holistic view of the capacity of a watershed to withstand, adapt to, and recover from climate impacts, including extreme weather events, droughts, and floods, and rapid conversion of agricultural land uses to other land use conditions, by combining several indicators that capture exposure, sensitivity, and adaptive capacity, as reported by Singh et al. (2019b). For planning for adaptation, vulnerability assessment, and climate resilience allocation, the ICRI serves as a guide. It measures the level at which a region or community is susceptible to climate hazards, including floods, droughts, heat waves, and storms, as reported by Bandyopadhyay et al. (2016). More exposure means more vulnerability and a greater need for resilience measures. Looks at the sensitivity of the population and ecosystems to the impacts of climate. It also includes the vulnerability of rainfed agriculture ecosystems for the dependence of livelihoods on climate-sensitive resources. These comprise things that strengthen one's resilience, such as economic resources, education, quality infrastructure, health system, and governance facilities, which make one and their environment more adaptive. It takes into account water, food resources availability, accessibility, and stability. These essential resources are accessed reliably by resilient systems in changing climate conditions—an index of economic diversification, income levels, social cohesion, and employment security. Improvements in the Integrated Climate Resilience Index from 2021 to 2023, going from 44.76 to 64.39, have substantiated the ability to provide increased resilience to climate variability and extremes, as given in Table 17. Over the 3 years, progress has been demonstrated in each component, with successful strategies for reducing soil erosion, water management, drought resilience, and vegetation restoration. The coupled nature of the improvements across multiple indices supports an overall framework for climate resilience that acknowledges the interconnected ways in which improvements in one index can enable multiple goals. Dobhal et al. (2024) found that the shade provided by overstory trees mitigates the extreme impacts of temperatures (2–4°C) on understory crops, especially in agroforestry systems based on wheat and coffee, as well as silvipasture systems based on feed and livestock. They also found that waterlogging and 40–70% of agricultural production can be negatively impacted by heavy rainstorms. Because agroforestry increases soil water penetration and reduces runoff (20–50%), farmlands with agroforestry have been shown to be more robust to intense rains. According to Dosskey et al. (2017) and Hernández-Morcillo et al. (2018), growing agroforestry tree plantations also encourage more rainwater interception and infiltration, which lowers the amount, velocity, and peak flows of runoff and helps landowners adjust to the negative effects of exceptionally high precipitation events.
Table 17
| Year | WHEI (%) | GRI (%) | RRI (%) | LII (%) | DRI (%) | VRI (%) | CSI (%) | ICRI (%) |
|---|---|---|---|---|---|---|---|---|
| 2021 | 60 | 55 | 50 | 53.3 | 40 | 30 | 25 | 44.76 |
| 2022 | 65 | 60 | 55 | 62.3 | 45 | 35 | 30 | 50.33 |
| 2023 | 70 | 65 | 60 | 70.7 | 50 | 40 | 35 | 64.39 |
Integrated climate resilience index of Bhadroli Khurd-Karada watershed.
The relative importance of climate resilience indices, as shown in Figure 8, shows a professional-designated scoring (on a 1-to-10 scale) for every climate resilience index, given its functional role and strategic contribution to the general success of the watershed development objectives. Soil Erosion Control Index (SECI), Groundwater Recharge Index (GRI), Drought Resilience Index (DRI), and Livelihood Improvement Index (LII) were scored highest (score: 9), as they have direct and multiple influences on sustainable ecosystem functioning and wellbeing of the community. The metrics such as Water Harvesting Efficiency (WHEI), Water Utilization Efficiency (WUEI), and Land Productivity Index (LPI) also ranked high on importance scores (score: 8), as they are operationally important to enhance agricultural production and water-use sustainability. In contrast, the Vegetation Restoration Index (VRI) and Carbon Sequestration Index (CSI) were ranked slightly lower (score: 7–8) because of their indirect and longer-term impacts, yet they are still critical for climate mitigation. This framework of prioritization enables us to identify what indicators should be monitored closely and upgraded during project implementation and policy formulation, particularly under resource limitations or regional-specific vulnerabilities.
Figure 8
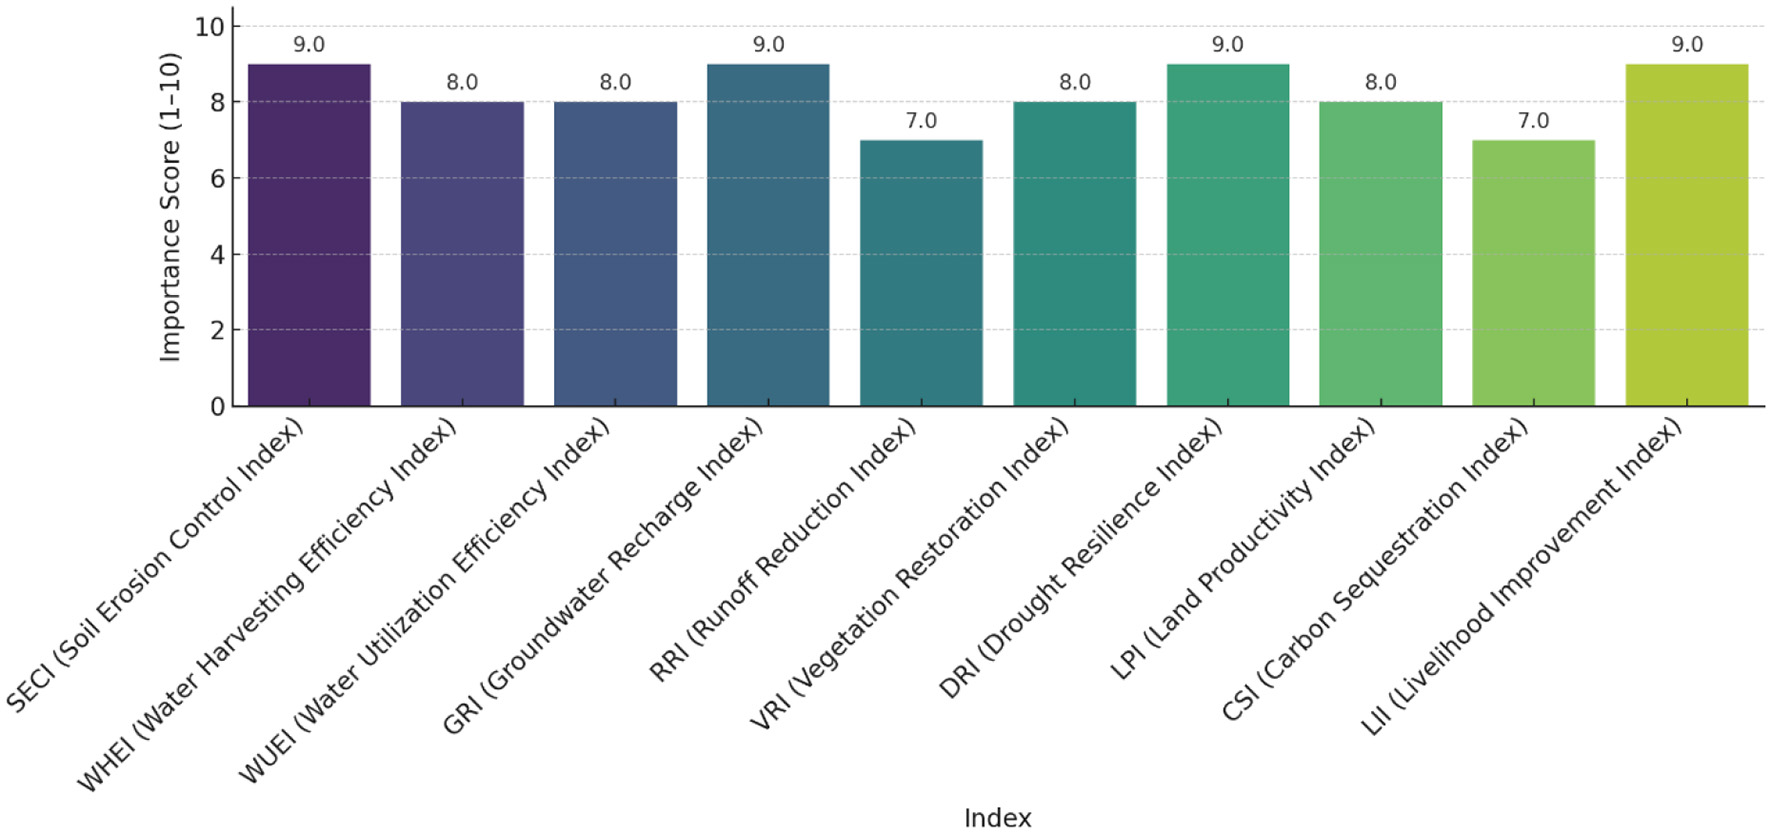
Relative importance of climate resilience indices in the study.
The heat map of the correlation matrix (Figure 9) shows the relationships between major climate resilience indices recorded between the years 2021 and 2023 in the watershed intervention study. The indices examined are the Soil Erosion Control Index (SECI), Water Harvesting Efficiency Index (WHEI), Water Utilization Efficiency Index (WUEI), Groundwater Recharge Index (GRI), Runoff Reduction Index (RRI), Drought Resilience Index (DRI), Land Productivity Index (LPI), and Livelihood Improvement Index (LII). The correlation coefficients identify the extent to which variation in one index is linked to variation in others. SECI, GRI, and DRI exhibited high positive correlations (r > 0.80) between them, implying that effective groundwater recharge and erosion control are tightly related to enhanced drought resilience. Similarly, moderate to high correlations between LPI and indices, such as WHEI and WUEI, highlight the importance of water availability and use in increasing land productivity. Lower or negative correlations, where they exist, could reflect trade-offs or autonomous behaviors among indices under certain climatic or management regimes. These correlations are important for interpreting the synergies among interventions and for maximizing resource allocation in watershed planning.
Figure 9
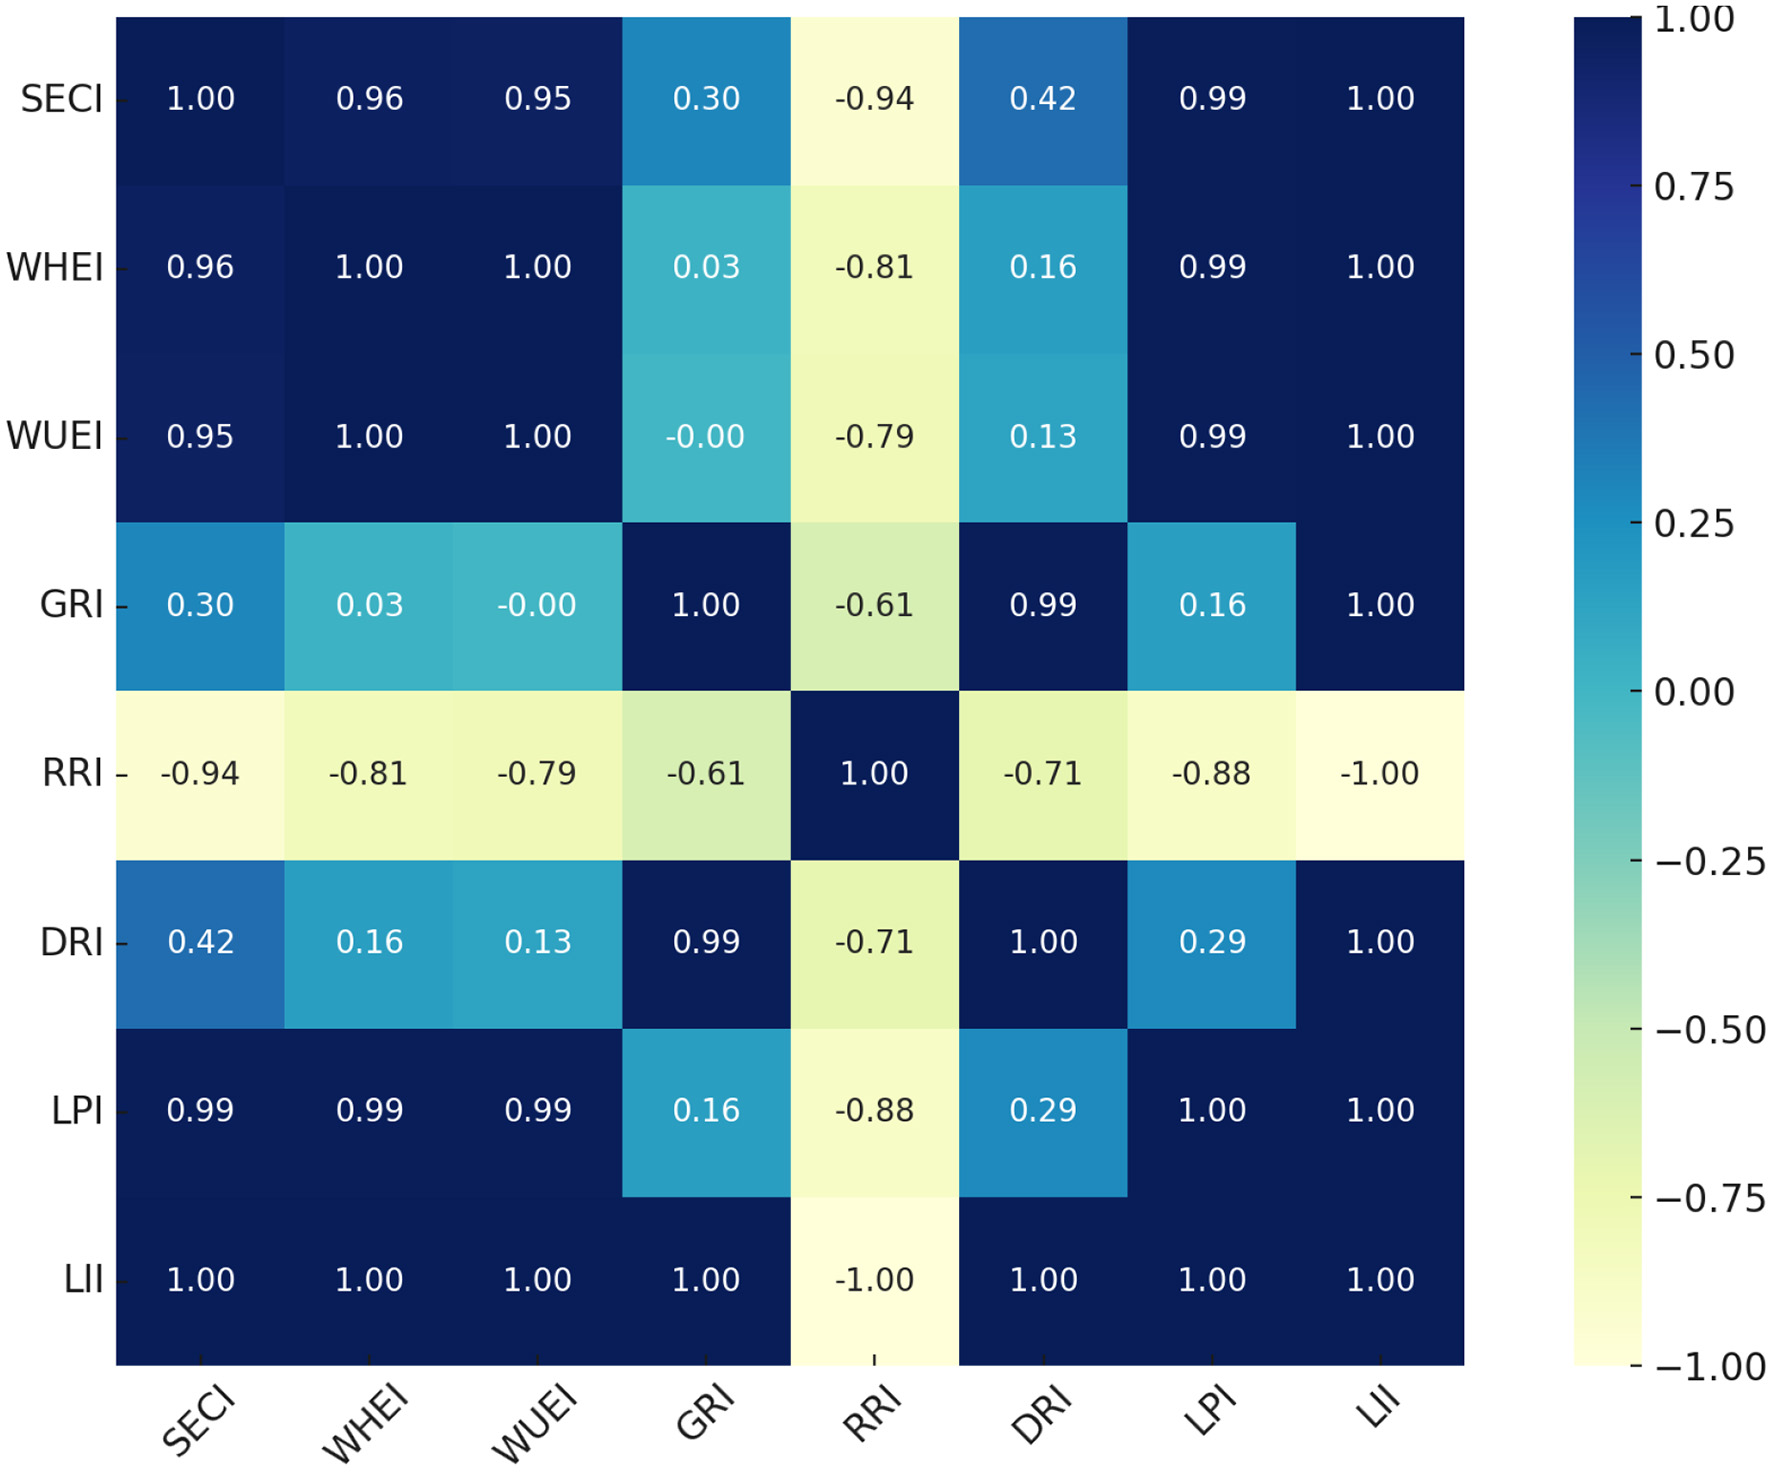
Correlation matrix of climate resilience indices used in the study.
6 Conclusion
The improvement of the various indices, as a measure of climate resilience in the watershed, highlights the success of watershed management programs in adapting to climate change. Rainwater harvesting, storage reservoirs, and water conservation methods are examples of watershed program interventions that improve the availability and dependability of water resources, particularly during droughts. The vegetation cover under different land uses of the watershed can be improved significantly through small water harvesting structures in the drainage line of the watershed. The water harvested behind these small drainage line treatment structures can increase the natural recharge of groundwater. The soil erosion can be minimized at the farm level, and more production benefits can be taken by diversifying the agriculture-based production system under the watershed management programs. The runoff reduction due to bunding and leveling can improve the soil moisture, leading to better growth and yield from various agriculture-based production systems in the watershed. The soil and water conservation works implemented in watershed programs maintain the fertility of the soil for sustainable agricultural production. The watershed programs can also increase household income, together with the diversification of livelihoods. The increased diversification in the source of income for rural communities in the watershed after the watershed programs reduces the exposure to economic shocks due to extremes such as drought, flood, heat waves, cold waves, frost, etc. By enhancing ecosystem health, encouraging sustainable land use, and improving water management, watershed programs increase climate resilience and assist communities in adapting to and lessening the effects of changing climate conditions. The watershed programs can be integrated solutions to solve the multiple problems linked to climate change, especially for developing countries such as India. The watershed initiative has the potential to significantly contribute to biodiversity enhancement, carbon sequestration, and climate change mitigation, all of which are issues of increasing global concern. The environmental management, livelihood improvement, and community wellbeing were found to be closely interdependent elements that need to be considered in the process of the comprehensive assessment of climate resilience of the watershed. These indices provide us with insights that, together, create the opportunity to address the impacts of climate change while ensuring the livelihoods of communities whose lives depend on these vital resources, as stakeholders work together to push a more resilient and sustainable future. The process of becoming more resilient is a continuous one, and persistent attempts can be made to manage the watershed's complex climate variability through watershed management programs.
Statements
Data availability statement
The original contributions presented in the study are included in the article/supplementary material, further inquiries can be directed to the corresponding authors.
Author contributions
GS: Investigation, Writing – original draft, Conceptualization, Visualization, Formal analysis, Methodology, Writing – review & editing, Validation, Data curation. DD: Data curation, Formal analysis, Conceptualization, Writing – original draft, Validation, Writing – review & editing, Investigation. DJ: Methodology, Data curation, Investigation, Writing – original draft, Writing – review & editing, Conceptualization, Software, Validation, Formal analysis. RK: Writing – original draft, Visualization, Validation, Investigation, Writing – review & editing, Methodology, Data curation. VK: Visualization, Data curation, Formal analysis, Writing – original draft, Conceptualization, Investigation, Validation, Methodology, Writing – review & editing. SK: Investigation, Visualization, Writing – original draft, Writing – review & editing, Formal analysis, Methodology, Conceptualization. NN: Writing – original draft, Writing – review & editing, Investigation, Data curation, Formal analysis, Conceptualization, Methodology, Visualization. AS: Writing – original draft, Project administration, Resources, Writing – review & editing, Supervision. MK: Resources, Writing – original draft, Writing – review & editing, Project administration, Supervision. VM: Software, Investigation, Writing – original draft, Writing – review & editing, Formal analysis, Visualization, Resources, Validation, Methodology. MM: Software, Writing – original draft, Writing – review & editing, Funding acquisition, Project administration, Supervision, Conceptualization.
Funding
The author(s) declare that no financial support was received for the research and/or publication of this article.
Acknowledgments
This study was undertaken at the Vasad in the Anand District of Gujarat state, India, with the kind permission of the Director of ICAR-Indian Institute of Soil and Water Conservation, Dehradun, to which the authors are thankful for providing the required facilities. The authors also acknowledge the technical support provided by the staff of the center in data collection by Sh. D. G. Damor, Sh. Anand Kumar, Sh. K. D. Mayavanshi, and Sh. B. C. Macwana is used in this research. We thank the Indian Council of Agricultural Research, New Delhi and ICAR-Indian Institute of Soil and Water Conservation, Dehradun, for providing the necessary facility.
Conflict of interest
The authors declare that the research was conducted in the absence of any commercial or financial relationships that could be construed as a potential conflict of interest.
Generative AI statement
The author(s) declare that no Gen AI was used in the creation of this manuscript.
Publisher’s note
All claims expressed in this article are solely those of the authors and do not necessarily represent those of their affiliated organizations, or those of the publisher, the editors and the reviewers. Any product that may be evaluated in this article, or claim that may be made by its manufacturer, is not guaranteed or endorsed by the publisher.
References
1
Abeysingha N. S. Singh M. Islam A. Sehgal V. K. (2016). Climate change impacts on irrigated rice and wheat production in Gomti River basin of India: a case study. Springerplus5, 1250. 10.1186/s40064-016-2905-y
2
Adhikary P. P. Hombegowda H. C. Barman D. Jakhar P. Madhu M. (2017). Soil erosion control and carbon sequestration in shifting cultivated degraded highlands of eastern India: Performance of two contour hedgerow systems. Agroforest. Syst.91, 757–771. 10.1007/s10457-016-9958-3
3
Alrababah M. A. Alhamad A. Suwaileh M. Al-Gharaibeh M. (2007). Biodiversity of semi-arid Mediterranean grasslands: Impact of grazing and afforestation. Appl. Veget. Sci.10, 257–264. 10.1111/j.1654-109X.2007.tb00524.x
4
Anusha S. Nagaraju Mallikarjuna G. B. Bhaskar V. Kombali G. Vishwanath B. R. (2015). Performance of fingermillet (Eleusine coracana (L.) Gaertn) in association with different MPTs in agroforestry system. Indian J. Agrofor. 17, 82–85.
5
Bandyopadhyay N. Bhuiyan C. Saha A. K. (2016). Heat waves, temperature extremes and their impacts on monsoon rainfall and meteorological drought in Gujarat, India. Natural Hazards82, 367–388. 10.1007/s11069-016-2205-4
6
Beliveau A. Lucotte M. Davidson R. Paquet S. Mertens F. Passos C. J. et al . (2017). Reduction of soil erosion and mercury losses in agroforestry systems compared to forests and cultivated fields in the Brazilian Amazon. J. Environ. Manage. 1,522–532. 10.1016/j.jenvman.2017.07.037
7
Bhatt B. Sharma S. A. Joshi J. P. Patel S. (2023). Quantifying spatiotemporal land surface temperature and Biophysical Indices for Sustainable Management of Watershed: a study of Vishwamitri Watershed of Gujarat. J. Geomat.17, 103–114. 10.58825/jog.2023.17.1.82
8
Bhukya S. Tiwari M. K. Patel G. R. (2023). Assessment of spatiotemporal variation of agricultural and meteorological Drought in Gujarat (India) Using remote sensing and GIS. J. Indian Soc. Remote Sens.51, 1493–1510. 10.1007/s12524-023-01715-y
9
Black P. E. (1972). Hydrograph responses to geomorphic model watershed characteristics and precipitation variables. J. Hydrol.17, 309–329. 10.1016/0022-1694(72)90090-X
10
Brempong M. B. Amankwaa-Yeboah P. Yeboah S. Owusu Danquah E. Agyeman K. Keteku A. K. et al . (2023). Soil and water conservation measures to adapt cropping systems to climate change facilitated water stresses in Africa. Front. Sustain. Food Syst.6:1091665. 10.3389/fsufs.2022.1091665
11
Broscoe A. J. (1959). Quantitative Analysis of Longitudinal Stream Profiles of Small Watersheds. Office of Naval Research, Project NR 389-042, Technical Report No. 18 Department of Geology, Columbia University, New York.
12
Chandana P. Lata A. M. Khan M. A. A. Krishna A. (2020). Climate change smart option and doubling farmer's income through Melia dubia-based agri-silviculture system. Curr. Sci. 118, 444–448. 10.18520/cs/v118/i3/444-448
13
Chaves H. M. Alipaz S. (2007). An integrated indicator based on basin hydrology, environment, life, and policy: The watershed sustainability index. Water Resourc, Managem, 21, 883–895. 10.1007/s11269-006-9107-2
14
Chinnasamy P. Maske A. B. Honap V. Chaudhary S. Agoramoorthy G. (2021). Sustainable development of water resources in marginalised semi-arid regions of India: Case study of Dahod in Gujarat, India. Nat. Resour. Forum. 45, 105–119. 10.1111/1477-8947.12217
15
Chinnasamy P. Misra G. Shah T. Maheshwari B. Prathapar S. (2015). Evaluating the effectiveness of water infrastructures for increasing groundwater recharge and agricultural production–A case study of Gujarat, India. Agricult. Water Managem.158, 179–188. 10.1016/j.agwat.2015.05.009
16
Chopra N. Tewari L. M. Tewari A. Wani Z. A. Asgher M. Pant S. et al . (2023). Estimation of Biomass and Carbon Sequestration Potential of Dalbergia latifolia Roxb. and Melia composita Willd. Plantations in the Tarai Region (India). Forests14:646. 10.3390/f14030646
17
Chorley R. J. (1957). Climate and morphometry. J. Geol.65, 628–638. 10.1086/626468
18
Chorley R. J. Dale P. F. (1972). Cartographic problems in stream channel delineation. Cartography7, 150–162. 10.1080/00690805.1972.10437698
19
Choudhury B. U. Nengzouzam G. Islam A. (2022). Runoff and soil erosion in the integrated farming systems based on micro-watersheds under projected climate change scenarios and adaptation strategies in the eastern Himalayan mountain ecosystem (India). J. Environ. Manage.309:114667. 10.1016/j.jenvman.2022.114667
20
Delgado J. A. Groffman P. M. Nearing M. A. Goddard T. Reicosky D. Lal R. et al . (2011). Conservation practices to mitigate and adapt to climate change. J. Soil Water Conservat.66, 118A−129A. 10.2489/jswc.66.4.118A
21
Delgado J. A. Mosquera V. H. B. Alwang J. R. Villacis-Aveiga A. Ayala Y. E. C. Neer D. et al . (2021). Potential use of cover crops for soil and water conservation, nutrient management, and climate change adaptation across the tropics. Adv. Agronomy165, 175–247. 10.1016/bs.agron.2020.09.003
22
Dobhal S. Kumar R. Bhardwaj A K. Chavan S B. Uthappa A R. Kumar M. et al . (2024). Global assessment of production benefits and risk reduction in agroforestry during extreme weather events under climate change scenarios. Front. For. Glob. Change7:1379741. 10.3389/ffgc.2024.1379741
23
Dosskey M. G. Brandle J. Bentrup G. (2017). “Reducing threats and enhancing resiliency” in Agroforestry: Enhancing Resiliency in U.S. Agricultural Landscapes Under Changing Conditions. Gen. Tech. Report WO-96, eds. SchoenebergerM. M.BentrupG.Patel-WeynandT. (Washington, DC: Forest Service: Department of Agriculture), 7–42.
24
Dumanski J. (2009). Emerging global trends provide new opportunities in soil and water conservation. J. Soil Water Conservat. 64, 11A−14A. 10.2489/jswc.64.1.11A
25
Faniran A. (1968). The index of drainage intensity: a provisional new drainage factor. Aust. J. Sci.31, 326–330.
26
Garg K. K. Singh R. Anantha K. H. Singh A. K. Akuraju V. R. Barron J. et al . (2020). Building climate resilience in degraded agricultural landscapes through water management: a case study of Bundelkhand region, Central India. J. Hydrol.591:125592. 10.1016/j.jhydrol.2020.125592
27
Gravelius H. (1914). Grundrifi der gesamten Gewcisserkunde. Band I: Flufikunde (Compendium of Hydrology, Vol. I. Rivers, in German).Goschen, Berlin.
28
Hack J. T. (1957). Submerged river system of Chesapeake Bay. Geol. Soc. Am. Bull.68, 817–830.
29
He Z. Jia G. Liu Z. Zhang Z. Yu X. Xiao P. (2020). Field studies on the influence of rainfall intensity, vegetation cover and slope length on soil moisture infil tration on typical watersheds of the Loess Plateau, China. Hydrol. Process.34, 4904–4919. 10.1002/hyp.13892
30
Hernández-Morcillo M. Burgess P. Mirck J. Pantera A. Plieninger T. (2018). Scanning agroforestry-based solutions for climate change mitigation and adaptation in Europe. Environ. Sci. Policy80, 44–52. 10.1016/j.envsci.2017.11.013
31
Horton R. E. (1932). Drainage-basin characteristics. Eos, Trans. Am. Geophy. Union13, 350–361.
32
Horton R. E. (1945). Erosional development of streams and their drainage basins; hydrophysical approach to quantitative morphology. Geol. Soc. Am. Bull. 56, 275–370.
33
Hussain M. Farooq S. Hasan W. Ul-Allah S. Tanveer M. Farooq M. et al . (2018). Drought stress in sunflower: physiological effects and its management through breeding and agronomic alternatives. Agric. Water Manage. 201, 152–166. 10.1016/j.agwat.2018.01.028
34
Jain S. Srivastava A. Vishwakarma D. K. Rajput J. Rane N. L. Salem A. et al . (2024). Protecting ancient water harvesting technologies in India: Strategies for climate adaptation and sustainable development with global lessons. Front. Water6, 1441365. 10.3389/frwa.2024.1441365
35
Jat R. A. Jinger D. Kumawat A. Saswat K. Rawat I. Dhaterwal S. et al . (2025). Integrated watershed management for transforming dryland livelihoods: A climate-smart strategy for sustainable dryland agriculture in India. Watershed Ecol. Environ.7, 159–177. 10.1016/j.wsee.2025.03.006
36
Jinger D. Kakade V. Bhatnagar P. R. Paramesh V. Dinesh D. Singh G. et al . (2024). Enhancing productivity and sustainability of ravine lands through horti-silviculture and soil moisture conservation: a pathway to land degradation neutrality. J. Environ. Manage.364, 121425. 10.1016/j.jenvman.2024.121425
37
Jinger D. Kakade V. D. Kaushal R. Bhatnagar P. R. Ghosh A. Mahawer S. K. et al . (2025). Nature-based solutions for enhancing CO2 sequestration and rehabilitating degraded lands through silvo-aromatic system and soil moisture conservation techniques. J. Environ. Manage.380:124904. 10.1016/j.jenvman.2025.124904
38
Jinger D. Kaushal R. Kumar R. Paramesh V. Verma A. Shukla M. et al . (2023). Degraded land rehabilitation through agroforestry in India: achievements, current understanding, and future prospectives. Front. Ecol. Evolut.11:1088796. 10.3389/fevo.2023.1088796
39
Jinger D. Kumar R. Kakade V. Dinesh D. Singh G. Pande V. C. et al . (2022). Agroforestry for controlling soil erosion and enhancing system productivity in ravine lands of Western India under climate change scenario. Environ. Monit. Assess.194:267. 10.1007/s10661-022-09910-z
40
Jodhani K. H. Patel D. Madhavan N. Singh S. K. (2023). Soil erosion assessment by rusle, google earth engine, and geospatial techniques over rel river watershed, Gujarat, India. Water Conservat. Sci. Eng.8:49. 10.1007/s41101-023-00223-x
41
Kar G. Singh R. Verma H. N. (2004). Alternative cropping strategies for assured and efficient crop production in upland rainfed rice areas of eastern India based on rainfall analysis. Agric. Water Manag. 67, 47–62. 10.1016/j.agwat.2003.12.005
42
Kato E. Ringler C. Yesuf M. Bryan E. (2011). Soil and water conservation technologies: A buffer against production risk in the face of climate change? Insights from the Nile Basin in Ethiopia. Agricult. Econ.42, 593–604. 10.1111/j.1574-0862.2011.00539.x
43
Kim Y. Chung E. S. (2014). An index-based robust decision making framework for watershed management in a changing climate. Sci. Total Environm. 473, 88–102. 10.1016/j.scitotenv.2013.12.002
44
Kingra P. K. Setia R. Kaur S. Singh S. Singh S. P. Kukal S. S. et al . (2018). Spatio-temporal analysis of the climate impact on rice yield in north-west India. Spatial Inform. Res.26, 381–395. 10.1007/s41324-018-0182-2
45
Kumar A. Mohanasundari T. (2025). Assessment of livelihood vulnerability to climate change among tribal communities in Chhindwara and Dhar district, Central India. Sci. Rep.15, 8843. 10.1038/s41598-025-90769-8
46
Kumar D. (2023). “Climate change, a strong threat to food security in india: With special reference to Gujarat,” in Climate Change Impacts on Natural Resources, Ecosystems and Agricultural Systems, eds. PandeC. B.MoharirK. N.SinghS. K.PhamQ. B.ElbeltagiA. (Cham: Springer International Publishing), 153–173.
47
Kumar D. Prasad R. Singh R. Rizvi R. H. Chavan S. B. Singh A. K. (2020a). Impact of watershed interventions on soil fertility status in Bundelkhand region of semi-arid tropics, India. Indian J. Agrofor. 22, 84–89.
48
Kumar M. Denis D. M. Kundu A. Joshi N. Suryavanshi S. (2022). Understanding land use/land cover and climate change impacts on hydrological components of Usri watershed, India. Appl. Water Sci.12:39. 10.1007/s13201-021-01547-6
49
Kumar R. Bhardwaj A. K. Rao B. K. Vishavkarma A. K. Bhatnagar P. R. Patra S. (2020b). Development of degraded ravine lands of Western India via Sapota (Achras zapota) plantation with terracing vs. trenching-on-slope based conservation measures. Land Degrad. Dev. 32, 101–111. 10.1002/ldr.3691
50
Kumar R. Bhardwaj A. K. Rao B. K. Vishwakarma A. K. Bhatnagar P. R. Patra S. et al . (2021). Development of degraded ravine lands of Western India using Sapota (Achras zapota) plantation with terracing vs. trenching-on-slope-based conservation measures. Land Degradat. Dev.32, 101–111.
51
Kumar R. Raj Gautam H. R. (2014). Climate change and its impact on agricultural productivity in India. J. Climatol. Weather Forecast.2, 1–3. 10.4172/2332-2594.1000109
52
Kumar R. G. Girish K. P. Franklin O. C. (2015). Sweet Potato: A Soil Conserving Root Tuber Crop. Mississippi: Alcorn State University Extension Program, School of Agriculture, Research, Extension, and Applied Sciences, Alcorn State University. Available online at: https://www.alcorn.edu/academics/schools-and-departments/college-of-agriculture-and-applied-sciences/land-grant-programs/asu-extension/outreach-centers/technology-transfer-center/ (Accessed June 12, 2025).
53
Kumar S. Ramilan T. Ramarao C. A. Rao C. S. Whitbread A. (2016). Farm level rainwater harvesting across different agro climatic regions of India: Assessing performance and its determinants. Agric Water Manag176, 55–66. 10.1016/j.agwat.2016.05.013
54
Lal R. (2020). Soil organic matter and water retention. Agron. J.112, 3265–3277. 10.1002/agj2.20282
55
Lal R. Delgado J. A. Groffman P. M. Millar N. Dell C. Rotz A. (2011). Management to mitigate and adapt to climate change. J. Soil Water Conservat.66, 276–285. 10.2489/jswc.66.4.276
56
Mandal D. Giri N. Srivastava P. (2020). The magnitude of erosion-induced carbon (C) flux and C-sequestration potential of eroded lands in India. Eur. J. Soil Sci.71, 151–168. 10.1111/ejss.12886
57
Martineau E. Domec J. C. Bosc A. Denoroy P. Fandino V. A. Lavres Jr J. et al . (2017). The effects of potassium nutrition on water use in field-grown maize (Zea mays L.). Environ. Exp. Bot. 134, 62–71. 10.1016/j.envexpbot.2016.11.004
58
Meena D. C. Pal S. Chand P. (2022). Assessment of watershed management ecosystem services in India: a meta-analysis. Curr. Sci.123, 1352–1358. 10.18520/cs/v123/i11/1352-1358
59
Mekonnen M. Abeje T. Addisu S. (2021). Integrated watershed management on soil quality, crop productivity and climate change adaptation, dry highland of Northeast Ethiopia. Agric. Syst.186:102964. 10.1016/j.agsy.2020.102964
60
Melton M. A. (1957). An Analysis of the Relations Among Elements of Climate, Surface Properties, and Geomorphology (Vol. 11). New York, NY: Department of Geology, Columbia University.
61
Melton M. A. (1965). The geomorphic and paleoclimatic significance of alluvial deposits in southern Arizona. J. Geol.73, 1–38. 10.1086/627146
62
Miller V. C. (1953). A Quantitative Geomorphic Study of Drainage Basin Characteristics in the Clinch Mountain Area Virginia and Tennessee (no. Cu-tr-3). New York, NY: Columbia University.
63
Mueller J. E. (1968). An introduction to the hydraulic and topographic sinuosity indexes. Ann. Assoc. Am. Geogr.58, 371–385.
64
Naba C. Ishidaira H. Magome J. Souma K. (2024). Exploring the potential of soil and water conservation measures for climate resilience in Burkina Faso. Sustainability16:7995. 10.3390/su16187995
65
Nehra S. Sur K. Verma V. K. Pateriya B. (2024). Compounding morphometric parameters for prioritization of vulnerable watersheds for land restoration planning in Beas sub basin, India using geospatial techniques. Water Pract. Technol.19, 708–729. 10.2166/wpt.2024.028
66
Panwar P. Machiwal D. Kumari V. Kumar S. Dogra P. Manivannan S. et al . (2023). Sustainable water harvesting for improving food security and livelihoods of smallholders under different climatic conditions of India. Sustainability15:9230. 10.3390/su15129230
67
Patel M. P. Gami B. Patel A. Patel P. Patel B. (2020). Climatic and anthropogenic impact on groundwater quality of agriculture dominated areas of southern and central Gujarat, India. Groundwater Sustain. Dev.10:100306. 10.1016/j.gsd.2019.100306
68
Phand S. Tiwari R. Arya H. P. S. (2007). Dairy development through natural resource management: A success story of drought prone village in India. Livestock Res. Rural Dev. 19, 1–11.
69
Rao C. S. Rejani R. Kumar P. (2014). Climate resilient water management practices for improving water use efficiency and sustaining crop productivity. Clim. Chang. Water Improv. Imd. 13–14. Available online at: https://www.researchgate.net/publication/312946950_Climate_resilient_water_management_practices_for_improving_water_use_efficiency_and_sustaining_crop_productivity
70
Rawat I. Jakhar P. Sundramabal P. Ravi K. N. Kumar D. Kumar M. et al . (2024). Watershed Development as a Catalyst for Women Empowerment. Dehradun: ICAR-Indian Institute of Soil and Water Conservation, 75.
71
Riahi M. R. Sadeghi S. H. Mirnia S. K. Sadoddin A. (2024). Coincidence of sustainable development indicators for the nekarood watershed with the United Nation's sustainable development goals. Sci. Total Environm.917:170177. 10.1016/j.scitotenv.2024.170177
72
Rosenzweig C. Major D. C. Demong K. Stanton C. Horton R. Stults M. (2007). Managing climate change risks in New York City's water system: assessment and adaptation planning. Mitig. Adapt. Strateg. Glob. Change12, 1391–1409.
73
Rosenzweig C. Tubiello F. N. (2007). Adaptation and mitigation strategies in agriculture: An analysis of potential synergies. Mitigat. Adaptat. Strateg. Global Change12, 855–873. 10.1007/s11027-007-9103-8
74
Sahoo D. C. Naik B. S. Adhikary P. P. Jakhar P. Hombe Gowda H. C. (2018). Bio- engineering measures for resource conservation and enhanced productivity in sloping uplands of Eastern ghat region in Odisha. Indian J. Soil Conserv. 46, 255–260.
75
Sahoo S. Ramole M. M. Dahiphale P. Awasthi S. Pateriya B. (2024). Geospatial technology based morphometric analysis and watershed prioritization of lower Satluj basin in India for groundwater recharge potential. Trop. Ecol.65, 43–58. 10.1007/s42965-023-00307-8
76
Sahu P. Siddha S. (2022). Development of a novel process to select suitable sites for establishing water harvesting structures in Central Gujarat, India. Environm. Earth Sci.81, 265. 10.1007/s12665-022-10378-w
77
Schumm S. A. (1956). Evolution of drainage systems and slopes in Badlands at Perth Amboy, New Jersey. Geol. Soc. Am. Bull.67, 597–646.
78
Senanayake S. Pradhan B. (2022). Predicting soil erosion susceptibility associated with climate change scenarios in the Central Highlands of Sri Lanka. J. Environ. Manage.308:114589. 10.1016/j.jenvman.2022.114589
79
Shah N. V. Patel Y. S. DBhangaonkar P. (2021). Assessing impact of climate change on rainfall patterns of Vadodara District, Gujarat, India. J. Phys. 1714:012046. 10.1088/1742-6596/1714/1/012046
80
Sharda V. N. Dogra P. Dhyani B. L. (2012). Indicators for assessing the impacts of watershed development programmes in different regions of India. Indian J. Soil Conservat.40, 1–12.
81
Siddha S. Sahu P. (2023). Integrating GIS and irrigation water quality index approaches for identifying groundwater irrigation potential zones in Central Gujarat, India. Environ. Monit. Assess.195:1082. 10.1007/s10661-023-11695-8
82
Siddha S. Sahu P. (2024). Assessment of hydraulic connectivity among shallow and deep aquifers and surface water of Central Gujarat: an isotopic approach. Appl. Radiat. Isotopes205:111188. 10.1016/j.apradiso.2024.111188
83
Sikka A. K. Alam M. F. Mandave V. (2022). Agricultural water management practices to improve the climate resilience of irrigated agriculture in India. Irrig. Drain.71, 7–26. 10.1002/ird.2696
84
Sikka A. K. Islam A. Rao K. V. (2018). Climate-smart land and water management for sustainable agriculture. Irrig. Drain.67, 72–81. 10.1002/ird.2162
85
Singh G. Dinesh D. Kakade V. D. Bhatnagar P. R. Pande V. C. (2019a). Precipitation probability and water budgeting for crop planning in central Gujarat. J. Agrometeorol.21, 392–396. 10.54386/jam.v21i3.269
86
Singh G. Dinesh D. Moharana P. C. Singh R. S. Kar S. K. Kakade V. et al . (2024). Novel hybrid ravine vulnerability index-based identification of potential reclamation zones for Western India. Land Degrad. Dev.35, 849–866. 10.1002/ldr.4956
87
Singh G. Jakhar R. Sachar P. (2022). Impact on people's lives and livelihoods in Gujarat due to Natural hazards. Int. J. Emerg. Trends Eng. Res. 10:2022. 10.30534/ijeter/2022/031042022
88
Singh G. Kumar R. Jinger D. Dhakshanamoorthy D. (2020). “Ecological engineering measures for ravine slope stabilization and its sustainable productive utilization,” in Slope Engineering (London: IntechOpen).
89
Singh G. Singh A K. Dinesh D. Jinger D. Nandha Kumar N. Kaledhonkar M. J. (2023a). “Sustainable sand-based runoff filters: a case study in Panchmahal district, Gujarat,” in Watershed Bulletin Indian Association of Soil and Water Conservationists, Dehradun, 66–68.
90
Singh G. Singh A K. Jinger D. Madhu M. (2023b). Artificial Groundwater Recharge Technologies for Different Agro-Ecological Regions of India. Anand, Gujarat: ICAR-IISWC, Research Centre, 30.
91
Singh M. C. Sur K. Al-Ansari N. Arya P. K. Verma V. K. Malik A. (2023c). GIS integrated RUSLE model-based soil loss estimation and watershed prioritization for land and water conservation aspects. Front. Environm. Sci.11:1136243. 10.3389/fenvs.2023.1136243
92
Singh P. Pathak P. Wani S. P. Sahrawat K. L. (2009). Integrated watershed management for increasing productivity and water-use efficiency in semi-arid tropical India. J. Crop Improvem.23, 402–429. 10.1080/15427520903013423
93
Singh P. K. Fischer G. van Velthuizen H. Chudasama H. Tiwari L. (2019b). Study Climate Change Adaptation Approaches for Sustaining and Improving Rural Livelihoods in Gujarat. Technology Information, Forecasting and Assessment Council, Department of Science & Technology, Government of India. Available online at: https://pure.iiasa.ac.at/id/eprint/17289/1/Gujrat%20Report%20(April%202019).pdf
94
Singhal V. Jinger D. Rathore A C. Pal R. Samal I. Bhoi T K. et al . (2024). COVID-19, deforestation, and green economy. Front. For. Glob. Change6:1305779. 10.3389/ffgc.2023.1305779
95
Sinha R. K. Eldho T. I. Subimal G. (2023). Assessing the impacts of land use/land cover and climate change on surface runoff of a humid tropical river basin in Western Ghats, India. Int. J. River Basin Managem.21, 141–152. 10.1080/15715124.2020.1809434
96
Six J. Bakker Jonathan D Bilby Robert E. (2014). Vegetation dynamics in a novel ecosystem: agroforestry effects on grassland vegetation in Uruguay. Ecosphere5, 1–15. 10.1890/ES13-00347.1
97
Smart J. S. Surkan A. J. (1967). The relation between mainstream length and area in drainage basins. Water Resour. Res.3, 963–974. 10.1029/WR003i004p00963
98
Sreedevi P. D. Subrahmanyam K. Ahmed S. (2005). The significance of morphometric analysis for obtaining groundwater potential zones in a structurally controlled terrain. Environ. Geol.47, 412–420. 10.1007/s00254-004-1166-1
99
Strahler A. N. (1952). Dynamic basis of geomorphology. Geol. Soc. Am. Bull.63, 923–938.
100
Strahler A. N. (1964). “Quantitative geomorphology of drainage basins and channel networks,” in Handbook of Applied Hydrology, Section 4-II., eds. ChowV. T. (New York, NY: McGraw Hill Book Company).
101
Thakkar A. K. Desai V. R. Patel A. Potdar M. B. (2017). Application of remote sensing in analysis of impact assessment using biomass vigour changes of watersheds. J. Environm. Biol.38:543.
102
Tiwari M. K. Gaur M. L. Baria S. V. Nakum J. K. (2013). “Rainfall-runoff modeling using HEC-HMS, remote sensing and geographical information system in Middle Gujarat, India,” in Proceeding of National Seminar on “Climate Change Impacts on Water Resources Systems”, 140. Available online at: https://www.researchgate.net/profile/Mukesh-Kumar-Tiwari/publication/268741054_Rainfall-Runoff_Modeling_using_HEC-HMS_Remote_Sensing_and_Geographical_Information_System_in_Middle_Gujarat_India/links/54745cec0cf29afed60f7a4c/Rainfall-Runoff-Modeling-using-HEC-HMS-Remote-Sensing-and-Geographical-Information-System-in-Middle-Gujarat-India.pdf
103
Tripathi A. Tripathi D. K. Chauhan D. K. Kumar N. Singh G. S. (2016). Paradigms of climate change impacts on some major food sources of the world: a review on current knowledge and future prospects. Agric. Ecosyst. Environ.216, 356–373. 10.1016/j.agee.2015.09.034
104
Wang Q. Yao Y. Zhao L. Yang C. H. Zhao Y. C. Zhang Q. P. (2023). Enhancing resilience against geological hazards and soil erosion through sustainable vegetation management: a case study in Shaanxi Province. J. Clean. Prod.423:138687. 10.1016/j.jclepro.2023.138687
105
Wani S. P. Anantha K. H. Sreedevi T. K. Sudi R. Singh S. N. D'Souza M. (2011). Assessing the environmental benefits of watershed development: evidence from the Indian Semi-Arid Tropics. J. Sustain. Watershed Sci. Manag. 1, 10–20. 10.5147/jswsm.v1i1.129
106
Wani S. P. Sreedevi T. K. Reddy T. S. V. Venkateswarlu B. Prasad C. S. (2008). Community watershed for for improved livelihoods through constortium approach in drought-prone rainfed areas. J. Hydrol. Res. Dev.23, 55–77.
107
Wentworth H. A. (1930). A quantitative study of achromatic and chromatic sensitivity from centre to periphery of the visual field. Psychol. Monogr.40, 1–189. 10.1037/h0093268
108
Yong L. Wang C. W. Hongliang T. (2006). Research advances in nutrient runoff on sloping land in watersheds. Aquat. Ecosyst. Health Manag.9, 27–32. 10.1080/14634980600559379
Summary
Keywords
watershed, soil erosion, water harvesting, groundwater recharge, vegetation restoration, livelihood, food security
Citation
Singh G, Dhakshanamoorthy D, Jinger D, Kumar R, Kakade VD, Kar SK, Natrajan NK, Singh AK, Kaledhonkar MJ, Meena VS and Madhu M (2025) Enhancing climate resilience through resource conservation practices in watershed of Western India. Front. Sustain. Food Syst. 9:1612949. doi: 10.3389/fsufs.2025.1612949
Received
16 April 2025
Accepted
16 June 2025
Published
17 July 2025
Volume
9 - 2025
Edited by
S. K. Sahoo, Punjab Remote Sensing Centre (PRSC), India
Reviewed by
Koyel Sur, Punjab Remote Sensing Centre (PRSC), India
Chetan Singla, Punjab Agricultural University, India
Updates
Copyright
© 2025 Singh, Dhakshanamoorthy, Jinger, Kumar, Kakade, Kar, Natrajan, Singh, Kaledhonkar, Meena and Madhu.
This is an open-access article distributed under the terms of the Creative Commons Attribution License (CC BY). The use, distribution or reproduction in other forums is permitted, provided the original author(s) and the copyright owner(s) are credited and that the original publication in this journal is cited, in accordance with accepted academic practice. No use, distribution or reproduction is permitted which does not comply with these terms.
*Correspondence: Gaurav Singh gaurav.bhu09@gmail.comDinesh Jinger dineshjinger28@gmail.com
Disclaimer
All claims expressed in this article are solely those of the authors and do not necessarily represent those of their affiliated organizations, or those of the publisher, the editors and the reviewers. Any product that may be evaluated in this article or claim that may be made by its manufacturer is not guaranteed or endorsed by the publisher.