 Jichao Li1,2
 Feng Guan1,2
 Pengyu Liu1,2Huiting Ma1,2Jiyou Zhang1,2Yumin Ma3
 Shengyong Mao1,2Xiao’e Xiang4*
 Wei Jin1,2*
- 1Laboratory of Gastrointestinal Microbiology, Jiangsu Key Laboratory of Gastrointestinal Nutrition and Animal Health, National Center for International Research on Animal Gut Nutrition, College of Animal Science and Technology, Nanjing Agricultural University, Nanjing, China
- 2Centre for Ruminant Nutrition and Cleaner Production Innovation, College of Animal Science and Technology, Nanjing Agricultural University, Nanjing, China
- 3Jiangsu Jiahui Biotechnology Co., Ltd., Haian, China
- 4National Experimental Teaching Center for Animal Science, Nanjing Agricultural University, Nanjing, China
The objective of this study was to investigate the effects of dietary neutral detergent fiber (NDF) to non-fibrous carbohydrate (NFC) ratios on in vitro rumen fermentation, methane production, and microbiota in dairy cows. In vitro rumen fermentation was conducted with five dietary groups: R0.48 (NDF/NFC = 0.48), R0.57 (NDF/NFC = 0.57), R0.70 (NDF/NFC = 0.70), R0.90 (NDF/NFC = 0.90), and R1.12 (NDF/NFC = 1.12). As the NDF/NFC ratios increased, total gas production decreased linearly. The degradation rates of dry matter (DM), neutral detergent fiber (NDF), and acid detergent fiber (ADF) decreased, showing a quadratic response (p = 0.018). Methane production per unit of DM was not significantly affected (p > 0.05), whereas methane production per unit of degraded DM increased (p < 0.05). The concentrations of acetate, lactate, and the acetate-to-propionate ratio, as well as pH, increased linearly (p < 0.05), whereas the concentrations of propionate, isobutyrate, isovalerate, and total volatile fatty acids (TVFA) decreased linearly (p < 0.05). Microbial crude protein (MCP) production was greater in the low NDF/NFC groups (p = 0.003). Quantitative real-time PCR analysis revealed that anaerobic fungi were more abundant in the high NDF/NFC groups (p = 0.001), whereas bacterial and archaeal abundances did not differ significantly among groups (p > 0.05). Illumina MiSeq PE250 sequencing revealed that the alpha diversity of both bacterial and archaeal communities was influenced by NDF/NFC (p < 0.05). Principal coordinate analysis further indicated that composition of bacterial (R2 = 0.298, p = 0.001) and archaeal (R2 = 0.470, p = 0.001) communities differed significantly among groups. Differences in bacterial communities were primarily driven by Firmicutes (e.g., Ruminococcus, Pseudobutyrivibrio) and Proteobacteria (e.g., Succinivibrio, Ruminobacter), whereas variations in archaeal communities were associated with Methanobacteriales and Methanomicrobiales. In conclusion, increasing dietary NDF/NFC ratios led to higher methane production per unit of degraded DM, reduced nutrient degradation, and lower TVFA concentrations during in vitro rumen fermentation, accompanied by distinct shifts in bacterial and archaeal community composition.
1 Introduction
Methane (CH4) emissions from livestock account for approximately 30% of global anthropogenic methane output (1). Among these sources, ruminants are the major contributors, with the rumen microbiota responsible for around 18% of total anthropogenic methane emissions (2). Moreover, methane production represents a loss of 2–12% of the gross energy intake in ruminants (3). Therefore, mitigating methane emissions from ruminants is critical for reducing global greenhouse gas emissions. Diet plays a pivotal role in modulating methane production within the gastrointestinal tract of ruminants. The relationship between dietary composition and methane emissions has been extensively investigated, with particular focus on the influence of carbohydrate sources and the forage-to-concentrate ratio. Several in vitro studies have examined the impact of dietary concentrate-to-roughage ratios on methane production. For example, after 24 h of in vitro rumen fermentation, a diet containing 70% forage resulted in lower methane production and total volatile fatty acid (TVFA) concentrations compared to a diet with 30% forage (4). In contrast, another study reported that a high-forage diet (70%) reduced total gas production but increased methane output relative to a low-forage diet (30%) following 24 h of fermentation (5). Similarly, methane production increased from 701 μmol to 754 μmol, and then to 812 μmol, as the forage proportion decreased from 80 to 50 and 20%, respectively, accompanied by a linear increase in TVFA concentrations (6). After 72 h of in vitro fermentation, a high-fiber diet (comprising 70% corn silage and 30% concentrate) led to a lower molar proportion of methane and higher concentrations of short-chain fatty acids compared to a high-concentrate diet (30% corn silage and 70% concentrate) (7). Consistent findings were observed in two in vivo studies on lactating cows, where high-forage diets (53.3 and 65%) resulted in greater methane emissions (430 vs. 399 g/day and 492 vs. 404 g/day, respectively) compared to low-forage diets (37.4 and 35%) (8, 9). However, a study on goats found no significant differences in methane emissions or TVFA concentrations between diets containing 41 and 58% forage (10). In another study involving Charolais cross heifers, methane emissions were highest in animals fed a diet with 40% forage compared to those receiving diets with 65% or 10% forage (11).
The conventional classification of ruminant diets based on forage-to-concentrate ratios lacks precision and offers limited nutritional guidance for effectively mitigating enteric methane emissions. Carbohydrates, the primary constituents of ruminant diets, are fermented in the rumen to supply energy while generating key precursors for methanogenesis, notably hydrogen and carbon dioxide (2). Dietary interventions, such as manipulation of feed composition or inclusion of bioactive compounds could modulate host–microbe interactions, nutrient digestibility, and metabolic pathways, thereby influencing microbial community dynamics and energy utilization in livestock (12–14). Among dietary carbohydrate indices, neutral detergent fiber (NDF) and non-fiber carbohydrates (NFC) provide a more nuanced classification, representing slowly and rapidly fermentable carbohydrate fractions, respectively. This classification is especially useful for designing rations aimed at reducing methane emissions. Despite their nutritional significance, studies investigating the mechanistic link between the NDF/NFC ratio and methane production remain limited. Therefore, this study aimed to evaluate the effects of varying NDF/NFC ratios on in vitro rumen fermentation, methane production, and microbial community composition in dairy cows. The results are expected to provide a theoretical foundation for developing precision low-methane diets using the NDF/NFC ratio as a key nutritional strategy.
2 Materials and methods
2.1 Experimental design
The in vitro rumen fermentation experiment was conducted using a completely randomized design with five dietary treatments: R0.48 (NDF/NFC = 0.48), R0.57 (NDF/NFC = 0.57), R0.70 (NDF/NFC = 0.70), R0.90 (NDF/NFC = 0.90), and R1.12 (NDF/NFC = 1.12). The dietary composition and nutrient levels are detailed in Table 1. For each treatment, six replicates were included, and three independent incubation runs were performed at different time points (15). Each incubation run consisted of 36 samples in total: 30 treatment samples and 6 blanks (containing only the inoculum). The experimental procedures closely followed the methods described by Liu et al. (16).

Table 1. Composition and nutrient levels of experimental diets.
2.2 In vitro incubation
Rumen fluid was obtained from three healthy Holstein dairy cows in mid-lactation. The cows were fed a diet formulated according to NRC (2001) requirements (17), including 9.05% corn meal, 2.26% barley, 3.62% soybean meal, 4.52% double low rapeseed meal, 1.58% distiller dried grains with solubles, 6.79% brewers wet grain, 2.71% beet pulp pellet, 56.56% corn silage, 6.79% alfalfa hay, 2.44% oat hay, 2.26% molasses, 0.27% NaHCO3, 1.13% premix (Vitamin and mineral mix contained the following ingredients per kilogram of diet: vitamin A, 22.5 KIU/kg; vitamin D3, 5.0 KIU/kg; vitamin E, 37.5 IU/kg; vitamin K3, 5.0 mg/kg; Mn, 63.5 mg/kg; Zn, 111.9 mg/kg; Cu, 25.6 mg/kg; and Fe, 159.3 mg/kg.) and contained dry matter (DM) 47.80%, crude protein (CP) 15.90%, ether extract (EE) 3.53%, neutral detergent fiber (NDF) 31.46%, acid detergent fiber (ADF) 18.70%, crude ash 7.06% on a dry matter basis. Rumen fluid was collected approximately 2 h before the morning feeding, with 500 mL obtained from each donor cow. The fluids were pooled, filtered through four layers of cheesecloth, and immediately mixed with buffer solution at a 1:2 (v/v) ratio under anaerobic conditions in a 39°C water bath. The buffer, identical across all treatments, was prepared according to Menke and Steingass (18) and contained 8.75 g NaHCO3, 1.00 g NH4HCO3, 1.43 g Na2HPO4, 1.55 g KH2PO4, 0.15 g MgSO4·7H2O, 0.52 g Na2S, 0.017 g CaCl2·2H2O, 0.015 g MnCl2·4H2O, 0.002 g CoCl2·6H2O, 0.012 g FeCl3·6H2O, and 1.25 mg resazurin per liter (18). A 100-mL aliquot of the rumen fluid-buffer mixture was transferred into a 180-mL serum bottle containing 1.0 g of dietary substrate, which had been dried at 55°C for 48 h and ground through a 1-mm screen using a Wiley mill (Arthur H. Thomas, Philadelphia, PA, United States). The liquid volume was standardized across treatments to maintain consistent buffering capacity, with each bottle receiving the same rumen fluid to buffer ratio (1:2, v/v). Bottles were sealed and incubated at 39°C for 48 h with continuous shaking at 80 rpm. Fermentation was terminated by immersing the bottles in ice water.
2.3 Sample collection and chemical analysis
Upon completion of the fermentation, the final pH was determined using a pH meter (Ecoscan pH 5, Singapore). The supernatant from the fermentation fluid was collected and stored at −20°C. The supernatant was then analyzed for volatile fatty acids (VFAs). Ammonia nitrogen (NH₃-N) was quantified using the indophenol method with an acidified procedure, following Weatherburn (19). Lactate concentration was determined using an assay kit, according to the manufacturer’s instructions (Jiancheng Bioengineering Research Institute, Nanjing, China). Microbial crude protein (MCP) was measured using the BCA Protein Assay Kit (Tiandz Inc., Beijing, China). The substrate-fermentation fluid mixture was collected and stored at −80°C for subsequent microbiota analysis. Feed ingredients were analyzed by wet chemistry methods for CP (GB/T 6432-2018), amylase-treated NDF (20), ADF (NY/T 1459-2022), EE (GB/T 6433-2006), ash (GB/T 6438-2007), and calculated NFC (17). The composition and nutrient levels of the experimental diets are presented in Table 1.
Gas production was measured using a pressure transducer (21). Methane (CH4) and hydrogen (H2) production were quantified using a GC-TCD instrument (Agilent 7890B, Agilent, California, United States). Gasses were separated using packed GC columns (Porapak Q & MolSieve 5A, Agilent, California, United States) under the following conditions: column temperature, 80°C; injection temperature, 200°C; detector temperature, 200°C; carrier gas, N2. The VFAs were determined according to Jin et al. (22). Each 1.0 mL sample was mixed with 0.2 mL of deproteinization-acidification solution [25% (w/v) metaphosphoric acid and 0.65% (w/v) crotonic acid] before gas chromatographic analysis (Agilent 7890B, Agilent, California, United States). Separation was performed using a fused silica capillary column (Supelco, Bellefonte, United States) under the following conditions: initial column temperature, 110°C for 3 min; ramping at 40°C/min to 150°C; injection temperature, 200°C; flame ionization detector (FID) temperature, 220°C; carrier gas, N2.
2.4 DNA extraction and real-time PCR
Genomic DNA was extracted from 1.0 mL of fermentation fluid using bead-beating combined with phenol–chloroform–isoamyl alcohol extraction, as described by Jin et al. (23). The extracted DNA was subsequently divided into two aliquots for downstream sequencing and quantitative real-time PCR (qPCR) analysis.
The abundances of bacteria, archaea, anaerobic fungi, and protozoa were quantified using a 7300 Real-Time PCR System (Applied Biosystems, California, United States). The primers used for these four microbial groups are listed in Supplementary Table S1. The reaction mixture was prepared using SYBR® Premix Ex Taq™ (TaKaRa, Dalian, China). DNA copy numbers were determined in triplicate for each sample, and the mean value was calculated. Standard curves were constructed using plasmid DNA containing cloned target genes of the respective microbial groups. Results were expressed as gene copy numbers per milliliter of fermentation fluid.
2.5 16S rRNA gene sequencing and data analysis
Microbial DNA was extracted from samples using the E. Z. N. A.® Soil DNA Kit (Omega Bio-Tek, Norcross, GA, United States) following manufacturer’s instructions. Bacterial 16S rRNA genes were amplified using the primer pair 341F (5′-CCTAYGG-GRBGCASCAG-3′) and 806R (5′-GGACTACNNGGGTATCTAAT-3′). Archaeal 16S rRNA genes were amplified using the primer pair Arch519F (5′-CAGCCGCCGCGGTAA-3′) and Arch915R (5′-GTGCTCCCCCGCCAATTCCT-3′). The amplicons were sequenced using paired-end (PE250) sequencing on an Illumina MiSeq platform by BIOZERON Biotechnology Co., Ltd. (Shanghai, China). The raw data were stored in the Sequence Read Archive (SRA) database of the National Biotechnology Information Center (NCBI), https://www.ncbi.nlm.nih.gov/, accession number: PRJNA1014950, bacteria; PRJNA1014951, archaea.
Demultiplexed paired-end reads were imported into QIIME2 (v2020.11), and DADA2 was employed for quality filtering, chimera removal, merging of overlapping paired-end reads, and generation of amplicon sequence variants (ASVs) (24). Trimming and filtering were applied to paired reads with a maximum of two expected errors per read (maxEE = 1). To assess the adequacy of sequencing depth for capturing microbial diversity, rarefaction curves were generated for both bacterial and archaeal communities (Supplementary Figure S1). Taxonomic classification was performed using the RDP Classifier (stand-alone version, RDP Classifier v2.14; https://sourceforge.net/projects/rdp-classifier/), with the SILVA database (v138) for bacterial taxonomy and the RIM database for methanogens. Alpha diversity analysis was conducted using Mothur (v1.21.1). Beta diversity was assessed via principal coordinate analysis (PCoA) based on Bray–Curtis distances. The significance of differences among groups was assessed using ANOSIM in the vegan package of R (v3.6.3).
2.6 Statistical analysis
Nutritional digestibility, gas production, and fermentation parameters were analyzed using a randomized complete design, with treatment as a fixed effect and run and run-by-treatment interaction as random effects. The run-by-treatment interaction was used as the error term to test the treatment effect. Linear and quadratic effects of treatments were analyzed using orthogonal contrasts. Microbial data were statistically analyzed using R (v3.6.3). For variables that did not meet the assumption of normality, the Kruskal–Wallis test was applied. Differences were considered statistically significant at p < 0.05.
3 Results
3.1 Gas production and nutrients degradation
Gas production and nutrient degradation rates are presented in Table 2. Total gas production, as well as the degradation rates of DM and NDF, decreased linearly (p < 0.05) with increasing NDF/NFC ratio. In contrast, methane yield (mL/g dry matter degradation) increased linearly (p < 0.05) with increasing NDF/NFC ratio. The degradation rate of ADF was significantly higher in R0.48 (p < 0.05), whereas no significant differences were observed among the remaining groups (p > 0.05). No significant effects of treatment were found for the other measured parameters (p > 0.05).
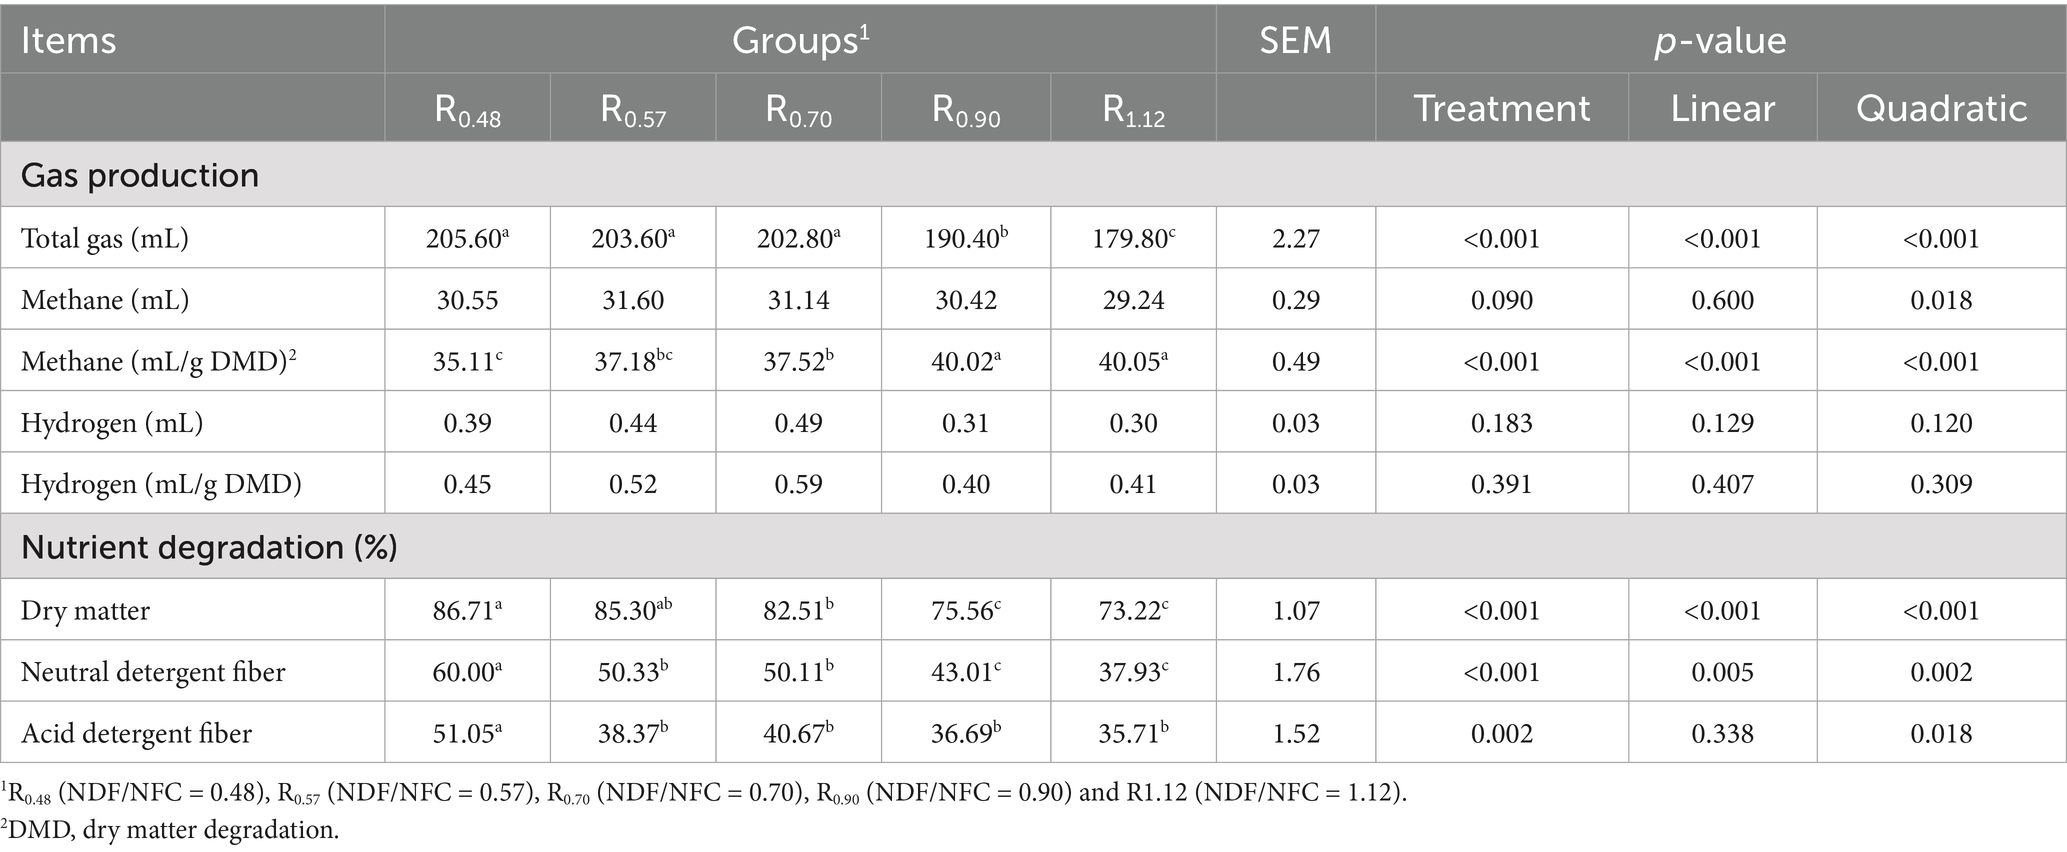
Table 2. Effects of dietary NDF/NFC ratios on in vitro production of gas and nutrients degradation.
3.2 In vitro fermentation characteristics
Fermentation characteristics are presented in Table 3. The pH of R0.48 was lower than that of R0.90 and R1.12 and increased linearly with increasing NDF/NFC ratio (p < 0.05). Acetate and the acetate-to-propionate ratio (A: P) in R0.48 and R0.57 were lower than those in R0.90 and R1.12 and increased linearly with increasing NDF/NFC ratio (p < 0.05). Propionate was significantly higher in R0.48 and R0.57 than in R0.90 and R1.12, and it decreased linearly with increasing NDF/NFC ratio (p < 0.05). Ammonia nitrogen was higher in R0.57 and R0.70 than in the other groups (p < 0.05), whereas no significant difference was observed between R0.57 and R0.70 (p > 0.05). Microbial crude protein (MCP) was higher in R0.48 than in R0.90 and R1.12 (p < 0.05). Lactate concentration was lower in R0.48 than in the other groups (p < 0.05) and increased linearly with the NDF/NFC ratio (p < 0.05).

Table 3. Fermentation parameters from 48-h in vitro fermentation.
3.3 The quantification of bacteria, archaea, anaerobic fungi and protozoa
The results of the real-time PCR analysis are shown in Table 4. No significant differences were observed in the abundance of bacteria, archaea, and protozoa among the five treatment groups (p > 0.05). However, both archaeal and protozoal abundances exhibited a significant linear increase with increasing NDF/NFC ratio (p < 0.05). The abundance of anaerobic fungi was significantly lower in the R0.48 group (p < 0.05), but higher in the R0.90 group compared to R0.48 and R0.57 (p < 0.05). Additionally, the abundance of anaerobic fungi increased linearly with the NDF/NFC ratio (p < 0.001).
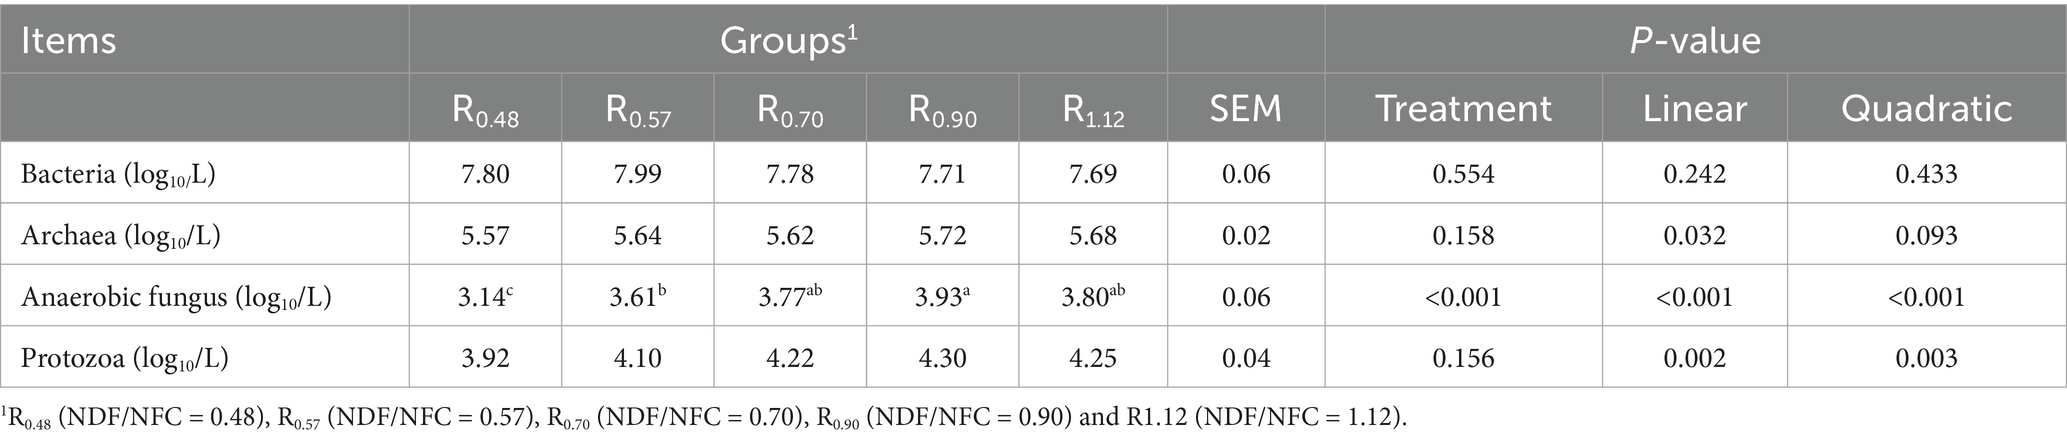
Table 4. Microbe numbers from 48 h in vitro fermentation.
3.4 Rumen microbial community structures
3.4.1 Effects on bacterial community
A total of 1,129,463 bacterial sequences were remained with an average of 37,648 clean reads per sample after quality filtering (Table 5). The average length was 414 bp. A total of 10,074 ASVs were identified. Alpha diversity results revealed that Chao1, ACE, Shannon and Simpson indices of R0.48 and R0.57 were lower than R1.12 (p < 0.05), and the Shannon and Simpson indices were decreased in R0.48 than R0.90 (p < 0.05). These four indexes of R0.57 were not significantly different than R0.70 and R0.90 (p > 0.05). There was a clear separation of clusters on the PCoA plot among the 5 groups (Anosim, R = 0.298, p = 0.001, Figure 1A). PC1 and PC2 accounted for 20 and 10% of the total variance, respectively.
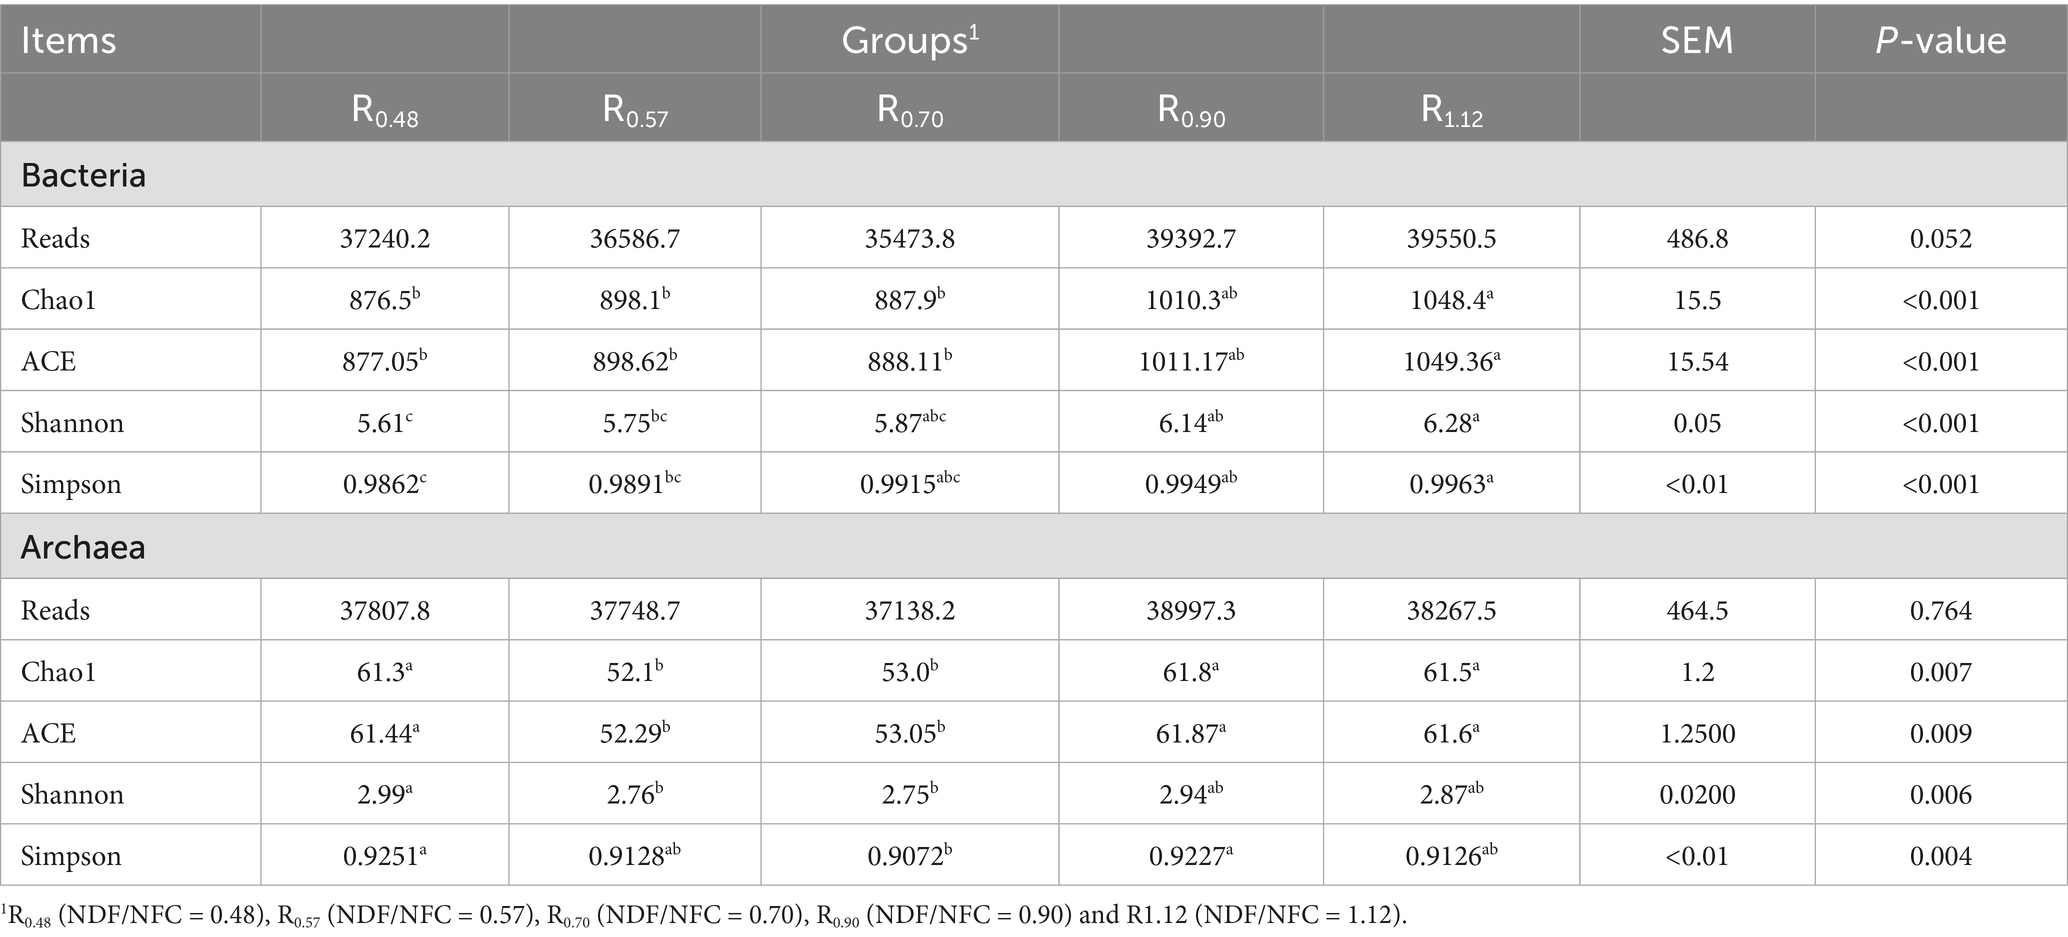
Table 5. Alpha diversity of bacterial and archaea populations.
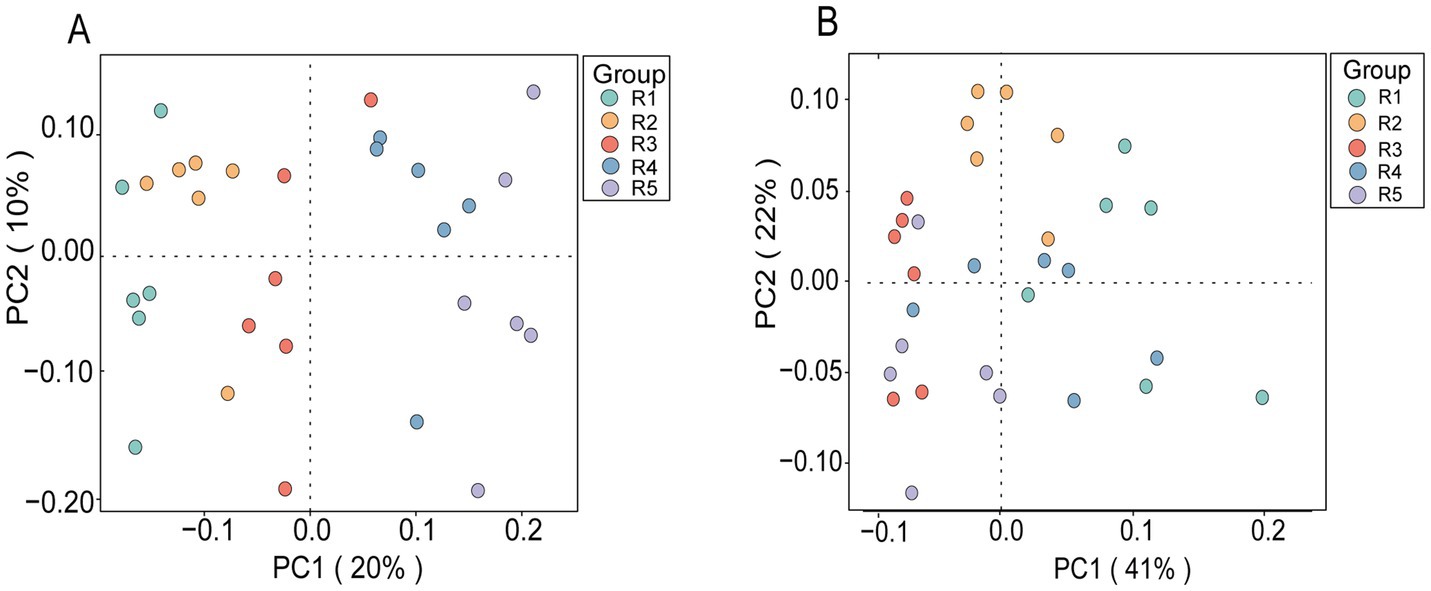
Figure 1. (A) PCoA analysis of bacterial populations based on Bray curtis distance, Anosim (R = 0.298, p = 0.001); (B) PCoA analysis of archaeal populations based on Bray curtis distance, Anosim (R = 0.470, p = 0.001). The colors of the dots in both plots represent different experimental groups (Group); each dot represents an individual sample. R1 = R0.48 (NDF/NFC = 0.48), R2 = R0.57 (NDF/NFC = 0.57), R3 = R0.70 (NDF/NFC = 0.70), R4 = R0.90 (NDF/NFC = 0.90), and R5 = R1.12 (NDF/NFC = 1.12).
At the phylum level, a total of 26 phyla were identified across all samples. The three predominant phyla (the average relative abundances of phyla >1% in at least one group) were Firmicutes (43.12%), Bacteroidota (31.64%), Proteobacteria (19.20%) (Figure 2A). The relative abundance of Firmicutes was significantly reduced in R0.48 and R0.57 than R1.12 (p < 0.05), but the difference was not significant compared with other groups (p > 0.05). The relative abundance of Bacteroidota in R0.48 was lower than R0.90 (p < 0.05). The relative abundance of Proteobacteria in R0.48 and R0.57 was higher than R1.12 group (p < 0.05) (Supplementary Table S2).
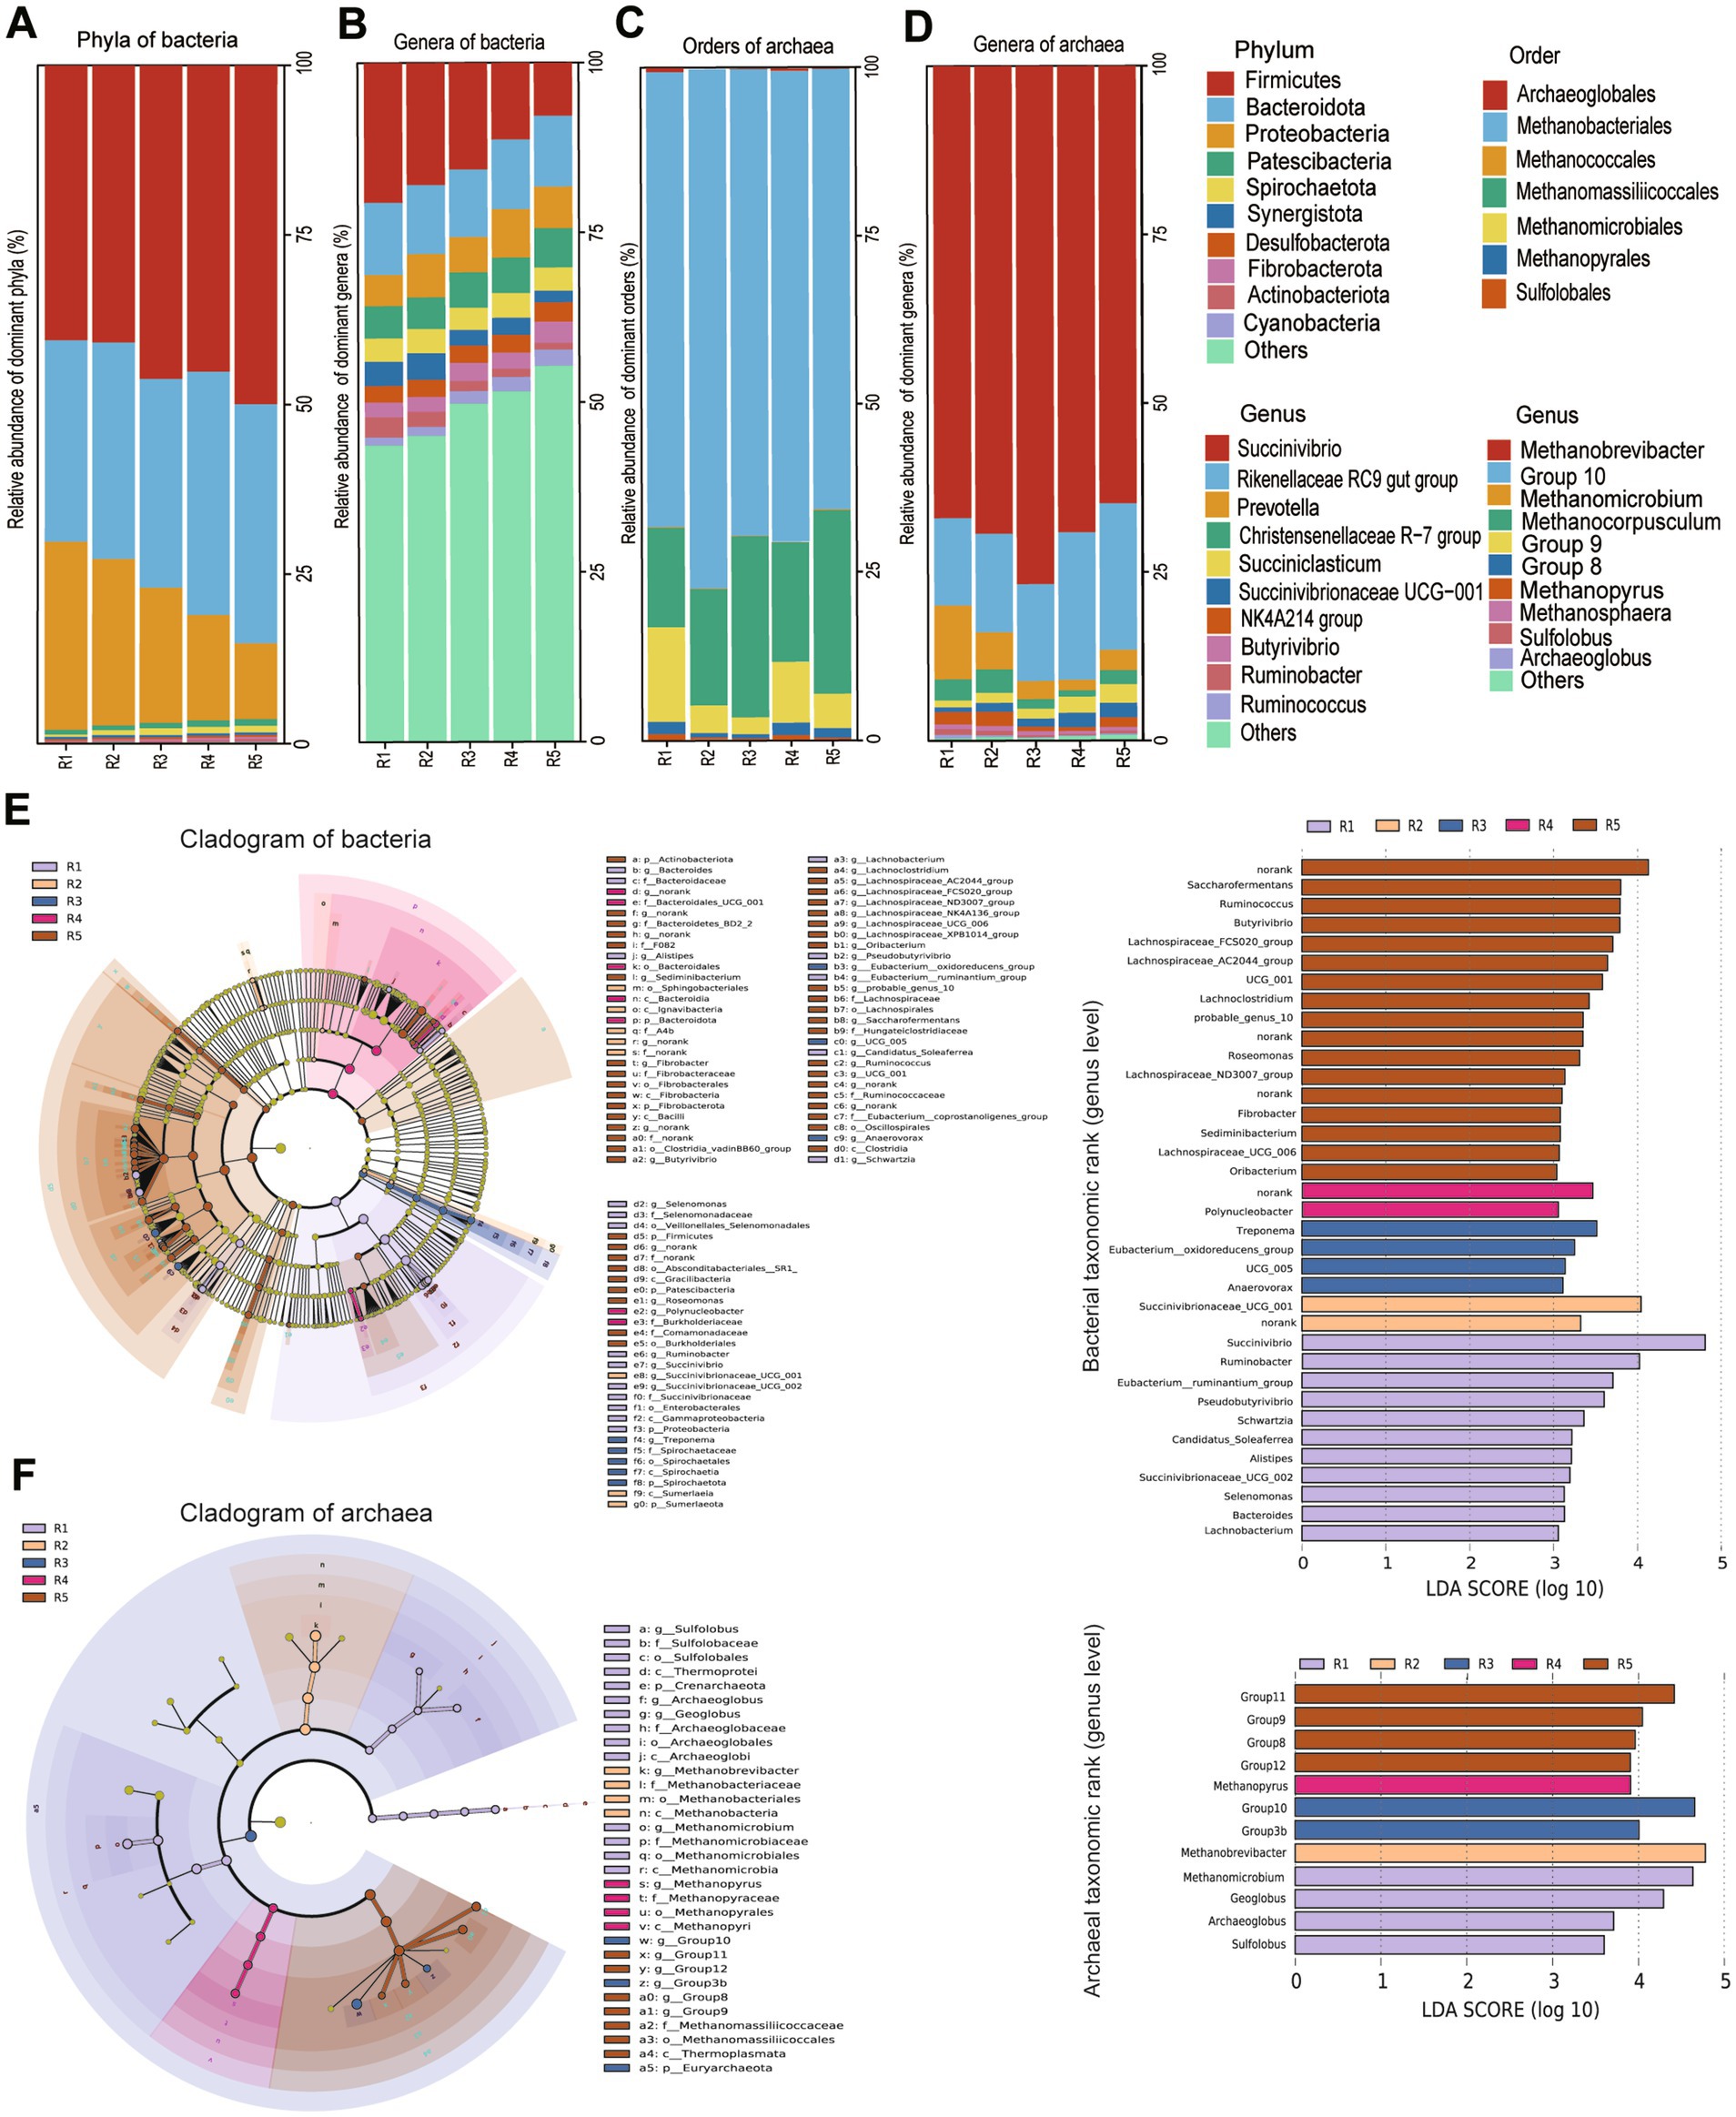
Figure 2. (A,B) The relative abundance at the level of phyla and genera in bacteria; (C,D) the relative abundance at the level of orders and genera in archaea; Linear discriminant analysis (LDA) effect size (LEfSe) (logarithmic LDA score of_3.0) of the ruminal microbiota. Taxonomic rank labels are provided before bacterial names; p_, c_, o_, f_, and g_indicate phylum, class, order, family, and genus, respectively. The greater the LDA score of the biomarker taxon mean value, the greater the influence of species abundance on the difference in the microbial community in the different treatments. (E) LEfSe analysis of the bacterial community showing the difference among groups (n = 6 samples per group), LDA scores at the genus level of bacteria; (F) LEfSe analysis of the bacterial community showing the difference among groups (n = 6 samples per group), LDA scores at the genus level of archaea. R1 = R0.48 (NDF/NFC = 0.48), R2 = R0.57 (NDF/NFC = 0.57), R3 = R0.70 (NDF/NFC = 0.70), R4 = R0.90 (NDF/NFC = 0.90), and R5 = R1.12 (NDF/NFC = 1.12).
A total of 437 bacterial genera were identified from all samples. The 10 predominant genera (the average relative abundances of genera >1.5% in at least one group) were Succinivibrio (14.26%), Rikenellaceae RC9 gut group (9.97%), Prevotella (5.68%), Christensenellaceae R-7 group (4.98%), Succiniclasticum (3.33%), Succinivibrionaceae UCG-001 (2.72%), NK4A214 group (2.52%), Butyrivibrio (2.42%), Ruminobacter (1.72%), Ruminococcus (1.70%) (Figure 2B). LEfSe and LDA analysis showed that Ruminococcus, Pseudobutyrivibrio, [Eubacterium] ruminantium group, Saccharofermentans of Firmicutes phylum and Succinivibrio, Succinivibrionaceae UCG-001, Ruminobacter of Proteobacteria phylum caused the differences in bacterial communities among the 5 groups (Figure 2E, LDA score > 4). The relative abundance of Succinivibrio, Succinivibrionaceae UCG-001, Ruminobacter in R0.48 and R0.57 was significantly higher than R1.12 (p < 0.05). The relative abundance of Ruminococcus and Saccharofermentans in R1.12 was higher than R0.48 and R0.57 (p < 0.05) (Supplementary Table S3).
3.4.2 Effects on archaeal community
A total of 1,139,757 archaeal sequences were remained with an average of 37,991 clean reads per sample after quality filtering (Table 5). The average length was 382 bp. A total of 5,995 ASVs were identified. Alpha diversity results revealed that Chao1 and ACE indices of R0.48, R0.90 and R1.12 were higher than R0.57 and R0.70 (p < 0.05). The Shannon index was increased in R0.48 than R0.57 and R0.70 (p < 0.05), but there was no significant difference than the other groups (p > 0.05). Simpson index of R0.48 was higher than R0.70 (p < 0.05), but not significantly different from the other groups (p > 0.05, Table 5). There was a clear separation of clusters on the PCoA plot among the 5 groups (Anosim, R = 0.470, p = 0.001, Figure 1B). PC1 and PC2 accounted for 41 and 22% of the total variance, respectively.
At the order level, a total of 7 orders were identified across all samples. The three predominant orders (the average relative abundance of orders > 1% in at least one group) were Methanobacteriales (34.67%), Methanomassiliicoccales (10.71%) and Methanomicrobiales (2.63%, Figure 2C). Methanobacteriales, Methanomassiliicoccales and Methanomicrobiales caused the differences in archaeal communities among the 5 groups. The relative abundance of Methanobacteriales in R0.57 and R0.70 was higher compared with R0.48 (p < 0.05). The relative abundance of Methanomicrobiales in R0.48 was higher than R0.70 (p < 0.05), but Methanomassiliicoccales was higher in R0.70 than R0.48 and R0.90 (p < 0.05) (Supplementary Table S4).
A total of 23 archaeal genera were identified. The three predominant genera (the average relative abundances of genera >1% in at least one group) were Methanobrevibacter (34.37%), Group10 (8.74%) and Methanomicrobium (1.76%, Figure 2D). The results of LEfSe and LDA analysis also showed that these three archaea mainly affected the diversity of archaea community (Figure 2F, LDA score > 4). The relative abundance of Methanobrevibacter in R0.57 and R0.70 was higher than R0.48 (p < 0.05). The relative abundance of Group10 in R0.70 was higher than R0.48 and R0.90 (p < 0.05). The relative abundance of Methanomicrobium in R0.48 was higher than R0.70 and R1.12 (p < 0.05) (Supplementary Table S5).
3.4.3 Correlation between taxa and VFAs
The correlations between microbial taxa and VFAs are illustrated in Figure 3. The relative abundance of Succinivibrio was negatively correlated with acetate and lactate (p < 0.05), but positively correlated with propionate and isobutyrate (p < 0.05). Succinivibrionaceae UCG-001 abundance showed a negative correlation with acetate (p < 0.05), and positive correlations with propionate and total VFAs (TVFA) (p < 0.05). Similarly, Ruminobacter abundance was negatively correlated with acetate and lactate, but positively associated with propionate (p < 0.05). In contrast, Ruminococcus exhibited negative correlations with propionate, isobutyrate, and TVFA (p < 0.05), while being positively correlated with acetate and lactate (p < 0.05). Additionally, the relative abundance of Saccharofermentans was negatively correlated with propionate and TVFA (p < 0.05), and positively correlated with acetate (p < 0.05).
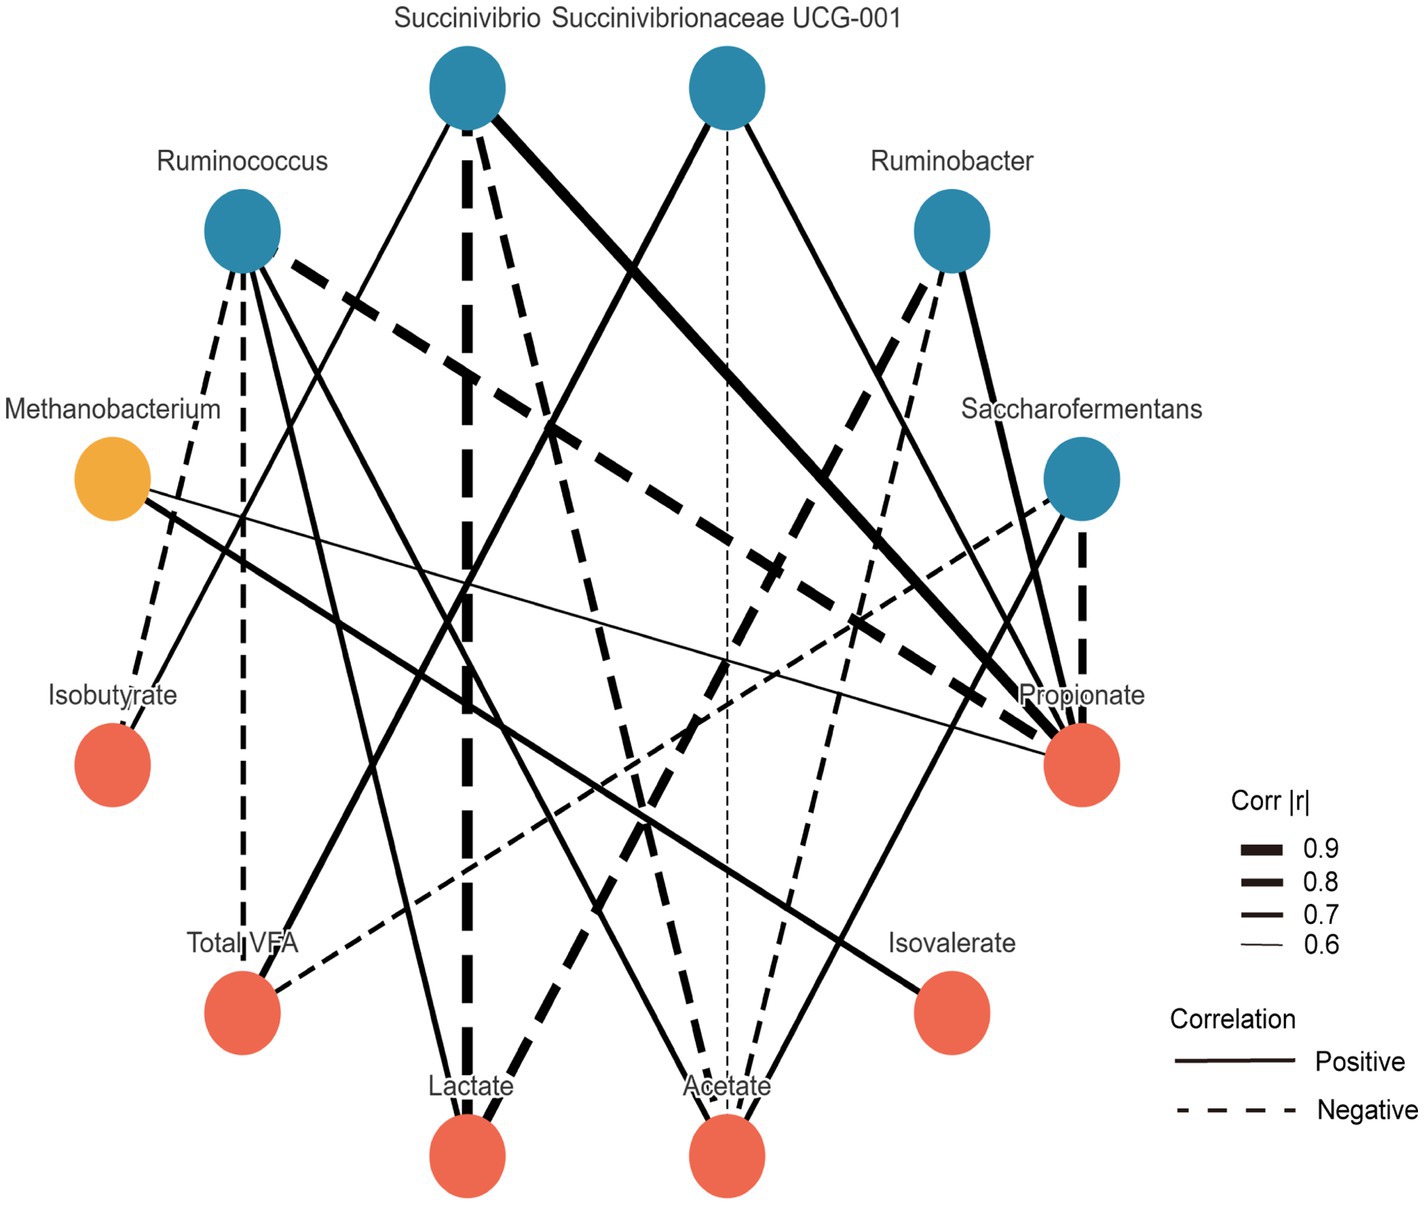
Figure 3. Spearman’s correlation analysis among differential taxa at the genus level. Only features showing strong significant correlations (|r| > 0.5 and p < 0.05) were visualized.
4 Discussion
In this study, five dietary formulations were designed with varying neutral detergent fiber to non-fiber carbohydrate (NDF/NFC) ratios, while maintaining an identical crude protein content across all treatments. Although no statistically significant differences were observed in total methane production among the five diets, a slight upward trend was noted in treatments with NDF/NFC ratios of 0.57 and 0.70. Interestingly, methane production per unit of dry matter degraded increased with rising NDF/NFC ratios, which aligns with findings from a previous study on in vitro rumen fermentation using substrates with varying metabolizable energy levels (25). Unfortunately, the study did not provide data on NFC, although the NDF levels ranged from 42.2 to 60.4%. In contrast, the current study, despite lower NDF levels (22.9–40.7%), yet a similar trend was observed, indicating a strong relationship between methane production and the extent of DM degradation. In contrast, the present study, despite having lower NDF levels (22.9–40.7%), demonstrated a similar trend to that reported by a previous study (25), highlighting a strong association between methane production and the extent of dry matter degradation.
Conversely, in another in vitro rumen fermentation study with two forage-to-concentrate ratio diets (30:70; 70:30), the degradation rate of DM and methane production were lower in the high forage (high NDF) diet (26). These findings are inconsistent with the results of the current study. Methane production per unit of DM degraded may be influenced by both the composition of the substrates and their degradation rates. For instance, substrates containing slowly fermentable starch tend to produce higher methane yields compared to those with rapidly fermentable starch (27). Furthermore, a diet with a low NDF/NFC ratio produces less hydrogen per unit of fermented carbohydrates, leading to reduced methane production (26, 28). However, in the present study, the pH values across all groups were maintained at relatively high levels, which did not significantly affect the fermentation process. In the group with the lower NDF/NFC ratio, the higher degradation rates of both DM and NDF led to a greater total amount of fermented carbohydrates, likely ensuring a sufficient hydrogen supply for methanogenesis and thereby explaining the absence of significant differences in total methane production among the dietary treatments. Notably, although total methane production remained relatively stable, methane yield per unit of degraded DM (CH₄/DMD) increased significantly with higher NDF/NFC ratios. This observation can be attributed to both altered fermentation patterns and reduced microbial utilization efficiency. A marked increase in the acetate-to-propionate ratio (from 1.82 to 2.12) reflected a fermentative shift toward pathways that generate more hydrogen (29), while concurrent declines in TVFA concentration and MCP production suggested reduced microbial growth and lower efficiency of energy capture. Together, these factors likely led to an accumulation of available hydrogen, which was subsequently utilized by methanogens, thus explaining the elevated CH₄/DMD ratio. These results indicate that the increased methane yield per unit of degraded substrate was driven by a combination of greater hydrogen availability and inefficient microbial fermentation under high-fiber dietary conditions.
Previous studies have reported that high concentrate feeding (characterized by low NDF content) tend to reduce ruminal pH, which in turn reduces NDF digestibility (30). However, this finding contrasts with the results of the current study. As the NDF/NFC ratios increased, the degradation rates of DM, NDF, and ADF decreased. This discrepancy may be attributed to differences in rumen pH. The pH did not decline to excessively low levels by the end of fermentation, ranging from 6.25 to 6.43. This stability in pH likely had a negligible or minimal impact on fermentation, ensuring that the fermentation process was not significantly disrupted. The relatively stable pH results may be due to the buffering agents present in the culture medium used for in vitro rumen fermentation.
As the NDF/NFC ratio increased, the proportion of acetate increased, while that of propionate declined, consistent with findings from previous studies (31–33). The concentration of TVFA was higher in the lower NDF/NFC groups, which aligned with the higher degradation rate of DM. Lactate concentration was higher in the higher NDF/NFC groups. Lactate can be converted to propionate in the rumen (34), but there may have been factors that hindered this conversion in the current study. The lowest NDF/NFC diet resulted in the highest MCP production. Under consistent dietary protein levels, a diet with higher energy content promotes MCP synthesis (35, 36), with the observed increase in VFA concentrations in this study indicating more efficient feed breakdown (37), thereby enhancing VFA yields and providing greater energy for MCP synthesis. The abundance of bacteria archaea and protozoa was not affected by the NDF/NFC ratios. Anaerobic fungi, which are key fiber-degrading microbes in the rumen, were promoted by diets with higher NDF content (38–40).
The NDF/NFC ratios altered the bacterial community composition. The bacterial genera Succinivibrio, Succinivibrionaceae UCG-001, and Ruminobacter were enriched in the lower NDF/NFC groups, with their relative abundance positively correlated with propionate concentration. Succinivibrio and Succinivibrionaceae can produce succinate and a small amount of lactate, both of which serve as precursors of propionate (41). Moreover, the enrichment of Succinivibrionaceae UCG-001 was observed in the rumen of cattle fed a high-grain diet (42). In contrast, Ruminococcus and Saccharofermentans were enriched in the higher NDF/NFC groups and displayed a negative correlation with the propionate concentration. These two bacterial taxa are involved in fiber degradation (43, 44). Ruminococcus, belonging to the Firmicutes phylum, degrades dietary fiber and regulates acetate and butyrate concentrations while producing acetate and hydrogen (45, 46). Ruminococcus can produce acetate and hydrogen. Additionally, Ruminococcus modulates microbial activity, potentially contributing significantly to rumen fermentation (47). Saccharofermentans can produce hydrogen peroxide, fumarate, lactate, and acetate when fermenting starch or other carbohydrates (48). The observed changes in these bacterial populations are closely linked to the alterations in propionate concentration. As a hydrogen sink, propionate production reduces the availability of hydrogen, which reduces methane formation.
The NDF/NFC ratios significantly altered the archaeal community composition, with distinct implications for methane biosynthesis pathways in the rumen. Moderate NDF/NFC ratios (R0.57 and R0.70) increased the relative abundance of Methanobrevibacter, consistent with a prior in vitro study where its copy number was higher in a balanced 50% alfalfa and 50% concentrate diet compared to extreme diets (49). This suggests that moderate NDF/NFC ratios enhance hydrogen availability, supporting Methanobrevibacter growth and methane production. Conversely, the low NDF/NFC ratio (R0.48) enriched Methanomicrobiales, which also contributes to hydrogenotrophic methanogenesis but may thrive on rapidly fermentable substrates, as reported by Friedman et al. (50). A dairy cow study similarly reported higher Methanomicrobiales abundance at an NDF/NFC ratio of 0.71 compared to 1.02 (51), indicating that low NDF/NFC diets favor this group. Notably, the R0.70 group showed increased Methanomassiliicoccales (Group 10), which utilize methyl compounds (e.g., methanol, methylamines) for methylotrophic methanogenesis (29). This increase may be linked to pectin-derived methyl compounds in moderate NDF diets, though this requires further validation. Variability in Methanobrevibacter responses across studies, with no changes in Karakul sheep (52) and increased abundance in goats at lower NDF/NFC ratios (53), likely reflects dietary composition and host-specific factors. Functionally, lower NDF/NFC ratios in our study enhanced propionate production via Succinivibrio, reducing H₂ availability for hydrogenotrophic methanogenesis and lowering methane yields (2). In contrast, moderate NDF/NFC ratios supported fibrolytic bacteria (Ruminococcus), increasing H₂ and methane via Methanobrevibacter (29). Thus, NDF/NFC ratios shape archaeal communities and methane biosynthesis pathways, offering a strategic approach to mitigate emissions.
5 Conclusion
The dietary NDF/NFC ratios influenced the in vitro rumen fermentation and microbiota. The NDF/NFC ratios did not affect the total methane production. As the NDF/NFC ratios increased, the methane yield per unit of dry matter degraded, the concentration of TVFA and acetate increased, while the concentration of propionate decreased. Higher NDF/NFC ratios promoted the growth of anaerobic fungi and altered the bacterial and archaeal populations. The findings of this study provide a theoretical basis for reducing methane emissions through adjusting the dietary NDF/NFC ratios.
Data availability statement
The raw data were stored in the Sequence Read Archive (SRA) database of the National Biotechnology Information Center (NCBI), https://www.ncbi.nlm.nih.gov/, accession number: PRJNA1014950, bacteria; PRJNA1014951, archaea.
Ethics statement
The experimental design and procedures were approved by the Animal Care and Use Committee of Nanjing Agricultural University (Nanjing, China) in accordance with the Regulations for the Administration of Affairs Concerning Experimental Animals, issued by the State Science and Technology Commission of China (1988) (Approval NJAU. No20230802N19).
Author contributions
JL: Data curation, Formal analysis, Methodology, Software, Visualization, Writing – original draft. FG: Data curation, Methodology, Validation, Writing – original draft. PL: Software, Writing – original draft. HM: Data curation, Methodology, Writing – original draft. JZ: Methodology, Writing – original draft. YM: Methodology, Writing – original draft. SM: Conceptualization, Funding acquisition, Project administration, Resources, Writing – review & editing. XX: Methodology, Writing – review & editing. WJ: Funding acquisition, Project administration, Supervision, Writing – review & editing.
Funding
The author(s) declare that financial support was received for the research and/or publication of this article. This research was funded by the Jiangsu Province Special Project for Carbon Peak and Carbon Neutral Science and Technology Innovation (BE2022309).
Acknowledgments
The authors thank staffs at Laboratory of Gastrointestinal Microbiology and Ruminant Nutrition and Feed Engineering Technology Research Center for their help during the experiment.
Conflict of interest
YM was employed by Jiangsu Jiahui Biotechnology Co., Ltd.
The remaining authors declare that the research was conducted in the absence of any commercial or financial relationships that could be construed as a potential conflict of interest.
Generative AI statement
The authors declare that no Gen AI was used in the creation of this manuscript.
Publisher’s note
All claims expressed in this article are solely those of the authors and do not necessarily represent those of their affiliated organizations, or those of the publisher, the editors and the reviewers. Any product that may be evaluated in this article, or claim that may be made by its manufacturer, is not guaranteed or endorsed by the publisher.
Supplementary material
The Supplementary material for this article can be found online at: https://www.frontiersin.org/articles/10.3389/fvets.2025.1588357/full#supplementary-material
References
1. Arndt, C, Hristov, AN, Price, WJ, McClelland, SC, Pelaez, AM, Cueva, SF, et al. Full adoption of the most effective strategies to mitigate methane emissions by ruminants can help meet the 1.5 C target by 2030 but not 2050. Proc Natl Acad Sci USA. (2022) 119:e2111294119. doi: 10.1073/pnas.2111294119
2. Mizrahi, I, Wallace, RJ, and Moraïs, S. The rumen microbiome: balancing food security and environmental impacts. Nat Rev Microbiol. (2021) 19:553–66. doi: 10.1038/s41579-021-00543-6
3. Beauchemin, KA, Ungerfeld, EM, Eckard, RJ, and Wang, M. Fifty years of research on rumen methanogenesis: lessons learned and future challenges for mitigation. Animal. (2020) 14:s2–s16. doi: 10.1017/S1751731119003100
4. Martínez, ME, Ranilla, MJ, Tejido, ML, Saro, C, and Carro, MD. The effect of the diet fed to donor sheep on in vitro methane production and ruminal fermentation of diets of variable composition. Anim Feed Sci Technol. (2010) 158:126–35. doi: 10.1016/j.anifeedsci.2010.04.005
5. Yogianto, Y, Sudarman, A, Wina, E, and Jayanegara, A. Supplementation effects of tannin and saponin extracts to diets with different forage to concentrate ratio on in vitro rumen fermentation and methanogenesis. J Indones Trop Anim. (2014) 39:144–51. doi: 10.14710/jitaa.39.3.144-151
6. Garcia-Martinez, R, Ranilla, MJ, Tejido, ML, and Carro, MD. Effects of disodium fumarate on in vitro rumen microbial growth, methane production and fermentation of diets differing in their forage:concentrate ratio. Br J Nutr. (2005) 94:71–7. doi: 10.1079/bjn20051455
7. Wang, Y, Zhang, Z, Wang, W, Wu, Q, Zhang, F, Li, W, et al. The effect of γ-aminobutyric acid addition on in vitro ruminal fermentation characteristics and methane production of diets differing in forage-to-concentrate ratio. Fermentation-Basel. (2023) 9:105. doi: 10.3390/fermentation9020105
8. Niu, M, Appuhamy, J, Leytem, AB, Dungan, RS, and Kebreab, E. Effect of dietary crude protein and forage contents on enteric methane emissions and nitrogen excretion from dairy cows simultaneously. Anim Prod Sci. (2016) 56:312–21. doi: 10.1071/AN15498
9. Bayat, AR, Ventto, L, Kairenius, P, Stefański, T, Leskinen, H, Tapio, I, et al. Dietary forage to concentrate ratio and sunflower oil supplement alter rumen fermentation, ruminal methane emissions, and nutrient utilization in lactating cows. Transl Anim Sci. (2017) 1:277–86. doi: 10.2527/tas2017.0032
10. Yang, C, Mao, S, Long, L, and Zhu, W. Effect of disodium fumarate on microbial abundance, ruminal fermentation and methane emission in goats under different forage: concentrate ratios. Animal. (2012) 6:1788–94. doi: 10.1017/S1751731112000857
11. Lovett, D, Lovell, S, Stack, L, Callan, J, Finlay, M, Conolly, J, et al. Effect of forage/concentrate ratio and dietary coconut oil level on methane output and performance of finishing beef heifers. Livest Prod Sci. (2003) 84:135–46. doi: 10.1016/j.livprodsci.2003.09.010
12. Peng, W, Chen, L, and Liu, J. Celastrol inhibits gastric cancer cell proliferation, migration, and invasion via the Foxa1/Cldn4 axis. Toxicol Res (Camb). (2023) 12:392–9. doi: 10.1093/toxres/tfad024
13. Huang, L, Luo, S, Liu, S, Jin, M, Wang, Y, and Zong, X. Comparative multiomics analyses reveal the breed effect on the colonic host–microbe interactions in pig. iMetaOmics. (2024) 1:e8. doi: 10.1002/imo2.8
14. Chen, F, Wang, Y, Wang, K, Chen, J, Jin, K, Peng, K, et al. Effects of Litsea cubeba essential oil on growth performance, blood antioxidation, immune function, apparent digestibility of nutrients, and fecal microflora of pigs. Front Pharmacol. (2023) 14:1166022. doi: 10.3389/fphar.2023.1166022
15. Yáñez-Ruiz, DR, Bannink, A, Dijkstra, J, Kebreab, E, Morgavi, DP, O’Kiely, P, et al. Design, implementation and interpretation of in vitro batch culture experiments to assess enteric methane mitigation in ruminants—a review. Anim Feed Sci Technol. (2016) 216:1–18. doi: 10.1016/j.anifeedsci.2016.03.016
16. Liu, Z, Wang, K, Nan, X, Cai, M, Yang, L, Xiong, B, et al. Synergistic effects of 3-nitrooxypropanol with fumarate in the regulation of propionate formation and methanogenesis in dairy cows in vitro. Appl Environ Microbiol. (2022) 88:e01908-21. doi: 10.1128/aem.01908-21
17. NRC. Nutrient requirements of dairy cattle. 7th ed. Washington, DC: National Academies Press (2001).
18. Kh, M. Estimation of the energetic feed value obtained from chemical analysis and in vitro gas production using rumen fluid. Anim Res Dev. (1988) 28:7–55.
19. Weatherburn, M. Phenol-hypochlorite reaction for determination of ammonia. Anal Chem. (1967) 39:971–4. doi: 10.1021/ac60252a045
20. Van Soest, PV, Robertson, JB, and Lewis, BA. Methods for dietary fiber, neutral detergent fiber, and nonstarch polysaccharides in relation to animal nutrition. J Dairy Sci. (1991) 74:3583–97. doi: 10.3168/jds.s0022-0302(91)78551-2
21. Theodorou, MK, Williams, BA, Dhanoa, MS, McAllan, AB, and France, J. A simple gas production method using a pressure transducer to determine the fermentation kinetics of ruminant feeds. Anim Feed Sci Technol. (1994) 48:185–97. doi: 10.1016/0377-8401(94)90171-6
22. Jin, W, Meng, Z, Wang, J, Cheng, Y, and Zhu, W. Effect of nitrooxy compounds with different molecular structures on the rumen methanogenesis, metabolic profile, and methanogenic community. Curr Microbiol. (2017) 74:891–8. doi: 10.1007/s00284-017-1261-7
23. Jin, D, Zhao, S, Zheng, N, Bu, D, Beckers, Y, Denman, SE, et al. Differences in ureolytic bacterial composition between the rumen digesta and rumen wall based on urec gene classification. Front Microbiol. (2017) 8:385. doi: 10.3389/fmicb.2017.00385
24. Callahan, BJ, McMurdie, PJ, Rosen, MJ, Han, AW, Johnson, AJA, and Holmes, SP. Dada2: high-resolution sample inference from Illumina amplicon data. Nat Methods. (2016) 13:581–3. doi: 10.1038/nmeth.3869
25. Liu, H, Li, Z, Pei, C, Degen, A, Hao, L, Cao, X, et al. A comparison between yaks and Qaidam cattle in in vitro rumen fermentation, methane emission, and bacterial community composition with poor quality substrate. Anim Feed Sci Technol. (2022) 291:115395. doi: 10.1016/j.anifeedsci.2022.115395
26. Jadhav, RV, Kannan, A, Bhar, R, Sharma, OP, Gulati, A, Rajkumar, K, et al. Effect of tea (camellia sinensis) seed saponins on in vitro rumen fermentation, methane production and true digestibility at different forage to concentrate ratios. J Appl Anim Res. (2016) 46:118–24. doi: 10.1080/09712119.2016.1270823
27. Hatew, B, Cone, JW, Pellikaan, WF, Podesta, SC, Bannink, A, Hendriks, WH, et al. Relationship between in vitro and in vivo methane production measured simultaneously with different dietary starch sources and starch levels in dairy cattle. Anim Feed Sci Technol. (2015) 202:20–31. doi: 10.1016/j.anifeedsci.2015.01.012
28. Wang, M, Wang, R, Xie, T, Janssen, PH, Sun, X, Beauchemin, KA, et al. Shifts in rumen fermentation and microbiota are associated with dissolved ruminal hydrogen concentrations in lactating dairy cows fed different types of carbohydrates. J Nutr. (2016) 146:1714–21. doi: 10.3945/jn.116.232462
29. Ungerfeld, EM, and Pitta, D. Review: biological consequences of the inhibition of rumen methanogenesis. Animal. (2024):101170. doi: 10.1016/j.animal.2024.101170
30. Nousiainen, J, Rinne, M, and Huhtanen, P. A meta-analysis of feed digestion in dairy cows. 1. The effects of forage and concentrate factors on total diet digestibility. J Dairy Sci. (2009) 92:5019–30. doi: 10.3168/jds.2008-1833
31. Lana, RP, Russell, JB, and Van Amburgh, ME. The role of pH in regulating ruminal methane and ammonia production. J Anim Sci. (1998) 76:2190–6. doi: 10.2527/1998.7682190x
32. Yang, W, Beauchemin, KA, and Rode, LM. Effects of grain processing, forage to concentrate ratio, and forage particle size on rumen pH and digestion by dairy cows. J Dairy Sci. (2001) 84:2203–16. doi: 10.3168/jds.s0022-0302(01)74667-x
33. Cantalapiedra-Hijar, G, Yanez-Ruiz, DR, Newbold, CJ, and Molina-Alcaide, E. The effect of the feed-to-buffer ratio on bacterial diversity and ruminal fermentation in single-flow continuous-culture fermenters. J Dairy Sci. (2011) 94:1374–84. doi: 10.3168/jds.2010-3260
34. Lu, Z, Kong, L, Ren, S, Aschenbach, JR, and Shen, H. Acid tolerance of lactate-utilizing bacteria of the order bacteroidales contributes to prevention of ruminal acidosis in goats adapted to a high-concentrate diet. Anim Nutr. (2023) 14:130–40. doi: 10.1016/j.aninu.2023.05.006
35. Clark, JH, Klusmeyer, TH, and Cameron, MR. Microbial protein synthesis and flows of nitrogen fractions to the duodenum of dairy cows. J Dairy Sci. (1992) 75:2304–23. doi: 10.3168/jds.S0022-0302(92)77992-2
36. Lu, Z, Xu, Z, Shen, Z, Tian, Y, and Shen, H. Dietary energy level promotes rumen microbial protein synthesis by improving the energy productivity of the ruminal microbiome. Front Microbiol. (2019) 10:847. doi: 10.3389/fmicb.2019.00847
37. Zhang, Y, Zhang, X, Cao, D, Yang, J, Mao, H, Sun, L, et al. Integrated multi-omics reveals the relationship between growth performance, rumen microbes and metabolic status of Hu sheep with different residual feed intakes. Anim Nutr. (2024) 18:284–95. doi: 10.1016/j.aninu.2024.04.021
38. Wang, R, He, S, Huang, D, He, S, Guo, T, Chen, T, et al. Differences in composition and diversity of rumen fungi in buffalo fed different diets. Anim Biotechnol. (2023) 34:5075–86. doi: 10.1080/10495398.2023.2276974
39. Palmonari, A, Federiconi, A, and Formigoni, A. Animal board invited review: the effect of diet on rumen microbial composition in dairy cows. Animal. (2024) 18:101319. doi: 10.1016/j.animal.2024.101319
40. Gruninger, RJ, Ribeiro, GO, Cameron, A, and McAllister, TA. Invited review: application of meta-omics to understand the dynamic nature of the rumen microbiome and how it responds to diet in ruminants. Animal. (2019) 13:1843–54. doi: 10.1017/S1751731119000752
41. Xue, M, Sun, H, Wu, X, Guan, L, and Liu, J. Assessment of rumen bacteria in dairy cows with varied milk protein yield. J Dairy Sci. (2019) 102:5031–41. doi: 10.3168/jds.2018-15974
42. Mu, Y, Qi, W, Zhang, T, Zhang, J, and Mao, S. Multi-omics analysis revealed coordinated responses of rumen microbiome and epithelium to high-grain-induced subacute rumen acidosis in lactating dairy cows. mSystems. (2022) 7:e01490-21. doi: 10.1128/msystems.01490-21
43. Christopherson, MR, Dawson, JA, Stevenson, DM, Cunningham, AC, Bramhacharya, S, Weimer, PJ, et al. Unique aspects of fiber degradation by the ruminal ethanologen ruminococcus albus 7 revealed by physiological and transcriptomic analysis. BMC Genomics. (2014) 15:1–13. doi: 10.1186/1471-2164-15-1066
44. Mu, Y, Qi, W, Zhang, T, Zhang, J, Mei, S, and Mao, S. Changes in rumen fermentation and bacterial community in lactating dairy cows with subacute rumen acidosis following rumen content transplantation. J Dairy Sci. (2021) 104:10780–95. doi: 10.3168/jds.2021-20490
45. Ortiz-Chura, A, Gere, J, Marcoppido, G, Depetris, G, Cravero, S, Faverín, C, et al. Dynamics of the ruminal microbial ecosystem, and inhibition of methanogenesis and propiogenesis in response to nitrate feeding to Holstein calves. Anim Nutr. (2021) 7:1205–18. doi: 10.1016/j.aninu.2021.07.005
46. Pan, S, Zou, J, Mao, H, Hu, Z, Sun, S, Wu, W, et al. Available phosphorus levels modulate growth performance, serum indices, metabolome, rumen fermentation, and microorganism in Hu lambs. Anim Feed Sci Technol. (2025) 322:116259. doi: 10.1016/j.anifeedsci.2025.116259
47. Huang, L, Li, Y, Tang, R, Yang, P, Zhuo, Y, Jiang, X, et al. Bile acids metabolism in the gut-liver axis mediates liver injury during lactation. Life Sci. (2024) 338:122380. doi: 10.1016/j.lfs.2023.122380
48. Monteiro, HF, Lelis, ALJ, Fan, P, Agustinho, BC, Lobo, RR, Arce-Cordero, JA, et al. Effects of lactic acid-producing bacteria as direct-fed microbials on the ruminal microbiome. J Dairy Sci. (2022) 105:2242–55. doi: 10.3168/jds.2021-21025
49. Lee, S, Kim, B, Ryu, C, Jeong, J, Kim, B, and Baek, Y. Analysis of rumen fermentation and methanogen levels in response to various alfalfa hay, oat hay, and feed concentrate ratios. J Korean Soc Grassl Forage Sci. (2020) 40:279–84. doi: 10.5333/kgfs.2020.40.4.279
50. Friedman, N, Shriker, E, Gold, B, Durman, T, Zarecki, R, Ruppin, E, et al. Diet-induced changes of redox potential underlie compositional shifts in the rumen archaeal community. Environ Microbiol. (2017) 19:174–84. doi: 10.1111/1462-2920.13551
51. Mu, Y, Qi, W, Zhang, T, Zhang, J, and Mao, S. Gene function adjustment for carbohydrate metabolism and enrichment of rumen microbiota with antibiotic resistance genes during subacute rumen acidosis induced by a high-grain diet in lactating dairy cows. J Dairy Sci. (2021) 104:2087–105. doi: 10.3168/jds.2020-19118
52. Bai, T, Pu, X, Guo, X, Liu, J, Zhao, L, Zhang, X, et al. Effects of dietary nonfibrous carbohydrate/neutral detergent fiber ratio on methanogenic archaea and cellulose-degrading bacteria in the rumen of karakul sheep: a 16s rRNA gene sequencing study. Appl Environ Microbiol. (2023) 89:e0129122. doi: 10.1128/aem.01291-22
Keywords: NDF/NFC ratios, in vitro rumen fermentation, methane emission, bacterial community composition, archaeal community composition
Citation: Li J, Guan F, Liu P, Ma H, Zhang J, Ma Y, Mao S, Xiang X and Jin W (2025) Effects of dietary NDF/NFC ratios on in vitro rumen fermentation, methane emission, and microbial community composition. Front. Vet. Sci. 12:1588357. doi: 10.3389/fvets.2025.1588357
Edited by:
Yafeng Huang, Anhui Agricultural University, ChinaReviewed by:
Baseer Ahmad, Muhammad Nawaz Shareef University of Agriculture, PakistanYanfeng Xue, Anhui Agricultural University, China
Copyright © 2025 Li, Guan, Liu, Ma, Zhang, Ma, Mao, Xiang and Jin. This is an open-access article distributed under the terms of the Creative Commons Attribution License (CC BY). The use, distribution or reproduction in other forums is permitted, provided the original author(s) and the copyright owner(s) are credited and that the original publication in this journal is cited, in accordance with accepted academic practice. No use, distribution or reproduction is permitted which does not comply with these terms.
*Correspondence: Xiao’e Xiang, eHh4aWFuZ0BuamF1LmVkdS5jbg==; Wei Jin, amlud2VpQG5qYXUuZWR1LmNu