 Xinyu Zhao1,2
 D. Rangaprakash1,3
 Bowen Yuan1
 Thomas S. Denney Jr1,4,5,6
 Jeffrey S. Katz1,4,5,6Michael N. Dretsch7,8
 Gopikrishna Deshpande1,4,5,6,9*
- 1Department of Electrical and Computer Engineering, AU MRI Research Center, Auburn University, Auburn, AL, United States
- 2Quora, Inc., Mountain View, CA, United States
- 3Department of Psychiatry and Biobehavioral Sciences, University of California, Los Angeles, Los Angeles, CA, United States
- 4Department of Psychology, Auburn University, Auburn, AL, United States
- 5Alabama Advanced Imaging Consortium, Auburn University, University of Alabama at Birmingham, Birmingham, AL, United States
- 6Center for Neuroscience, Auburn University, Auburn, AL, United States
- 7Human Dimension Division, HQ TRADOC, Fort Eustis, VA, United States
- 8U.S. Army Aeromedical Research Laboratory, Fort Rucker, AL, United States
- 9Center for Health Ecology and Equity Research, Auburn University, Auburn, AL, United States
Many brain-based disorders are traditionally diagnosed based on clinical interviews and behavioral assessments, which are recognized to be largely imperfect. Therefore, it is necessary to establish neuroimaging-based biomarkers to improve diagnostic precision. Resting-state functional magnetic resonance imaging (rs-fMRI) is a promising technique for the characterization and classification of varying disorders. However, most of these classification methods are supervised, i.e., they require a priori clinical labels to guide classification. In this study, we adopted various unsupervised clustering methods using static and dynamic rs-fMRI connectivity measures to investigate whether the clinical diagnostic grouping of different disorders is grounded in underlying neurobiological and phenotypic clusters. In order to do so, we derived a general analysis pipeline for identifying different brain-based disorders using genetic algorithm-based feature selection, and unsupervised clustering methods on four different datasets; three of them—ADNI, ADHD-200, and ABIDE—which are publicly available, and a fourth one—PTSD and PCS—which was acquired in-house. Using these datasets, the effectiveness of the proposed pipeline was verified on different disorders: Attention Deficit Hyperactivity Disorder (ADHD), Alzheimer's Disease (AD), Autism Spectrum Disorder (ASD), Post-Traumatic Stress Disorder (PTSD), and Post-Concussion Syndrome (PCS). For ADHD and AD, highest similarity was achieved between connectivity and phenotypic clusters, whereas for ASD and PTSD/PCS, highest similarity was achieved between connectivity and clinical diagnostic clusters. For multi-site data (ABIDE and ADHD-200), we report site-specific results. We also reported the effect of elimination of outlier subjects for all four datasets. Overall, our results suggest that neurobiological and phenotypic biomarkers could potentially be used as an aid by the clinician, in additional to currently available clinical diagnostic standards, to improve diagnostic precision. Data and source code used in this work is publicly available at https://github.com/xinyuzhao/identification-of-brain-based-disorders.git.
Introduction
A neuropsychiatric disorder is a brain-based dysfunctional condition associated with impairments of affect, cognition and behavior. Many factors contribute to these disorders, e.g., genes, family history, substance abuse, traumatic brain injury, life experience, environmental conditions etc. Conventional diagnosis primarily consists of clinical interviews and standardized psychometric testing, which are recognized to be largely imperfect [1–3]. Because neuropsychiatric pathologies are complex, which can lead to inconsistencies between clinicians' diagnoses, there is increasing interest in identifying non-invasive neuroimaging biomarkers. The most commonly used approach for achieving this is by employing supervised learning models such as support vector machines [4, 5], artificial neural networks [6], and decision trees [7], wherein the model learns the associations between patterns in the data and diagnostic labels using a training data set. This model can then be tested on an independent validation data set. However, the problem with such an approach is that the model itself is based on clinical labels, and hence, it cannot be used to uncover novel structures and groupings from the data. The problem can be addressed by employing unsupervised models. Unsupervised models have been traditionally used to uncover clusters of subjects with similar patterns of imaging data, with applications in identifying disease clusters [8, 9] as well as sub-clusters [10] within a disease. Most of these studies use k-means clustering [11, 12]. However, it is besieged with methodological issues such as a priori choice of clusters needed in k-means, and the large dimensionality of imaging data necessitates some type of dimensionality reduction for clustering to work as intended. Problematically, this last step is either not carried out [13], or carried out by preselecting features not from the structure in the data, but by some external considerations such as previous findings in a given disorder [14, 15]. Such approaches rob the method of its advantages of being truly data-driven, in that the clusters obtained from imaging data are seldom compared to data obtained from clinical diagnostic criteria and related behavioral phenotypes. This is important because disease clusters obtained from any method, be it imaging or another diagnostic tool, should be linked with the behavioral phenotype. In this study, we address the above shortcomings using resting state functional magnetic resonance imaging (rs-fMRI) data obtained from five different neuropsychiatric disorders: Attention Deficit Hyperactivity Disorder (ADHD), Alzheimer's Disease (AD), Autism Spectrum Disorder (ASD), Posttraumatic Stress Disorder (PTSD) and Post-Concussion Syndrome (PCS). We provide a brief introduction to these disorders in the following paragraphs.
Attention Deficit Hyperactivity Disorder
ADHD is a psychiatric disorder characterized by impulsiveness, inattention, and hyperactivity. This condition affects about 5% of children and adolescents worldwide [16]. Symptoms include difficulty staying focused and paying attention, difficulty controlling behavior, and hyperactivity. ADHD has three subtypes: ADHD hyperactive-impulsive (ADHD-H), ADHD inattentive (ADHD-I), and ADHD combined hyperactive-impulsive and inattentive subtype (ADHD-C). Because symptoms vary from person to person, ADHD can be difficult to identify. In addition, there has been a debate that ADHD is over-diagnosed in children and adolescents by current clinical criterion [17].
Alzheimer's Disease
AD is the most commonly diagnosed type of dementia in elderly patients [18], which is characterized by memory dysfunction, cognitive decline, etc. Before the onset of dementia, patients may develop an intermediate stage of dysfunction known as mild cognitive impairment (MCI). Patients with MCI have a higher risk of progressing to AD [19]. According to results from the Honolulu-Asia Aging Study [20], as many as one-third of all Alzheimer's diagnoses may actually be false positives. In addition, the diagnostic boundary between AD and MCI is not well established.
Autism Spectrum Disorder
ASD is a pervasive developmental disorder clinically characterized by social and communication impairments as well as restricted interests and repetitive behaviors [1]. While the boundaries between ASD, its comorbidities, and neurotypicals with sub-clinical ASD-like traits are blurred, several diagnostic subcategories within ASD were defined: autism, Asperger's disorder, and pervasive developmental disorder-not otherwise specified (PDD-NOS). It has been often argued that the Asperger's disorder criteria is problematic [21, 22]. In the latest DSM-V classification, Asperger's and PDD-NOS were eliminated, in favor of the so called “dimensional assessment” of the autism spectrum [23]. This highlights the confusion in the field due to lack of objective biomarkers based on underlying neurobiology.
Post-traumatic Stress Disorder
PTSD is a disabling condition in individuals exposed to a traumatic event, such as war, violent crime, and motor vehicle accidents [24]. PTSD is characterized by intrusive avoidance, hypervigilance, hyperarousal and alterations in cognition and mood [25]. PTSD is found to be associated with aberrant functioning of the amygdala, hippocampus, insula, and regions of the prefrontal cortex such as the ventromedial PFC [26–28]. Although cognitive decrements are associated with PTSD, there is evidence that they are mediated by comorbid symptoms of the disorder (e.g., depression and anxiety) [29].
Post-concussion Syndrome
PCS emerges in a subset of individuals who sustain a mild traumatic brain injury (mTBI) or concussion. It includes a constellation of prolonged symptoms, which persist several months after the mTBI. Symptoms can be categorized as vestibular, cognitive, affective, and somatosensory [30–32]. In military service members, diagnosis can be more complex since it has high co-morbidity with PTSD, along with homogeneity of symptomatology between the two disorders [33, 34].
In summary, although the neuropsychiatric disorders delineated have well established diagnostic criteria, overlapping symptoms with other neuropsychiatric disorders are common, and in some cases manifest as comorbidities. The neural circuits implicated in a given disorder are also often overlapping with that of other disorders. In addition, conventional diagnostic categories often do not adequately capture the spectrum of symptoms and impairments ranging from mild to severe. Further, categorization of subgroups within several disorders have yet to be fully characterized. Thus, neuroimaging-based diagnostic classification and biomarkers can improve our understanding of subgroups within a specific neuropsychiatric disorder and eventually improve diagnostic precision.
This approach has indeed been promoted actively by the National Institute of Mental Health (NIMH) in the United States by the publication of “Research Domain Criteria” (RDoC, http://www.nimh.nih.gov/research-priorities/rdoc/nimh-research-domain-criteria-rdoc.shtml). RDoC is agnostic to present disorder categories. Its intent is the generation of disorder classifications in a data-driven fashion. The “core unit of analysis” as advanced by RDoC is the “measurements of particular circuits as studied by neuroimaging techniques.” In keeping with this ideology, a recent report demonstrated how data-driven definition of diagnostic groups in psychiatric spectrum disorders could identify new groups that had better mapping onto behavioral clusters [35, 36]. Our approach in this work is inspired by these recent developments.
Resting-state functional magnetic resonance imaging (rs-fMRI) is a promising tool for studying neuropsychiatric disorders [37–42]. It measures spontaneous fluctuations in the blood oxygen level-dependent (BOLD) signal, while the participants do not perform any explicit task [43, 44]. Considering machine learning applied to rs-fMRI, a common methodology is to apply supervised classification methods on functional connectivity (FC) features obtained from rs-fMRI to identify brain-based disorders with FC aberrations. For example, some studies [6] used support vector machine (SVM) and artificial neural network (ANN) on different brain connectivity measures to identify ADHD. Khazaee et al. [3] combined a graph theoretical approach with SVM to classify patients with AD and MCI from healthy individuals. Plitt et al. [2] applied different classification methods, e.g., K-nearest neighbor (KNN), linear support vector machines (L-SVM), Gaussian kernel support vector machines (rbf-SVM) and L1-regularized logistic regression on rs-fMRI connectivity features to establish biomarkers for Autism spectrum disorders (ASD). However, the supervised machine learning methods used in such studies requires a priori clinical diagnoses to guide classification. In addition, most studies only target classifying one specific illness.
In this work, we attempt to address the aforementioned four challenges in supervised models by deriving a general analysis pipeline for identifying different neuropsychiatric disorders using unsupervised clustering methods. There have been very few studies using unsupervised models on rs-fMRI data to identify different neuropsychiatric disorders [1]. The main idea of unsupervised learning or clustering is to group subjects in such a way that those in the same group are more similar to each other than to those in other groups. Three clustering methods were specifically chosen: hierarchical clustering [45], ordering points to identify the clustering structure (OPTICS) [46], and density peak clustering (DPC) [47], since these methods do not require a priori specification of the number of clusters. The commonly used k-means clustering [48, 49] was not considered in this study due to the uncertainty of the number of clusters and sensitivity to outliers. Since clustering accuracy is often lower in high dimensional feature space, feature selection methods were applied. Most existing feature selection algorithms in the machine learning literature focus on heuristic search such as sequential forward searching (SFS) [50], non-linear optimization [51], genetic algorithm (GA) [50], etc. Bradley et al. proposed a non-linear optimization using a non-linear kernel support vector machine. Although this method provides high accuracy, it can only be used in the supervised learning context. SFS was proposed based on a greedy algorithm, which follows the problem-solving heuristic of making the locally optimal decision at each step. Similar to SFS, here we propose a sequential feature ranking (SFR) method by applying ANOVA testing among different groups (e.g., control group, disease subgroups) and then sequentially selecting features from the original dataset based on the p-value of each feature. Although SFS and SFR can be applied in unsupervised learning, they do not guarantee an optimal solution. Therefore, we propose GA as a robust feature selection method for unsupervised learning approaches for the identification of disease clusters from FC features by maximizing the similarity between connectivity and clinical diagnosis, as well as between connectivity and behavioral phenotypes, respectively. The identified clusters were then compared with those obtained from clinical diagnostic criteria and behavioral phenotypes in order to investigate their similarity with disease clusters identified from rs-fMRI connectivity.
Materials and Methods
In this work, a general pipeline has been derived (Figure 1) for identifying different brain-based disorders using unsupervised clustering methods. In addition, several supplementary analyses have been performed, e.g., site-specific analysis for multi-site data, elimination of outlier subjects, and enrichment analysis. The details of each step in the pipeline are described next. ADHD, AD and ASD data were obtained from publicly available databases. Details regarding ethical approvals for those data can be obtained from the links provided below. The PTSD study was carried out in-house, in accordance with the recommendations of Auburn University Institutional Review Board (IRB) and the Headquarters U.S. Army Medical Research and Material Command, IRB (HQ USAMRMC IRB) with written informed consent from all subjects. All subjects gave written informed consent in accordance with the Declaration of Helsinki. The protocol was approved by the Auburn University IRB and the HQ USAMRMC IRB.
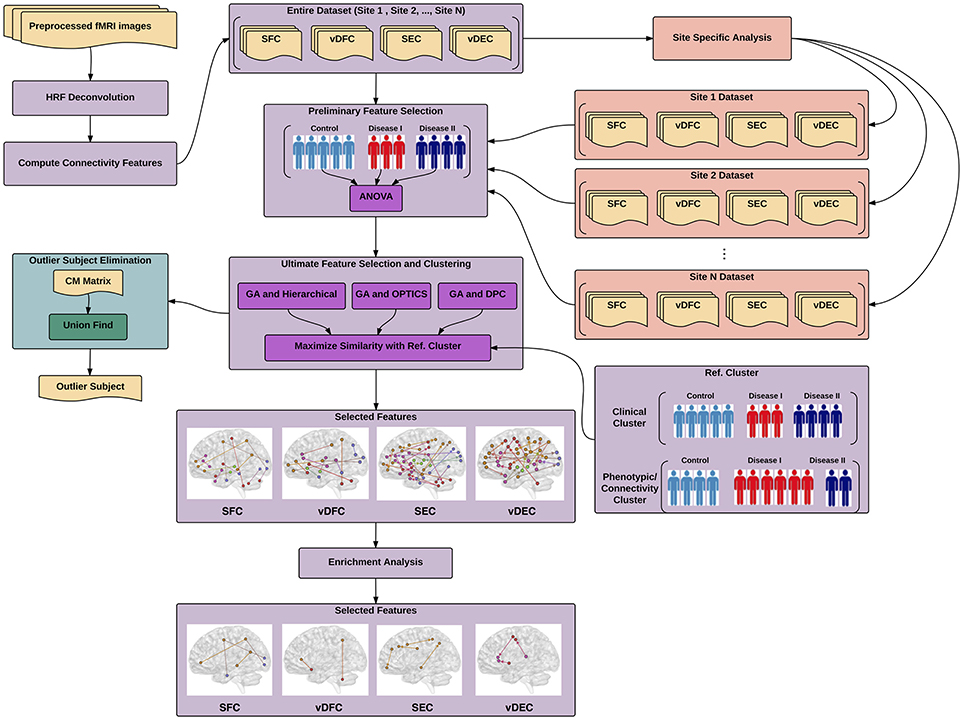
Figure 1. Illustration of proposed pipeline for identifying different brain-based disorders using unsupervised clustering methods. The main pipeline is depicted in purple color along with two supplementary analyses, site-specific analysis in salmon color and outlier subject elimination in green color. SFC, static functional connectivity; vDFC, variance of dynamic functional connectivity; SEC, static effective connectivity; vDFC, variance of dynamic effective connectivity; HRF, hemodynamic response functional; GA, genetic algorithm; DPC, density peak clustering; OPTICS, ordering points to identify the clustering structure: clustering algorithm; CM, co-association matrix.
Participants and Non-imaging Measures
ADHD
Four hundred and eighty-seven subjects with complete phenotypic data were selected from the ADHD-200 dataset (http://fcon_1000.projects.nitrc.org/indi/adhd200/), which included 272 healthy controls (HC), 118 subjects with ADHD-C, and 97 subjects with ADHD-I. The number of subjects with ADHD-H were too small (n < 10), therefore ADHD-H was not considered in this work. The subjects were scanned at one of these three different sites: Peking University, Kennedy Krieger Institute (KKI), and New York University Child Study Center (NYU).
Subjects scanned at Peking University with diagnosis of ADHD were initially identified using the Computerized Diagnostic Interview Schedule IV [C-DIS-IV] [52]. All participants (ADHD and HC) were evaluated with the Schedule of Affective Disorders and Schizophrenia for Children—Present and Lifetime Version [KSADS-PL] [53], with one parent for the establishment of the diagnosis for study inclusion. The ADHD Rating Scale [ADHD-RS-IV] [54, 55] was employed to provide dimensional measures of ADHD symptoms. Intelligence was evaluated with the Wechsler Intelligence Scale for Chinese Children-Revised [WISCC-R] [56].
In the KKI sample, psychiatric diagnoses were based on evaluations with the Diagnostic Interview for Children and Adolescents, Fourth Edition [DICA-IV] [57], a structured parent interview based on DSM-IV criteria; the Conners' Parent Rating Scale-Revised, Long Form [CPRS-R] [58], and ADHD-RS-IV. Intelligence was evaluated with the Wechsler Intelligence Scale for Children-Fourth Edition [WISC-IV] [59] and academic achievement was assessed with the Wechsler Individual Achievement Test-II [60].
In the NYU sample, psychiatric diagnoses were based on evaluations with KSADS-PL, administered to parents and children and CPRS-R. Intelligence was evaluated with the Wechsler Abbreviated Scale of Intelligence [WASI] [61].
Six Phenotypic variables were measured for all sites (Table 1), i.e., three ADHD measures including ADHD index score, Inattentive score, and Hyper/Impulsive score [62], and three IQ measures including Verbal IQ [VIQ], Performance IQ [PIQ], and Full Scale IQ [FIQ] [63].
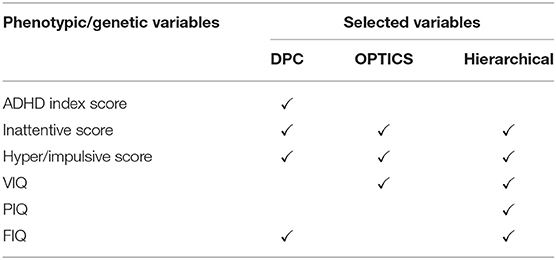
Table 1. Phenotypic variables selected by GA with different clustering methods (ADHD).
AD
Rs-fMRI data from the Alzheimer's disease neuroimaging initiative (ADNI) database (http://adni.loni.usc.edu/) was utilized in this study. The sample consisted of subjects with three progressive stages of cognitive impairment—early MCI [EMCI] (n = 23), late MCI [LMCI] (n = 29), and AD (n = 13)—along with matched HC (n = 31).
The patients with AD had a Mini-Mental State Examination [MMSE] [64] score of 14–26, a Clinical Dementia Rating [CDR] [65] of 0.5 or 1.0 and met the National Institute of Neurological and Communicative Disorders and Stroke and the Alzheimer's disease and Related Disorders Association [NINCDS/ADRDA] criteria [66] for probable AD. The patients with MCI had MMSE scores between 24 and 30, a memory complaint, objective memory loss measured by education adjusted scores on Wechsler Memory Scale Logical Memory II, a CDR of 0.5, absence of significant levels of impairment in other cognitive domains, essentially preserved activities of daily living and an absence of dementia [3].
Eight phenotypic variables, i.e., neuropsychiatric inventory [NPI] score [67], geriatric depression scale [GDS] [65], MMSE, CDR and functional assessment questionnaire [FAQ] [68], and one genetic variable i.e., apolipoprotein [APOE] A1 and A2 genotypes [69], were measured (Table 2). Except for the AD dataset, all other three datasets (ADHD, ASD, and PTSD) only have phenotypic variables. Thus, we just refer to these variables as phenotypic variables henceforth.
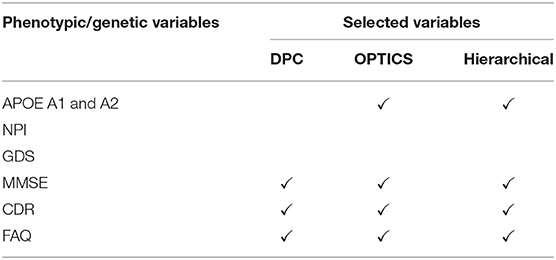
Table 2. Phenotypic variables selected by GA with different clustering methods (AD).
ASD
Four hundred and fifty-four subjects with complete phenotypic data were selected from the Autism Brain Imaging Data Exchange (ABIDE) database (http://fcon_1000.projects.nitrc.org/indi/abide/index.html). The sample consisted of 256 HC, 166 subjects with autism, and 32 subjects with Asperger's. Including PDD-NOS and “Asperger's or PDD-NOS” would have made the whole dataset more unbalanced, therefore these two subgroups were not considered in this study. Each subject was scanned at one of the following seven different sites: California Institute of Technology (Caltech), Carnegie Mellon University (CMU), NYU Langone Medical Center (NYU), University of Pittsburgh School of Medicine (Pitt), San Diego State University (SDSU), Trinity Center for Health Sciences (Trinity), and University of California Los Angeles (UCLA).
For most of the sites, diagnosis of ASD was consistent with the Diagnostic and Statistical Manual of Mental Disorders, Fourth Edition, Text Revision [DSM-IV-TR] criteria [70], and classification of either autism or Asperger's was made by a clinician based on the Autism Diagnostic Observation Schedule [ADOS] [71] and Autism Diagnostic interview-Revised [ADI-R] [72]. HC subjects were screened through a self-report history questionnaire to rule out other disorders, such as ASD, ADHD, or Tourette's Disorder.
Ten phenotypic variables were measured (Table 3) at all sites including three IQ measures, i.e., FIQ, VIQ, PIQ, four ADI_R measures, i.e., Reciprocal Social Interaction Subscore [ADI_R_SOCIAL], Abnormalities in Communication Subscore [ADI_R_VERBAL], Restricted, Repetitive, and Stereotyped Patterns of Behavior Subscore [ADI_RRB], Abnormality of Development Evident at or Before 36 Months Subscore [ADI_R_ONSET], and three ADOS measures, i.e., Classic Total ADOS Score [ADOS_TOTAL], Communication Total Subscore of the Classic ADOS [ADOS_COMM], and Social Total Subscore of the Classic ADOS [ADOS_SOCIAL].
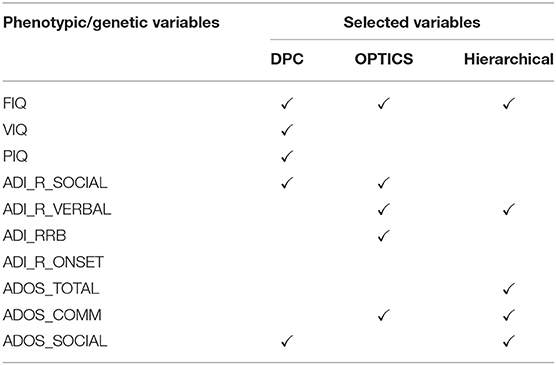
Table 3. Phenotypic variables selected by GA with different clustering methods (ASD).
PTSD and PCS
Eighty-seven active-duty male U.S. Army Soldiers (selected from Fort Benning, GA, USA and Fort Rucker, AL, USA) voluntarily participated in the current study. All of subjects had combat experience in Iraq (Operation Iraqi Freedom [OIF]) and/or Afghanistan (Operation Enduring Freedom [OEF]). Each subject was evaluated using three factors: (1) symptom severity in PTSD measured with “PTSD Checklist-5” [PCL5] score [73], (2) symptom severity in PCS measured with “Neurobehavioral Symptom Inventory” [NSI] score [74], and (3) medical history. Based on these factors, (i) 17 subjects were grouped as PTSD with no history of mTBI in the last 5 years, a total score ≥38 on PCL5 and < 26 on NSI, (ii) 42 subjects were grouped as the comorbid PCS+PTSD with a history of medically documented mTBI, post-concussive symptoms, and scores ≥38 on PCL5 and ≥26 on NSI, and (iii) 28 subjects were grouped as combat controls with a score < 38 on PCL5 and < 26 on NSI, no DSM-IV-TR or DSM-V diagnosis of a psychotic disorder (e.g., schizophrenia), no mTBI within the last 5 years, and no history of a moderate-to-severe TBI. All of these three groups were matched in age, race, deployment history, and education. Comparing NSL score and PCL5 score among these groups, it can be seen that NSI scores were significantly different between the PCS+PTSD group and the PTSD and control groups combined (p = 1.32 × 10⁻²⁹). Also the PCL5 scores were significantly different between the control group and the PTSD and PCS+PTSD groups combined (p = 3.64 × 10−44).
Thirty-two phenotypic variables were used including ten primary Neurocognitive measures CNS-Vital Signs® [CNS-VS] measures [75] (which is a computerized neurocognitive assessment battery), seven derived CNS-VS domain scores, eight self-report psychological health measures, and seven neurocognitive measures from a second battery, the Automated Neuropsychological Assessment Metric (ANAM 4.0) (Table 4). The ten primary CNS-VS measures were Symbol Digit Coding [SDC; correct responses], Stroop Test [ST] (simple and complex), Shifting Attention Test (SAT), Continuous Performance Test [CPT; correct responses and reaction time, RT], Dual-Task Test [DTT; correct responses and RT], and Digit Span Test [DST]. Seven derived CNS-VS domain scores were verbal memory [VM], complex attention [CA], reaction time [RT], processing speed [PS], cognitive flexibility [CF], executive functioning [EF], and neurocognitive composite index [NCI], which was computed by averaging the other six domain scores. Domain scores were standardized to have a mean of 100 and standard deviation of 15. In addition, data from the ANAM seven subtests were included—Coded Digit Substitution [CDS], Coded Digit Substitution-Delayed [CDD], Matching to Sample [MTS], Mathematical Processing [MP], Procedural Reaction Time [PRT], Simple Reaction Time [SRT], and Simple Reaction Time-Delayed [SRT2]. Effort was also assessed to improve the validity of our assessment data. Finally, the Test of Memory Malingering (TOMM) was applied consisting of two learning trials and a retention trial that uses pictures of common, everyday objects (e.g., chair, pencil). A cut-off score (< 45 correct) for the first two learning trials was used to determine eligibility for participation in the study.
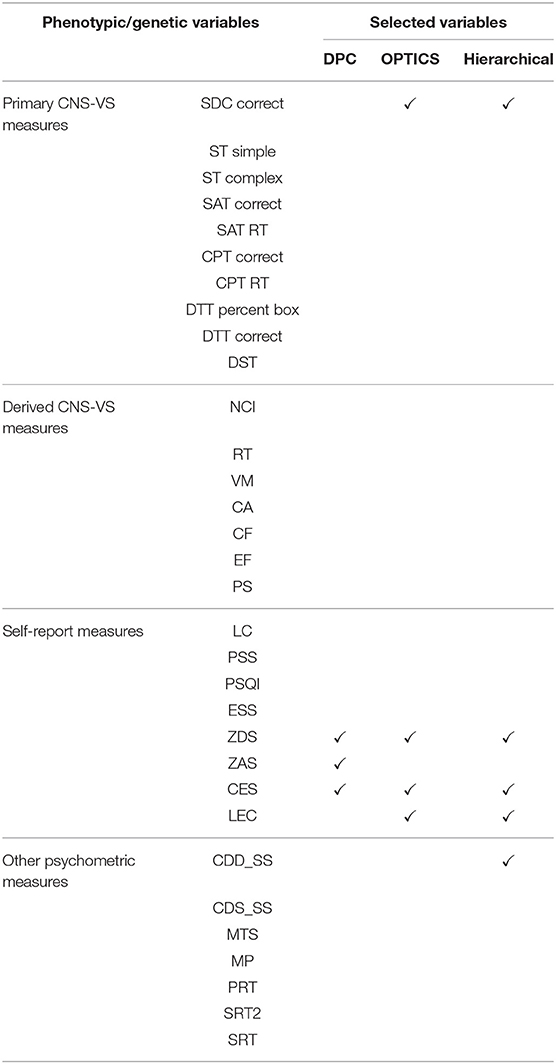
Table 4. Phenotypic variables selected by GA with different clustering methods (PTSD/PCS).
Psychological health was assessed using five self-report measures—Perceived Stress Scale [PPS], Pittsburgh Sleep Quality Index [PSQI], Epworth Sleepiness Scale [ESS], Zung Anxiety Scale [ZAS] and Zung Depression Scale [ZDS]; and three exposure/injury descriptive measures—Combat Exposure Scale [CES], lifetime concussions [LC], and Life Events Checklist [LEC].
The study protocol and procedures were approved by the Auburn University Institutional Review Board (IRB) and the Headquarters U.S. Army Medical Research and Material Command, IRB (HQ USAMRMC IRB).
Data Acquisition and Preprocessing
For each neuropsychiatric disorder, an rs-fMRI dataset was obtained using different scanners with different parameters. A standard preprocessing was then performed on each dataset, individually. The details of data acquisition and preprocessing are described in Supplementary Material: Data Acquisition and Preprocessing.
Connectivity Measures
Given the high dimensionality of whole-brain data, each rs-fMRI image was partitioned into 200 (for ADHD, AD, and ASD) or 125 (for PTSD/PCS) functionally homogenous regions of interests (ROIs) using spatially constrained spectral clustering [cc200 template] [76]. Even though the same parcellation was used on all the datasets, we ended up with only 125 regions for the PTSD/PCS dataset since we had limited brain coverage (cerebellum was excluded). The mean time series for each ROI was subsequently extracted. Deconvolution of ROI time series was then performed using the method proposed by Wu et al. [77] to obtain hidden neuronal time series [78–81]. Deconvolution was performed because fMRI is an indirect measure of neural activity that can be influenced, at least in-part, by non-neural factors which control the shape of the hemodynamic response function (HRF), and deconvolution minimizes the inter-subject and spatial variability of the HRF that could potentially give rise to false connectivity estimates [82–91].
Next, four connectivity matrices—statistic functional connectivity (SFC), variance of dynamic functional connectivity (vDFC) [92], statistic effective connectivity (SEC) [93–96], and variance of dynamic effective connectivity (vDEC) [97–99]—were computed using the latent neuronal time series.
Functional connectivity (FC) refers to the functional co-activation between two different brain regions. In this study, static functional connectivity (SFC) was evaluated using Pearson's correlation coefficient, which gives a constant measure of connection strength between two time series. Although most of studies investigate SFC assuming the connectivity is temporally stable, it has been shown that dynamic changes in FC are relevant to neuropathology [100] as well as behavioral performance in different cognitive domains in healthy individuals [92]. Hutchison and his colleagues also provided a comprehensive overview of dynamic functional connectivity (DFC) in rs-fMRI [101]. In this study, similar to our previous study [92], DFC was evaluated using a sliding windowed Pearson's correlation with variable window length. The window length was determined adaptively by timeseries stationarity assessed through the augmented Dickey-Fuller test (ADF test), which searches for the optimal window length within a specified range using stationarity of the signal as the criteria for optimization. According to Jia's [92] study, we used a liberal range of 20–140 data points in this work.
While FC is a non-directional quantity, another approach to brain connectivity modeling is effective connectivity (EC), which characterizes directional causal interactions in the brain. It gives characteristically different information from FC, i.e., the former characterizes causal influences while the latter captures co-activation, both of which have been acknowledged as distinct modes of communication in the brain [93]. We evaluated SEC using Granger causality [102–104], which quantifies the directional influence of one region over the other. We also evaluated its time-varying version, DEC [105–108], using time-varying Granger causality evaluated in a dynamic Kalman filter framework [109–112].
SFC, DFC, SEC, and DEC values were obtained between all pairs of brain regions. Variance of DFC (and DEC) were computed to obtain vDFC (and vDEC). This provides a single measure of variability of connectivity over time for every connection [84, 113]. In effect, we employed the measures of strength and temporal variability of co-activation and causality in this work. Significant group differences were obtained with each of these measures for each of the datasets using one-way ANOVAs, and only the top significant features (p < 0.01) were used in further clustering analysis. This was done in order to minimize the effect of noisy measurements and outliers on clustering analysis.
Clustering and Feature Selection
In order to test whether clinical diagnostic grouping was grounded in the underlying neurobiological and phenotypic clusters, the three clustering methods, i.e., hierarchical clustering [45, 114, 115], Ordering Points to Identify the Clustering Structure—OPTICS [46], and Density Peak Clustering—DPC [47], were applied on three types of features: (i) connectivity-based features: SFC, SEC, vDFC, and vDEC, (ii) clinical diagnostic measures, and (iii) phenotypic and genetic (when available) variables. In each clustering method, there are several user specified input parameters and the clustering results greatly depend on these parameters. To determine the optimal value for each input parameter, the Calinski-Harabasz (CH) index [116, 117] was applied in this work. Detailed description of each of the clustering methods as well as parameter optimization are described in section 3 of the Supplementary Material.
The clustering accuracy is often lower in high dimensional feature space, because most of the features may be irrelevant, redundant, or sometimes may even misguide results. Moreover, a large number of features make the clustering results difficult to interpret. Therefore, it is necessary to select a minimum subset of relevant features to achieve a meaningful cluster separation. For supervised learning, feature selection can be trivial, i.e., only the features that are related to the given cluster labels are maintained. Nevertheless, for unsupervised learning, the cluster labels are unknown. Thus, finding the relevant subset of features and clustering the subset of the data must be accomplished simultaneously. In this work, three different feature selection methods were performed, i.e., in house SFR, SFS [50], and GA [118, 119], to find the optimal subset of features. The performances of these three methods were compared in the Results section. Detailed description of these feature selection methods can be found in section 4 of the Supplementary Material.
Site-Specific Analysis
Since we are more interested in the similarity of the clusters obtained from different types of features such as connectivity and phenotypic variables and not per se in the clustering accuracy, we did not perform cross-validation during clustering. However, in order to determine the robustness of clustering and associated features, we performed site specific analysis. As discussed in Supplementary Material: Data Acquisition, ADHD and ASD datasets were obtained from different sites using different scanners, which might introduce inter-site variance and affect the clustering accuracy. To eliminate this variance, site-specific feature selection and clustering were individually applied on data acquired at each site. Let S1 = {F1, F7, ⋯ , Fm} and S2 = {F3, F5, ⋯ , Fn} represent connectivity features selected by the proposed feature selection and clustering framework from site 1 and site 2, respectively. The intersection between S1 and S2 was then used as the new “selected features” for the whole dataset.
Elimination of Outlier Subjects
Real-world data always suffers from different sources of noise, which can introduce outliers in the feature space. The accuracy of clustering depends vitally on the quality of the input data. Accordingly, the most feasible and direct way to improve the effectiveness of clustering is to eliminate outlier subjects from the data.
In this study, three different clustering methods (based on three distinct principles) were employed for revealing hidden structures in the data. For the same input data, different clustering methods will, in general, result in different partitions in terms of the number of clusters and the membership of clusters. It is impractical to find a single clustering method that can handle all the different types of datasets. However, it has been demonstrated that by combining results from different clustering methods into a “co-association” matrix [CM, [120, 121]], true underlying data membership can be identified with more fidelity. Inspired by this theory, we propose a new outlier subject elimination method by applying the union-find algorithm [122] on the co-association matrix so that isolated outlier subjects can be identified, considered as noise in the dataset and eliminated from the analysis.
Given M different partitions for a given dataset with N subjects. The N × N co-association (CM) matrix is then defined as:
Each element in the CM matrix is computed by:
Where CMij is the number of times subjects i and j are assigned to the same cluster among the M partitions.
With the CM matrix we define subjects i and j as a connected pair with condition CMij = 1, which indicates that subjects i and j are always grouped together among the M partitions. Note that CM is a symmetric matrix, thus only upper triangular (or lower triangular) connected pairs need to be considered. A union-find algorithm is then applied so that connected subjects are merged together. Given N subjects and its corresponding CM matrix, the union-find algorithm is described next (Figure 2):
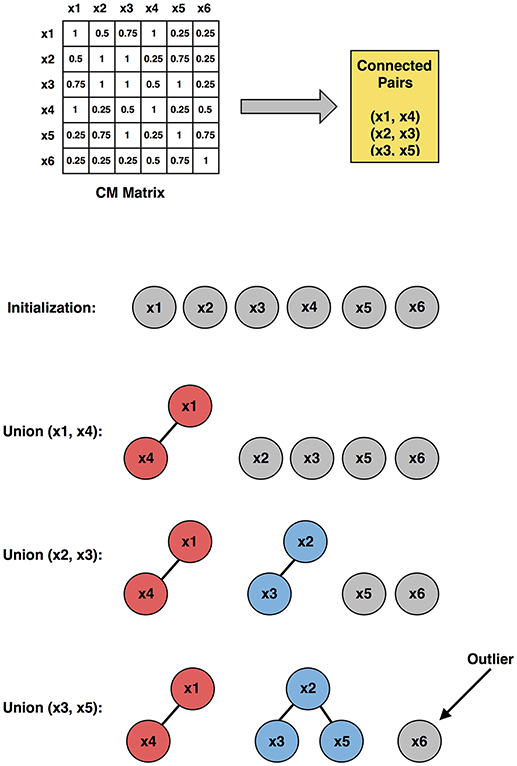
Figure 2. Illustration of the outlier subject elimination process (using upper triangular connected pairs), employing the co-association matrix approach. x1, x2, ⋯ , x6 are six representative subjects used in the illustration.
1. Initially, each subject was considered as a singleton tree with only itself in it.
2. By looking up the CM matrix, the connected pairs were identified.
3. For one connected pair a and b, where a belongs to tree A and b belongs to tree B, a “find” operation was applied to find the root of tree A and root of tree B, respectively.
4. A union operation was then applied to merge trees A and B.
5. Step 3 and 4 were repeated for all connected pairs.
The output of the union-find algorithm was a set of trees, and those trees with only one node in it were considered as outlier subjects.
Functional Interpretation of Selected Connectivity Features—Enrichment Analysis
Interpretation of large-scale neuroimaging finds, e.g., brain connectivity, is often done by associating identified regions or connections to previous studies. Such an approach is developed based on subjective visual inspection or on percent of overlap with existing maps without any statistical justification. Therefore, it has potential risk of false positive interpretations and overlooking additional findings. In this study, to avoid these shortcomings, a functional interpretation method—enrichment analysis [123]—was employed, which provides a quantitative statistical measure on the association between selected connectivity features and pre-defined functional brain networks.
We define the following: (1) a background set S with m predefined ROIs, i.e., 200 ROIs (for ADHD, AD, and ASD) or 125 ROIs (for PTSD/PCS), and (2) a group of n selected connectivity features A = {(p1, q1), (p2, q2), ⋯ , (pn, qn)}, where each pi and qi represents ROIs. Two disjoint subsets of S, C and D (with size mc and md), were generated by enrichment analysis, each of which constitutes a known brain network identified in previous studies. A group B was then generated with all possible ROI pairs (i.e., connectivity features) between C and D. The size of B was determined by K = mc × md. Let x represent the intersection between A and B. The significance of x is the probability of having x or more elements in the intersection, which can be calculated by,
Where is the total pairs of ROIs in the background set S. Equation (14) is the so called hypergeometric (HG) cumulative distribution, which is equivalent to a one-tailed Fisher's exact test. The underlying null hypothesis of this test is that A was randomly selected from the set of all groups of ROI pairs with the same number of connectivities n over the same set of ROIs. By using this method, the statistically significant brain network-to-network (N2N) connections can be verified and quantified with corresponding p-values.
The entire pipeline for identifying different brain-based disorders, along with several supplementary analyses, e.g., site-specific analysis, elimination of outlier subjects, and enrichment analysis, is illustrated in Figure 1.
Results
The optimal values of each input parameter determined for the three clustering methods are presented in Tables 5, 6. Different feature selection methods were compared in terms of peak similarity obtained for the different neuropsychiatric disorders. From Tables 7–10, it can be seen that the minimum subset of features selected by GA consistently resulted in the highest similarity between clusters obtained from clinical diagnoses, fMRI-based connectivity and phenotypic variables. Using GA, the average and maximum similarities between connectivity and clinical diagnosis were 80.59 and 100%, respectively, the average and maximum similarities between connectivity and phenotypic variables were 76.72 and 80.38%, respectively, and the average and maximum similarities between clinical diagnosis and phenotypic variables were 73.06 and 76.62%, respectively. SFS was less reliable than GA in that the average and maximum similarities achieved between connectivity and clinical diagnosis were 72.20 and 100%, respectively; and the average and maximum similarities between connectivity and phenotypic variables were 66.95 and 72.22%, respectively. For similarity, the number of features determined by SFS was larger than that selected by GA. For instance, in the PTSD/PCS dataset, although the peak similarities obtained by using SFS and GA with OPTICS were similar, the number of features selected by these two methods were 84 and 15, respectively. The similarities obtained by SFR were much lower than that obtained by SFS and GA, and the number of clusters determined using SFR was different from that using SFS and GA in all datasets. The convergence of SFR, SFS, and GA were also compared. In Figure 3, the similarity between connectivity and phenotypic variables obtained using hierarchical clustering and different feature selection methods was plotted as a function of the number of iterations in ADHD dataset. The shape of the curve looks comparable between connectivity and clinical diagnosis for the different clustering methods, but the amplitude may be different. With GA and SFS, a clearly step-wise convergence was observed. Although SFS converged faster than GA, a lower similarity was achieved after the curve became stable. With SFR, no clear convergence was observed (i.e., the curve oscillated dramatically).
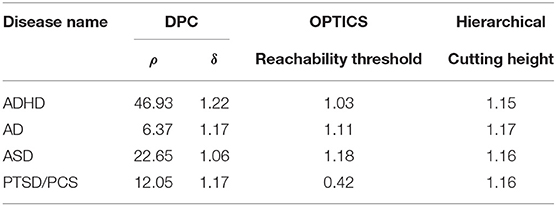
Table 5. Estimated optimal values of each input parameter in clustering for clinical vs. connectivity comparison.
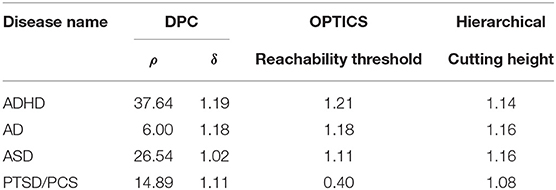
Table 6. Estimated optimal values of each input parameter in clustering for phenotypic vs. connectivity comparison.
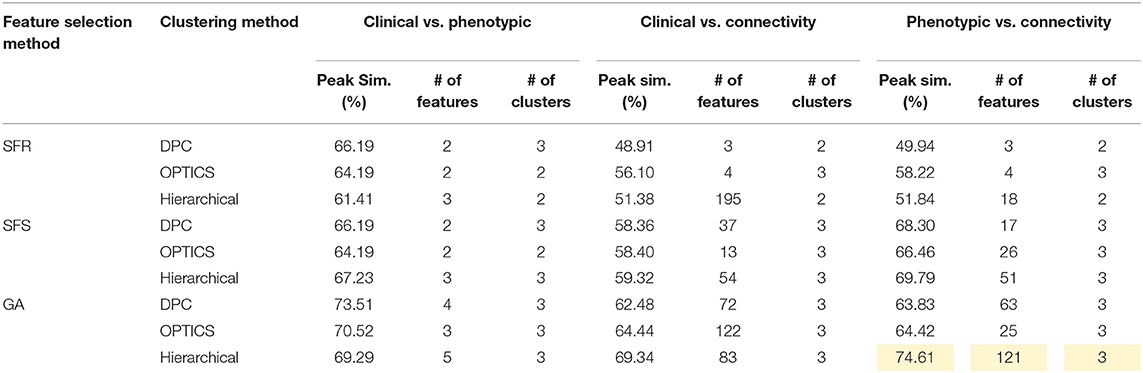
Table 7. Peak similarity (highlighted), corresponding number of features, and number of clusters obtained using SFR, SFS, and GA with different clustering methods for ADHD dataset.
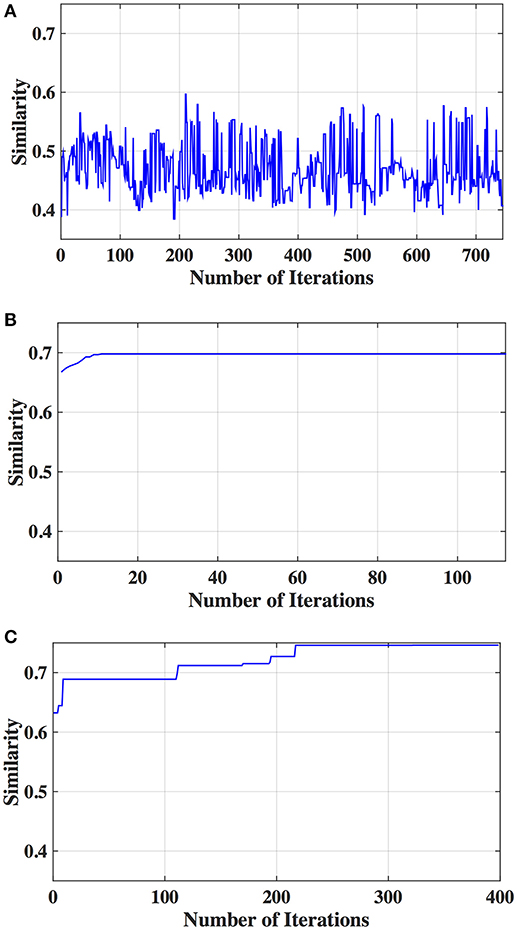
Figure 3. Similarity between connectivity and phenotypic variables obtained from different iterations using hierarchical clustering and different feature selection methods: (A) SFR, (B) SFS, and (C) GA.
The performance of the different clustering methods varied across the datasets. Hierarchical clustering gave higher similarity in ADHD (Table 7) and ASD (Table 8) datasets. OPTICS performed better in AD (Table 9) and PTSD/PCS (Table 10) datasets. DPC also resulted in a higher similarity in PTSD/PCS. The computation time of DPC was longer than hierarchical and OPTICS. For example, using 2.3 GHz Intel Core i7 processor, the computing time for one iteration using the PTSD dataset were as follows: hierarchical clustering took 0.27 s, OPTICS took 0.42 s, and DPC took 5.22 s, due to the fact that more input parameters (ρ and δ) were required to be optimized in DPC than that in hierarchical (cutting height) and OPTICS (threshold of reachability plot). More parameters result in larger searching space.
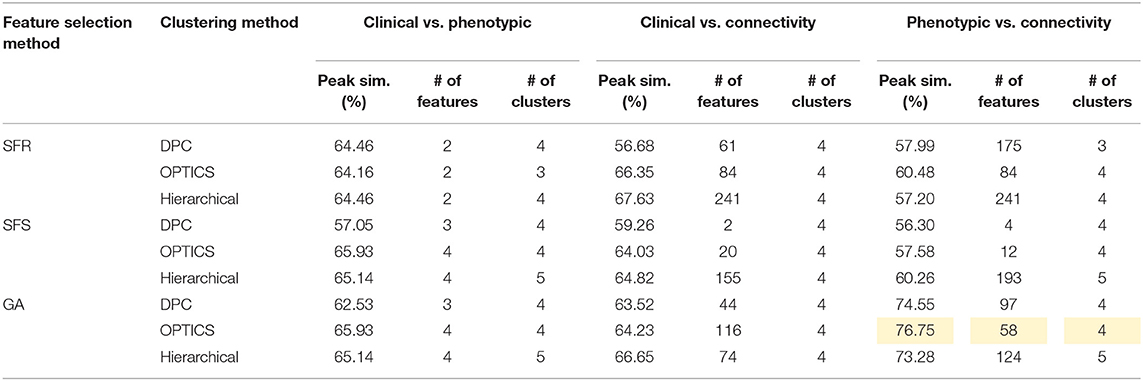
Table 8. Peak similarity (highlighted), corresponding number of features, and number of clusters obtained using SFR, SFS, and GA with different clustering methods for AD dataset.
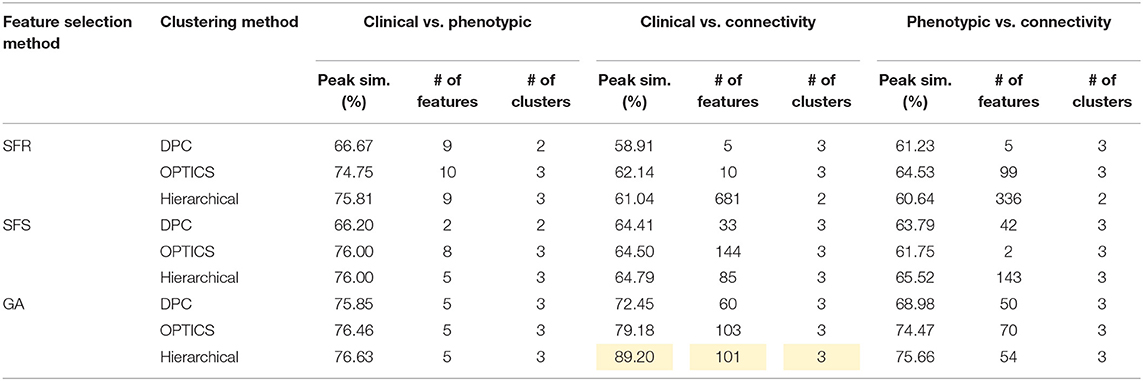
Table 9. Peak similarity (highlighted), corresponding number of features, and number of clusters obtained using SFR, SFS, and GA with different clustering methods for ASD dataset.
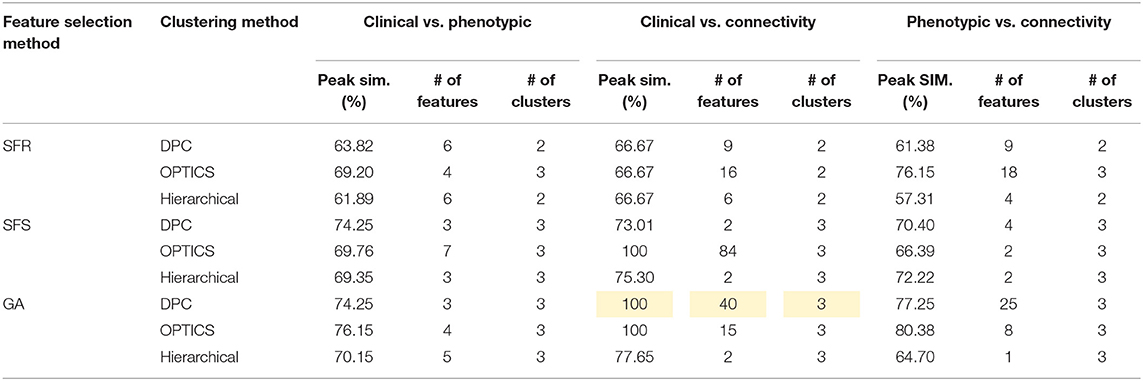
Table 10. Peak similarity (highlighted), corresponding number of features, and number of clusters obtained using SFR, SFS, and GA with different clustering methods for PTSD/PCS dataset.
Site-specific analysis was applied on the ADHD dataset. We could not apply this analysis on ASD dataset since there was only one site that had enough samples for HC and disease subgroups (Table 11) whereas AD and PTSD datasets were obtained on the same scanner. For ADHD dataset, NYU and Peking had more than 30 samples for control, ADHD-C, and ADHD-I (Table 12). Thus, a site-specific analysis was applied on these two sites, individually.
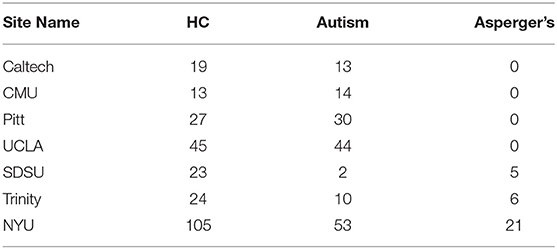
Table 11. Number of subjects provided by each site in the ASD sample.
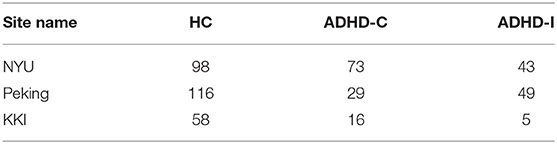
Table 12. Number of subjects provided by three sites in the ADHD sample.
The peak similarity obtained between clinical diagnostic and phenotypic clusters, between clinical diagnostic and connectivity clusters, and between phenotypic and connectivity clusters for site-specific analysis are shown in Table 13. Compared with previous results presented in Table 7 using feature selection and clustering on the entire dataset across different sites, the similarity was increased by applying site-specific analysis for Peking and NYU, individually. The similarity was reduced by applying clustering on the whole datasets with commonly selected features from these two sites.

Table 13. Similarity achieved using data from individual sites and for the whole dataset using features commonly selected by NYU and Peking.
For ADHD and AD, highest similarity was achieved between connectivity and phenotypic clusters and the corresponding similarity between clinical diagnostic and phenotypic clusters was lower. On the other hand, for ASD and PTSD/PCS, highest similarity was achieved between connectivity and clinical diagnostic clusters. This suggests that diagnostic criteria for ASD and PTSD/PCS are mapped well onto underlying neurobiological clusters, while that was not the case for ADHD and AD. Consequently, for ADHD and AD, we reassigned diagnostic labels based on those generated by connectivity clusters to form new neurobiologically-informed groups. In order to verify whether this new grouping is valid, we estimated the statistical separation of phenotypic variables based on the traditional diagnostic grouping as well as with the new neurobiologically informed groups. The results, shown in Figures 4, 5, indicates that almost all p-values were smaller with the new grouping by conducting 2-sample t-test. This suggests that when traditional diagnostic groups do not map well onto underlying neurobiological clusters, connectivity can be used to regroup the subjects so that they map better onto the behavioral phenotypes.
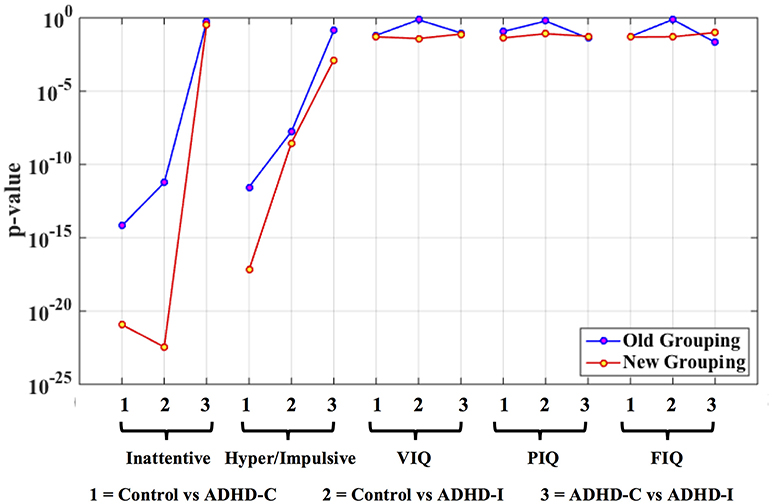
Figure 4. Statistical significance (p-value) of selected phenotypic/genotypic variables with both the traditional clinical diagnostic grouping and the new connectivity grouping. The results are shown here for the ADHD dataset. Logarithmic scale is used for the y-axis of p-values.
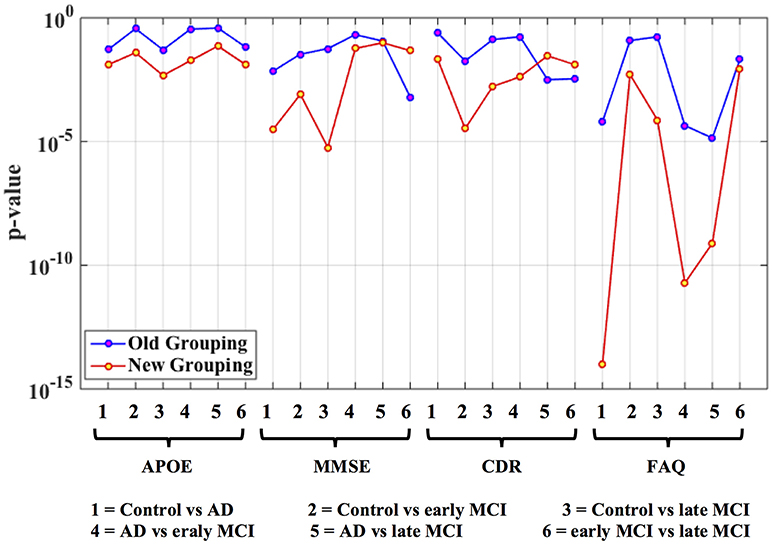
Figure 5. Statistical significance (p-value) of selected phenotypic/genotypic variables with both the traditional clinical diagnostic grouping and the new connectivity-based grouping. The results are shown here for the AD dataset. Logarithmic scale is used for the y-axis of p-values.
The peak similarity obtained with and without outlier subject elimination was compared and is shown in Table 14. Consistently higher similarity was achieved by removing the identified outlier subjects from the dataset. Moreover, in AD dataset, the number of clusters identified by hierarchical clustering was changed from 5 to 4 with outlier elimination (highlighted in Table 14), which matched with the grouping obtained using clinical diagnosis. The data in ADHD and ASD datasets comprised of data acquired at different sites using different scanners, which might explain the fact that the number of outliers identified in ADHD and ASD were generally greater than the other two datasets.
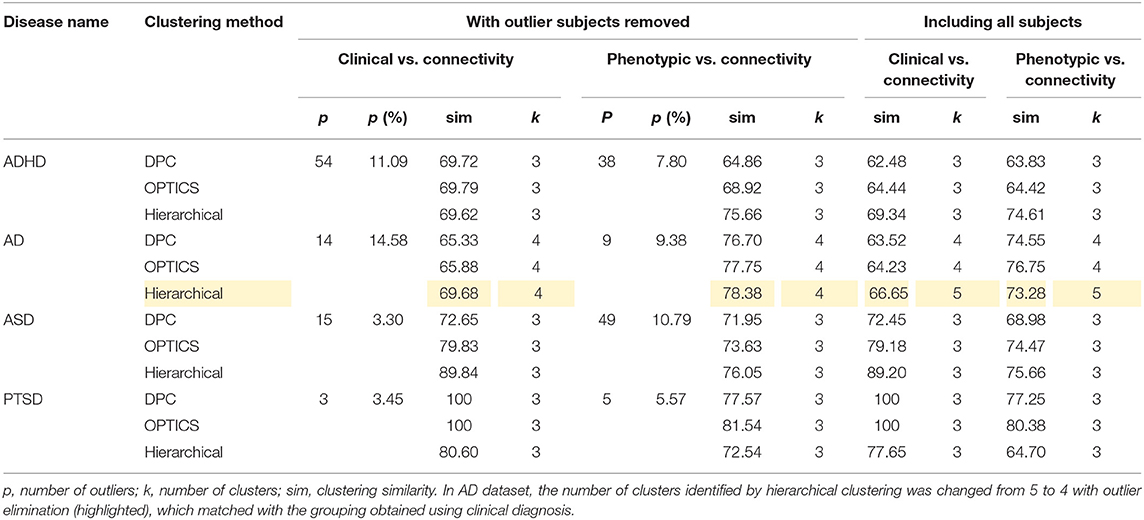
Table 14. Comparison of peak similarity obtained with and without elimination of outlier subjects.
Discussion
In this work, we have proposed a general analysis pipeline for characterizing different neuropsychiatric disorders using unsupervised learning methods. Our results suggest that neurobiological and phenotypic biomarkers could potentially be used as an aid by the clinician, in additional to currently available diagnostic standards, to improve diagnostic precision and identify diagnostic sub-groups. First, we discuss the selected brain connectivity features and phenotypic variables for each disorder and compare our results with previous studies. Second, we elaborate on the implications of results obtained within specific sites in comparison to those obtained from the entire ADHD dataset. Third, we discuss the reassignment of diagnostic labels based on those generated by connectivity clusters. Finally, we delineate the role of outlier subject elimination in unsupervised leaning methods as applied to neuroimaging.
Connectivity Features Important for Clustering
After applying clustering, the selected connectivity features were split into two networks, i.e., (1) a network in which functional/effective connectivities and temporal variability of constituent paths were significantly (p < 0.05, FDR corrected) larger in the control group, and (2) a network in which functional/effective connectivities and temporal variability of the constituent paths were significantly (p < 0.05, FDR corrected) larger in the disease group. Here, “disease group” refers to all pathological subgroups combined. This was done since all disease groups have two or more pathological sub-groups and it becomes increasingly complex to interpret all pairwise differences. Then, these two networks were mapped back to the image space and overlaid on an anatomical glass brain (using BrainNet Viewer 124) for the visualization, respectively. The identified brain networks were then qualitatively interpreted and compared with previous studies using enrichment analysis [123].
Intrinsic connectivity networks (ICNs) denote groups of brain regions that show correlated spontaneous activities at “resting” state [125]. It has been shown that ICNs reflect strong coupling of spontaneous fluctuations in ongoing activity and remain robust under different mental states, e.g., sleep, loss of consciousness, etc. [126, 127]. ICNs provide a common neurofunctional framework for investigating cognitive dysfunction in different neuropsychiatric disorders. There are many stable ICNs that have been identified in the human brain so far. Five of them—default mode network (DMN), visual network (VN), basal ganglia network (BGN), sensory motor network (SMN), and the semantic cognition and attention (SCAN)—have been demonstrated to be particularly important for understanding higher cognitive function and dysfunction, and provide useful models for identifying rs-fMRI connectivity patterns. Below, we discuss the significance of each of these networks to provide a context for presenting alterations in the interactions within and between these networks observed in neuropsychiatric disorders.
The DMN is one of the most well-known ICNs, which is a distributed network anchored in the posterior cingulate cortex [PCC], medial prefrontal cortex [mPFC], medial temporal lobe [MTL], precuneus, anterior cingulate cortex [ACC], inferior parietal lobe [IPL], and medial orbital gyrus [MOG] [128]. The PCC, hippocampus, and angular gyrus are typically associated with episodic memory retrieval [129, 130], autobiographical memory [131], and semantic memory related to internal thought [132]. mPFC has been demonstrated to be associated with self-related and social cognitive processes [133], value-based decision making [134], and emotion regulation [135]. Together, the entire DMN comprises an integrated system involving episodic memory, autobiographical memory, and self-related mental processes.
The VN [136] involves the occipital and bilateral temporal regions including the middle occipital gyrus, inferior temporal gyrus [ITG], fusiform gyrus, and cuneus, which is involved in visual processing and mental imagery [137, 138]. The middle occipital gyrus, ITG, and fusiform gyrus are primarily involved in the higher functions of vision processing, e.g., distinguishing objects among different categories, face recognition, visual words recognition, representation of complex object features, etc. [139, 140]. The cuneus has been demonstrated to be involved in basic visual processing, which receives visual information from retina [141].
The BGN is predominantly located in the basal ganglia including the striatum (which is subdivided into the caudate nucleus and putamen), globus pallidus or pallidum substantia nigra and thalamus [142]. The BGN is associated with a variety of functions including control of voluntary motor movements [143], procedural learning, eye movements [144], cognition [145], emotion [146], etc.
The SMN involves the precentral gyrus, postcentral gyrus, cerebellum, posterior insula, and part of the frontal gyrus corresponding to the primary sensory motor cortex and supplementary motor area [SMA] [147, 148]. Studies have indicated that this network is processing somatosensory stimuli, executing motor movements and sensorimotor integration [149, 150].
The SCAN is defined as regions associated with the semantic cognition network and attention network, which is a network of lateral structures in the frontal and parietal cortices, as well as some temporal regions. The semantic cognition network is primarily made up of three regions, Broca's area, Wernicke's area, as well as parts of the middle temporal gyrus [MTG] [151, 152]. Broca's area is generally defined as comprising Brodmann areas 44 and 45. Area 44 (the posterior part of the inferior frontal gyrus [IFG]) is involved in phonological processing and language production whereas area 45 (the anterior part of the IFG) engages in the semantic aspects of language. Together, Broca's area plays an important role in processing of verbal information [153]. Wernicke's area is traditionally thought to be located in the posterior part of the superior temporal gyrus [STG], which is involved in the comprehension or understanding of written and spoken language [154]. Some studies have showed that the MTG is involved in the retrieval of lexical syntactic information [155]. The attention network is commonly segregated into two distinct networks: a bilateral dorsal attention network (DAN), which includes the dorsal frontal and parietal cortices, and the ventral attention network (VAN), largely right-lateralized, which includes the ventral frontal and parietal cortices [129, 156]. The DAN has been associated with goal-directed, top-down attention processes in inhibitory control, working memory and response selection, whereas the VAN is related with salience processing and mediates stimulus-driven, bottom-up attention processes [157]. Moreover, it is relevant to note that dorsal and ventral systems appear to interact not only during cognitive tasks [158, 159] but also during spontaneous activity [160]. Previous literature suggests that semantic cognition and attention are intimately related. This is also borne out by the fact that many disorders such as ADHD and ASD have simultaneous deficits in semantic cognition and attention. Therefore, we considered this as one network.
A qualitative as well as quantitative interpretation of alterations of these INCs and other related brain regions in different neuropsychiatric disorders are discussed below. For each pathology, we chose the features that gave us highest similarity between clusters obtained from clinical labels, connectivity features and phenotypic features. For ADHD and AD, highest similarity was obtained between connectivity and phenotypic clusters while for ASD and PTSD/PCS, highest similarity was obtained between clinical labels and connectivity clusters. Therefore, the features obtained in these two different scenarios have different implications. For ADHD and AD data sets, it suggests that traditional clinical diagnostic grouping may not neatly map onto neurobiological and neurobehavioral clusters. This may be because of uncertainty in clearly identifying differences between disease sub-groups in ADHD (ADHD-C and ADHD-I) and AD (EMCI, LMCI, and AD). Contrarily, for ASD and PTSD/PCS data sets, it suggests that traditional clinical diagnostic grouping may in fact map well onto at least neurobiological clusters. These facts are borne out by computing the purity of clusters obtained from connectivity features for disease sub-groups within each data set. To measure cluster purity, the clusters obtained using connectivity features were regrouped using the diagnostic label, and each subject was assigned to majority class in the current cluster. Then the accuracy was measured by counting the number of correctly assigned subjects within each cluster and took the average. The cluster purity for ADHD, AD, ASD, and PTSD/PCS were 0.73, 0.75, 0.94, and 1.00, respectively. It can be seen that ASD and PTSD/PCS data sets had high purity while for ADHD and AD, the purity of clusters for disease subgroups was qualitatively lower.
ADHD
One hundred and twenty-one relevant connectivity features were selected by GA and hierarchical clustering (since this combination gave highest similarity between connectivity and phenotypic features), which were 26 SFC, 14 vDFC, 53 SEC, and 28 vDEC. These features include connections in all lobes of the brain (Figure 6). With enrichment analysis, two N2N interactions were selected for SFC, i.e., the interactions within the BGN and the interaction between the VN and SMN, including connections between the cerebellum and occipital lobe, between the insula and fusiform, and between the caudate and thalamus. In addition, two N2N interactions were selected for the SEC, i.e., from the BGN to VN, and from the SCAN to SMN, including connections from the caudate to occipital lobe and ITG, from the IFG and MFG to posterior insula, from the IFG to postcentral gyrus, and from the STG to cerebellum (Table 15).
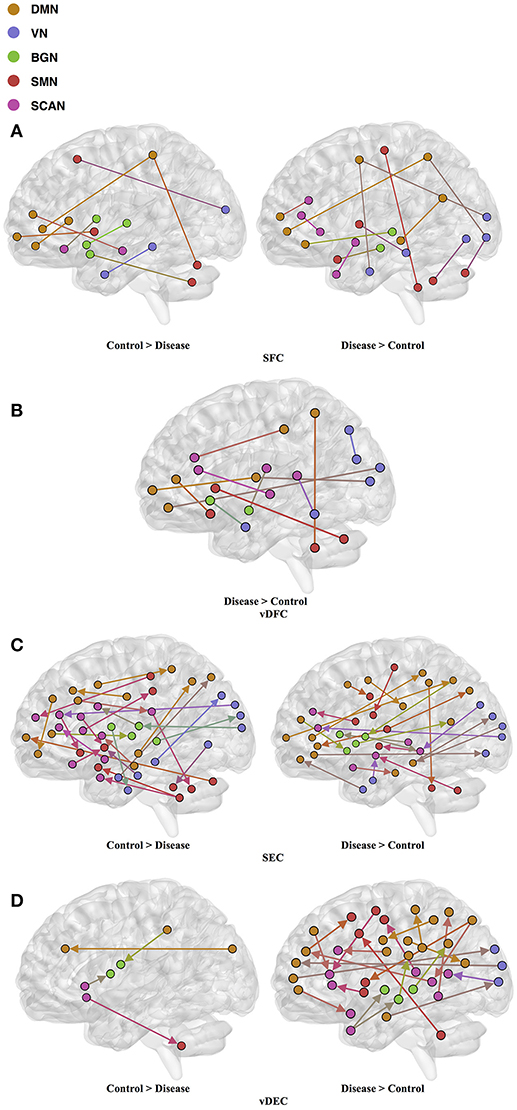
Figure 6. (A) SFC; (B) vDFC; (C) SEC; (D) vDEC features. selected by GA and hierarchical (ADHD). Selected features were split into two groups, i.e., (1) control > disease (ADHD-C and ADHD-I) and (2) disease > control. DMN, Default mode network; VN, Visual network; BGN, Basal ganglia network; SMN, Sensory motor network; SCAN, Semantic cognition and attention network.
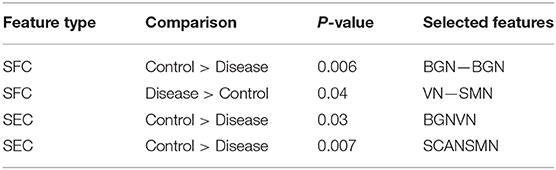
Table 15. Network-to-network interactions selected by enrichment analysis for ADHD dataset.
Most of the rs-fMRI studies have demonstrated atypical functional activations in the frontal, temporal, parietal lobes, and cerebellar regions [161–163] in ADHD. Multiple studies have found aberrant functional connectivity among the brain regions of the DMN, SCAN, and BGN [164–167]. Abnormal functional activations in the orbitofrontal cortex [OFC] have been suggested to influence behavioral inhibition in children with ADHD [168]. Resting-state fMRI studies have frequently reported disrupted functional connectivity between the ACC and PCC in ADHD [169, 170]. Significantly decreased activations have been reported in the PFC, SPL, and IFG in ADHD, during multiple cognitive performance tasks and in resting-state [163, 171, 172]. One fMRI study conducted in adults with childhood ADHD showed reduced activations in bilateral IFG, left parietal lobe, caudate, and thalamus [162]. Another study found reduced functional connectivity between thalamus and other BGN areas (e.g., putamen, caudate) with ADHD [167]. Some studies have also identified reduced activations in the IFG [173] and STG [174] in ADHD patients. Kessler et al. [175] observed reduced connectivity between the SCAN and SMN and increased connectivity within the VN by applying joint independent component analysis on the ADHD-200 sample. On the other hand, increased functional connectivity in the DMN, BGN, SMN, and VN has been observed in some studies [176, 177]. Significantly increased functional connectivity between the ACC and the thalamus, cerebellum, and insula have been shown during resting-state in children with ADHD, compared to controls [170, 178, 179]. Li et al. [166] found increased connectivity between the right pulvinar and occipital regions, during a visual sustained attention task-based fMRI study. Hale et al. [180] also observed reduced activations in the VN and DMN, during letter and location judgment tasks. The features selected by GA for maximizing the similarity between connectivity and phenotypic clusters and the subset of significant N2N interactions determined by enrichment analysis are in agreement with previous literature implicating the very same regions and connections in ADHD.
AD
Fifty-eight features were selected by GA and OPTICS (since this combination gave highest similarity between connectivity and phenotypic features), including 32 vDFC features and 26 SFC features. Most of features were related to the DMN, VN, SMN, and SCAN (Figure 7). With enrichment analysis, two N2N interactions were selected for the SFC, i.e., the interaction between the DMN and SMN, and that between the DMN and VN, including connections between the ACC and middle occipital gyrus, between the PFC and fusiform, between the IPL and ITG, between the SFG and insula, between the hippocampus and SMA, between the cerebellum and SFG, and between the cerebellum and PFC. In addition, two N2N interactions were selected for vDFC, i.e., the interactions within the SCAN, and between the DMN and SCAN, including connections between the MTG and STG, between the PFC and IFG, between the precuneus and IFG, between the precuneus and MTG, between the PFC and STG, and between the MTG and IPL (Table 16).
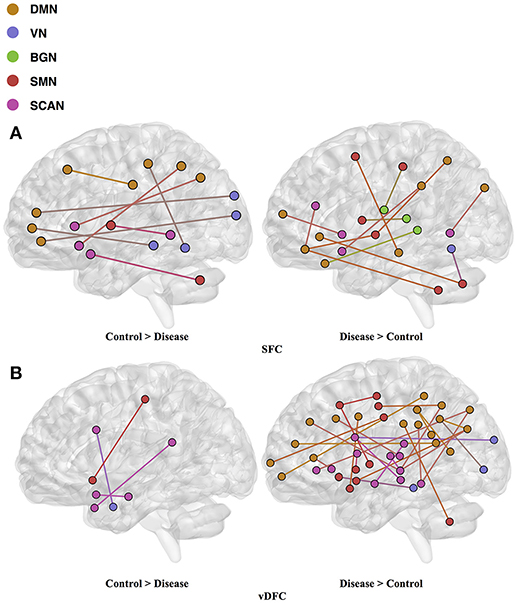
Figure 7. (A) SFC; (B) vDFS features. selected by GA and hierarchical (AD). Selected features were split into two groups, i.e., (1) control > disease (AD, LMCI and EMCI) and (2) disease > control. DMN, Default mode network; VN, Visual network; BGN, Basal ganglia network; SMN, Sensory motor network; SCAN, Semantic cognition and attention network.
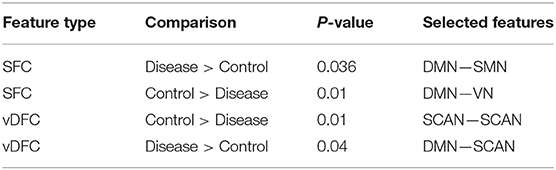
Table 16. Network-to-network interactions selected by enrichment analysis for AD dataset.
Several previous studies have indicated dysfunctions in different regions of the DMN, VN, SMN and SCAN in the AD and MCI populations [181, 182]. Some studies have observed decreased connectivity in the DMN coupled with an increased connectivity within prefrontal regions [183–185]. Significant alterations of connectivity in the MTG, PCC, hippocampus, and angular gyrus, have been observed in AD [130, 186]. The dysfunction in the MTG, which is referred to as a central hub of the SCAN [187], is suggested as an early feature of AD [188]. A lesser degree of the MTG activation has been observed in MCI [189, 190] compared to controls. The medial parietal cortex, including the PCC and precuneus, are selectively vulnerable to amyloid deposition in AD [187], and studies of cortical metabolism using positron emission tomography and single photon emission computed tomography in AD suggest that abnormalities in the PCC and precuneus are early features of AD [188]. A voxel-based study showed that AD patients had both decreased activity of the right MFG and an increased activity of the right parietal cortex [191]. Reduced connectivity in the temporal lobe was also observed in different rs-fMRI studies [182, 184]. Multiple studies have suggested that the insula is involved in AD [192–194] and some of the behavioral abnormalities in AD may reflect insular pathology. Brier et al. [38] observed reduced anti-correlations between the DMN and SMN, and between the DMN and SCAN, during a rs-fMRI study. Li et al. [195] also found aberrant connectivity between the DMN and SCAN, as well as between the DMN and SMN. These previous studies seem to support our findings regarding features which are important for unsupervised clustering of control, EMCI, LMCI and AD groups.
ASD
Seventy-six features were selected using GA and hierarchical (since this combination gave highest similarity between connectivity features and clinical diagnosis)−30 SFC, 11 vDFC, 27 SEC, and 9 vDEC—involving the frontal, parietal, temporal lobes, and cerebellar regions (Figure 8). With enrichment analysis, two N2N interactions were selected for the SFC, i.e., the interaction within the DMN, and between the DMN and VN, including connections between the PFC and angular gyrus, between the SFG and angular gyrus, between the ACC and parahippocampal gyrus, between the MOG and parahippocampal gyrus, between the ACC and fusiform, between the SFG and ITG, and between the ACC and ITG. One N2N interaction was selected for the vDFC, i.e., the interaction between the BGN and SCAN, including connections between the caudate and MTG, and between the thalamus and STG. In addition, one N2N interaction was selected for the SEC, i.e., from the DMN to SMN, including connections from the MOG to precentral, from the hippocampus to posterior insula, and from the precuneus to cerebellum (Table 17).
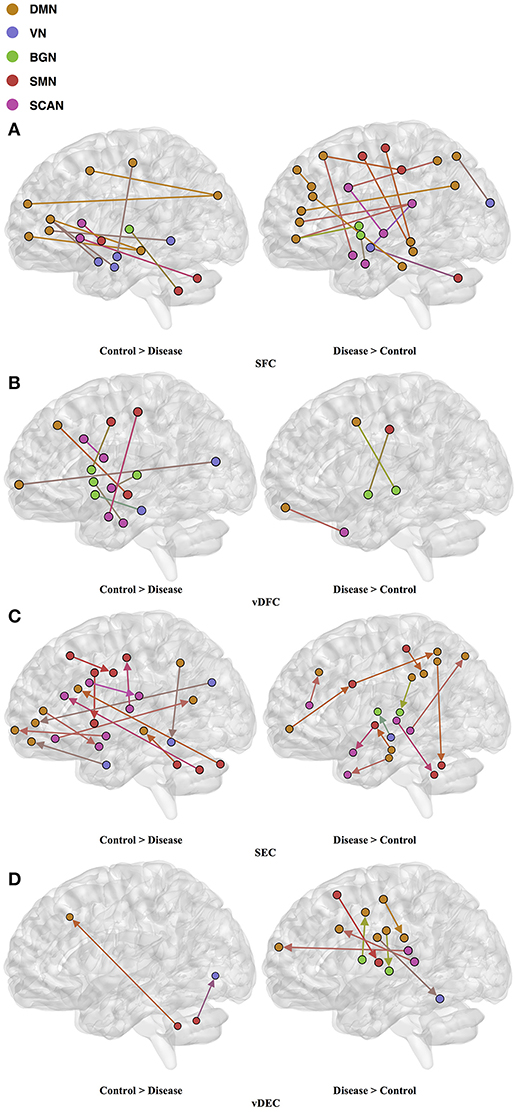
Figure 8. (A) SFC ; (B) vDFC; (C) SEC; (D) vDEC features. selected by GA and hierarchical (ASD). Selected features were split into two groups, i.e., (1) control > disease (autism and asperger's) and (2) disease > control. DMN, Default mode network; VN, Visual network; BGN, Basal ganglia network; SMN, Sensory motor network; SCAN, Semantic cognition and attention network.
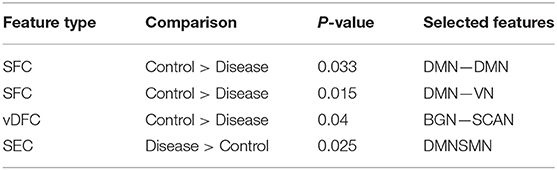
Table 17. Network-to-network interactions selected by enrichment analysis for ASD dataset.
Several recent studies have observed abnormal connectivity in the DMN, SCAN, SMN, BGN and VN in the pathophysiology of ASD [196, 197]. A recent meta-analysis showed alterations in the MTG, hippocampus, as well as the posterior medial cortex in ASD [198], which were suggested to be related to deficits in social information processing. It has been shown that the PCC and mPFC in ASD are hypoactive compared with healthy controls [199]. Decreased connectivity between the PCC and SFG, the PCC and temporal lobes, as well as the PCC and parahippocampal gyri were observed, which were associated with poor social skills [200]. Dysfunction in the SCAN has been shown to be related to deficits in language and communication in individuals with ASD. Reduced activation and functional connectivity in the frontal-temporal SCAN were observed by Mody et al. [201]. A recent rs-fMRI study found a marked loss of functional connectivity between the right cerebellar region and regions in the SCAN [202]. Weaker connection between the SMA and ventral premotor cortex was found in the ASD group compared with controls, which has been hypothesized to underlie the initiation of speech motor actions [203]. Decreased connectivity between the BGN and the occipital region and prefrontal cortical regions was also found by Prat et al. [204]. A meta-analysis identified the posterior insula as a consistent locus of hypoactivity in ASD [199]. Other fMRI studies have also suggested that the insula is one possible key dysfunctional area in ASD [205]. In contrast, a recent rs-fMRI study [206] observed stronger functional connectivity within several large-scale brain networks in children with ASD compared with controls, including the DMN, SCAN, SMN, BGN, and VN. It has been suggested that developmental trajectories in ASD can be both heterogeneous and aberrant compared to neurotypicals and hyper- or hypo-connectivity is observed depending on when the data is acquired during development [206]. Our results are in broad agreement with previous fMRI literature in ASD discussed above.
PTSD/PCS
Fifteen features were selected by GA and OPTICS (since this combination gave the highest similarity between connectivity features and clinical diagnosis); 2 SFC, 5 vDFC, 2 SEC, and 6 vDEC. These features were mainly located in the DMN, BGN, and SCAN (Figure 9). With enrichment analysis, one N2N interaction between the DMN and BGN was selected for both the SFC and vDFC. This involved connections between the ACC and caudate, and between the parahippocampal gyrus and caudate. In addition, one N2N interaction from the DMN to BGN was selected for the vDEC, which included the connection from the parahippocampal gyrus to caudate (Table 18).
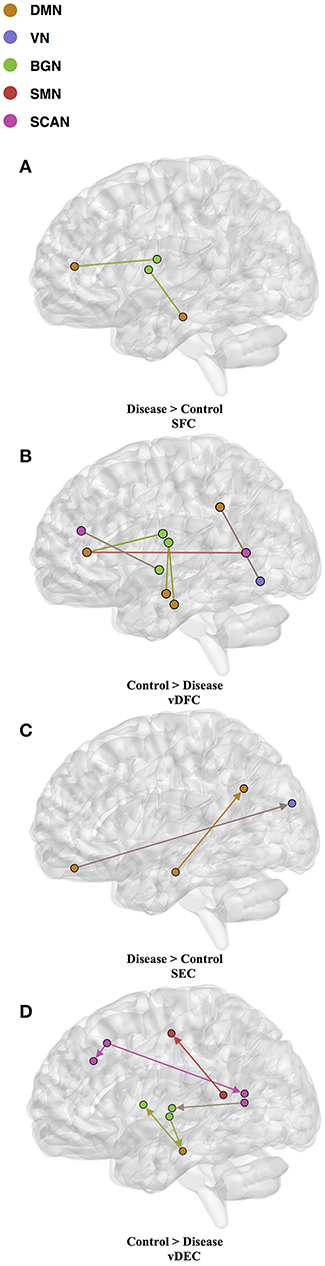
Figure 9. (A) SFC; (B) vDFC; (C) SEC; (D) vDEC features. selected by GA and hierarchical (PTSD/PCS). Selected features were split into two groups, i.e., (1) control > disease (PTSD and PTSD/PCS) and (2) disease > control. DMN, Default mode network; VN, Visual network; BGN, Basal ganglia network; SMN, Sensory motor network; SCAN, Semantic cognition and attention network.
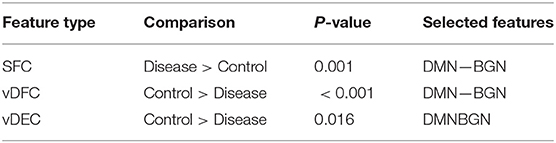
Table 18. Network-to-network interactions selected by enrichment analysis for PTSD dataset.
Several resting-state studies of PTSD have showed aberrant connectivity within brain structures associated with the DMN [207–209]. The parahippocampal gyri and hippocampus are critical structures in the DMN, which have been shown to be essential for memory functions, especially memorizing facts and events, and memory consolidation [210]. A previous rs-fMRI study found decreased functional connectivity in the hippocampal regions in PTSD patients [211]. The BGN has also been reported to be associated with PTSD [212–214]. PTSD has been linked with abnormal activation of different BGN regions, brain stem, and limbic regions compared with control groups [26, 215, 216]. The connectivity between the DMN and BGN and between the DMN and VN have been observed to be impacted in PTSD in many functional connectivity studies [217, 218]. Lanius et al. [217] found increased connectivity between the ACC and caudate, the PCC, the right parietal lobe, and the right occipital lobe, during a rs-fMRI study using subjects with PTSD. Stark et al. found changes in connectivity between the DMN and BGN, (e.g., connections between the ACC and caudate, between the parahippocampal gyri and caudate), by applying a systematic, quantitative meta-data analysis on colleagues previous studies. The SCAN has also been demonstrated to be linked to PTSD. Reduced connectivity was observed in the MTG, MFG and several BGN regions in the PTSD group, compared with controls [219]. Yin et al. [220] also found reduced connectivity in the MTG and lingual gyrus, during a rs-fMRI study. It is interesting to note that increased static connectivity and reduced variability of dynamic connectivity between the hippocampal formation and BGN regions such as the caudate has been recently reported in PTSD and PCS [84, 87] and our results seem to confirm these findings and show that those aberrations are important for unsupervised clustering of subjects into these groups.
From above discussions, it can be seen that for each individual neuropsychiatric disorder, connectivity features selected by GA with optimal clustering method are consistent with previous studies, which suggest the effectiveness of our general pipeline for identifying different brain-based disorders using unsupervised learning.
Phenotypic Features Important for Clustering
The phenotypic variables important for clustering were selected for each psychiatric disease. Below, we discuss the relevance of these variables in the context of existing literature on those measures.
ADHD
Four phenotypic variables were selected by GA and DPC including ADHD index score, Inattentive score, Hyper/Impulsive score (all are subscales in ADHD-RS), and FIQ in intelligence scale. ADHD-RS has been considered as an effective clinical diagnostic tool for assessing the severity of ADHD in children and adolescents [221, 222]. It gathers information on the severity and frequency of symptoms, the establishment of childhood onset of symptoms, the chronicity and pervasiveness of symptoms, and the impact of symptoms on major life activities. Intelligence scale has been demonstrated to be helpful in predicting symptomatology and outcome in children with ADHD [223]. A meta-analysis showed that FIQ was lower in adults with ADHD compared to HC [63].
AD
Three phenotypic variables, i.e., MSE, CDR, and FAQ, and one genotypic variable, i.e., APOE were selected by GA and OPTICS. APOE is considered as the major genetic risk factor for AD [69]. Although the presence of APOE does not necessarily entail the development of AD, this genetic isoform probably accelerates the rate of AD conversion and progression [224]. The MMSE is the most commonly used instrument for screening memory problems and other deficits related to cognitive aging. It has been widely used to screen for dementia [64]. CDR is a global scale developed to clinically denote the presence of AD and stage its severity [225]. Several methods have been derived based on CDR to identify AD accurately; [226]. FAQ is a standardized assessment of instrumental activities of daily living, which delineates the clinical distinction between MCI and AD [227].
ASD
Five phenotypic variables were selected including ADOS_TOTAL, ADOS_COMM and ADOS_SOCIAL (all makeup ADOS test), FIQ in intelligence scale, and ADI-R_VERBAL in ADI_R test. ADOS has been extensively used in the clinic for diagnosing ASD [228, 229]. It consists of a series of structured and semi-structured presses for an interaction of specific target behaviors associated with particular tasks and by general ratings of the quality of behaviors. Further, several studies have observed higher VIQ and FIQ in ASD compared to neurotypicals; [230]. ADI-R is a structured interview conducted with the parents of the referred individual and covers the subject's full developmental history [231]. The communication and language score, as one of the three content areas in ADI-R, is useful in assessing the presence and severity of delay or total lack of language.
PTSD/PCS
Four phenotypic variables—SDC correct, ZDS, CES, and LEC—were selected by GA and OPTICS. SDC is a test of psychomotor performance, visual-motor coordination, sustained attention, and motor and mental speed, which has been shown to be related to PTSD [232]. ZDS is a short self-administered survey to quantify the depressed status of a patient. Burriss et al. [233] showed that PTSD was associated with general learning and memory impairments, and depression was considered as a mediator of these deficits. In addition, Dretsch et al. [234] revealed that depressive symptoms in individuals with PTSD account for working memory impairments. CES was constructed to measure the subjective report of wartime stressors experienced by combatants [235]. It has been demonstrated that CES is a useful tool for identifying factors associated with PTSD [236, 237]. LEC, a measure of exposure to potentially traumatic events, was developed for assisting with screening of PTSD as well. In a clinical sample of combat veterans, a significantly correlated relationship between LEC and PTSD symptoms was observed [238].
It can be seen from the discussion above that the phenotypic (and genotypic in case of AD) variables selected by GA for maximizing the similarity of clusters obtained from them and from connectivity features indicates that they are clinically meaningful and relevant to the behavioral deficits observed in each disorder.
Site-Specific Analysis
Modern machine learning systems often integrate data from several different sources. Usually, these sources provide data of a similar type but collected under different circumstances. For example, the ADHD dataset used in this study was collected from different sites. Although fMRI images provided by these sites had similar qualities, these images were obtained from different scanners with different scanning parameters. The accuracy of machine learning algorithms can be affected by the heterogeneity of input data. To address this issue, we performed a site-specific analysis. By applying feature selection and clustering on data obtained from each individual site, the cluster similarity was increased considerably (see Tables 7, 13). However, as when we applied clustering on whole dataset with commonly selected features from individual sites, the similarity was reduced. Due to inter-site variance, it is difficult for us to translate high accuracy obtained for individual site into the whole dataset. It also affects the diagnostic precision obtained from brain connectivity measures. This calls for data acquisition standards and homogenization of data acquired from different scanners.
Connectivity-Based Reassignment of Diagnostic Labels
Many brain-based disorders are highly heterogeneous, and categorization of subgroups within many disorders is yet to be completely established. Traditionally, brain-based disorders are diagnosed by clinical interviews associated with different behavioral assessments. However, it is widely acknowledged that current clinical criteria are insufficient to clearly identify most of the brain-based disorders, separate them from healthy subjects and identify sub-groups within them. Therefore, it is necessary to develop brain imaging based models for understanding how, precisely, neural circuits generate flexible behaviors and their impairments give rise to psychiatric symptoms [10]. In this study, we used unsupervised learning algorithms to discover brain connectivity-based clusters, which were not limited to existing diagnostic criteria. Instead, it focused on separating subjects into isolated clusters with maximized inter-cluster variance and minimized intra-cluster variance. After clustering, we reassigned diagnostic labels based on those generated by connectivity clusters. Compared with clinical diagnostic groups, the neurobiologically-informed groups provided better mapping from subjects to the behavioral phenotypes. This result indicates that it might be possible to view brain-based disorders from the perspective of brain connectivity measures, establishing neuroimaging-based biomarkers for different neuropsychiatric disorders.
Outlier Subject Elimination
The overarching aim of healthcare is personalized medicine. However, basing individualized treatments on brain imaging characteristics is in the nascent stages, i.e., some subjects will deviate considerably from the normative population distribution and it becomes easier to assess population level characteristics when such subjects are eliminated from the analysis. As shown in this study, with the proposed subject outlier elimination process, the precision of clustering was improved. Note that, the inter-individual variability may be introduced not just by the variability in the underlying neuropathology, but also by non-neural sources of variance such as different scanners and/or different scanning parameters. Until a standard data acquisition process is established, outlier subject elimination will serve to homogenize the data and make better inferences at the population level.
Conclusion
Many neuropsychiatric disorders are conventionally diagnosed based on clinical interviews and behavioral assessments. Inherent limitations of specific measures and clinical judgment contribute to a far from perfect process. Therefore, it is necessary to establish neuroimaging-based biomarkers to improve diagnostic precision and accuracy. Rs-fMRI has been used as a promising technique for characterization and classification of different disorders. However, these approaches are besieged with methodological issues such as (i) a priori choice of clusters needed in k-means, (ii) a stopping criterion needed in hierarchical clustering, (iii) the large dimensionality of imaging data necessitates some type of dimensionality reduction for clustering to work properly and this step is either not carried out, or carried out by preselecting features not from the structure in the data, but by some external considerations such as previous findings in a given disorder, and (iv) the clusters obtained from imaging data are seldom compared by those obtained from clinical diagnostic criteria or behavioral phenotypes.
To address these four issues, a general pipeline was derived on identifying different brain-based disorders using unsupervised clustering methods. In addition, site-specific analysis and elimination of outlier subjects were also applied to improve clustering accuracy. Three selected clustering methods were adopted on three types of features: (1) fMRI connectivity measures, (2) clinical diagnostic labels, and (3) phenotypic variables. GA based feature selection method was also applied to improve clustering accuracy. The accuracy of the clustering and feature selection was assessed by computing the similarity of clusters between all three types of features. The effectiveness of the proposed pipeline was verified on five different disorders: ADHD, AD, ASD, PTSD, and PCS. For ADHD and AD, highest similarity was achieved between connectivity and phenotypic clusters, whereas for ASD and PTSD/PCS, highest similarity was achieved between connectivity and clinical diagnostic clusters. These results suggest that neurobiological and phenotypic biomarkers could potentially be used as an aid by the clinician, in addition to currently available subjective markers, to improve diagnostic precision.
The data and source code used in this work are presented elsewhere [239]. They can also be downloaded from GitHub repository: https://github.com/xinyuzhao/identification-of-brain-based-disorders.git.
Future Recommendations
Here we discuss some directions in which the current work could be extended. First, we have applied the proposed pipeline to four different disorders. It may be worth evaluating its performance on various other disorders such as Schizophrenia, Depression etc. Second, deriving a consensus clustering estimate from various clustering algorithms may improve the correspondence between diagnostic, imaging and phenotypic clusters. Third, the current study used cross-sectional data and hence cannot make inferences on whether unsupervised clustering can infer mechanisms that may cause sub-clusters in disorders. However, future datasets obtained using longitudinal designs may investigate this aspect. Fourth, the sample sizes used in AD and PTSD datasets are smaller compared to those used in ASD and ADHD datasets. We believe that demonstration of our method on samples of various sizes is a strength. However, specific inferences regarding AD and PTSD would obviously require larger sample sizes in the future. Finally, we believe the performance deterioration we observed when we pooled data from different sites represents one of the great challenges in applying machine learning methods to neuroimaging data. Approaches that can model this variability such that inter-site variability is minimized are needed to realize the true potential of machine learning in clinical diagnostics.
Author Contributions
GD conceived the study. TD, JK, and MD obtained funding and setup the study design for the PTSD data. XZ, DR, BY, and GD performed data analysis, with XZ taking the lead. XZ primarily wrote the manuscript and all other authors contributed toward interpretation of results and editing the manuscript.
Conflict of Interest Statement
The authors declare that the research was conducted in the absence of any commercial or financial relationships that could be construed as a potential conflict of interest.
Acknowledgments
We would like to acknowledge the contributions of International Neuroimaging Data Sharing Initiative (INDI), the organizers of the International ADHD-200 competition and Neurobureau for providing us with access to the ADHD neuroimaging data (supported by NIMH grant # R03MH096321). We also used data from the Alzheimer's Disease Neuroimaging Initiative (ADNI) (adni.loni.usc.edu) database. As such, the investigators within the ADNI contributed to the design and implementation of ADNI and/or provided data but did not participate in analysis or writing of this report. A complete listing of ADNI investigators and funders can be found at http://adni.loni.usc.edu/wp-content/uploads/how_to_apply/ADNI_Acknowledgement_List.pdf. We would also like to acknowledge the researchers and agencies that contributed to the ABIDE database (as well as NIMH grant # K23MH087770). Finally, the authors acknowledge financial support for PTSD/PCS data acquisition from the U.S. Army Medical Research and Material Command (MRMC) (Grant # 00007218). The views, opinions, and/or findings from PTSD/PCS data contained in this article are those of the authors and should not be interpreted as representing the official views or policies, either expressed or implied, of the U.S. Army or the Department of Defense (DoD) or the United States Government. The funders had no role in study design, data collection and analysis, decision to publish, or preparation of the manuscript. The authors thank the personnel at the TBI clinic and behavioral health clinic, Fort Benning, GA, USA and the US Army Aeromedical Research Laboratory, Fort Rucker, AL, USA, and most of all, the Soldiers who participated in the study. The authors thank Julie Rodiek and Wayne Duggan for facilitating PTSD data acquisition.
Supplementary Material
The Supplementary Material for this article can be found online at: https://www.frontiersin.org/articles/10.3389/fams.2018.00025/full#supplementary-material
References
1. Filipovych R, Resnick SM, Davatzikos C. JointMMCC: joint maximum-margin classification and clustering of imaging data. IEEE Trans Med Imaging (2012) 31:1124–40. doi: 10.1109/TMI.2012.2186977
2. Plitt M, Barnes KA, Martin A. Functional connectivity classification of autism identifies highly predictive brain features but falls short of biomarker standards. NeuroImage Clin. (2014) 7:359–66. doi: 10.1016/j.nicl.2014.12.013
3. Khazaee A, Ebrahimzadeh A, Babajani-Feremi A. Identifying patients with Alzheimer's disease using resting-state fMRI and graph theory. Clin Neurophysiol. (2015) 126:2132–41. doi: 10.1016/j.clinph.2015.02.060
4. Deshpande G, Li Z, Santhanam P, Coles CD, Lynch ME, Hamann S, et al. Recursive cluster elimination based support vector machine for disease state prediction using resting state functional and effective brain connectivity. PLoS ONE (2010) 5:e14277. doi: 10.1371/journal.pone.0014277
5. Deshpande G, Libero LE, Sreenivasan KR, Deshpande HD, Kana RK. Identification of neural connectivity signatures of autism using machine learning. Front Hum Neurosci. (2013) 7:670. doi: 10.3389/fnhum.2013.00670
6. Deshpande G, Wang P, Rangaprakash D, Wilamowski B. Fully connected cascade artificial neural network architecture for attention deficit hyperactivity disorder classification from functional magnetic resonance imaging data. IEEE Trans Cybern. (2015) 45:2668–79. doi: 10.1109/TCYB.2014.2379621
7. Libero LE, DeRamus TP, Lahti AC, Deshpande G, Kana RK. Multimodal neuroimaging based classification of autism spectrum disorder using anatomical, neurochemical, and white matter correlates. Cortex (2015) 66:46–59. doi: 10.1016/j.cortex.2015.02.008
8. Chen G, Ward BD, Xie C, Li W, Chen G, Goveas JS, et al. A clustering-based method to detect functional connectivity differences. Neuroimage (2012) 61:56–61. doi: 10.1016/j.neuroimage.2012.02.064
9. Guttula SV, Allam A, Gumpeny RS. Analyzing microarray data of Alzheimer's using cluster analysis to identify the biomarker genes. Int J Alzheimers Dis. 2012:649456 (2012). doi: 10.1155/2012/649456
10. Wang XJ, Krystal JH. Computational psychiatry. Neuron (2014) 84:638–54. doi: 10.1016/j.neuron.2014.10.018
11. Abraham A, Milham MP, Di Martino A, Craddock RC, Samaras D, Thirion B, et al. (2017). Deriving reproducible biomarkers from multi-site resting-state data: an autism-based example. NeuroImage 147, 736–745. doi: 10.1016/j.neuroimage.2016.10.045
12. Yao Z. Resting-state time-varying analysis reveals aberrant variations of functional connectivity in autism. Front Hum Neurosci. (2016) 10:463. doi: 10.3389/fnhum.2016.00463
13. Ellegood J, Anagnostou E, Babineau BA, Crawley JN, Lin L, Genestine M, et al. Clustering autism: using neuroanatomical differences in 26 mouse models to gain insight into the heterogeneity. Mol Psychiatry (2014) 20:118–25. doi: 10.1038/mp.2014.98
14. Hrdlicka M, Dudova I, Beranova I, Lisy J, Belsan T, Neuwirth J, et al. Subtypes of autism by cluster analysis based on structural MRI data. Eur Child Adolesc Psychiatry (2005) 14:138–44. doi: 10.1007/s00787-005-0453-z
15. Sloan CD, Shen L, West JD, Wishart HA, Flashman LA, Rabin LA, et al. Genetic pathway-based hierarchical clustering analysis of older adults with cognitive complaints and amnestic mild cognitive impairment using clinical and neuroimaging phenotypes. Am J Med Genet Part B Neuropsychiatr Genet. (2010) 153:1060–9. doi: 10.1002/ajmg.b.31078
16. Polanczyk GV, Willcutt EG, Salum GA, Kieling C, Rohde LA. ADHD prevalence estimates across three decades: An updated systematic review and meta-regression analysis. Int J Epidemiol. (2014) 43:434–42. doi: 10.1093/ije/dyt261
17. LeFever GB, Arcona AP, Antonuccio DO. ADHD among American Schoolchildren: Evidence of Overdiagnosis and Overuse of Medication. Sci Rev Ment Health Pract. (2003) 2:49–60.
18. Reitz C, Brayne C, Mayeux R. Epidemiology of Alzheimer disease. Nat Rev Neurol. (2011) 7:137–52. doi: 10.1038/nrneurol.2011.2
19. Petersen RC, Smith GE, Waring SC, Ivnik RJ, Tangalos EG, Kokmen E. Mild cognitive impairment: clinical characterization and outcome. Arch Neurol. (1999) 56:303–8. doi: 10.1001/archneur.56.3.303
20. Launer LJ, Ross GW, Petrovitch H, Masaki K, Foley D, White LR, et al. Midlife blood pressure and dementia: the Honolulu–Asia aging study? Neurobiol Aging (2000) 21:49–55. doi: 10.1016/S0197-4580(00)00096-8
21. Mayes SD, Calhoun SL, Crites DL. Does DSM-IV Asperger's disorder exist? J Abnorm Child Psychol. (2001) 29:263–71. doi: 10.1023/A:1010337916636
22. Miller JN, Ozonoff S. The external validity of Asperger disorder: lack of evidence from the domain of neuropsychology. J Abnorm Psychol. (2000) 109:227–38. doi: 10.1037/0021-843X.109.2.227
23. McPartland JC, Reichow B, Volkmar FR. Sensitivity and specificity of proposed DSM-5 diagnostic criteria for autism spectrum disorder. J Am Acad Child Adolesc Psychiatry (2012) 51:368–83. doi: 10.1016/j.jaac.2012.01.007
24. Chossegros L, Hours M, Charnay P, Bernard M, Fort E, Boisson D, et al. Predictive factors of chronic post-traumatic stress disorder 6 months after a road traffic accident. Accid Anal Prev (2011) 43:471–7. doi: 10.1016/j.aap.2010.10.004
25. American Psychiatric Association. Diagnostic and Statistical Manual of Mental Disorders 5th Edition. Arlington, TX: American Psychiatric Association (2013). doi: 10.1176/appi.books.9780890425596.744053
26. Dretsch MN, Wood KH, Daniel TA, Katz JS, Deshpande G, Goodman A, et al. Exploring the neurocircuitry underpinning predictability to threat in soldiers with PTSD compared to deployment exposed controls. Open Neuroimag J. (2016) 10:111–24. doi: 10.2174/1874440001610010111
27. Greco JA, Liberzon I. Neuroimaging of fear-associated learning. Neuropsychopharmacology (2016) 41:320–34. doi: 10.1038/npp.2015.255
28. Milad MR, Wright CI, Orr SP, Pitman RK, Quirk GJ, Rauch SL (2007). Recall of fear extinction in humans activates the ventromedial prefrontal cortex and hippocampus in concert. Biol. Psychiatry 62, 446–454. doi: 10.1016/j.biopsych.2006.10.011
29. Dretsch MN, Thiel KJ, Athy JR, Irvin CR, Sirmon-Fjordbak B, Salvatore A. Mood symptoms contribute to working memory decrement in active-duty soldiers being treated for posttraumatic stress disorder. Brain Behav. (2012) 2:357–64. doi: 10.1002/brb3.53
30. Dretsch MN, Silverberg ND, Iverson GL. Multiple past concussions are associated with ongoing post-concussive symptoms but not cognitive impairment in active-duty Army soldiers. J Neurotrauma (2015) 6:1–6. doi: 10.1089/neu.2014.3810
31. Pape MM, Williams K, Kodosky PN, Dretsch M. The community balance and mobility scale: a pilot study detecting impairments in military service members with comorbid mild TBI and psychological health conditions. J Head Trauma Rehabil. (2016) 31:339–45. doi: 10.1097/HTR.0000000000000179
32. Dretsch M, Blieberg J, Amador K, Caban J, Kelly J, Grammer G, DeGraba T. Three scoring approaches to the Neurobehavioral Symptom Inventory for measuring clinical change in service members receiving intensive treatment for combat-related mTBI. J Head Trauma Rehabil. (2015) 31:23–9. doi: 10.1097/HTR.0000000000000109
33. Dretsch MN, Williams K, Emmerich T, Crynen G, Ait-Ghezala G, Chaytow H, et al. Brain-derived neurotropic factor polymorphisms, traumatic stress, mild traumatic brain injury, and combat exposure contribute to postdeployment traumatic stress. Brain Behav. (2016) 6:e00392. doi: 10.1002/brb3.392
34. Bryant R. Post-traumatic stress disorder vs traumatic brain injury. Dialogues Clin Neurosci. (2011) 13:251–62.
35. Brodersen KH, Deserno L, Schlagenhauf F, Lin Z, Penny WD, Buhmann JM, et al. Dissecting psychiatric spectrum disorders by generative embedding. NeuroImage Clin. (2014) 4:98–111. doi: 10.1016/j.nicl.2013.11.002
36. Van Dam NT, O'Connor D, Marcelle ET, Ho EJ, Cameron Craddock R, Tobe RH, et al. Data-driven phenotypic categorization for neurobiological analyses: beyond DSM-5 labels. Biol Psychiatry (2016) 81:484–94. doi: 10.1016/j.biopsych.2016.06.027
37. Chen G, Ward BD, Xie C, Li W, Wu Z, Jones JL, et al. Classification of Alzheimer disease, mild cognitive impairment, and normal cognitive status with large-scale network analysis based on resting-state functional MR imaging. Radiology (2011) 259:213–21. doi: 10.1148/radiol.10100734
38. Brier MR, Thomas JB, Snyder AZ, Benzinger TL, Zhang D, Raichle ME, et al. Loss of intranetwork and internetwork resting state functional connections with alzheimer's disease progression. J Neurosci. (2012) 32:8890–99. doi: 10.1523/JNEUROSCI.5698-11.2012
39. Liu F, Guo W, Fouche J-P, Wang Y, Wang W, Ding J, et al Multivariate classification of social anxiety disorder using whole brain functional connectivity. Brain Struct Funct. (2015) 220:101–15. doi: 10.1007/s00429-013-0641-4
40. Tang Y, Jiang W, Liao J, Wang W, Luo A. Identifying individuals with antisocial personality disorder using resting-state fMRI. PLoS ONE (2013) 8:e60652. doi: 10.1371/journal.pone.0060652
41. Zeng L-L, Shen H, Liu L, Hu D. Unsupervised classification of major depression using functional connectivity MRI. Hum Brain Mapp. (2014) 35:1630–41. doi: 10.1002/hbm.22278
42. Ashikh V, Deshpande G, Rangaprakash D, Dutt DN. Clustering of dynamic functional connectivity features obtained from functional magnetic resonance imaging data. In: 2015 International Conference on Advances in Computing, Communications and Informatics (ICACCI), Kochi: IEEE (2015). p. 308–12.
43. Biswal BB. Resting state fMRI: a personal history. Neuroimage (2012) 62:938–44. doi: 10.1016/j.neuroimage.2012.01.090
44. Buckner RL, Krienen FM, Yeo BT. Opportunities and limitations of intrinsic functional connectivity MRI. Nat Neurosci. (2013) 16:832–7. doi: 10.1038/nn.3423
45. Dasgupta S, Long PM. Performance guarantees for hierarchical clustering. J Comput Syst Sci. (2005) 70:555–69. doi: 10.1016/j.jcss.2004.10.006
46. Ankerst M, Breunig MM, Kriegel HP, Sander J. Optics: ordering points to identify the clustering structure. ACM Sigmod Rec. (1999) 28:49–60. doi: 10.1145/304182.304187
47. Rodriguez A, Laio A. Machine learning. Clustering by fast search and find of density peaks. Science (2014) 344:1492–6. doi: 10.1126/science.1242072
48. Allen EA, Damaraju E, Plis SM, Erhardt EB, Eichele T, Calhoun VD. Tracking whole-brain connectivity dynamics in the resting state. Cereb Cortex (2014) 24:663–76. doi: 10.1093/cercor/bhs352
49. Venkataraman A, Van Dijk KRA, Buckner RL, Golland P. Exploring functional connectivity in fMRI via clustering. In: 2009 IEEE International Conference on Acoustics, Speech and Signal Processing. Taipei. (2009). p. 441–4.
50. Dy JG, Brodley CE. Feature selection for unsupervised learning. J Mach Learn Res. (2004) 5:845–89.
51. Bradley PS, Mangasarian OL. Feature selection via mathematical programming. INFORMS. J Comput. (1998) 10:209–17.
52. Sharp C, Skinner D, Serekoane M, Ross MW. A qualitative study of the cultural appropriateness of the Diagnostic Interview Schedule for Children (DISC-IV) in South Africa. Soc. Psychiatry Psychiatr. Epidemiol. (2011) 46:743–51. doi: 10.1007/s00127-010-0241-z
53. Kaufman J, Birmaher B, Brent D, Rao U, Flynn C, Moreci P, et al. Schedule for affective disorders and schizophrenia for school-age children-present and lifetime version (K-SADS-PL): initial reliability and validity data. J Am Acad Child Adolesc Psychiatry (1997) 36:980–8. doi: 10.1097/00004583-199707000-00021
54. Pappas D. ADHD rating scale-IV: checklists, norms, and clinical interpretation. J Psychoeduc Assess. (2006) 24:172–8. doi: 10.1177/0734282905285792
55. McGoey KE, DuPaul GJ, Haley E, Shelton TL. Parent and teacher ratings of attention-deficit/hyperactivity disorder in preschool: The ADHD rating scale-IV preschool version. J Psychopathol Behav Assess. (2007) 29:269–76. doi: 10.1007/s10862-007-9048-y
56. Wechsler D. Wechsler Intelligence Scale for Children-Revised (WISC-R), TEA Ediciones. New York, NY: The Psychological Corporation (1974).
57. Reich W. Diagnostic interview for children and adolescents (DICA). J Am Acad Child Adolesc Psychiatry (2000) 39:59–66. doi: 10.1097/00004583-200001000-00017
58. Conners CK, Sitarenios G, Parker JDA, Epstein JN. The Revised Conners' Parent Rating Scale (CPRS-R): Factor structure, reliability, and criterion validity. J Abnorm Child Psychol. (1998) 26:257–68. doi: 10.1023/A:1022602400621
59. Wechsler D. The Wechsler Intelligence Scale for Children, 4th Edn. San Antonio, TX: The Psychological Corporation (2004).
60. Smith DR. Wechsler individual achievement test. In: Andrews JJW, Saklofske DH, Janzen HL, editots. Handbook of Psychoeducational Assessment: Ability, Achievement, and Behavior in Children. A Volume in the Educational Psychology Series. Houston, TX: Academic Press (2001). p. 169–93.
61. Canivez GL, Konold TR, Collins JM, Wilson G. Construct validity of the wechsler abbreviated scale of intelligence and wide range intelligence test: convergent and structural validity. Sch Psychol Q. (2009) 24:252–65. doi: 10.1037/a0018030
62. Malfa GL, Lassi S, Bertelli M, Pallanti S, Albertini G. Detecting attention-deficit/hyperactivity disorder (ADHD) in adults with intellectual disability. The use of Conners' Adult ADHD Rating Scales (CAARS). Res Dev Disabil. (2008) 29:158–64. doi: 10.1016/j.ridd.2007.02.002
63. Bridgett DJ, Walker ME. Intellectual functioning in adults with ADHD: a meta-analytic examination of full scale IQ differences between adults with and without ADHD. Psychol Assess. (2006) 18:1–14. doi: 10.1037/1040-3590.18.1.1
64. Galasko D, Klauber MR, Hofstetter CR, Salmon DP, Lasker B, Thal LJ. The Mini-Mental State Examination in the early diagnosis of Alzheimer's disease. Arch Neurol. (1990) 47:49–52. doi: 10.1001/archneur.1990.00530010061020
65. Burke WJ, Houston MJ, Boust SJ, Roccaforte WH. Use of the geriatric depression scale in dementia of the alzheimer type. J Am Geriatr Soc. (1989) 37:856–60.
66. McKhann G, Drachman D, Folstein M, Katzman R, Price D, Stadlan EM. Clinical diagnosis of Alzheimer's disease: report of the NINCDS-ADRDA Work Group under the auspices of Department of Health and Human Services Task Force on Alzheimer's Disease. Neurology (1984) 34:939–44. doi: 10.1212/WNL.34.7.939
67. Cummings JL. The Neuropsychiatric Inventory: assessing psychopathology in dementia patients. Neurology (1997) 48:S10–6. doi: 10.1212/WNL.48.5_Suppl_6.10S
68. Sabbagh MN, Malek-Ahmadi M, Kataria R, Belden CM, Connor DJ, Pearson C, et al. The Alzheimer's questionnaire: a proof of concept study for a new informant-based dementia assessment. J Alzheimer's Dis (2010) 22:1015–21. doi: 10.3233/JAD-2010-101185
69. Kim J, Basak JM, Holtzman DM. The role of apolipoprotein E in Alzheimer's disease. Neuron (2009) 63:287–303. doi: 10.1016/j.neuron.2009.06.026
70. American Psychiatric Association (2000). Diagnostic and Statistical Manual of Mental Disorders, 4th Edn. Washington, DC: American Psychiatric Association.
71. Lord C, Risi S, Lambrecht L, Cook EH, Leventhal BL, DiLavore PC, et al. Autism Diagnostic Observation Schedule (ADOS). J Autism Dev Disord. (2000) 30:205–23.
72. Lord C, Rutter M, Couteur A. Autism diagnostic interview-revised. J Autism Dev Disord. (1994) 29:30.
73. Dickstein BD, Weathers FW, Angkaw AC, Nievergelt CM, Yurgil K, Nash WP, et al. Diagnostic utility of the posttraumatic stress disorder (PTSD) checklist for identifying full and partial PTSD in active-duty military. Assessment (2015) 22:289–97. doi: 10.1177/1073191114548683
74. Cicerone KD, Kalmar K. Persistent postconcussion syndrome: the structure of subjective complaints after mild traumatic brain injury. J Head Trauma Rehabil. (1995) 10:1–17. doi: 10.1097/00001199-199510030-00002
75. Gualtieri CT, Johnson LG. Reliability and validity of a computerized neurocognitive test battery, CNS Vital Signs. Arch Clin Neuropsychol. (2006) 21:623–43. doi: 10.1016/j.acn.2006.05.007
76. Craddock RC, James GA, Holtzheimer PE, Hu XP, Mayberg HS. A whole brain fMRI atlas generated via spatially constrained spectral clustering. Hum Brain Mapp. (2012) 33:1914–28. doi: 10.1002/hbm.21333
77. Wu GR, Liao W, Stramaglia S, Ding JR, Chen H, Marinazzo D. A blind deconvolution approach to recover effective connectivity brain networks from resting state fMRI data. Med Image Anal. (2013) 17:365–74. doi: 10.1016/j.media.2013.01.003
78. Deshpande G, Hu X. Investigating effective brain connectivity from fMRI data: past findings and current issues with reference to Granger causality analysis. Brain Connect. (2012) 2:235–45. doi: 10.1089/brain.2012.0091
79. Deshpande G, Sathian K, Hu X, Buckhalt J. A rigorous approach for testing the constructionist hypotheses of brain function. Behav Brain Sci. (2012) 35:148–9. doi: 10.1017/S0140525X1100149X
80. Sathian K, Deshpande G, Stilla R. Neural changes with tactile learning reflect decision-level reweighting of perceptual readout. J Neurosci. (2013) 33:5387–98. doi: 10.1523/JNEUROSCI.3482-12.2013
81. Hutcheson NL, Sreenivasan KR, Deshpande G, Reid MA, Hadley J, White DM, et al. Effective connectivity during episodic memory retrieval in schizophrenia participants before and after antipsychotic medication. Hum Brain Mapp. (2015) 36:1442–57. doi: 10.1002/hbm.22714
82. Handwerker DA, Ollinger JM, D'Esposito M. Variation of BOLD hemodynamic responses across subjects and brain regions and their effects on statistical analyses. Neuroimage (2004) 21:1639–51. doi: 10.1016/j.neuroimage.2003.11.029
83. Deshpande G, Sathian K, Hu X. Effect of hemodynamic variability on Granger causality analysis of fMRI. Neuroimage (2010) 52:884–96. doi: 10.1016/j.neuroimage.2009.11.060
84. Rangaprakash D, Deshpande G, Daniel TA, Goodman AM, Robinson JL, Salibi N, et al. Compromised hippocampus-striatum pathway as a potential imaging biomarker of mild traumatic brain injury and posttraumatic stress disorder. Hum Brain Mapp. (2017) 38:2843–4. doi: 10.1002/hbm.23551
85. Rangaprakash D, Dretsch M, Yan W, Katz JS, Denney TS, Deshpande G. Hemodynamic variability in soldiers with trauma: implications for functional MRI connectivity studies. NeuroImage (2017) 16:409–17. doi: 10.1016/j.nicl.2017.07.016
86. Rangaprakash D, Dretsch M, Yan W, Katz JS, Denney TS, Deshpande G. Hemodynamic response function parameters obtained from resting-state functional MRI data in Soldiers with trauma. Data Brief (2017) 14:558–62. doi: 10.1016/j.dib.2017.07.072
87. Rangaprakash D, Dretsch M, Venkataraman A, Katz J, Denney TS, Deshpande G. Identifying disease foci from static and dynamic effective connectivity networks: illustration in Soldiers with trauma. Hum Brain Mapp. (2018) 39:264–87. doi: 10.1002/hbm.23841
88. Rangaprakash D, Wu GR, Marinazzo D, Hu X, Deshpande G. Hemodynamic response function (HRF) variability confounds resting state fMRI connectivity. Magn Reson Med. (2018) 80:1697–713. doi: 10.1002/mrm.27146
89. Rangaprakash D, Wu GR, Marinazzo D, Hu X, Deshpande G. Parameterized hemodynamic response function data of healthy individuals obtained from resting-state functional MRI in a 7T MRI scanner. Data Brief (2018) 17:1175–9. doi: 10.1016/j.dib.2018.01.003
90. Yan W, Rangaprakash D, Deshpande G. Aberrant hemodynamic responses in Autism: implications for resting state fMRI functional connectivity studies. NeuroImage (2018) 19:320–30. doi: 10.1016/j.nicl.2018.04.013
91. Yan W, Rangaprakash D, Deshpande G. Hemodynamic Response function parameters obtained from resting state BOLD fMRI data in subjects with autism spectrum disorder and matched healthy controls. Data Brief (2018) 14:558–62. doi: 10.1016/j.dib.2018.04.126
92. Jia H, Hu X, Deshpande G. Behavioral relevance of the dynamics of the functional brain connectome. Brain Connect. (2014) 4:741–59. doi: 10.1089/brain.2014.0300
93. Deshpande G, Santhanam P, Hu X. Instantaneous and causal connectivity in resting state brain networks derived from functional MRI data. Neuroimage (2011) 54:1043–52. doi: 10.1016/j.neuroimage.2010.09.024
94. Lacey S, Hagtvedt H, Patrick VM, Anderson A, Stilla R, Deshpande G, et al. Art for reward's sake: visual art recruits the ventral striatum. Neuroimage (2011) 55:420–33. doi: 10.1016/j.neuroimage.2010.11.027
95. Krueger F, Landgraf S, Van Der Meer E, Deshpande G, Hu X. Effective connectivity of the multiplication network: a functional MRI and multivariate granger causality mapping study. Hum Brain Mapp. (2011) 32:1419–31. doi: 10.1002/hbm.21119
96. Preusse F, van der Meer E, Deshpande G, Krueger F, Wartenburger I. Fluid intelligence allows flexible recruitment of the parieto-frontal network in analogical reasoning. Front Hum Neurosci. (2011) 5:22. doi: 10.3389/fnhum.2011.00022
97. Grant MM, Wood K, Sreenivasan K, Wheelock M, White D, Thomas J, et al. Influence of early life stress on intra- and extra-amygdaloid causal connectivity. Neuropsychopharmacology (2015) 40:1–12. doi: 10.1038/npp.2015.28
98. Hampstead BM, Khoshnoodi M, Yan W, Deshpande G, Sathian K. Patterns of effective connectivity during memory encoding and retrieval differ between patients with mild cognitive impairment and healthy older adults. Neuroimage (2016) 124:997–1008. doi: 10.1016/j.neuroimage.2015.10.002
99. Feng C, Deshpande G, Liu C, Gu R, Luo YJ, Krueger F. Diffusion of responsibility attenuates altruistic punishment: a functional magnetic resonance imaging effective connectivity study. Hum Brain Mapp. (2016) 37:663–77. doi: 10.1002/hbm.23057
100. Sakoglu Ü, Pearlson GD, Kiehl KA, Wang YM, Michael AM, Calhoun VD. A method for evaluating dynamic functional network connectivity and task-modulation: application to schizophrenia. Magn Reson Mater Phys Biol Med. (2010) 23:351–66. doi: 10.1007/s10334-010-0197-8
101. Hutchison RM, Womelsdorf T, Allen EA, Bandettini PA, Calhoun VD, Corbetta M, et al. Dynamic functional connectivity: promise, issues, and interpretations. Neuroimage (2013) 80:360–78. doi: 10.1016/j.neuroimage.2013.05.079
102. Deshpande G, LaConte S, James GA, Peltier S, Hu X. Multivariate granger causality analysis of fMRI data. Hum Brain Mapp. (2009) 30:1361–73. doi: 10.1002/hbm.20606
103. Deshpande G, Hu X, Lacey S, Stilla R, Sathian K. Object familiarity modulates effective connectivity during haptic shape perception. Neuroimage (2010) 49:1991–2000. doi: 10.1016/j.neuroimage.2009.08.052
104. Hampstead BM, Stringer AY, Stilla RF, Deshpande G, Hu X, Moore AB, et al. Activation and effective connectivity changes following explicit-memory training for face-name pairs in patients with mild cognitive impairment: a pilot study. Neurorehabil Neural Repair (2011) 25:210–22. doi: 10.1177/1545968310382424
105. Sathian K, Lacey S, Stilla R, Gibson GO, Deshpande G, Hu X, et al. Dual pathways for haptic and visual perception of spatial and texture information. Neuroimage (2011) 57:462–75. doi: 10.1016/j.neuroimage.2011.05.001
106. Kapogiannis D, Deshpande G, Krueger F, Thornburg MP, Grafman JH. Brain networks shaping religious belief. Brain Connect. (2014) 4:70–9. doi: 10.1089/brain.2013.0172
107. Goodyear K, Parasuraman R, Chernyak S, Visser E, Madhavan P, Deshpande G, et al. An fMRI and effective connectivity study investigating miss errors during advice utilization from human and machine agents. Soc. Neurosci. (2016) 12:570–81. doi: 10.1080/17470919.2016.1205131
108. Liang P, Deshpande G, Zhao S, Liu J, Hu X, Li K. Altered directional connectivity between emotion network and motor network in Parkinson's disease with depression. Medicine (Baltimore). (2016). 95:e4222. doi: 10.1097/MD.0000000000004222
109. Grant MM, White D, Hadley J, Hutcheson N, Shelton R, Sreenivasan K, et al. Early life trauma and directional brain connectivity within major depression. Hum Brain Mapp. (2014) 35:4815–26. doi: 10.1002/hbm.22514
110. Lacey S, Stilla R, Sreenivasan K, Deshpande G, Sathian K. Spatial imagery in haptic shape perception. Neuropsychologia (2014) 60:144–58. doi: 10.1016/j.neuropsychologia.2014.05.008
111. Bellucci G, Chernyak S, Hoffman H, Deshpande G, Monte OD, Knutson KM, et al. Effective connectivity of brain regions underlying third party punishment: functional MRI and Granger causality evidence. Soc Neurosci. (2016) 12:124–134. doi: 10.1080/17470919.2016.1153518
112. Wheelock MD, Sreenivasan KR, Wood KH, Ver Hoef LW, Deshpande G, Knight DC. Threat-related learning relies on distinct dorsal prefrontal cortex network connectivity. Neuroimage (2014) 102:904–12. doi: 10.1016/j.neuroimage.2014.08.005
113. Jin T, Kim S-G. Cortical layer-dependent dynamic blood oxygenation, cerebral blood flow and cerebral blood volume responses during visual stimulation. Neuroimage (2008) 43:1–9. doi: 10.1016/j.neuroimage.2008.06.029
114. Liao W, Chen H, Yang Q, Lei X. Analysis of fMRI data using improved self-organizing mapping and spatio-temporal metric hierarchical clustering. IEEE Trans Med Imaging (2008) 27:1472–83. doi: 10.1109/TMI.2008.923987
115. Cheng D, Kannan R, Vempala S, Wang G. A divide-and-merge methodology for clustering. ACM Trans Database Syst. (2006) 31:1499–525. doi: 10.1145/1189769.1189779
116. Calinski T, Harabasz J. A dendrite method for cluster analysis. Commun Stat Simul Comput. (1974) 3:1–27. doi: 10.1080/03610917408548446
117. Liu Y, Li Z, Xiong H, Gao X, Wu J, Wu S. Understanding and enhancement of internal clustering validation measures. IEEE Trans Cybern. (2013) 43:982–94. doi: 10.1109/TSMCB.2012.2220543
118. Yang J, Honavar V. Feature subset selection using a genetic algorithm. Patt Recognit. (1997) 13:380.
119. Shahamat H, Pouyan AA. Feature selection using genetic algorithm for classification of schizophrenia using fMRI data. J Artif Intell Data Min. (2015) 3:30–7. doi: 10.5829/idosi.JAIDM.2015.03.01.04
120. Fred ALN, Jain AK. Combining multiple clusterings using evidence accumulation. IEEE Trans Patt Anal Mach Intell. (2005) 27:835–50. doi: 10.1109/TPAMI.2005.113
121. Fred ALN, Jain AK. Data clustering using evidence accumulation. Object Recognit Support User Interact Serv Robot. (2002) 4:276–80. doi: 10.1109/ICPR.2002.1047450
122. Tarjan RE. Efficiency of a good but not linear set union algorithm. J ACM (1975) 22:215–25. doi: 10.1145/321879.321884
123. Maron-Katz A, Amar D, Simon EB, Hendler T, Shamir R. RichMind: a tool for improved inference from large-scale neuroimaging results. PLoS ONE (2016) 11:e0159643. doi: 10.1371/journal.pone.0159643
124. Xia M, Wang J, He Y. BrainNet viewer: a network visualization tool for human brain connectomics. PLoS ONE (2013) 8:e68910. doi: 10.1371/journal.pone.0068910
125. Whitfield-Gabrieli S, Ford JM. Default mode network activity and connectivity in psychopathology. Annu Rev Clin Psychol. (2012) 8:49–76. doi: 10.1146/annurev-clinpsy-032511-143049
126. Menon V. Large-scale brain networks and psychopathology: a unifying triple network model. Trends Cogn Sci. (2011) 15:483–506. doi: 10.1016/j.tics.2011.08.003
127. Vergun S, Deshpande AS, Meier TB, Song J, Tudorascu DL, Nair VA, et al. Characterizing functional connectivity differences in aging adults using machine learning on resting state fMRI data. Front Comput Neurosci. (2013) 7:38. doi: 10.3389/fncom.2013.00038
128. Buckner RL, Andrews-Hanna JR, Schacter DL. The brain's default network. Ann NY Acad Sci. (2008) 1124:1–38. doi: 10.1196/annals.1440.011
129. Sestieri C, Corbetta M, Romani GL, Shulman GL. Episodic memory retrieval, parietal cortex, and the default mode network: functional and topographic analyses. J Neurosci. (2011) 31:4407–20. doi: 10.1523/JNEUROSCI.3335-10.2011
130. Vannini P, O'Brien J, O'Keefe K, Pihlajamäki M, Laviolette P, Sperling RA. What goes down must come up: role of the posteromedial cortices in encoding and retrieval. Cereb Cortex (2011) 21:22–34. doi: 10.1093/cercor/bhq051
131. Spreng RN, Mar R, Kim ASN. The common neural basis of autobiographical memory, prospection, navigation, theory of mind, and the default mode: a quantitative meta-analysis. J Cogn Neurosci. (2009) 21:489–510. doi: 10.1162/jocn.2008.21029
132. Binder JR, Desai RH, Graves WW, Conant LL. Where is the semantic system? A critical review and meta-analysis of 120 functional neuroimaging studies. Cereb Cortex (2009) 19:2767–96. doi: 10.1093/cercor/bhp055
133. Amodio DM, Frith CD. Meeting of minds: the medial frontal cortex and social cognition. Nat Rev Neurosci. (2006) 7:268–77. doi: 10.1038/nrn1884
134. Rangel A, Camerer C, Montague PR. A framework for studying the neurobiology of value-based decision making. Nat Rev Neurosci. (2008) 9:545–56. doi: 10.1038/nrn2357
135. Etkin A, Egner T, Kalisch R. Emotional processing in anterior cingulate and medial prefrontal cortex. Trends Cogn Sci. (2010) 15:85–93. doi: 10.1016/j.tics.2010.11.004
136. Lagioia A, Van De Ville D, Debbané M, Lazeyras F, Eliez S. Adolescent resting state networks and their associations with schizotypal trait expression. Front Syst Neurosci. (2010) 4:35. doi: 10.3389/fnsys.2010.00035
137. Mantini D, Perrucci MG, Del Gratta C, Romani GL, Corbetta M. Electrophysiological signatures of resting state networks in the human brain. Proc Natl Acad Sci USA (2007) 104:13170–13175. doi: 10.1073/pnas.0700668104
138. Ganis G, Thompson WL, Kosslyn SM. Brain areas underlying visual mental imagery and visual perception: an fMRI study. Cogn Brain Res. (2004) 20:226–41. doi: 10.1016/j.cogbrainres.2004.02.012
139. Schiltz C, Sorger B, Caldara R, Ahmed F, Mayer E, Goebel R, et al. Impaired face discrimination in acquired prosopagnosia is associated with abnormal response to individual faces in the right middle fusiform gyrus. Cereb. Cortex (2006) 16:574–586. doi: 10.1093/cercor/bhj005
140. Renier LA, Anurova I, De Volder AG, Carlson S, VanMeter J, Rauschecker JP. Preserved functional specialization for spatial processing in the middle occipital gyrus of the early blind. Neuron (2010) 68:138–48. doi: 10.1016/j.neuron.2010.09.021
141. Vanni S, Tanskanen T, Seppä M, Uutela K, Hari R. Coinciding early activation of the human primary visual cortex and anteromedial cuneus. Proc Natl Acad Sci USA (2001) 98:2776–780. doi: 10.1073/pnas.041600898
142. Kandel ER, Schwartz JH, Jessell TM. Principles of neural science, Neurology (2000). doi: 10.1036/0838577016
143. Kornhuber HH. Cortex, basal ganglia and cerebellum in motor control. Electroencephalogr Clin Neurophysiol Suppl. (1978) 34:449–455.
144. Hikosaka O, Takikawa Y, Kawagoe R. Role of the basal ganglia in the control of purposive saccadic eye movements. Physiol Rev. (2000) 80:953–78. doi: 10.1152/physrev.2000.80.3.953
145. Stocco A, Lebiere C, Anderson JR. Conditional routing of information to the cortex: a model of the basal ganglia's role in cognitive coordination. Psychol Rev. (2010) 117:541–74. doi: 10.1037/a0019077
146. Bennett M, Dennett D, Hacker P, Searle J, Hurford JR, Bennett M, et al. Neuroscience and philosophy: brain, mind, and language. Q Rev Biol. (2007) 82:439–40. doi: 10.1086/527640
147. Soares JM, Sampaio A, Ferreira LM, Santos NC, Marques P, Marques F, et al. Stress impact on resting state brain networks. PLoS ONE (2013) 8:e66500. doi: 10.1371/journal.pone.0066500
148. Habas C, Kamdar N, Nguyen D, Prater K, Beckmann CF, Menon V, et al. Distinct cerebellar contributions to intrinsic connectivity networks. J Neurosci. (2009) 29:8586–94. doi: 10.1523/JNEUROSCI.1868-09.2009
149. Greicius MD, Krasnow B, Reiss AL, Menon V. Functional connectivity in the resting brain: a network analysis of the default mode hypothesis. Proc Natl Acad Sci USA (2003) 100:253–8. doi: 10.1073/pnas.0135058100
150. Chenji S, Jha S, Lee D, Brown M, Seres P, Mah D, et al. Investigating default mode and sensorimotor network connectivity in amyotrophic lateral sclerosis. PLoS ONE (2016) 11:e0157443. doi: 10.1371/journal.pone.0157443
151. Friederici AD. The brain basis of language processing: from structure to function. Physiol Rev. (2011) 91:1357–92. doi: 10.1152/physrev.00006.2011
152. Friederici AD, Gierhan SME. The language network. Curr Opin Neurobiol. (2013) 23:250–54. doi: 10.1016/j.conb.2012.10.002
153. Emmorey K. The role of Broca's area in sign language. In: Grodzinsky Y, Amunts K, editors. Broca's Region. Oxford, UK: Oxford University Press (2006). pp. 167–82.
154. Mason RA, Prat CS, Just MA. Neurocognitive brain response to transient impairment of wernicke's area. Cereb Cortex (2014) 24:1474–84. doi: 10.1093/cercor/bhs423
155. Acheson DJ, Hagoort P. Stimulating the brain's language network: syntactic ambiguity resolution after TMS to the inferior frontal gyrus and middle temporal gyrus. J Cogn Neurosci. (2013) 25:1664–77. doi: 10.1162/jocn_a_00430
156. Fox MD, Corbetta M, Snyder AZ, Vincent JL, Raichle ME. Spontaneous neuronal activity distinguishes human dorsal and ventral attention systems. Proc Natl Acad Sci USA (2006) 103:10046–51. doi: 10.1073/pnas.0604187103
157. Yantis S. Goal-directed and stimulus-driven determinants of attentional control. Control Cogn. Process. Atten. Perform. (2000) Xviii:73–103. doi: 10.2337/db11-0571
158. Duan X, Liao W, Liang D, Qiu L, Gao Q, Liu C, et al. Large-scale brain networks in board game experts: insights from a domain-related task and task-free resting state. PLoS ONE (2012) 7:e32532. doi: 10.1371/journal.pone.0032532
159. Majerus S, Attout L, D'Argembeau A, Degueldre C, Fias W, Maquet P, et al. Attention supports verbal short-term memory via competition between dorsal and ventral attention networks. Cereb Cortex (2012) 22:1086–97. doi: 10.1093/cercor/bhr174
160. Fox MD, Raichle ME. Spontaneous fluctuations in brain activity observed with functional magnetic resonance imaging. Nat Rev Neurosci. (2007) 8:700–11. doi: 10.1038/nrn2201
161. Shaw P, Lerch J, Greenstein D, Sharp W, Clasen L, Evans A, et al. Longitudinal mapping of cortical thickness and clinical outcome in children and adolescents with attention-deficit/hyperactivity disorder. Arch Gen Psychiatry (2006) 63:540–9. doi: 10.1001/archpsyc.63.5.540
162. Cubillo A, Halari R, Ecker C, Giampietro V, Taylor E, Rubia K. Reduced activation and inter-regional functional connectivity of fronto-striatal networks in adults with childhood Attention-Deficit Hyperactivity Disorder (ADHD) and persisting symptoms during tasks of motor inhibition and cognitive switching. J Psychiatr Res. (2010) 44:629–39. doi: 10.1016/j.jpsychires.2009.11.016
163. Rubia K, Halari R, Cubillo A, Mohammad AM, Scott S, Brammer M. Disorder-specific inferior prefrontal hypofunction in boys with pure attention-deficit/hyperactivity disorder compared to boys with pure conduct disorder during cognitive flexibility. Hum Brain Mapp. (2010) 31:1823–33. doi: 10.1002/hbm.20975
164. Liddle EB, Hollis C, Batty MJ, Groom MJ, Totman JJ, Liotti M, et al. Task-related default mode network modulation and inhibitory control in ADHD: effects of motivation and methylphenidate. J Child Psychol Psychiatry. (2011) 52:761–71. doi: 10.1111/j.1469-7610.2010.02333.x
165. Konrad K, Eickhoff SB. Is the ADHD brain wired differently? A review on structural and functional connectivity in attention deficit hyperactivity disorder. Hum Brain Mapp. (2010) 31:904–16. doi: 10.1002/hbm.21058
166. Li X, Sroubek A, Kelly MS, Lesser I, Sussman E, He Y, et al. Atypical pulvinar-cortical pathways during sustained attention performance in children with attention-deficit/hyperactivity disorder. J Am Acad Child Adolesc Psychiatry (2012) 51:11971207.e4. doi: 10.1016/j.jaac.2012.08.013
167. Cao X, Cao Q, Long X, Sun L, Sui M, Zhu C, et al. Abnormal resting-state functional connectivity patterns of the putamen in medication-naive children with attention deficit hyperactivity disorder. Brain Res. (2009) 1303:195–206. doi: 10.1016/j.brainres.2009.08.029
168. Bush G. Attention-deficit/hyperactivity disorder and attention networks. Neuropsychopharmacology (2010) 35:278–300. doi: 10.1038/npp.2009.120
169. Castellanos FX, Margulies DS, Kelly C, Uddin LQ, Ghaffari M, Kirsch A, et al. Cingulate-precuneus interactions: a new locus of dysfunction in adult attention-deficit/hyperactivity disorder. Biol. Psychiatry (2008) 63:332–7. doi: 10.1016/j.biopsych.2007.06.025
170. Sun L, Cao Q, Long X, Sui M, Cao X, Zhu C, et al. Abnormal functional connectivity between the anterior cingulate and the default mode network in drug-naïve boys with attention deficit hyperactivity disorder. Psychiatry Res. (2012) 201:120–7. doi: 10.1016/j.pscychresns.2011.07.001
171. Bush G. Cingulate, frontal, and parietal cortical dysfunction in attention-deficit/hyperactivity disorder. Biol Psychiatry (2011) 69:1160–7. doi: 10.1016/j.biopsych.2011.01.022
172. Castellanos FX, Proal E. Large-scale brain systems in ADHD: beyond the prefrontal-striatal model. Trends Cogn Sci. (2012) 16:17–26. doi: 10.1016/j.tics.2011.11.007
173. Cubillo A, Rubia K. Structural and functional brain imaging in adult attention-deficit/hyperactivity disorder. Expert Rev Neurother. (2010) 10:603–20. doi: 10.1586/ern.10.4
174. Köchel A, Schöngaßner F, Feierl-Gsodam S, Schienle A. Processing of affective prosody in boys suffering from attention deficit hyperactivity disorder: a near-infrared spectroscopy study. Soc Neurosci. (2015) 919:1–9. doi: 10.1080/17470919.2015.1017111
175. Kessler DA, Angstadt M, Welsh RC, Sripada C. Modality-spanning deficits in attention-deficit/hyperactivity disorder in functional networks, gray matter, and white matter. J Neurosci. (2014) 34:16555–66. doi: 10.1523/JNEUROSCI.3156-14.2014
176. Dickstein SG, Bannon K, Xavier Castellanos F, Milham MP. The neural correlates of attention deficit hyperactivity disorder: an ALE meta-analysis. J Child Psychol Psychiatry Allied Discip. (2006) 47:1051–62. doi: 10.1111/j.1469-7610.2006.01671.x
177. Rubia K. “Cool” inferior frontostriatal dysfunction in attention-deficit/hyperactivity disorder versus “hot” ventromedial orbitofrontal-limbic dysfunction in conduct disorder: a review. Biol Psychiatry (2011) 69:e69–87. doi: 10.1016/j.biopsych.2010.09.023
178. Tian L, Jiang T, Wang Y, Zang Y, He Y, Liang M, et al. Altered resting-state functional connectivity patterns of anterior cingulate cortex in adolescents with attention deficit hyperactivity disorder. Neurosci Lett. (2006) 400:39–43. doi: 10.1016/j.neulet.2006.02.022
179. Seidman LJ, Valera EM, Makris N. Structural brain imaging of attention-deficit/hyperactivity disorder. Biol Psychiatry (2005) 57:1263–72. doi: 10.1016/j.biopsych.2004.11.019
180. Hale TS, Kane AM, Kaminsky O, Tung KL, Wiley JF, McGough JJ, et al. Visual network asymmetry and default mode network function in ADHD: An fMRI study. Front. Psychiatry (2014) 5:81. doi: 10.3389/fpsyt.2014.00081
181. Ewers M, Sperling RA, Klunk WE, Weiner MW, Hampel H. Neuroimaging markers for the prediction and early diagnosis of Alzheimer's disease dementia. Trends Neurosci. (2011) 34:430–442. doi: 10.1016/j.tins.2011.05.005
182. Greicius MD, Srivastava G, Reiss AL, Menon V. Default-mode network activity distinguishes Alzheimer's disease from healthy aging: evidence from functional MRI. Proc. Natl Acad Sci USA (2004) 101:4637–42. doi: 10.1073/pnas.0308627101
183. Supekar K, Menon V, Rubin D, Musen M, Greicius MD. Network analysis of intrinsic functional brain connectivity in Alzheimer's disease. PLoS Comput Biol. (2008) 4:e1000100. doi: 10.1371/journal.pcbi.1000100
184. Wang L, Zang Y, He Y, Liang M, Zhang X, Tian L, et al. Changes in hippocampal connectivity in the early stages of Alzheimer's disease: evidence from resting state fMRI. Neuroimage (2006) 31:496–504. doi: 10.1016/j.neuroimage.2005.12.033
185. Zhou J, Greicius MD, Gennatas ED, Growdon ME, Jang JY, Rabinovici GD, et al. Divergent network connectivity changes in behavioural variant frontotemporal dementia and Alzheimer's disease. Brain (2010) 133:1352–67. doi: 10.1093/brain/awq075
186. Gomez-Ramirez J, Wu J. Network-based biomarkers in Alzheimer's disease: review and future directions. Front Aging Neurosci. (2014) 6:1–9. doi: 10.3389/fnagi.2014.00012
187. Buckner RL, Sepulcre J, Talukdar T, Krienen FM, Liu H, Hedden T, et al. a Cortical hubs revealed by intrinsic functional connectivity: mapping, assessment of stability, and relation to Alzheimer's disease. J Neurosci. (2009) 29:1860–73. doi: 10.1523/JNEUROSCI.5062-08.2009
188. Sperling RA, Dickerson BC, Pihlajamaki M, Vannini P, LaViolette PS, Vitolo OV, et al. Functional alterations in memory networks in early Alzheimer's disease. Neuromolecular Med. (2010) 12:27–43. doi: 10.1007/s12017-009-8109-7
189. Machulda MM, Ward HA, Borowski B, Gunter JL, Cha RH, O'Brien PC, et al. Comparison of memory fMRI response among normal, MCI, and Alzheimer's patients. Neurology (2003) 61:500–6. doi: 10.1055/s-0029-1237430.Imprinting
190. Johnson SC, Schmitz TW, Trivedi Ma, Ries ML, Torgerson BM, Carlsson CM, et al. The influence of Alzheimer disease family history and apolipoprotein E epsilon4 on mesial temporal lobe activation. J Neurosci. (2006) 26:6069–76. doi: 10.1523/JNEUROSCI.0959-06.2006
191. Agosta F, Pievani M, Geroldi C, Copetti M, Frisoni GB, Filippi M. Resting state fMRI in Alzheimer's disease: beyond the default mode network. Neurobiol Aging (2012) 33:1564–78. doi: 10.1016/j.neurobiolaging.2011.06.007
192. Foundas AL, Leonard CM, Mahoney SM, Agee OF, Heilman KM. Atrophy of the hippocampus, parietal cortex, and insula in Alzheimer's disease: a volumetric magnetic resonance imaging study. Neuropsychiatry Neuropsychol Behav Neurol. (1997) 10:81–9.
193. Rombouts SARB, Barkhof F, Witter MP, Scheltens P. Unbiased whole-brain analysis of gray matter loss in Alzheimer's disease. Neurosci Lett. (2000) 285:231–3. doi: 10.1016/S0304-3940(00)01067-3
194. Karas GB, Scheltens P, Rombouts SARB, Visser PJ, Van Schijndel RA, Fox NC, et al. Global and local gray matter loss in mild cognitive impairment and Alzheimer's disease. Neuroimage (2004) 23:708–16. doi: 10.1016/j.neuroimage.2004.07.006
195. Li R, Wu X, Chen K, Fleisher AS, Reiman EM, Yao L. Alterations of directional connectivity among resting-state networks in Alzheimer disease. Am J Neuroradiol. (2013) 34:340–5. doi: 10.3174/ajnr.A3197
196. Monk CS, Peltier SJ, Wiggins JL, Weng SJ, Carrasco M, Risi S, et al. Abnormalities of intrinsic functional connectivity in autism spectrum disorders. Neuroimage (2009) 47:764–72. doi: 10.1016/j.neuroimage.2009.04.069
197. Assaf M, Jagannathan K, Calhoun VD, Miller L, Stevens MC, Sahl R, et al. Abnormal functional connectivity of default mode sub-networks in autism spectrum disorder patients. Neuroimage (2010) 53:247–56. doi: 10.1016/j.neuroimage.2010.05.067
198. Radua J, Via E, Catani M, Mataix-Cols D. Voxel-based meta-analysis of regional white-matter volume differences in autism spectrum disorder versus healthy controls. Psychol Med. (2011) 41:1539–50. doi: 10.1017/S0033291710002187
199. Martino A, Ross K, Uddin LQ, Sklar AB, Castellanos FX, Milham MP. Functional brain correlates of social and nonsocial processes in autism spectrum disorders: an activation likelihood estimation meta-analysis. Biol Psychiatry (2009) 65:63–74. doi: 10.1016/j.biopsych.2008.09.022
200. Weng SJ, Wiggins JL, Peltier SJ, Carrasco M, Risi S, Lord C, et al. Alterations of resting state functional connectivity in the default network in adolescents with autism spectrum disorders. Brain Res. (2010) 1313:202–14. doi: 10.1016/j.brainres.2009.11.057
201. Mody M, Manoach DS, Guenther FH, Kenet T, Bruno KA, Mcdougle CJ, et al. Speech and language in autism spectrum disorder: a view through the lens of behavior and brain imaging. Neuropsychiatry (London). (2013) 3:223–32. doi: 10.2217/npy.13.19
202. Verly M, Verhoeven J, Zink I, Mantini D, Peeters R, Deprez S, et al. Altered functional connectivity of the language network in ASD: role of classical language areas and cerebellum. NeuroImage Clin. (2014) 4:374–82. doi: 10.1016/j.nicl.2014.01.008
203. Peeva MG, Tourville JA, Agam Y, Holland B, Manoach DS, Guenther FH. White matter impairment in the speech network of individuals with autism spectrum disorder. NeuroImage Clin. (2013) 3:234–41. doi: 10.1016/j.nicl.2013.08.011
204. Prat CS, Stocco A, Neuhaus E, Kleinhans NM. Basal ganglia impairments in autism spectrum disorder are related to abnormal signal gating to prefrontal cortex. Neuropsychologia (2016) 91:268–81. doi: 10.1016/j.neuropsychologia.2016.08.007
205. Uddin LQ, Menon V. The anterior insula in autism: under-connected and under-examined. Neurosci Biobehav Rev. (2009) 33:1198–203. doi: 10.1016/j.neubiorev.2009.06.002
206. Uddin LQ, Supekar K, Lynch CJ, Khouzam A, Phillips J, Feinstein C, et al. Salience network-based classification and prediction of symptom severity in children with autism. JAMA Psychiatry (2013) 70:869–79. doi: 10.1001/jamapsychiatry.2013.104
207. Birn RM, Patriat R, Phillips ML, Germain A, Herringa RJ. Childhood maltreatment and combat posttraumatic stress differentially predict fear-related fronto-subcortical connectivity. Depress Anxiety (2014) 31:880–92. doi: 10.1002/da.22291
208. Chen AC, Etkin A. Hippocampal network connectivity and activation differentiates post-traumatic stress disorder from generalized anxiety disorder. Neuropsychopharmacology (2013) 38:1889–98. doi: 10.1038/npp.2013.122
209. Cisler JM, Steele JS, Lenow JK, Smitherman S, Everett B, Messias E, et al. Functional reorganization of neural networks during repeated exposure to the traumatic memory in posttraumatic stress disorder: an exploratory fMRI study. J Psychiatr Res. (2014) 48:47–55. doi: 10.1016/j.jpsychires.2013.09.013
210. Braun K. The Prefrontal-limbic system: development, neuroanatomy, function, and implications for socioemotional development. Clin Perinatol. (2011) 38:685–702. doi: 10.1016/j.clp.2011.08.013
211. Bluhm RL, Williamson PC, Osuch EA, Frewen PA, Stevens TK, Boksman K, et al. Alterations in default network connectivity in posttraumatic stress disorder related to early-life trauma. J Psychiatry Neurosci. (2009) 34:187–94.
212. Long Z, Duan X, Xie B, Du H, Li R, Xu Q, et al. Altered brain structural connectivity in post-traumatic stress disorder: a diffusion tensor imaging tractography study. J Affect Disord. (2013) 150:798–806. doi: 10.1016/j.jad.2013.03.004
213. White SF, Costanzo ME, Blair JR, Roy MJ. PTSD symptom severity is associated with increased recruitment of top-down attentional control in a trauma-exposed sample. NeuroImage Clin. (2015) 7:19–27. doi: 10.1016/j.nicl.2014.11.012
214. Rabinak CA, Angstadt M, Welsh RC, Kenndy AE, Lyubkin M, Martis B, et al. Altered amygdala resting-state functional connectivity in post-traumatic stress disorder. Front Psychiatry (2011) 2:1–8. doi: 10.3389/fpsyt.2011.00062
215. Ebdlahad S, Nofzinger EA, James JA, Buysse DJ, Price JC, Germain A. Comparing neural correlates of REM sleep in posttraumatic stress disorder and depression: a neuroimaging study. Psychiatry Res. (2013) 214:422–8. doi: 10.1016/j.pscychresns.2013.09.007
216. Germain A, James J, Insana S, Herringa RJ, Mammen O, Price J, et al. A window into the invisible wound of war: Functional neuroimaging of REM sleep in returning combat veterans with PTSD. Psychiatry Res. (2013) 211:176–9. doi: 10.1016/j.pscychresns.2012.05.007
217. Lanius RA, Bluhm R, Lanius U, Pain C. A review of neuroimaging studies in PTSD: Heterogeneity of response to symptom provocation. J Psychiatr Res. (2006) 40:709–29. doi: 10.1016/j.jpsychires.2005.07.007
218. Stark EA, Parsons CE, Van Hartevelt TJ, Charquero-Ballester M, McManners H, Ehlers A, et al. Post-traumatic stress influences the brain even in the absence of symptoms: a systematic, quantitative meta-analysis of neuroimaging studies. Neurosci Biobehav Rev. (2015) 56:207–21. doi: 10.1016/j.neubiorev.2015.07.007
219. Herringa R, Phillips M, Almeida J, Insana S, Germain A. Post-traumatic stress symptoms correlate with smaller subgenual cingulate, caudate, and insula volumes in unmedicated combat veterans. Psychiatry Res. (2012) 203:139–45. doi: 10.1016/j.pscychresns.2012.02.005
220. Yin Y, Jin C, Eyler LT, Jin H, Hu X, Duan L, et al. Altered regional homogeneity in post-traumatic stress disorder: a restingstate functional magnetic resonance imaging study. Neurosci Bull. (2012) 28:541–9. doi: 10.1007/s12264-012-1261-3
221. Faries DE, Yalcin I, Harder D, Heiligenstein JH. Validation of the ADHD Rating Scale as a clirlician administered and scored instrument. J Atten Disord. (2001) 5:107–15. doi: 10.1177/108705470100500204
222. Zhang S, Faries DE, Vowles M, Michelson D. ADHD Rating Scale IV: psychometric properties from a multinational study as a clinician-administered instrument. Int J Methods Psychiatr Res. (2005) 14:186–201. doi: 10.1002/mpr.7
223. Thaler NS, Bello DT, Etcoff LM. WISC-IV profiles are associated with differences in symptomatology and outcome in children with ADHD. J Atten Disord. (2013) 17:291–301. doi: 10.1177/1087054711428806
224. Liu CC, Liu CC, Kanekiyo T, Xu H, Bu G. Apolipoprotein E and Alzheimer disease: risk, mechanisms and therapy. Nat Rev Neurol. (2013) 9:106–18. doi: 10.1038/nrneurol.2012.263
225. Morris JC. Clinical dementia rating: a reliable and valid diagnostic and staging measure for dementia of the Alzheimer type. Int Psychogeriatr. (1997) (9 Suppl 1):173–176–178. doi: 10.1017/S1041610297004870
226. Williams MM, Storandt M, Roe CM, Morris JC. Progression of Alzheimer's disease as measured by clinical dementia rating sum of boxes scores. Alzheimers Dement. (2013) 9:S39–44. doi: 10.1016/j.jalz.2012.01.005
227. Teng E, Becker BW, Woo E, Knopman DS, Cummings JL, Lu PH. Utility of the functional activities questionnaire for distinguishing mild cognitive impairment from very mild alzheimer disease. Alzheimer Dis Assoc Disord. (2010) 24:348–53. doi: 10.1097/wad.0b013e3181e2fc84
228. Bastiaansen JA, Meffert H, Hein S, Huizinga P, Ketelaars C, Pijnenborg M, et al. Diagnosing autism spectrum disorders in adults: the use of Autism Diagnostic Observation Schedule (ADOS) module (2011) 4. J Autism Dev Disord. 41:1256–66. doi: 10.1007/s10803-010-1157-x
229. Gotham K, Risi S, Pickles A, Lord C. The autism diagnostic observation schedule: revised algorithms for improved diagnostic validity. J Autism Dev Disord. (2007) 37:613–27. doi: 10.1007/s10803-006-0280-1
230. Siegel DJ, Minshew NJ, Goldstein G. Wechsler IQ profiles in diagnosis of high-functioning autism. J Autism Dev Disord. (1996) 26:389–406. doi: 10.1007/BF02172825
231. Lord C, Rutter M, Goode S, Heemsbergen J, Jordan H, Mawhood L, et al. Austism diagnostic observation schedule: a standardized observation of communicative and social behavior. J Autism Dev Disord. (1989) 19:185–212. doi: 10.1007/BF02211841
232. Bryant RA. Early predictors of posttraumatic stress disorder. Biol Psychiatry (2003) 53:789–95. doi: 10.1016/S0006-3223(02)01895-4
233. Burriss L, Ayers E, Ginsberg J, Powell DA. Learning and memory impairment in PTSD: relationship to depression. Depress Anxiety (2008) 25:149–57. doi: 10.1002/da.20291
234. Dretsch MN, Thiel KJ, Athy JR, Born S, Prue-Owens K. Posttraumatic stress disorder in the U.S. Warfighter: sensitivity to punishment and antidepressant use contribute to decision-making performance. Traumatology (2013) 19:118–25. doi: 10.1177/1534765612455228
235. Keane TM, Fairbank JA, Caddell JM, Zimering RT, Taylor KL, Mora CA. Clinical evaluation of a measure to assess combat exposure. Psychol. Assess. (1989) 1:53–55. doi: 10.1037//1040-3590.1.1.53
236. Koenen KC, Lyons MJ, Goldberg J, Simpson J, Williams WM, Toomey R, et al. Co-twin control study of relationships among combat exposure, combat-related PTSD, and other mental disorders. J Trauma Stress (2003) 16:433–8. doi: 10.1023/A:1025786925483
237. Britt TW, Adler AB, Bliese PD, Moore D. Morale as a moderator of the combat exposure-PTSD symptom relationship. J Trauma Stress (2013) 26:94–101. doi: 10.1002/jts.21775
238. Gray MJ, Litz BT, Hsu JL, Lombardo TW. Psychometric properties of the life events checklist. Assessment (2004) 11:330–41. doi: 10.1177/1073191104269954
Keywords: functional MRI, unsupervised learning, clustering, genetic algorithm, functional connectivity, effective connectivity, psychiatric disorders
Citation: Zhao X, Rangaprakash D, Yuan B, Denney TS Jr, Katz JS, Dretsch MN and Deshpande G (2018) Investigating the Correspondence of Clinical Diagnostic Grouping With Underlying Neurobiological and Phenotypic Clusters Using Unsupervised Machine Learning. Front. Appl. Math. Stat. 4:25. doi: 10.3389/fams.2018.00025
Received: 16 November 2017; Accepted: 08 June 2018;
Published: 25 September 2018.
Edited by:
Pietro Cipresso, Istituto Auxologico Italiano (IRCCS), ItalyReviewed by:
Saleh Mobayen, University of Zanjan, IranGuilherme De Alencar Barreto, Federal University of Ceará, Brazil
Enrique M. Muro, Johannes Gutenberg-Universität Mainz, Germany
Copyright © Zhao, Rangaprakash, Yuan, Denney, Katz, Dretsch and Deshpande. This is an open-access article distributed under the terms of the Creative Commons Attribution License (CC BY). The use, distribution or reproduction in other forums is permitted, provided the original author(s) and the copyright owner(s) are credited and that the original publication in this journal is cited, in accordance with accepted academic practice. No use, distribution or reproduction is permitted which does not comply with these terms.
*Correspondence: Gopikrishna Deshpande, Z29waUBhdWJ1cm4uZWR1