 Haile Mekonnen Fenta
 Demeke Lakew Workie
- Department of Statistics, College of Science, Bahir Dar University, Bahir Dar, Ethiopia
Objective: Climate change has effects on the economy development of any country. This paper aimed to fit the best marginal and joint distribution models of rainfall with minimum and maximum temperatures.
Methods: The average values of minimum and maximum monthly temperature, and rainfall were used in this study. For the marginal model, five probability distributions and five families of copula models were employed to show the interdependence between the maximum and minimum average annual temperature with rainfall. The Kendall's tau (τ) correlation coefficient was used to find out the correlations between rainfall with minimum and maximum temperature. Both the Akaki Information Criteria (AIC) and Bayesian information criteria (BIC) were used to select the best marginal and copula.
Results: The result revealed that there is a significant negative relationship between the maximum temperature and rainfall. The maximum average rainfall was obtained from June to August and the maximum temperature is almost consistent in all months. Based on AIC/BIC, the Weibull distribution for rainfall, the Beta for minimum, and the Gaussian for maximum temperature were identified as the best marginal distributions. The Clayton copula distribution was identified as the best copula for rainfall and minimum temperature (with parameter of θ =1. 21, tau correlation = −0.41, p < 0.001), and Frank copula was identified for rainfall and maximum temperature (with unique Frank parameter of θ = −3.94, correlation = −0.38, p < 0.001).
Conclusion: The result showed that there is a significant positive relationship between the average annual minimum temperature and rainfall; whereas a negative relationship occurred between the maximum temperature and rainfall. The Clayton and Frank copula were found to be the most appropriate to the model of a bivariate distribution of mean annual rainfall with minimum/maximum temperature respectively.
Introduction
For the last decades, the risks that are associated with climatic change are the most discussed issues in the scientific world. The temperature variation has many impacts on the economy, ecosystems, and society [1–3]. The measurement of climate includes the estimates of the average value of weather parameters and measures of variability near the average value [4–7]. It also includes patterns of temperature, precipitation, humidity, wind, and seasons. There are a number of literature that have been studying the effects of temperature and rainfall on crop production [4–6, 8].
The effects of climate change and variabilities such as rising temperature and changes in precipitation are undeniably clear its impacts already affecting ecosystems, biodiversity, and people [8]. Associated with global warming, there are strong indications that rainfall and temperature changes are taking place on both the global and regional scales [7]. For instance, the average global surface temperature has warmed by 0.8°C in the past century and 0.6°C in the past three decades [9].
Among the poorest regions, Africa's biophysical and socio-economic environments are highly vulnerable to the impacts of climate change and weather extremes due to high dependency on natural resources and climatic sensitive livelihoods [10]. Like other African countries, Ethiopia has a long history of being affected by extreme weather events.
Temperature and rainfall
For the last three decades, Ethiopia has been affected by climate-related hazards. Agriculture, the most dominant sector in the national economy, has been mostly at risk because of its dependence on seasonal rainfall. Ethiopia has the most variable rainfall patterns, and a number of professionals and organizations have documented scientifically interesting reports on the country's rainfall variability by classifying the country into various wide temporal and spatial rainfall categories and many others. According to the Dinku et al. [11], the mean minimum temperatures have been increasing throughout the country particularly during the cold months by 0.37°C per decade in the last 60 years.
Even if temperature and rainfall are important determinants of crop yield, it is difficult to simulate rainfall and temperature simultaneously because of the interdependence between them [12–14]. It is assumed that there is a correlation between rainfall and temperature changes over months. According to Rajeevan et al. [15] and Cong and Brady [16], temperature and rainfall were positively correlated during January and May but they negatively correlated in July.
Rainfall and temperature play a vital role in climate change such as droughts and floods [11–14, 17, 18]. Both rainfall and temperature are the main climatic parameters that affect agricultural productivity and weather-related industries [4, 11–14]. The copula approach for the joint modeling of precipitation and temperature, the structure of the interdependence between these variables in the current and future climate change can be determined. This further assists the risk assessment of extreme hydrological and meteorological events [15, 19]. Moreover, the copula approach is robust in the estimation that it enables the independent modeling of marginal behavior and interdependence between the variables besides revealing information on the degree of dependence. The copula modeling approach provides a flexible method to model the bivariate distributions in which variables might not follow the normality assumptions. Usually, the temperature and rainfall has a skewed distribution. Hence, the copula models have evolved into a popular tool for modeling dependence in a large number of statistical models. This approach is flexible in that it enables independent modeling of marginal behavior and dependence between the variables besides providing information on both the structure and degree of dependence. Besides, the Parametric copula models are more efficient than their corresponding non-parametric or semi-parametric models because their estimation is based on time information [20]. This is because, the parametric models lead to smaller standard errors and more precise estimates [21].
Moreover, little is known about the trends in rainfall and temperature as well as the correlation between these types of three variables (minimum temperature, maximum temperature and rainfall) in Ethiopia, particularly in the study area. Therefore, the present study aimed to see the trends, modeling the marginal distributions of mean annual rainfall, minimum and maximum temperature, and their joint copulas based on 55 years (January 1961-December, 2015) data available in Bahir Dar Meteorological Agency. It provides information that would be helpful for decision-makers in formulating policies to alleviate problems related to temperature and rainfall.
Data statistical analysis
Study area and data source
This study was conducted in Bahir Dar city, Ethiopia in order to model the marginal and joint model of rainfall, minimum and maximum temperature. The data used secondary data on climate parameters such as monthly Rainfall in (mm) and Temperature (Tmax and Tmin) in °C from 1961 to 2015 obtained from Bahir Dar Meteorological Agency. There were some missing records for days of the month. But our interest was focused on the monthly datasets so that the missing values were substituted by the mean of near points since the sequential observations are highly dependent on all the variables.
Bahir Dar City is one of the largest and most rapidly expanding cities in Ethiopia. It is the political, economic, and cultural center of Amhara National Regional State (ANRS), the second-most populous region in the country. In addition, the city is one of the major tourist centers in the country because of its cultural heritage (such as the Lake Tana Monasteries and religious festivals) and natural attractions (such as the Blue Nile Falls, birds, and hippos). The area is also characterized by rich biodiversity, and, as such, recognized as a Biosphere Reserve by UNESCO. According to data from the Central Statistics Agency [22], in 2017, about 350,000 people live in the city. The city is located at 11°36′N latitude and 37°23′E longitude, at the southern shores of Lake Tana, the largest lake in Ethiopia (Figure 1).
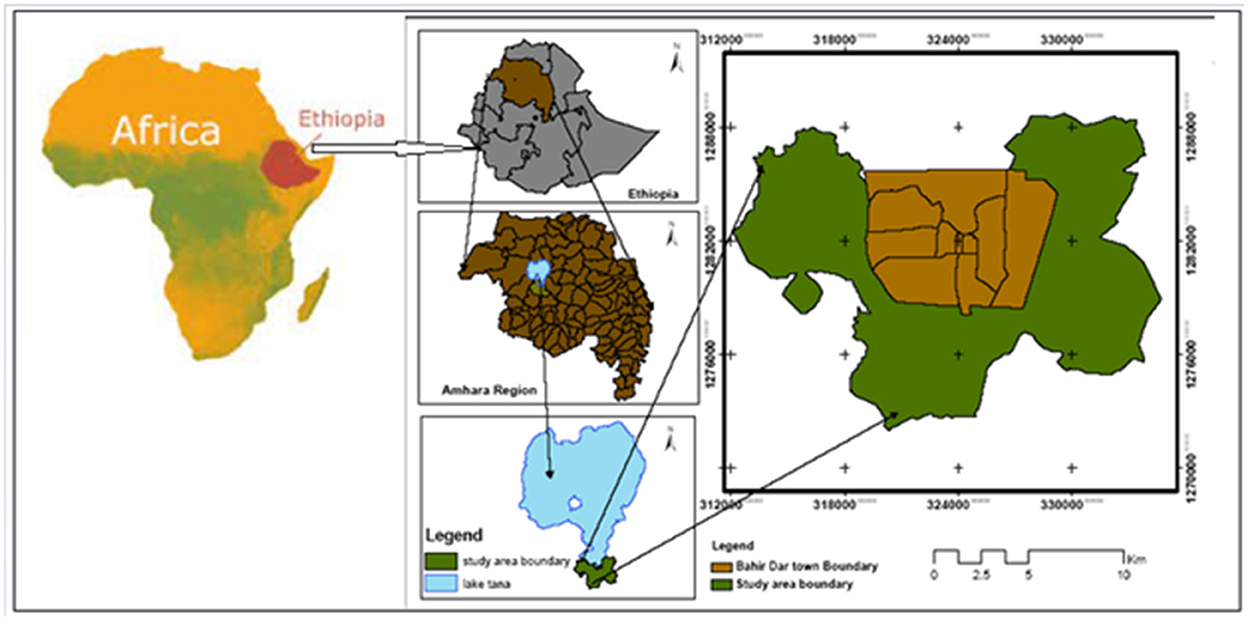
Figure 1. Location of the study area.
Both the temperature and rainfall variables followed non-normal probability density functions and non-linear dependence relationships. Practically, temperature belongs to bounded and skewed distribution, rainfall is characterized by the high zero frequency, and the probability distribution explains its discontinuity between zero and non-zero observations [15, 19]. Therefore, the most commonly used univariate probability distributions such as Normal, Exponential, Gamma, Weibull, and Beta distributions have been used to fit the marginal distributions for the variables, and information criteria methods (AIC, BIC, and logLik) were used to identify the best fit (Table 1).

The copula (joint) distributions were obtained by combining the identified marginal distributions of each variable by using the selected best copula function. A copula is a multivariate distribution function that links joint probability distributions to their one- dimensional marginal distributions [23]. Let X, Z and Y be the continuous random variables representing the mean yearly minimum/maximum temperature and rainfall, with cumulative distribution functions respectively.
According to [26], there is a unique function C such as,
Where,
is the distribution of the pair.
Whose margins are Uniform (0.1) [24] and the function is called a copula. Where u and v are equal to CDFs of X and Y, respectively.
From 0 to 1 (u and v are strictly increasing functions). According to [25], Copulas are advantageous because they can model joint distributions of random variables with greater flexibility both in terms of marginal distributions and the dependence structure.
Kendall tau (τ): the measure of association [24, 26], can be expressed in terms of concordance and dis-concordance between random variables. The τ is the difference between probability of concordance and dis-concordance of (x1, x2) and (y1, y2). Hence the Kendall can be described as:
The relation of Kendall taue measure with copula can be expressed as:
Where, u ∈ FX(x) and v ∈ FY(y).
Hence the τ correlation can be described by copula function and is termed as copula-correlation (Ccorr) in this study.
There are many parametric copula families available, which usually have parameters that control the strength of dependence. For this study two Elliptical [27] and three Archimedean [28], copula families are used (Table 2).
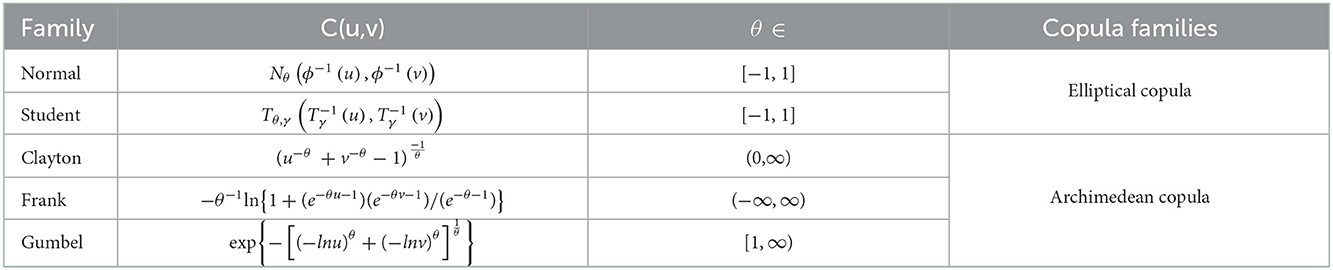
Table 2. The first five families of copulas.
Where,
θ, measures dependency between u and v.
ϕ: the cumulative distribution function (CDF) of a N(0,1), Nθ:CDF of the standard bivariate normal distribution with Pearson correlation θ. Tγ: CDF of a student distribution with y degrees of freedom and Tθ, γ: [29].
After we have calculated the parameters of each copula, we decided which family is the best representation of the dependence structure between the variables of interest. In order to select the best copula, we used Akaike and Bayesian information criteria [30, 31]. The data was analyzed with the statistical package R 3.3.2.
Results
Table 3 present the statistical characteristics of rainfall, minimum and maximum temperature in the area between 1961 and 2015.
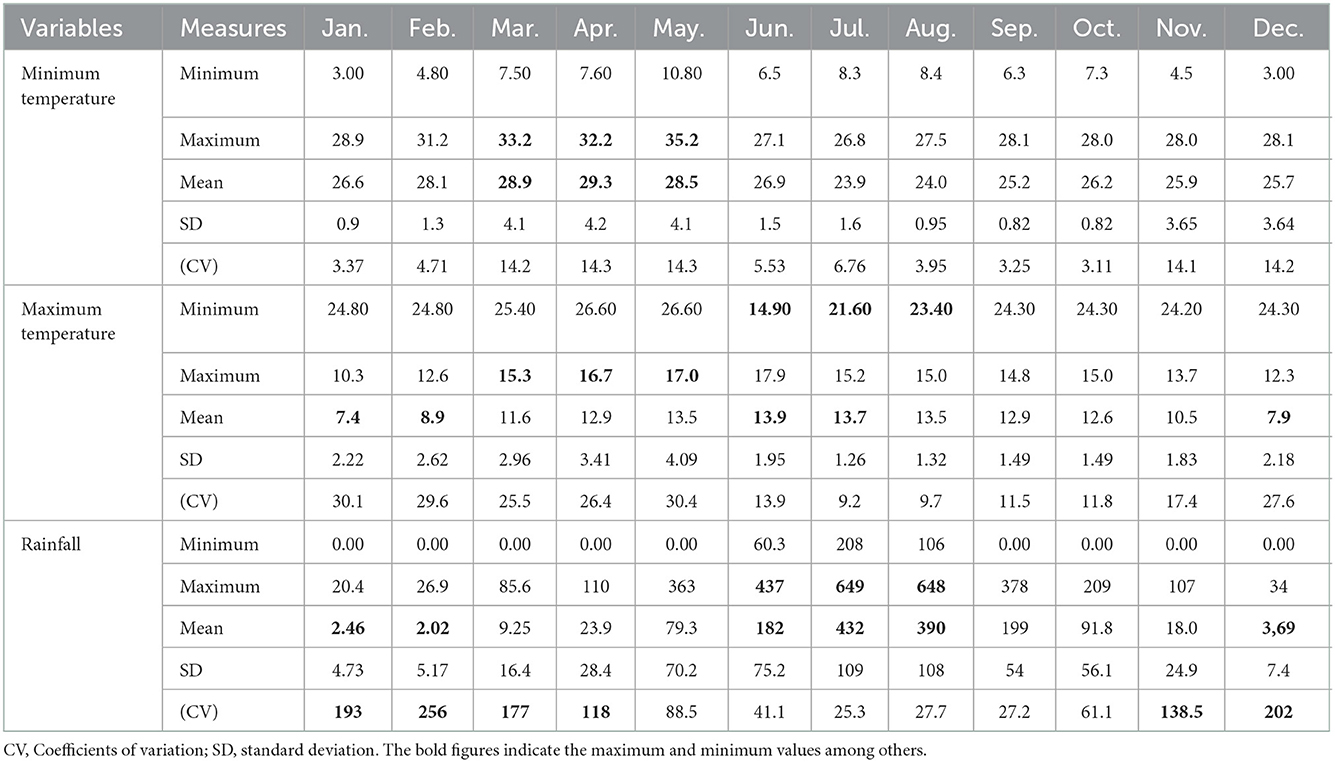
Table 3. Descriptive statistics for monthly minimum, maximum temperature (unit: °C), and rainfall (mm) from 1961 to 2015.
The average minimum temperature usually reaches its bottom peak from December to February and the maximum peak from June to August. The coefficient of variation reveals that the maximum temperature is more consistent than the minimum temperature recorded in all months. Moreover, more variability of the rainfall was recorded in February (CV = 256) and the least variation was in July (25.3). From June to August, the minimum values of the maximum temperature and the monthly maximum rainfall were recorded (Table 3).
Like the minimum and maximum temperature, monthly average rainfall in the study area shows a clear seasonal cycle from 1961 to 2015 Moreover, both the minimum and maximum temperature increases from time to time (Figure 2).
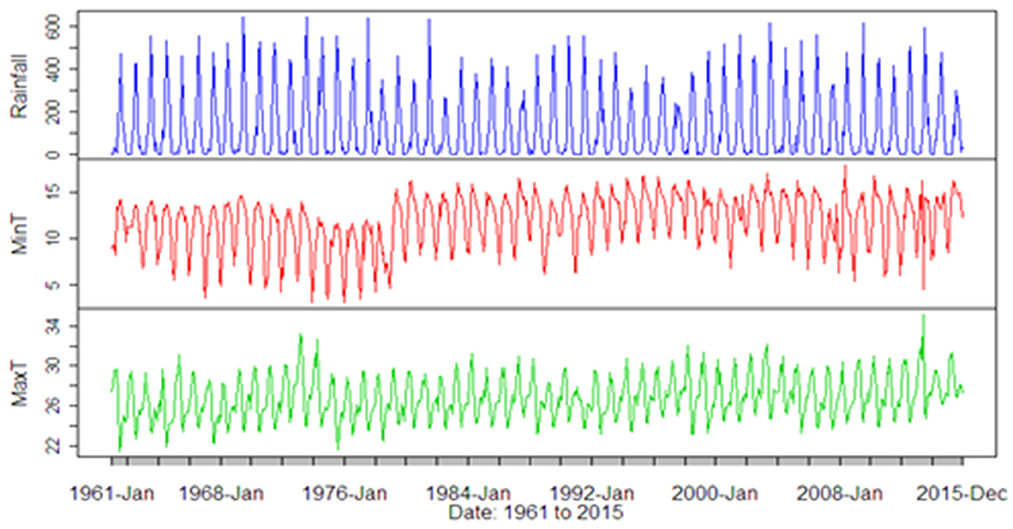
Figure 2. Trend analysis of the monthly rainfall, minimum and maximum temperature.
The mean maximum and minimum temperature have been increasing in the study area by 0.3792 and 0.3714°C per decade in the last six decades, respectively. The rainfall is decreased by 1.48 (mm) per decade from 1961 to 2015 years (Table 4).
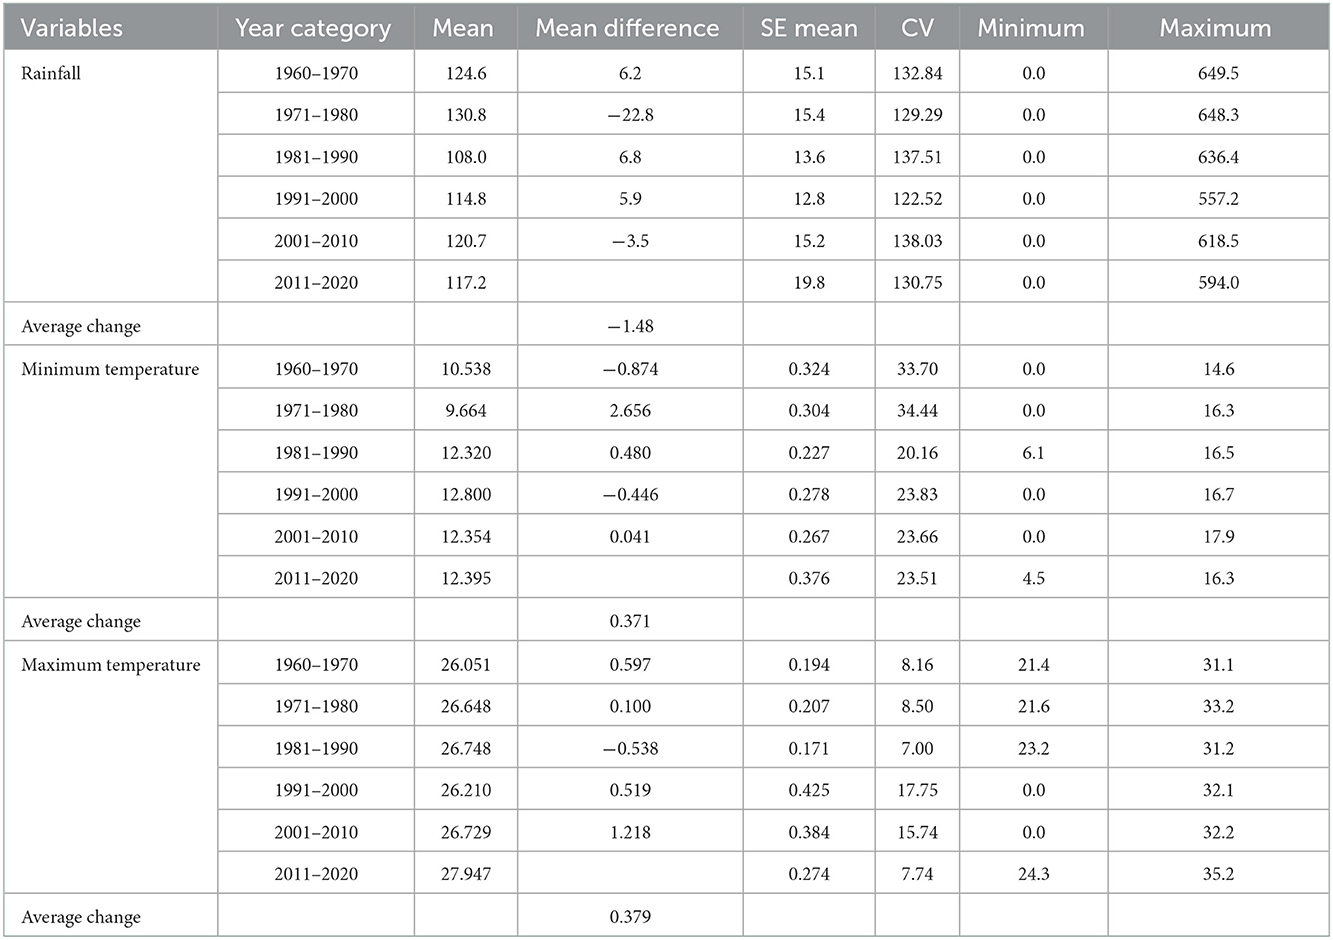
Table 4. Basic descriptive statistics for rainfall, minimum and maximum temperature based on decades from 1961 to 2015.
The skewness of rainfall, minimum, and maximum temperature respectively are 1.39, −0.73, and 0.06. Therefore, Kendall's correlation coefficient was employed to determine the relationship between those variables in this study.
According to the directives of Benth and Saltyte-Benth [32], the time series of temperature and rainfall are tested for auto- correlation using the Q-statistics (Figure 3). The term “autocorrelation” refers to the relationship between temperature (or rainfall) data at various times in relation to the function of time. The effectiveness of the model is decreased because autocorrelation raises the variances of the predicted coefficients and residuals. The Ljung-Box Q test is a type of statistical test of whether autocorrelations of a time series are found to be statistically insignificant for maximum temperature (Q-stat = 1.767, P = 0.184), minimum temperature (Q-stat = 1.830, P = 0.176) and rainfall (Q-stat = 0.445, P = 0.505) as shown in Figure 3.
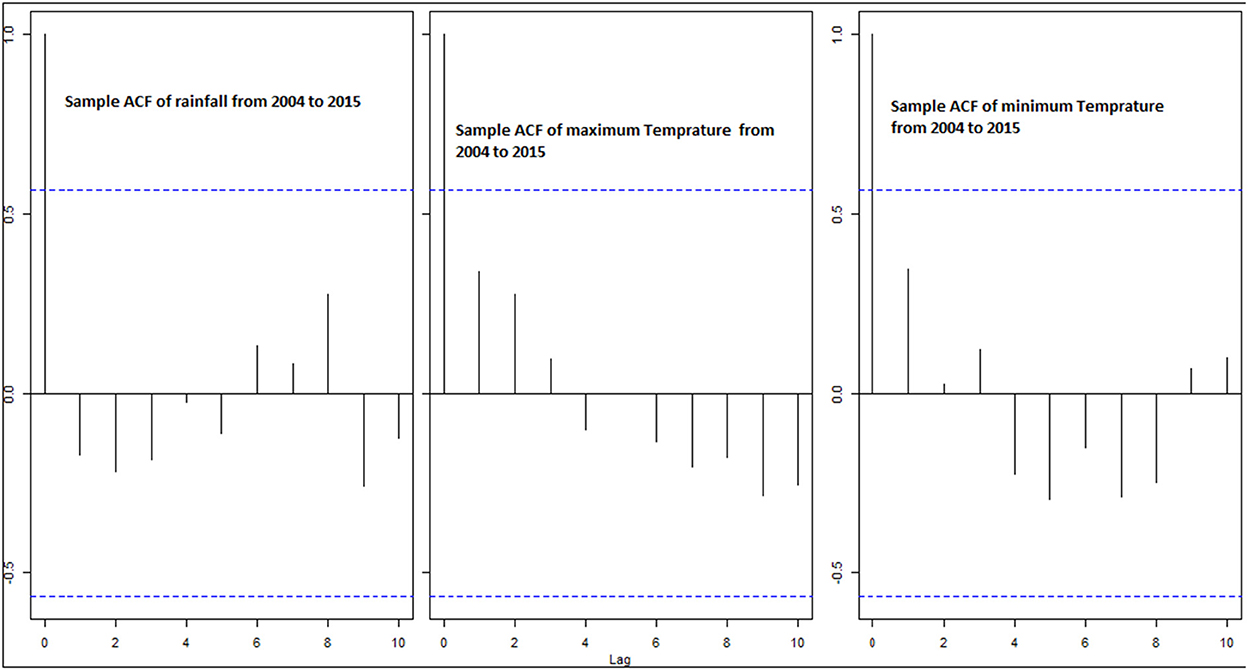
Figure 3. Sample autocorrelation function (ACF) of the three variables (rainfall, minimum and maximum temperature).
The result indicated that there is a significant negative relationship between the mean monthly maximum temperature and rainfall (Kendall's correlation coefficient = −0.388, p ≤ 0.001). Particularly, from April to June (Kendall correlation coefficient is −0.283, −0.33, −0.396, P = 0.003, ≤ 0.001, ≤ 0.001 and respectively) and October to November (−0.251, −0,260, p = 0.022 and 0.006). However, there is a positive significant relationship between the average monthly minimum temperature and rainfall (Kendall's correlation coefficient = 0.425, p ≤ 0.001), from February to March (Kendall's correlation coefficient = 0.353, 0.250, p ≤ 0.001, ≤ 0.010) (Table 5 and Figure 4).
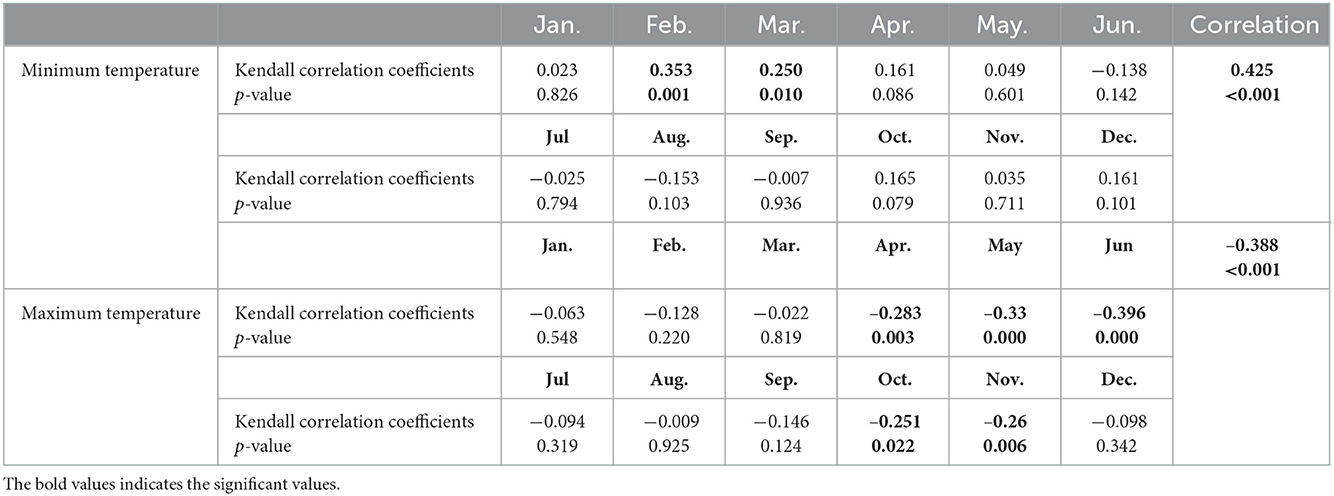
Table 5. Correlation analysis for monthly minimum and maximum temperature with rainfall from 1961 to 2015.
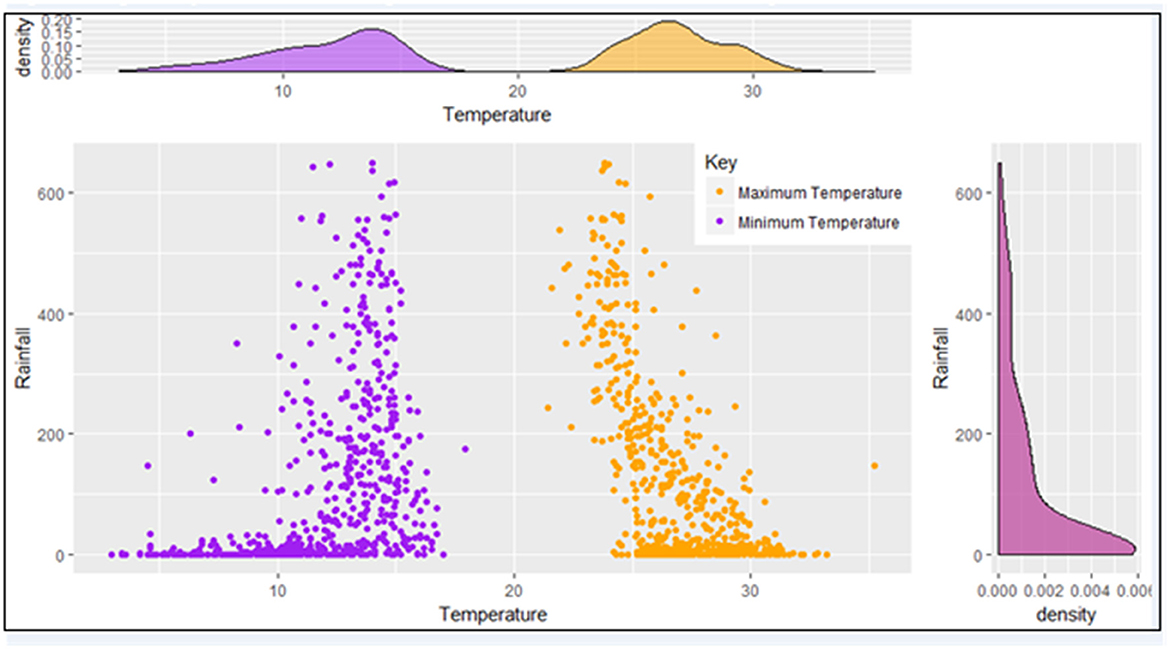
Figure 4. Marginal and joint distribution of average rainfall with minimum and maximum temperature from 1961 to 2015.
Based on the minimum information criteria AIC and BIC values, the Weibull distribution for rainfall with parameters (α =0.41, β = 0.004) mm, Beta for average yearly minimum temperature with parameters (α = 2.95, β = 5.02 and a = 0 and b = 18.3) oC and Gaussian distribution for average yearly maximum temperature with parameters (μ =26.8, σ =2.189) oC were identified as the best marginal distributions, indicated by bold (Table 6).
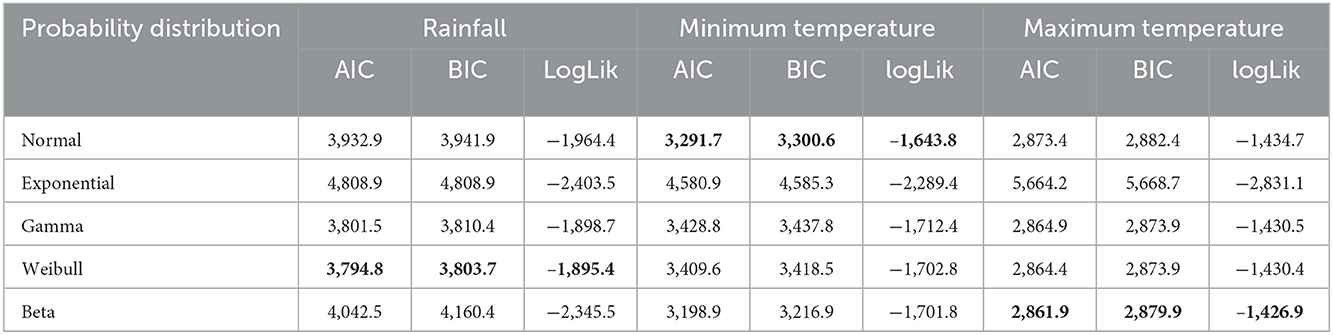
Table 6. The goodness of fit values of AIC, BIC and log likelihood of marginal distributions of the mean rainfall, maximum and minimum temperature.
The marginal distribution function is given below.
The above Equations (2.1–2.3) refer to the marginal/univariate distribution function of average yearly rainfall (Weibull), minimum (Beta), and maximum temperature (Gaussian), respectively.
According to the AIC, BIC, and logLik values, the best copula for the joint modeling of average annual rainfall with minimum temperature is the Clayton, whose parameter was θ = 1.21. However, the Frank copula model fits well for average annual rainfall and maximum temperature, the parameters for the selected copula family is computed and statistically significant (Table 7).
The Equations (4 and 5) given above show the joint/copula model for the average yearly rainfall with minimum temperature and maximum temperature respectively.

Table 7. Results of different copula models for mean annual rainfall with minimum and maximum temperature.
Conclusion
This study has been done in the Bahir Dar city with the aim of investigating the relationship between temperature and rainfall variability. Monthly rainfall and temperature data for the period 1961 to 2015 years were used for this study. Because the sample data is non-Gaussian distributed and skewed, the Kendall correlation coefficient is employed to calculate the correlation between monthly rain-fall and temperature. Our result revealed that there is a significant negative relationship between the mean monthly maximum temperature and rainfall. However, there is a positive significant relationship between the average monthly minimum temperature and rainfall. This is in lined with the climatology correlations that in the study area the correlation between the maximum and minimum temperature, respectively with rainfall is −0.58 and 0.36.
This paper presents modeling the marginal distributions of average annual rainfall, minimum and maximum temperature, and developing copula-based methodologies for rainfall with minimum/maximum temperature, which are very important for climate changes. Moreover, the study presented joint models of rainfall with temperature into the bivariate copula distribution.
The mean maximum and minimum temperature have been increasing in the study area by 0.3792 and 0.3714°C per decade in the last six decades, respectively. That is almost consistent with the study conducted throughout the country [11], and less compared with the world in which mean global surface temperature has warmed by 0.6°C in the past three decades [9].
This approach provides a flexible method to model the bivariate distributions in which variables might not follow the normality assumptions. Based on the criteria, the result of this study shows that, for average yearly rainfall Weibull, for maximum temperature Beta, and minimum temperature Gaussian marginal distributions were identified as the best fit. Moreover, in this study, the copula theory was adopted for modeling rainfall and temperature jointly which are mainly the two basic climatic factors affecting agricultural production and meteorological phenomena. Knowing the nature of the relationship of the temporal change of the temperature with other climatic parameters such as rainfall is crucial for climate planning in the future. Using the AIC, BIC, and logLik values, Clayton and Frank Copula were the best fit for the joint (copula) distribution of rainfall with minimum and maximum temperatures respectively.
The result showed that the relationship between the temperature and the rainfall is not linear. However, no studies have been carried out to determine the structure of the interdependency between these two variables and hence we used the copula theory to determine the relationship and their joint probability distributions. To conclude, the simulated results show that the selected copula leads Kendall's correlation to result in close to the real observations. For instance, for the Clayton model of rainfall and minimum temperature (rho = 0.42 for real observations, rho = 0.44 for simulated observations). Our result revealed that the joint modeling between the variables are consistent with previous research [16, 33–35].
Limitations of the study
the study was only based on methodological data for a particular station, the most suitable copula family for both rainfall and temperatures may change from one station to another due to the change in geographical and geographical conditions. The other important limitation is, it impossible to obtain the daily datasets so we focused on the monthly aggregated values over the study period.
Data availability statement
The original contributions presented in the study are included in the article/supplementary material, further inquiries can be directed to the corresponding author.
Author contributions
HF was involved in this study from data management, data analysis, drafting, and revising the final manuscript. DW and DZ contributed to the conception, design, and interpretation of data, as well as to manuscript reviews and revisions. All authors contributed to the article and approved the submitted version.
Acknowledgments
This Scientific paper was presented at the 61st world statistics congress which was held at Marrakech/Morocco. We author of the manuscript acknowledge the ISI organization for giving us the chance to present this work and incorporating the comments and suggestion from different experts before sending it to publication.
Conflict of interest
The authors declare that the research was conducted in the absence of any commercial or financial relationships that could be construed as a potential conflict of interest.
Publisher's note
All claims expressed in this article are solely those of the authors and do not necessarily represent those of their affiliated organizations, or those of the publisher, the editors and the reviewers. Any product that may be evaluated in this article, or claim that may be made by its manufacturer, is not guaranteed or endorsed by the publisher.
References
1. Karl TR, Knight RW, Plummer N. Trends in high-frequency climate variability in the 20th-century. Nature. (1995) 377:217–20. doi: 10.1038/377217a0
2. Boo KO, Kwon WT, Kim JK. Vegetation change in the regional surface climate over East Asia due to global warming using BIOME4. Nuovo Cimento C Geophys Space Phys C. (2004) 27:317.
3. Zhang D, et al. Climate change, social unrest and dynastic transition in ancient China. Chinese Sci Bull. (2005) 50:137–44. doi: 10.1007/BF02897517
4. Erskine W, El Ashkar F. Rainfall and temperature effects on lentil (Lens culinaris) seed yield in Mediterranean environments. J Agric Sci. (1993) 121:347–54. doi: 10.1017/S0021859600085543
5. Lobell DB, Cahill KN, Field CB. Historical effects of temperature and precipitation on California crop yields. Clim Change. (2007) 81:187–203. doi: 10.1007/s10584-006-9141-3
6. Tadesse N, Tadios S, Tesfaye M. The water balance of may nugus catchment, tigray, Northern Ethiopia. Agri Eng Inter CIGR Jl. (2010) 12:1306.
7. Hulme M, Osborn TJ, Johns TC. Precipitation sensitivity to global warming: Comparison of observations with HadCM2 simulations. Geophys Res Lett. (1998) 25:3379–82. doi: 10.1029/98GL02562
8. Watson RT, Zinyowera MC, Moss RH. Climate Change 1995 Impacts, Adaptations and Mitigation of Climate Change: Scientific-Technical Analysis. Cambridge University Press (1996).
9. Hansen J, Sato M, Ruedy R, Lo K, Lea DW, Medina-Elizade M. Global temperature change. Proc Nat Acad Sci. (2006) 103:14288–93. doi: 10.1073/pnas.0606291103
10. Amsalu A, Gebremichael D. An overview of climate change impacts and responses in Ethiopia in 2009. In: Forum for Environment. Addis Ababa: Springer (2010). doi: 10.1007/978-3-319-75004-0_23
11. Dinku T, Connor SJ, Ceccato P. Comparison of CMORPH and TRMM-3B42 Over Mountainous Regions of Africa and South America, in Satellite Rainfall Applications for Surface Hydrology. New York, NY: Springer (2010). p. 193–204.
12. Shukla J, Misra BM. Relationships between sea surface temperature and wind speed over the central Arabian Sea, and monsoon rainfall over India. Monthly Weather Rev. (1977) 105:998–1002.
13. Moise A, Colman R, Brown J. Behind uncertainties in projections of Australian tropical climate: analysis of 19 CMIP3 models. J Geophys Res Atm. (2012) 117:1–16. doi: 10.1029/2011JD017365
14. Tanarhte M, Hadjinicolaou P, Lelieveld J. Intercomparison of temperature and precipitation data sets based on observations in the Mediterranean and the Middle East. J Geophys Res Atm. (2012) 117:1–20. doi: 10.1029/2011JD017293
15. Rajeevan M, Pai D, Thapliyal V. Spatial and temporal relationships between global land surface air temperature anomalies and Indian summer monsoon rainfall. Meteorol Atm Phys. (1998) 66:157–71. doi: 10.1007/BF01026631
16. Cong RG, Brady M. The interdependence between rainfall and temperature: copula analyses. Sci World J. (2012) 2012:1–12. doi: 10.1100/2012/405675
17. Olesen JE, Bindi M. Consequences of climate change for European agricultural productivity, land use and policy. Eur J Agron. (2002) 16:239–62. doi: 10.1016/S1161-0301(02)00004-7
18. Cantelaube P, Terres J-M. Seasonal weather forecasts for crop yield modelling in Europe. Tellus A Dynam Meteorol Oceanogr. (2005) 57:476–87. doi: 10.1111/j.1600-0870.2005.00125.x
19. Huang Y, Cai J, Yin H, Cai M. Correlation of precipitation to temperature variation in the Huanghe River (Yellow River) basin during 1957–2006. J Hydrol. (2009) 372:1–8. doi: 10.1016/j.jhydrol.2009.03.029
20. Montaseri M, Charati JY, Espahbodi F. Application of parametric models to a survival analysis of hemodialysis patients. Nephro-urol Mon. (2016) 8:e28738. doi: 10.5812/numonthly.28738
21. Kim G, Silvapulle MJ, Silvapulle P. Comparison of semiparametric and parametric methods for estimating copulas. Comput Stat Data Analysis. (2007) 51:2836–50. doi: 10.1016/j.csda.2006.10.009
22. Central Stat Agency. Population Projection of Ethiopia for all Regions at Wereda Level From 2014–2017. Addis Ababa: Central Stat Agency. (2013).
23. Alsina C, Schweizer B, Frank MJ. Associative Functions: Triangular Norms and Copulas. Singapore: World Scientific Publishing (2006).
24. Casella G, Berger RL. Statistical inference. Vol. 2. Duxbury Pacific Grove, CA: Brooks/Cole, Cengage Learning (2022).
25. AghaKouchak A, Bárdossy A, Habib E. Conditional simulation of remotely sensed rainfall data using a non-Gaussian v-transformed copula. Adv Water Resour. (2010) 33:624–34. doi: 10.1016/j.advwatres.2010.02.010
26. Sklar A. Random variables, joint distribution functions, and copulas. Kybernetika. (1973) 9:449–60.
27. Fang HB, Fang KT, Kotz S. The meta-elliptical distributions with given marginals. J Multivar Anal. (2002) 82:1–16. doi: 10.1006/jmva.2001.2017
28. Joe H. Multivariate Models and Multivariate Dependence Concepts. Boca Raton, FL: CRC Press (1997).
29. Grégoire V, Genest C, Gendron M. Using copulas to model price dependence in energy markets. Energy risk. (2008) 5:58–64.
30. Madadgar S, Moradkhani H. A Bayesian framework for probabilistic seasonal drought forecasting. J Hydrometeorol. (2013) 14:1685–705. doi: 10.1175/JHM-D-13-010.1
31. Qin Y. Climate change assessment in columbia river basin (CRB) using copula based on coupling of temperature and precipitation (Dissertation and thesis). Portland State University, Portland, OR, United States. (2015). doi: 10.15760/etd.2309
32. Benth FE. Šaltyte-Benth. Stochastic modelling of temperature variations with a view towards weather derivatives. Appl Math Fin. (2005) 12:53–85. doi: 10.1080/1350486042000271638
33. Keerthirathne D. Joint distribution of rainfall and temperature in Anuradhapura, Sri Lanka using copulas. Theor. Appl. Climatol. (2015) 135:1399–411. doi: 10.1007/s00704-018-2447-z
34. Trivedi PK, Zimmer DM. Copula Modeling: An Introduction for Practitioners. Amsterdam: Now Publishers Inc (2007).
Keywords: copula models, rainfall, dependence, temperature, Kendall tau, Bahir Dar
Citation: Fenta HM, Workie DL and Zikie DT (2023) Joint modeling of rainfall and temperature in Bahir Dar, Ethiopia: Application of copula. Front. Appl. Math. Stat. 8:1058011. doi: 10.3389/fams.2022.1058011
Received: 30 September 2022; Accepted: 20 December 2022;
Published: 09 January 2023.
Edited by:
Himel Mallick, Merck, United StatesReviewed by:
Arinjita Bhattacharyya, Merck, United StatesSuvo Chatterjee, Indiana University, United States
Copyright © 2023 Fenta, Workie and Zikie. This is an open-access article distributed under the terms of the Creative Commons Attribution License (CC BY). The use, distribution or reproduction in other forums is permitted, provided the original author(s) and the copyright owner(s) are credited and that the original publication in this journal is cited, in accordance with accepted academic practice. No use, distribution or reproduction is permitted which does not comply with these terms.
*Correspondence: Haile Mekonnen Fenta,  aGFpbGVtZWtvbm5lbkBnbWFpbC5jb20=