 Norbert Marwan1,2*
- 1Potsdam Institute for Climate Impact Research (PIK), Member of the Leibniz Association, Potsdam, Germany
- 2Institute of Geoscience, University of Potsdam, Potsdam, Germany
The analysis of event time series is in general challenging. Most time series analysis tools are limited for the analysis of this kind of data. Recurrence analysis, a powerful concept from nonlinear time series analysis, provides several opportunities to work with event data and even for the most challenging task of comparing event time series with continuous time series. Here, the basic concept is introduced, the challenges are discussed, and the future perspectives are summarized.
1. Introduction
The study of event time series is of general interest in data analysis and modeling, because of their ubiquitous nature in almost all scientific fields, such as investigating financial transactions, customer interactions, life-threatening cardiac events, system failures, or natural phenomena. Event series can be single, discrete events, binary events or events with different amplitude, e.g., events extracted from data with heavy tail distributions, short-term extreme events, or anomalies in time series. In neuroscience, event series are also called “spike trains” [1]. A time series is generally be denoted by a set of ordered pairs {(ti, xi)} of time ti with ti+1 > ti and corresponding data value xi; and with sampling index i (usually constant sampling time ti+1 − ti = const., i.e., equidistant time axis). An event series, instead, is considered as a series of event times, defined by the associated specific time or timestamp of the single events, finally resulting in a set of event time points {ti}. As events could also have some amplitude, a definition as an event time series as a tuple of time and event strength {(ti, xi)} is also possible. Because the events usually do not occur at regular intervals, such event time series are usually irregularly sampled ti+1 − ti ≠ const. The alternative is using a regularly sampled, discretized time axis with binary (or amplitude) values at those points of time where the event happens (this is similar to categorical data, another class of discrete data, but not necessarily representing separated single events). However, this approach is usually limited and not appropriate for many research questions, because the timing of events often does not fit the sampling points and, even more important, the time series can be filled with many zeros. Standard time series analysis tools have their limits when analysing such data.
Examples of event data are time series of extreme events, which are of specific interest because of their technical and medical importance, and their potential of serious societal impacts: Extreme rainfall (flush floods) and river floods are of strong concern because they are increasing worldwide due to the global warming [2, 3]. Extreme loading conditions are considered and modeled in material sciences to monitor and predict serious failures, e.g., on bridges caused by extreme traffic or on airplane structures due to sudden stress or birdstrikes [4, 5]. Ventricular tachyarrhythmias are life-threatening cardiac arrhythmias, usually analyzed by investigating the beat-to-beat intervals of the heart, expressed by a series of events [described as the R-waves in an electrocardiogram (ECG)], themselves [6]. Examples of natural, rare event time series are sequences of landslides. Such landslide events cause serious damages and can be triggered by specific weather phenomena, like atmospheric rivers or El Niño/ Southern Oscillation [7, 8]. They are increasingly affecting urban settlements, because of the spreading of cities and climate change [9]. Another example is brain activity which is controlled by the firing of neurons. For example, the coherence of neuron firings can cause seizures [10]. The investigation of extreme events in dynamical systems is an important subject in statistics and statistical physics. It covers many research questions, from the emergence of extremes to predicting extreme events [11].
The research questions related to event series are often the same as for other kind of data, e.g., comparing different time series, classifying the dynamics of the process behind, identifying regime changes, or use as the base for simulations and predictions. The growing availability of data and computational facilities in almost all scientific disciplines has significantly advanced data science in general. Several approaches have been introduced that allow to study different research questions related of event data [12–14]. Among them are probabilistic methods based on large deviation and extreme value theory (parametric, semi-parametric approaches, and multivariate extensions), pattern-based prediction algorithms and BDE modeling [15–17], as well as modern learning based approaches for predicting extreme events [18, 19]. Another class of methods are based on the property of recurrences of states. In general, recurrence based methods provide versatile approaches for classifying data, identification of regime transitions, but also for unveiling interrelationships, synchronization, and causal links between different dynamical systems [20–23]. Due to its broad usability, simplicity, and growing number of software allowing recurrence analysis [24], this method is attracting more and more interest and becoming increasingly popular [23, 25]. By modifying the definition of what a recurrence is, it is, in general, possible to adapt recurrence analysis to be usable for analysing discrete and event-like data [26–28]. In the following, I describe briefly the basics of recurrence analysis, its extension to work with event data, and the related challenges and future perspectives.
2. Recurrence analysis of event time series
A recurrence plot (RP) is the graphical representation of the recurrence matrix, which is simply representing all pair-wise time combinations (i, j) of a data sequence which have similar values or states :
with a similarity measure d(·, ·) and the Heaviside function Θ(·) which sets Ri,j = 1 if the similarity value d(·, ·) falls below the threshold ε [29]. For dynamical systems with continuous change of the state variables, i.e., (with m the dimension of the system), the similarity between states is often defined by the Euclidean norm [29]. For discrete data of regular sampling (equidistant time instances), e.g., categorical data, the recurrence matrix R can be simply defined by the Kronecker delta function Ri,j = δ(xi, xj), which is one if both arguments are identical [26, 30–32]. This approach works well for discrete data, such as categorical data or symbolic sequences, with applications, e.g., in life science to detect atrial fibrillation or congestive heart failure [33, 34], to measure synchronization in an epileptic brain [30], or in engineering to optimize manufacturing networks [35]. This concept is easily extendable for bivariate analysis. Cross-RPs, , and joint-RPs, , are two basic concepts for measuring different aspects of synchronization [29]. To modify, the cross-RP for discrete data, we can simply use the Kronecker delta CRi,j = δ(xi, yj) [36]. Joint-RP even allows us to measure the synchronization between different types of data, such as discrete and continuous data [37], where
is the Hadamard product of the RP of the discrete system xi and the RP of the continuous system .
This concept reaches its limits when considering event time series which consist of rare events and many zeros between them, or, even more limiting, consist only of the events {ti} or have strong non-equidistant time instances (ti+1 − ti ≠ const.). For this kind of data, the similarity measure d(·, ·) has to be replaced by a specific metric which measures the coincidence of event sequences. Several measures (event metrics) are available, mainly developed in neuroscience [13]. A widespread measure would be the event synchronization, which allows varying delays between events to be considered as coinciding [38]. This measure is successfully applied for investigating, e.g., the spatio-temporal relationships between extreme rainfall events [39]. Another candidate is the edit distance, an extension of the Levenshtein distance [40, 41]. The distance is calculated by the minimum cost needed to modify one event sequence into another with a limited set of operations (Figure 1). Edit distance is a metric and has been successfully integrated with recurrence analysis [27, 28].
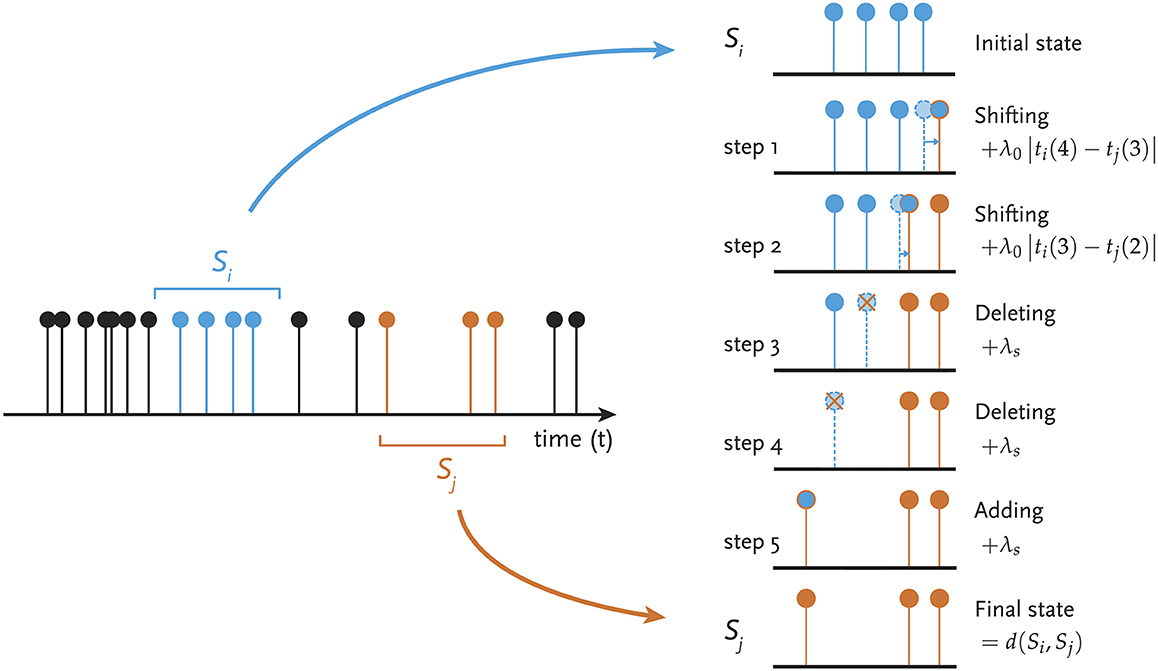
Figure 1. Edit distance as cost-based similarity between event sequences Si and Sj from an event series (left). Events can be shifted, added or deleted, and their amplitude adjusted. All these operations have costs. The minimum cost is used as the distance d(Si, Sj) (right).
The edit distance measure is the (minimum) sum of the costs of the transform operations addition, deletion, and shifting applied to modify a sequence of Ni events (with events at time points ) into sequence (with events at time points ):
where a and b are indices of the events in segments Si and Sj; Ni and Nj the number of events in segments Si and Sj, respectively; N(i, j) the number of events in Si and Sj to be shifted, which form the set C; λs is the cost of deletion/ insertion, and λ0 the cost assigned for shifting events in time. Thus, the first summand corresponds to deletion and insertion operations and the second summand to the shifting of the events (Figure 1). Extensions of this cost function include considering costs for amplitude changes or to modify the shifting term by a continuous cost function allowing a more intuitive interpretation in terms of a delay [27, 28]. To apply the edit distance for recurrence analysis, the event series has to be divided into sequences Si defined by a time window of length Tw. The shifting of this interval can be with smaller steps s < Tw resulting in overlapping time intervals. In order to get reliable costs d(Si, Sj), the resulting sequences Si and Sj should have at least one event (i.e., should not be empty).
This edit distance measure has been used as a simple synchronization measure between event series to study the stimulus responses in neuron spike trains [41], as a similarity measure between extreme rainfall data to reconstruct climate networks [42], and to create regularly sampled time series from non-regularly sampled time series (TACTS approach) [43, 44]. It was also used as a distance measure for computing RPs directly from event data (Figure 2), e.g., to study stock exchange data [27], flood events [28], or to allow calculation of RPs directly from irregularly sampled palaeoclimate data [46, 47]. The integration of the edit distance metric into the RP definition, Equation (1), provides all the applications of recurrence based time series analysis for the specific data of event time series.
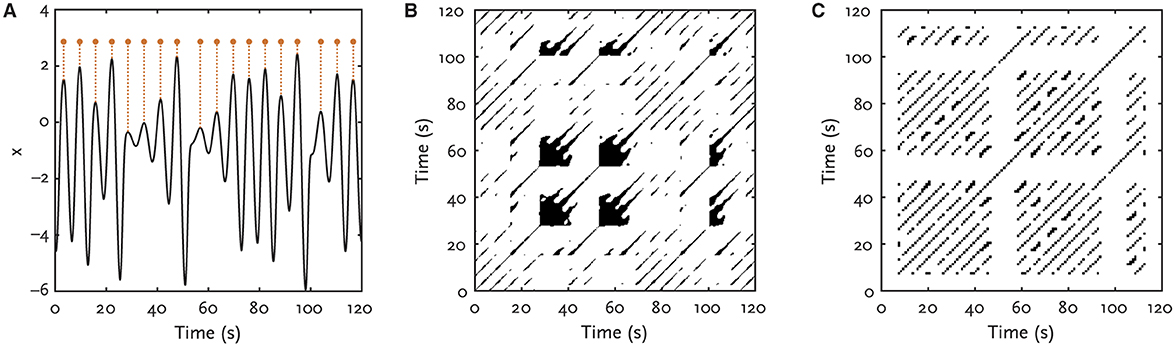
Figure 2. Example of a recurrence plot using edit distance. (A) The maxima (red dots) of the x-variable of the Rössler system [45] are used to mimic sparse (or extreme) events. (B) Recurrence plot calculated from the (x, y, z)-variables of the Rössler system. (C) Recurrence plot derived from the events in (A) using the edit distance as defined by Equation (3). Periodical occurrence of the events are clearly indicated by the period line structures in the edit distance recurrence plot. The empty bars around t =55s and t =100s indicate the parts in the dynamics with abrupt changes where no maximum values appear. Edit distance is calculated using overlapping windows length Tw =15s and moving step of s =1s. The recurrence threshold ε is selected to ensure a recurrence rate (recurrence point density) of 15%.
3. Challenges
Despite the recent advances in recurrence analysis of event time series, there are still several challenges.
Event time series can have missing data which are not easy to be detectable. For example, data on landslide events is mainly available at sites where they affect infrastructure [48], but their statistical analysis with respect to, e.g., climate change would require reliable event series [49]. Missing or sparse data can, therefore, bias the results of any analysis, and is subject of research in time series analysis in general, including interpolation, modeling, or advanced data reconstruction methods [50–52], but mainly not applicable for event data.
The process behind the analyzed study object could be non-stationary (e.g., life-threatening cardiac arrhythmias or seizures [6, 10]), meaning that the statistical properties of the event series may change over time (such as the distribution of events could change over time – events may be sparse, meaning that there could be some periods of time without events), which can make it difficult to apply the event based recurrence analysis (e.g., using edit distance). In particular, if the time interval defined by length Tw is too small, many sequences Si could be empty, resulting in non-defined costs d(Si, Sj). The selection of the time interval length Tw is, thus, crucial. For simple periodically recurring events, the choice might be easy, but its selection if multiple time scales are present is not straightforward [28].
The number of events in an interval can also change due to sampling issues, as it is a common problem in palaeoclimate research, where the deposition rate in sediments is varying over time, thus, leading to palaeoclimate time series of non-equidistant sampling in general [53–55]. Event based metrics, such as event synchronization, event coincidence analysis, or edit distance cost depend on the number of events in the interval and produce different types of biases which impact the results of the quantitative analysis and call for correction schemes [55, 56].
In general, the comparison of event time series with continuous time series is very challenging. Such problems occur, e.g., in climate research when studying recurring pattern of special weather phenomena (e.g., atmospheric rivers) or extreme events (such as heavy precipitation or river floods) with respect to large scale climate phenomena, such as El Niño/ Southern Oscillation or North Atlantic Oscillation [7, 57]. The RP approach offers a promising way by modifying Equation (2) to Kodama et al. [37]. However, event series often consist of much less events than the number of sampling points of the continuous time series, resulting in RPs of rather different length and making it impossible to directly apply Equation (4). An approach to finally match the event based RP with those of the continuous data would be required.
Finally, the uncertainty of the timing of events (timing jitter) is strongly affecting any measure of coincidence. It is expected that timing jitter is a common problem in measuring real-world event series. This challenge might be addressed by evaluating the sensitivity of the results on the jitter using specific models.
The extension of the edit distance can also take amplitude variations into account. However, this mixes two different aspects of the data: the temporal pattern of event sequences and amplitude differences. The optimal choice of the corresponding parameters might be less clear then, but have to be used to balance between these aspects.
4. Discussion
The perspective future methodical developments will consider several important challenges to study interesting research questions related to (discrete) event data.
For recurrence analysis of event data, so far only the edit distance metric has been applied. It would be important to test and compare also other measures, such as Needleman-Wunsch distance, event synchronization, event coincidence analysis, or ARI-SPIKE-distance [13, 38, 56, 58]. Specific discrete data might call for distance metrics considering amplitude differences, e.g., edit distance or longest common subsequence [59].
Data with missing events is a general problem. Different strategies might be considered to solve this challenge, including correction and gap filling schemes [51, 55]. Correction schemes are also important for data with non-stationarities (varying sparsity of events). Such correction schemes needs further development to be applicable in a more general way (e.g., independent of the event distribution) and be more computationally efficient.
Events can exhibit some kind of temporal dependencies, meaning that the likelihood of an event may depend on the occurrence of previous events. The RQA measures could be used to study temporal dependencies from event series [28]. In general, diagonal lines in a RP represent the tendency that current neighbors in phase space will remain to be neighbors in the near future, thus represent serial dependence. The RQA measure determinism is quantifying the fraction of recurrences forming such diagonal lines and can, thus, be used as an indicator of serial dependence.
The classification of dynamical processes by event series based on duration, frequency of events or their characteristics (e.g., shape), will be another interesting application which will also involve machine learning approaches. The combination of machine learning with recurrence analysis is currently a strongly developing field with applications mainly in classification and prediction, using RPs and RQA measures as inputs in machine learning workflows [23]. A typical example is to convert time series into images by using the RP approach which are finally fed into the machine learning workflow for classification [60]. RPs of event series can be used in a similar manner for such kind of classification tasks. Other characteristics of event series (like serial dependence) would be accessible to machine learning approaches by the RQA measures [61–63].
The detection of interdependencies or synchronization of (sub-)systems represented by different kinds of data (e.g., event data with continuous time series) is an important methodical challenge. New approaches based on RPs seem to be promising, including the concept of joint-RPs [37] and the comparison of the probability of recurrences [64]. The advantage is the comparison by the recurrence structure, which would allow comparing time series of different kinds (e.g., event series vs. continuous data). It includes further developments to finally match the size of event based RPs with those of the continuous data, e.g., considering coarse-graining, interpolation, or specific window selections schemes (for event-sequence based metrics like edit distance) [28].
RP based analysis can be used to infer coupling directions or even causal links between different systems [65, 66]. Thus, the next step would be to test this approach for its potential on causality testing even for event data.
RPs also allow to identify patterns or regularities in challenging data, such as event series, including the estimation of the power spectral density of event series [67]. The most obvious way to derive a spectrum from a RP is to use the probability of recurrence after lag τ, which is simply the density of recurrence points along the diagonals (with distance τ from the main diagonal). This probability of recurrence is related to the auto-correlation [68, 69]. Using the edit distance measure, the temporal dependency structure within the event series can be visualized and quantified with this approach. Finally, the power spectrum can then be estimated from this probability of recurrence, either by applying the Fourier transform or any other advanced decomposition [67, 69].
The uncertainty of the timing of events (timing jitter) needs to be considered in the analysis, leading to new concepts such as Monte Carlo based ensemble approaches or Bayesian approaches. A recently proposed concept combines a Bayesian approach with RPs to derive a RP which explicitly represents the uncertainties of the timing of data points [70]. The resulting recurrence matrix contains the probabilities of recurrences instead of the binary information of recurrences. The recurrence quantification of such matrix is still subject of future research.
Although various distance measures for event based RP computation are available, the already applied one, edit distance, provides already a bunch of interesting directions for future research. For example, the choice of an optimal window length Tw or the different cost parameters λ. Including the cost for amplitude differences require an optimal choice of the corresponding parameters, which would need some systematic studies to provide some guidance to balance between the differences in the temporal and spatial domain.
The recurrence analysis as a concept is rather novel approach, with a lot of interesting and powerful developments and extensions in the last two decades [23]. It is also a promising concept for studying different aspects related to (discrete) event time series, where other methods have their limits.
Code availability
Julia code to reproduce Figure 2 is available at: Zenodo, https://doi.org/10.5281/zenodo.7467886.
Data availability statement
The original contributions presented in the study are included in the article/supplementary material, further inquiries can be directed to the corresponding author.
Author contributions
The author confirms being the sole contributor of this work and has approved it for publication.
Funding
This work has been partly supported by the BMBF grant climXtreme (No. 01LP1902J; Spatial synchronization patterns of heavy precipitation events) and by the DFG research training group GRK 2043/1 [Natural risk in a changing world (NatRiskChange)].
Acknowledgments
Tobias Braun, K. Hauke Kraemer, Abhirup Banerjee, Deniz Eroglu, Çelik Özdes, and Jürgen Kurths were acknowledged for fruitful discussions and ongoing collaborations on this subject.
Conflict of interest
The author declares that the research was conducted in the absence of any commercial or financial relationships that could be construed as a potential conflict of interest.
Publisher's note
All claims expressed in this article are solely those of the authors and do not necessarily represent those of their affiliated organizations, or those of the publisher, the editors and the reviewers. Any product that may be evaluated in this article, or claim that may be made by its manufacturer, is not guaranteed or endorsed by the publisher.
References
1. Harris KD, Henze DA, Hirase H, Leinekugel X, Dragoi G, Czurkó A, et al. Spike train dynamics predicts theta-related phase precession in hippocampal pyramidal cells. Nature. (2002) 417:738–41. doi: 10.1038/nature00808
2. Prein AF, Rasmussen RM, Ikeda K, Liu C, Clark MP, Holland GJ. The future intensification of hourly precipitation extremes. Nat Clim Chang. (2017) 7:48–52. doi: 10.1038/nclimate3168
3. Kemter M, Merz B, Marwan N, Vorogushyn S, Blöschl G. Joint trends in flood magnitudes and spatial extents across Europe. Geophys Res Lett. (2020) 47:e2020GL087464. doi: 10.1029/2020GL087464
4. Enright B, O'Brien EJ. Monte Carlo simulation of extreme traffic loading on short and medium span bridges. Struct Infrastruct Eng. (2013) 9:1267–82. doi: 10.1080/15732479.2012.688753
5. Iannucci L. Progressive failure modelling of woven carbon composite under impact. Int J Impact Eng. (2006) 32:1013–43. doi: 10.1016/j.ijimpeng.2004.08.006
6. Marwan N, Wessel N, Meyerfeldt U, Schirdewan A, Kurths J. Recurrence plot based measures of complexity and its application to heart rate variability data. Phys Rev E. (2002) 66:e026702. doi: 10.1103/PhysRevE.66.026702
7. Miller DK, Miniat CF, Wooten RM, Barros AP. An expanded investigation of atmospheric rivers in the Southern Appalachian mountains and their connection to landslides. Atmosphere. (2019) 10:71. doi: 10.3390/atmos10020071
8. Sepúlveda SA, Petley DN. Regional trends and controlling factors of fatal landslides in Latin America and the Caribbean. Nat Hazard Earth Syst Sci. (2015) 15:1821–1833. doi: 10.5194/nhess-15-1821-2015
9. Ozturk U, Bozzolan E, Holcombe EA, Shukla R, Pianosi F, Wagener T. How climate change and unplanned urban sprawl bring more landslides. Nature. (2022) 608:262–5. doi: 10.1038/d41586-022-02141-9
10. Steriade M. Corticothalamic resonance, states of vigilance and mentation. Neuroscience. (2000) 101:243–76. doi: 10.1016/S0306-4522(00)00353-5
11. Nag Chowdhury S, Ray A, Dana SK, Ghosh D. Extreme events in dynamical systems and random walkers: A review. Phys Rep. (2022) 966:1–52. doi: 10.1016/j.physrep.2022.04.001
12. Malik N, Bookhagen B, Marwan N, Kurths J. Analysis of spatial and temporal extreme monsoonal rainfall over South Asia using complex networks. Climate Dyn. (2012) 39:971–87. doi: 10.1007/s00382-011-1156-4
13. Ciba M, Bestel R, Nick C, de Arruda GF, Peron T, Henrique CC, et al. Comparison of different spike train synchrony measures regarding their robustness to erroneous data from bicuculline-induced epileptiform activity. Neural Comput. (2020) 32:887–911. doi: 10.1162/neco_a_01277
14. Voit P, Heistermann M. A new index to quantify the extremeness of precipitation across scales. Nat Hazards Earth Syst Sci. (2022) 22:2791–805. doi: 10.5194/nhess-22-2791-2022
15. Beirlant J, Goegebeur Y, Segers J, Teugels JL, De Waal D, Ferro C. Statistics of Extremes: Theory and Applications. Chichester: Wiley. (2006).
16. Ghil M, Yiou P, Hallegatte S, Malamud BD, Naveau P, Soloviev A, et al. Extreme events: Dynamics, statistics and prediction. Nonlin Process Geophys. (2011) 18:295–350. doi: 10.5194/npg-18-295-2011
17. Lucarini V, Faranda D, de Freitas ACGMM, de Freitas JMM, Holland M, Kuna T, et al. Extremes and Recurrence in Dynamical Systems. Chichester: Wiley. (2016).
18. Qi D, Majda AJ. Using machine learning to predict extreme events in complex systems. Proc Natl Acad Sci USA. (2020) 117:52–9. doi: 10.1073/pnas.1917285117
19. Banerjee A, Mishra A, Dana SK, Hens C, Kapitaniak T, Kurths J, et al. Predicting the data structure prior to extreme events from passive observables using echo state network. Front Appl Math Statist. (2022) 8:955044. doi: 10.3389/fams.2022.955044
20. Eckmann JP, Oliffson Kamphorst S, Ruelle D. Recurrence plots of dynamical systems. Europhys Lett. (1987) 4:973–7. doi: 10.1209/0295-5075/4/9/004
21. Romano MC, Thiel M, Kurths J, von Bloh W. Multivariate recurrence plots. Phys Lett A. (2004) 330:214–23. doi: 10.1016/j.physleta.2004.07.066
22. Hirata Y, Aihara K. Identifying hidden common causes from bivariate time series: A method using recurrence plots. Phys Rev E. (2010) 81:e016203. doi: 10.1103/PhysRevE.81.016203
23. Marwan N, Kraemer KH. Trends in recurrence analysis of dynamical systems. Eur Phys J. (2023). doi: 10.1140/epjs/s11734-022-00739-8
24. Recurrence Plots Cross Recurrence Plots: Software/Programmes. (2022). Available online at: http://www.recurrence-plot.tk/programmes.php (accessed February 22, 2023).
25. Marwan N. A historical review of recurrence plots. Eur Phys J. (2008) 164:3–12. doi: 10.1140/epjst/e2008-00829-1
26. Faure P, Lesne A. Recurrence plots for symbolic sequences. Int J Bifurcat Chaos. (2010) 20:1731–49. doi: 10.1142/S0218127410026794
27. Suzuki S, Hirata Y, Aihara K. Definition of distance for marked point process data and its application to recurrence plot-based analysis of exchange tick data of foreign currencies. Int J Bifurcat Chaos. (2010) 20:3699–708. doi: 10.1142/S0218127410027970
28. Banerjee A, Goswami B, Hirata Y, Eroglu D, Merz B, Kurths J, et al. Recurrence analysis of extreme event-like data. Nonlin Process Geophys. (2021) 28:213–29. doi: 10.5194/npg-28-213-2021
29. Marwan N, Romano MC, Thiel M, Kurths J. Recurrence plots for the analysis of complex systems. Phys Rep. (2007) 438:237–329. doi: 10.1016/j.physrep.2006.11.001
30. Groth A. Visualization of coupling in time series by order recurrence plots. Phys Rev E. (2005) 72:e046220. doi: 10.1103/PhysRevE.72.046220
31. Bandt C, Groth A, Marwan N, Romano MC, Thiel M, Rosenblum M, et al. Analysis of bivariate coupling by means of recurrence. In: R Dahlhaus, J Kurths, P Maas, J Timmer, editors, Mathematical Methods in Time Series Analysis and Digital Image Processing. Understanding Complex Systems. Berlin; Heidelberg: Springer. (2008). p. 153–82.
32. Leonardi G. A Method for the computation of entropy in the Recurrence Quantification Analysis of categorical time series. Phys A. (2018) 512:824–36. doi: 10.1016/j.physa.2018.08.058
33. Caballero-Pintado MV, Matilla-García M, Marín MR. Symbolic recurrence plots to analyze dynamical systems. Chaos. (2018) 28:e063112. doi: 10.1063/1.5026743
34. Pérez-Valero J, Victoria Caballero Pintado M, Melgarejo F, García-Sánchez AJ, Garcia-Haro J, García Cordoba, et al. Symbolic recurrence analysis of RR interval to detect atrial fibrillation. J Clin Med. (2019) 8:1840. doi: 10.3390/jcm8111840
35. Donner RV, Hinrichs U, Scholz-Reiter B. Symbolic recurrence plots: A new quantitative framework for performance analysis of manufacturing networks. Eur Phys J. (2008) 164:85–104. doi: 10.1140/epjst/e2008-00836-2
36. Lira-Palma D, Gonzalez-Rosales K, Castillo RD, Spencer R, Fresno A. Categorical cross-recurrence quantification analysis applied to communicative interaction during Ainsworth's strange situation. Complexity. (2018) 2018:4547029. doi: 10.1155/2018/4547029
37. Kodama K, Shimizu D, Dale R, Sekine K. An approach to aligning categorical and continuous time series for studying the dynamics of complex human behavior. Front Psychol. (2021) 12:614431. doi: 10.3389/fpsyg.2021.614431
38. Quian Quiroga R, Kreuz T, Grassberger P. Event synchronization: A simple and fast method to measure synchronicity and time delay patterns. Phys Rev E. (2002) 66:e041904. doi: 10.1103/PhysRevE.66.041904
39. Boers N, Bookhagen B, Marwan N, Kurths J. Spatiotemporal characteristics and synchronization of extreme rainfall in South America with focus on the Andes Mountain range. Climate Dyn. (2016) 46:601–17. doi: 10.1007/s00382-015-2601-6
40. Masek WJ, Paterson MS. A faster algorithm computing string edit distances. J Comput Syst Sci. (1980) 20:18–31. doi: 10.1016/0022-0000(80)90002-1
41. Victor JD, Purpura KP. Metric-space analysis of spike trains: Theory, algorithms and application. Network. (1997) 8:127–64. doi: 10.1088/0954-898X_8_2_003
42. Agarwal A, Guntu RK, Banerjee A, Gadhawe MA, Marwan N. A complex network approach to study the extreme precipitation patterns in a river basin. Chaos. (2022) 32:e013113. doi: 10.1063/5.0072520
43. Ozken I, Eroglu D, Stemler T, Marwan N, Bagci GB, Kurths J. Transformation-cost time-series method for analyzing irregularly sampled data. Phys Rev E. (2015) 91:e062911. doi: 10.1103/PhysRevE.91.062911
44. Eroglu D, McRobie FH, Ozken I, Stemler T, Wyrwoll KH, Breitenbach SFM, et al. See-saw relationship of the Holocene East Asian-Australian summer monsoon. Nat Commun. (2016) 7:12929. doi: 10.1038/ncomms12929
45. Rössler OE. An equation for continuous chaos. Phys Lett A. (1976) 57:397–398. doi: 10.1016/0375-9601(76)90101-8
46. Ozken I, Eroglu D, Breitenbach SFM, Marwan N, Tan L, Tirnakli U, et al. Recurrence plot analysis of irregularly sampled data. Phys Rev E. (2018) 98:e052215. doi: 10.1103/PhysRevE.98.052215
47. Ozdes C, Eroglu D. Transformation cost spectrum for irregularly sampled time series. Eur Phys J. (2022). doi: 10.1140/epjs/s11734-022-00512-x
48. Steger S, Mair V, Kofler C, Pittore M, Zebisch M, Schneiderbauer S. Correlation does not imply geomorphic causation in data-driven landslide susceptibility modelling—Benefits of exploring landslide data collection effects. Sci Tot Environ. (2021) 776:145935. doi: 10.1016/j.scitotenv.2021.145935
49. Alvioli M, Melillo M, Guzzetti F, Rossi M, Palazzi E, von Hardenberg J, et al. Implications of climate change on landslide hazard in Central Italy. Scie Tot Environ. (2018) 630:1528–43. doi: 10.1016/j.scitotenv.2018.02.315
50. Alavi N, Warland JS, Berg AA. Filling gaps in evapotranspiration measurements for water budget studies: Evaluation of a Kalman filtering approach. Agric For Meteorol. (2006) 141:57–66. doi: 10.1016/j.agrformet.2006.09.011
51. Facchini A, Mocenni C. Filling gaps in ecological time series by means of twin surrogates. Int J Bifurcat Chaos. (2011) 21:1085–97. doi: 10.1142/S021812741102901X
52. Sarafanov M, Nikitin NO, Kalyuzhnaya AV. Automated data-driven approach for gap filling in the time series using evolutionary learning. In: Advances in Intelligent Systems and Computing. vol. 1401. Berlin: Springer. (2022). p. 633–42.
53. Rehfeld K, Marwan N, Heitzig J, Kurths J. Comparison of correlation analysis techniques for irregularly sampled time series. Nonlin Process Geophys. (2011) 18:389–404. doi: 10.5194/npg-18-389-2011
54. Breitenbach SFM, Rehfeld K, Goswami B, Baldini JUL, Ridley HE, Kennett D, et al. Constructing proxy-record age models (COPRA). Climate Past. (2012) 8:1765–79. doi: 10.5194/cp-8-1765-2012
55. Braun T, Fernandez CN, Eroglu D, Hartland A, Breitenbach SFM, Marwan N. Sampling rate-corrected analysis of irregularly sampled time series. Phys Rev E. (2022) 105:e024206. doi: 10.1103/PhysRevE.105.024206
56. Wolf F, Bauer J, Boers N, Donner RV. Event synchrony measures for functional climate network analysis: A case study on South American rainfall dynamics. Chaos. (2020) 30:e033102. doi: 10.1063/1.5134012
57. Mundhenk BD, Barnes EA, Maloney ED, Baggett CF. Skillful empirical subseasonal prediction of landfalling atmospheric river activity using the Madden–Julian oscillation and quasi-biennial oscillation. NPJ Climate Atmos Sci. (2018) 1:19–21. doi: 10.1038/s41612-017-0008-2
58. Needleman SB, Wunsch CD. A general method applicable to the search for similarities in the amino acid sequence of two proteins. Jo Mol Biol. (1970) 48:443–53. doi: 10.1016/0022-2836(70)90057-4
59. Bergroth L, Hakonen H, Raita T. A survey of longest common subsequence algorithms. In: Proceedings Seventh International Symposium on String Processing and Information Retrieval. SPIRE 2000. A Curuna (2000). p. 39–48.
60. Estebsari A, Rajabi R. Single residential load forecasting using deep learning and image encoding techniques. Electronics. (2020) 9:68. doi: 10.3390/electronics9010068
61. Mohebbi M, Ghassemian H. Prediction of paroxysmal atrial fibrillation using recurrence plot-based features of the RR-interval signal. Physiol Meas. (2011) 32:1147. doi: 10.1088/0967-3334/32/8/010
62. Malekzadeh A, Zare A, Yaghoobi M, Alizadehsani R. Automatic diagnosis of epileptic seizures in EEG signals using fractal dimension features and convolutional autoencoder method. Big Data Cogn Comput. (2021) 5:78. doi: 10.3390/bdcc5040078
63. Yang YX, Gao Z, Wang XM, Li YL, Han JW, Marwan N, et al. A recurrence quantification analysis-based channel-frequency convolutional neural network for emotion recognition from EEG. Chaos. (2018) 28:e085724. doi: 10.1063/1.5023857
64. Nkomidio AM, Ngamga EK, Nbendjo BRN, Kurths J, Marwan N. Recurrence-based synchronization analysis of weakly coupled bursting neurons under external ELF fields. Entropy. (2022) 24:235. doi: 10.3390/e24020235
65. Ramos AMT, Builes-Jaramillo A, Poveda G, Goswami B, Macau EEN, Kurths J, et al. Recurrence measure of conditional dependence and applications. Phys Rev E. (2017) 95:e052206. doi: 10.1103/PhysRevE.95.052206
66. Peluso E, Craciunescu T, Murari A. A refinement of recurrence analysis to determine the time delay of causality in presence of external perturbations. Entropy. (2020) 22:865. doi: 10.3390/e22080865
67. Kraemer KH, Hellmann F, Anvari M, Kurths J, Marwan N. Spike spectra for recurrences. Entropy. (2022) 24:1689. doi: 10.3390/e24111689
68. Marwan N, Kurths J. Nonlinear analysis of bivariate data with cross recurrence plots. Phys Lett A. (2002) 302:299–307. doi: 10.1016/S0375-9601(02)01170-2
69. Zbilut JP, Marwan N. The Wiener-Khinchin theorem and recurrence quantification. Phys Lett A. (2008) 372:6622–6. doi: 10.1016/j.physleta.2008.09.027
Keywords: event time series, extreme events, recurrence analysis, edit distance, synchronization
Citation: Marwan N (2023) Challenges and perspectives in recurrence analyses of event time series. Front. Appl. Math. Stat. 9:1129105. doi: 10.3389/fams.2023.1129105
Received: 21 December 2022; Accepted: 16 February 2023;
Published: 09 March 2023.
Edited by:
Axel Hutt, Inria Nancy—Grand-Est Research Centre, FranceReviewed by:
Tuan D. Pham, Prince Mohammad Bin Fahd University, Saudi ArabiaMoreno I. Coco, Sapienza University of Rome, Italy
Copyright © 2023 Marwan. This is an open-access article distributed under the terms of the Creative Commons Attribution License (CC BY). The use, distribution or reproduction in other forums is permitted, provided the original author(s) and the copyright owner(s) are credited and that the original publication in this journal is cited, in accordance with accepted academic practice. No use, distribution or reproduction is permitted which does not comply with these terms.
*Correspondence: Norbert Marwan, bWFyd2FuQHBpay1wb3RzZGFtLmRl