 Matteo Taroni
 Ilaria Spassiani
 Nick Laskin2
 Simone Barani
- 1Earthquake Department, National Institute of Geophysics and Volcanology (INGV), Rome, Italy
- 2IsoTrace Laboratory, University of Toronto, Toronto, ON, Canada
- 3Department of Earth, Environment and Life Sciences - DISTAV, University of Genoa, Genoa, Liguria, Italy
In this note, we study the distribution of earthquake numbers in both worldwide and regional catalogs: in the Global Centroid Moment Tensor catalog, from 1980 to 2019 for magnitudes Mw 5. 5+ and 6.5+ in the first case, and in the Italian instrumental catalog from 1960 to 2021 for magnitudes Mw 4.0+ and 5.5+ in the second case. A subset of the global catalog is also used to study the Japanese region. We will focus our attention on short-term time windows of 1, 7, and 30 days, which have been poorly explored in previous studies. We model the earthquake numbers using two discrete probability distributions, i.e., Poisson and Negative Binomial. Using the classical chi-squared statistical test, we found that the Poisson distribution, widely used in seismological studies, is always rejected when tested against observations, while the Negative Binomial distribution cannot be disproved for magnitudes Mw 6.5+ in all time windows of the global catalog. However, if we consider the Japanese or the Italian regions, it cannot be proven that the Negative Binomial distribution performs better than the Poisson distribution using the chi-squared test. When instead we compared the performances of the two distributions using the Akaike Information Criterion, we found that the Negative Binomial distribution always performs better than the Poisson one. The results of this study suggest that the Negative Binomial distribution, largely ignored in seismological studies, should replace the Poisson distribution in modeling the number of earthquakes.
Introduction
One of the goals of statistical seismology is to forecast the number of events in a future space-time window. To properly determine the probability of the number of events in the selected space-time window, seismologists use discrete probability distributions, such as the Poisson distribution and (seldom) the Negative Binomial (NB) distribution [1]. In particular, besides long-term forecasting applications (usually known as probabilistic seismic hazard analyses (e.g., Meletti et al. [2], Danciu et al. [3]), the Poisson distribution is also widely used in short-term forecasting (time windows from 1 day to 1 month), both for making earthquake forecasts and for testing models based on independent observations [4–6]. In these cases, the time variations of the seismic rates are described by the Omori-Utsu law [7, 8], but the number of events in a selected future time window is modeled by a Poisson distribution [4, 5]. Another approach involves the epidemic space-time models (e.g., the ETAS model, Ogata [9]); in this case, the number of events in a selected future time window is modeled by computing a large number of simulations [10].
The use of Poisson distribution in short-term forecasting is criticized, since the clustering of seismicity leads to an overdispersed distribution of the number of events [11]. This conclusion is also consistent with recent studies showing that the temporal distribution of seismicity is governed by long-term correlation [12–14], a property of earthquake clustering.
The key to the success of the Poisson model for earthquake occurrence mostly relies on its simplicity. However, on the one hand, a Poisson distribution with only one parameter is too simple to capture the variability of the number of seismic events. On the other hand, a distribution based on seismic sequences modeling (e.g., using the ETAS model, [9]), albeit more suitable, is difficult to apply in real-time due to the large number of simulations needed [15]. The NB distribution can be a good compromise: it is more flexible than the Poisson distribution, since it uses two parameters instead of one, and is less complicated than an ETAS-based simulation approach.
In this paper, we aim to test whether the NB distribution, which has already been successfully used for modelingthe number of earthquakes on a global scale (worldwide catalog with a time window of 1 year, [16]), can be used for shorter time windows, and whether this distribution has better characteristics compared to the Poisson distribution.
Data
In this study, we use both global and regional catalogs. The first catalog we consider is the Global Centroid Moment Tensor (GCMT) [17, 18], from 1980 to 2019 (Figure 1A), which has already been used in some important studies on earthquake statistics (e.g., 19, 20). We selected events with a maximum depth of 50 km and a moment magnitude (Mw) above 5.5 [19]. Other studies suggest that Mw 5.5 may be too optimistic in the first years of the catalog [20] or just after the strongest events [21]. Thus, we also assume Mw 6.5 as a second lower threshold to be used: from this value on, the catalog can be considered complete. These two thresholds are also associated with earthquake and tsunami risk, since events with Mw 5.5+ can cause significant damage to buildings [22], and events with Mw 6.5+ can generate a tsunami wave that cannot be neglected [23]. We also consider a subset of the GCMT catalog, focused on the Japan region (see Figure 1A), to better investigate the characteristics of the Poisson and NB distributions in this very active seismic region. The second catalog we consider is the Italian instrumental catalog with homogenized magnitudes (HORUS catalog, [24]), from 1960 to 2021. Here we have removed the offshore events to achieve reliable completeness (Figure 1B). We started our tests from a magnitude Mw 4.0, as suggested by the authors of the catalog [24], but also used Mw 5.5 as the second threshold because these two values are used in the Italian operational earthquake forecasting model [5].
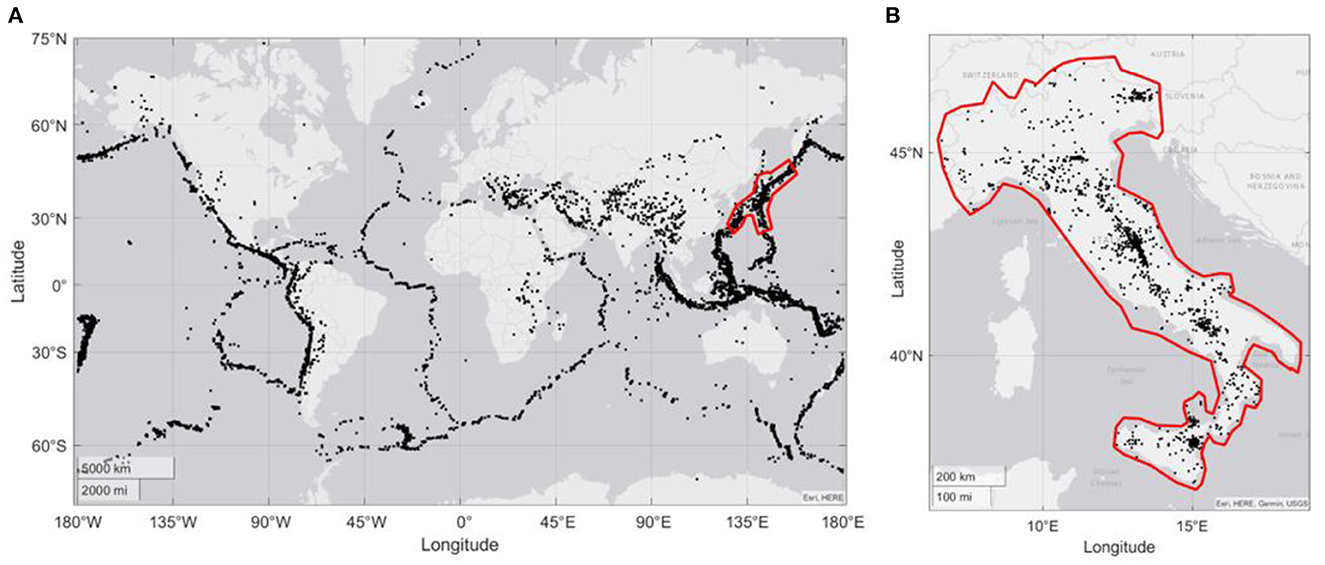
Figure 1. (A) Earthquake epicenters from the GCMT catalog from 1980 to 2019, Mw 5.5+, maximum depth 50 km; the red polygon bounds the Japanese zone considered in this study. (B) Earthquake epicenters according to the HORUS catalog from 1960 to 2021, Mw 4.0+, maximum depth 30 km; the red polygon bounds the Italian zone considered in this study.
Methods
As suggested in the Introduction, to model the number of earthquakes we consider here two discrete probability distributions: Poisson and Negative Binomial.
According to the Poisson distribution, events occur independently of each other with a known constant rate λ. The corresponding probability density function (PDF) is given by:
This distribution is widely used in probabilistic seismic hazard analysis [25], but it does not take into account the well-known property of earthquakes to cluster in space and time. Indeed, the Poisson variance is too small to reflect the actual distribution of the number of earthquakes [11]. An overdispersed discrete distribution that better reflects the branching nature of the seismic events is the Negative Binomial distribution. The branching nature of earthquakes reflects their triggering property: when an earthquake occurs, the probability of a repeated earthquake in a close space-time window increases [11]. Therefore, the branching nature of earthquakes leads to the observed spatiotemporal clustering of seismicity. Kagan [11] provides some theoretical arguments relating seismicity clustering to NB distribution. Due to its simple formulation, NB is also the preferred choice for practical applications over other overdispersed distributions, such as the generalized Poisson distribution [26, 27]. The PDF of the NB distribution is given by:
Unlike the Poisson distribution, which is just based on the rate parameter (λ), the NB distribution depends on two parameters (r, p), the second of which can be used to characterize overdispersion in the seismic process (i.e., earthquake clustering). In this paper, we estimate the value of the parameters of the two distributions under study using the classical Maximum-Likelihood Estimation (MLE) technique:
where X = {x1, …xi, …xN} is the set of observations, i.e., the number of events in the i-th time window, N is the number of time windows considered, θ is the vector of parameters (one for Poisson and two for NB), and pθ is the PDF of the selected distribution [Equation (1) for Poisson and Equation (2) for NB].
Goodness-of-fit test and Akaike Information Criterion
To test the theoretical distributions against observations (from the seismic catalog), we use the well-known chi-squared goodness of fit test [28, 29]. This test is suitable for comparing observations with discrete probability distributions (as in our case for the number of seismic events in a selected time window), whose parameters are estimated from the same dataset of observations [30]. A classic p-value threshold used to reject a hypothesis is 0.05; since here we performed) 6 tests for each model and for each of the three datasets (world, Japan, Italy, we must use a correction to avoid the “multiple testing problem” [31]. Therefore, using the Bonferroni correction we consider p-value 0.05/6 = 0.0083 as the lower limit of the threshold 0.05/6 = 0.0083 [32].
The Akaike Information Criterion (AIC, [33]) is a classical method used to compare the performances of two or more models with different number of parameters:
where k is the number of model parameters, and is the maximum value of the likelihood. The smaller the AIC, the better the model. Here we use AIC to compare the performances of the Poisson and the Negative Binomial distributions.
Result and discussion
Our results are presented in Tables 1–3. Table 1 shows that, in the short-term, the Negative Binomial distribution fits well for events with Mw 6.5+ in all considered time windows of 1, 7, and 30 days in the case of the GCMT catalog. In fact, the p-values of the chi-squared test (Table 1) here increasingly exceed 0.05/6 = 0.0083 (two out of three are very large, i.e., >0.3), which demonstrates the best performance of the NB distribution for Mw 6.5+ events. This good fit can also be seen in the AIC values, which are always lower for the NB distribution than for the Poisson distribution. The results just discussed are valid for Mw 5.5+ events and the time window of 1 month in the global catalog: the Poisson distribution should be rejected, while the NB distribution is not. As for the chi-squared test for the 1 and 7 days cases and Mw 5.5+ GCMT events, the p-values associated with the NB distribution are significantly greater than or the Poisson distribution (several orders of magnitudes higher); however, both distributions fail the goodness-of-fit test (small absolute p-values). However, the results of the AIC speak in favor of the NB distribution for all the considered time windows (1, 7, and 30 days).
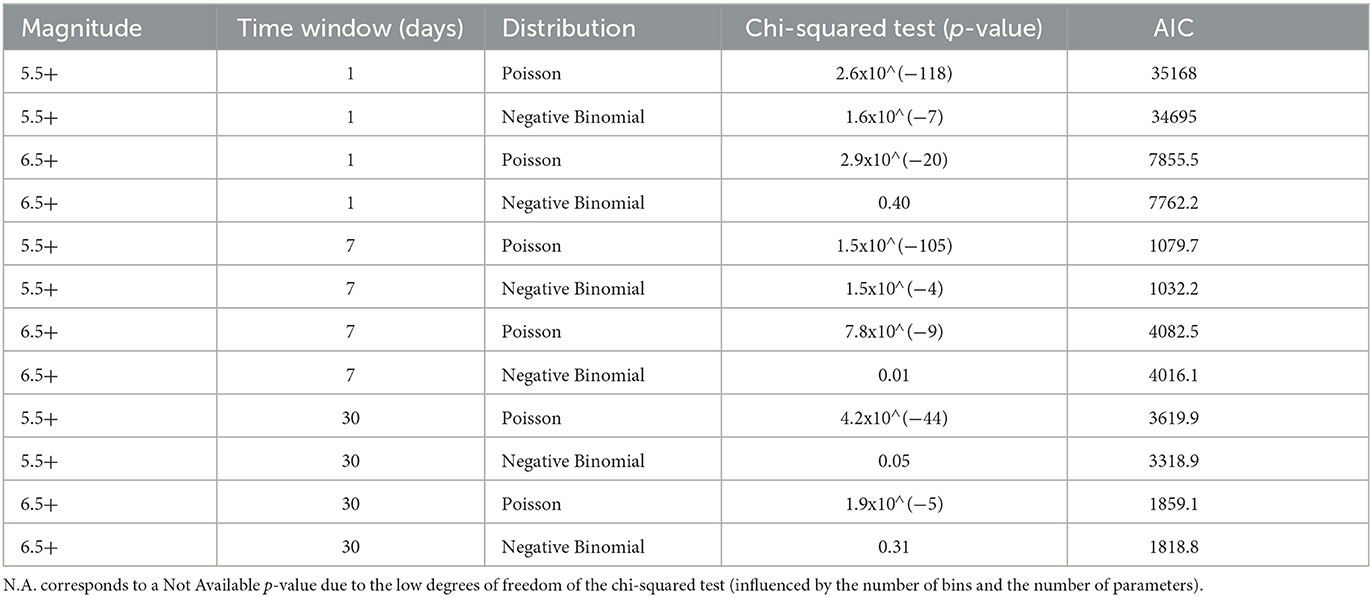
Table 1. Goodness-of-fit test and AIC results for the Poisson and the Negative Binomial distributions on global data.
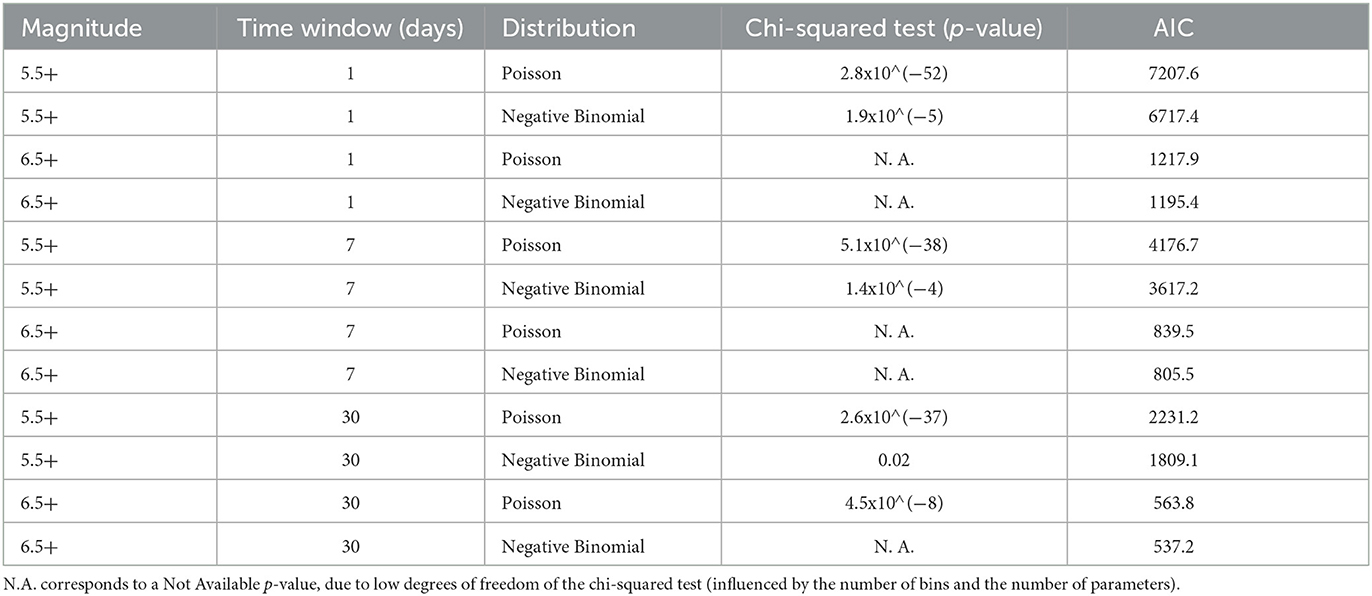
Table 2. Goodness-of-fit test and AIC results for the Poisson and the Negative Binomial distributions on Japanese data.
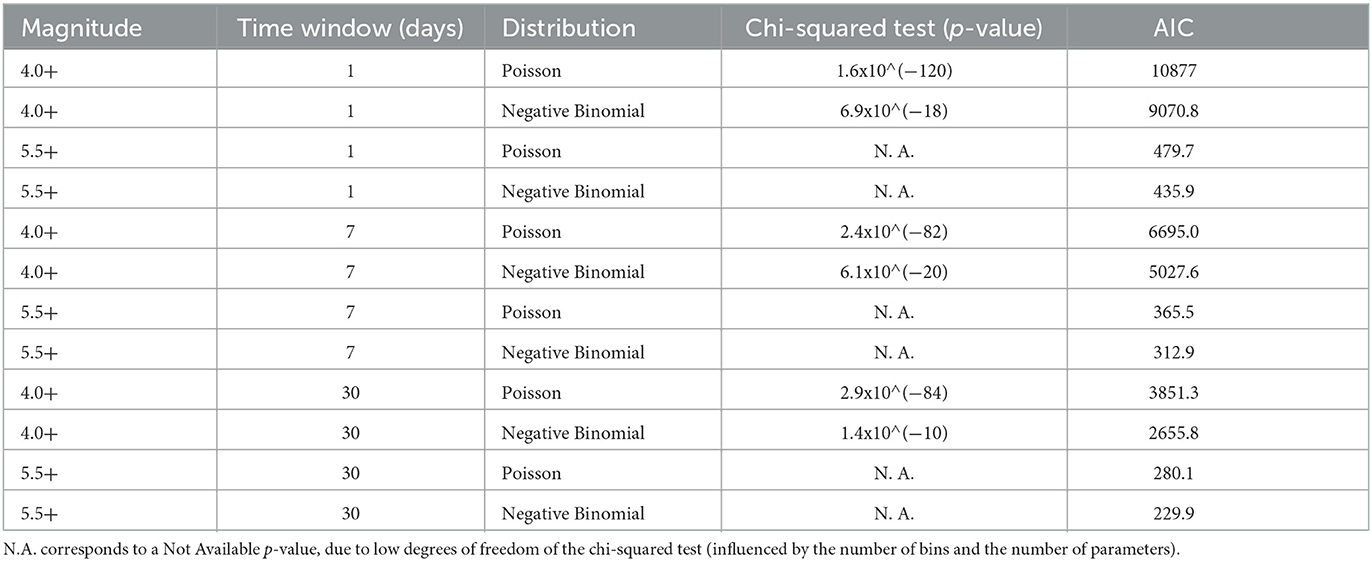
Table 3. Goodness-of-fit test and AIC results for the Poisson and the Negative Binomial distributions on Italian data.
Now let's look at the results for the Italian and Japanese catalogs. Due to the low degrees of freedom, the chi-squared test applied to these spatial shorter-scale catalogs provides no explanation for almost any of the considered time intervals. We get multiple Not Available p-values, as shown in Tables 2, 3. However, the cases in which the p-value is calculated are in complete agreement with the results referring to the global catalog. In particular, we observe that for Japanese events Mw 5.5+ within 1 month, the results of the chi-squared test favor the NB distribution. Also, similarly to the global catalog and despite the fruitless chi-squared test, the AIC values for the Poisson distribution are always higher than for NB. This allows us to vote again in favor of the NB distribution.
In general, we can conclude that, in the short term, the NB distribution should be preferred over the Poisson distribution, especially when considering significant seismicity on a global scale. This is consistent with Kagan [11] study, which states that the NB distribution “is clearly a better approximation” to the distribution of the number of annual earthquakes. In Figures 2–4 we show the empirical distribution of the observations (i.e., histograms) along with the estimated Poisson and Negative Binomial distributions for all the time windows. Looking at these figures, we can appreciate the differences between the two distributions (e.g., Figure 2 Mw 5.5+ 30 days, or Figure 4 Mw 4.0+ 30 days); in some cases, the distributions seem very similar because in the linear scale of these figures is not possible to appreciate the differences in bins with a low number of events (e.g., Figure 2 Mw 5.5+ 7 days, for more than 15 events).
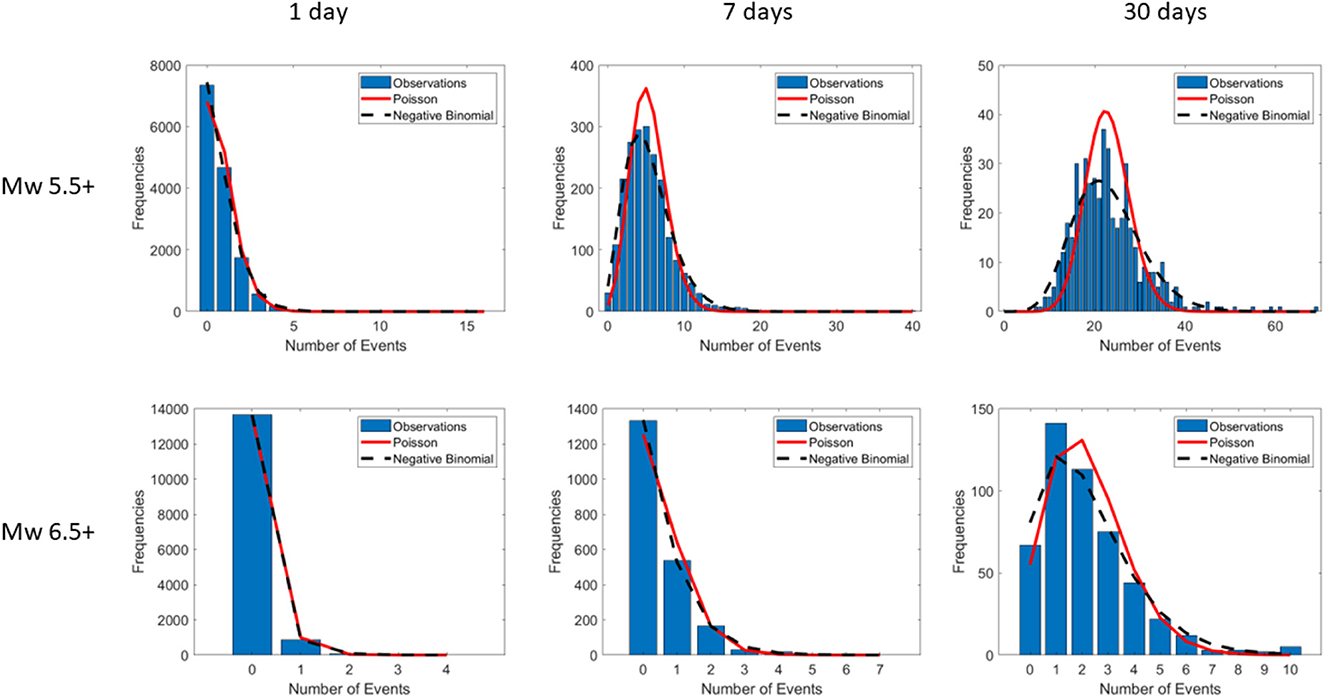
Figure 2. Global catalog; empirical (blue bars) vs. theoretical distributions (red line for Poisson, black dashed line for Negative Binomial) for magnitudes Mw 5.5+ and 6.5+ and for time windows of 1, 7, and 30 days.
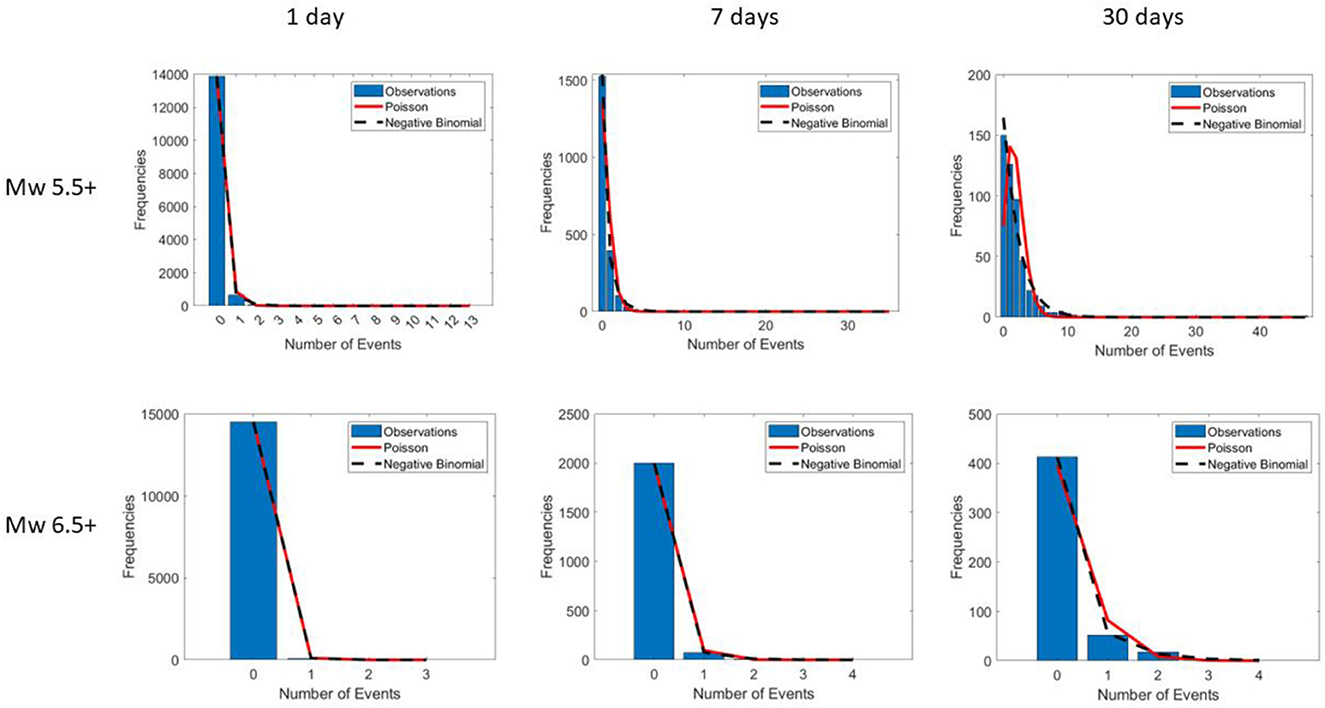
Figure 3. Japanese zone empirical (blue bars) vs. theoretical distributions (red line for Poisson, black dashed line for Negative Binomial) for magnitudes Mw 5.5+ and 6.5+ and for time windows of 1, 7, and 30 days.
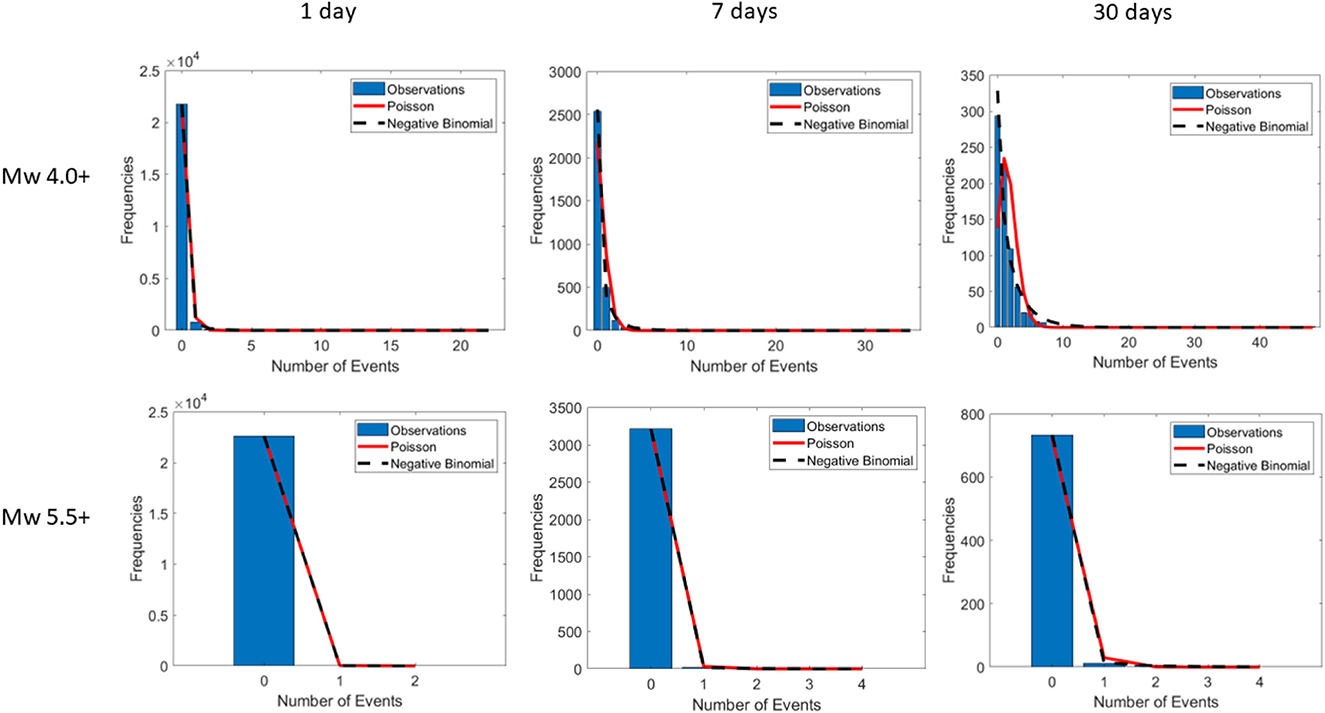
Figure 4. Italian zone empirical (blue bars) vs. theoretical distributions (red line for Poisson, black dashed line for Negative Binomial) for magnitudes Mw 4.0+ and 5.5+ and for time windows of 1, 7, and 30 days.
Conclusion
In this study, we tested two different probability distributions for the number of earthquakes in short-time windows (1 day, 7 days, 30 days) using worldwide seismic data (Mw 5.5+ and 6.5+ from 1980 to 2019), data from the same catalog but with a focus on Japan, and regional seismic data from Italy (Mw 4.0+ and 5.5+ from 1960 to 2021). As already shown in previous studies, we found that the Poisson distribution cannot properly describe the number of events. Conversely, the Negative Binomial distribution performed better, especially for large magnitude events (Mw 6.5+) of the global catalog, for all considered time windows. However, in the Japanese and Italian regional catalogs, the Negative Binomial distribution fails to describe the number of events, especially in Italy for magnitudes Mw 4.0+ and 5.5+, although with better performances compared to the Poisson distribution. These new results demonstrate the power of the Negative Binomial distribution in forecasting the number of earthquakes in short-time windows, in particular if we compare its performance with that of the Poisson distribution. Our findings for time windows of 1 and 7 days could be especially useful for short-term earthquake forecasting. Both models based on the Omori-Utsu law and epidemic models (like ETAS) are widely used for short-term earthquake forecasting, along with the Poisson distribution to model the number of events in a future time window; our results suggest also considering the Negative Binomial distribution to model the number of events.
Data availability statement
The original contributions presented in the study are included in the article/supplementary material, further inquiries can be directed to the corresponding author. The data and the code used in this paper are available in the repository https://github.com/MatteoTaroniINGV/NegativeBinomialDistribution (Last access: June 2023).
Author contributions
MT, NL, and SB developed the idea. MT performed the statistical tests. MT and IS wrote the manuscript. MT, IS, NL, and SB discussed the results and review the manuscript. All authors contributed to the article and approved the submitted version.
Funding
This study received funding from Centro di Pericolosità Sismica (CPS), INGV, Rome.
Conflict of interest
The authors declare that the research was conducted in the absence of any commercial or financial relationships that could be construed as a potential conflict of interest.
Publisher's note
All claims expressed in this article are solely those of the authors and do not necessarily represent those of their affiliated organizations, or those of the publisher, the editors and the reviewers. Any product that may be evaluated in this article, or claim that may be made by its manufacturer, is not guaranteed or endorsed by the publisher.
References
1. Kagan YY. Earthquakes: Models, Statistics, Testable Forecasts. Chichester: John Wiley and Sons. (2013). doi: 10.1002/9781118637913
2. Meletti C, Marzocchi WVD, Amico G, Lanzano L, Luzi F, Martinelli B. Pace, et al. Visini and the MPS19 working group. The new Italian seismic hazard model (MPS19). Annals Geophysics. (2021) 64:SE112. doi: 10.4401/ag-8579
3. Danciu L, Nandan S, Reyes C, Basili R, Weatherill G, Beauval C, et al. The 2020 update of the European seismic hazard model: model overview. EFEHR Tech Report. (2021) 001:v1. doi: 10.12686/a15
4. Reasenberg PA, Jones LM. Earthquake hazard after a mainshock in California. Science. (1989) 243:1173–6. doi: 10.1126/science.243.4895.1173
5. Marzocchi W, Lombardi AM, Casarotti E. The establishment of an operational earthquake forecasting system in Italy. Seismol Res Lett. (2014) 85:961–9. doi: 10.1785/0220130219
6. Rhoades DA, Schorlemmer D, Gerstenberger MC, Christophersen A, Zechar JD, Imoto M, et al. Efficient testing of earthquake forecasting models. Acta Geophysica. (2011) 59:728–47. doi: 10.2478/s11600-011-0013-5
7. Utsu T. Aftershocks and earthquake statistics (2): further investigation of aftershocks and other earthquake sequences based on a new classification of earthquake sequences. J Fac Sci. (1971) 3:197–266.
8. Utsu T. Aftershocks and earthquake statistics (3): Analyses of the distribution of earthquakes in magnitude, time and space with special consideration to clustering characteristics of earthquake occurrence (1). J Fac Sci. (1972) 3:379–441.
9. Ogata Y. Space-time point-process models for earthquake occurrences. Ann Inst Stat Math. (1998) 50:379–402. doi: 10.1023/A:1003403601725
10. Zhuang J. Next-day earthquake forecasts for the Japan region generated by the ETAS model. Earth Planets Space. (2011) 63:207–16. doi: 10.5047/eps.2010.12.010
11. Kagan YY. Statistical distributions of earthquake numbers: consequence of branching process. Geophysical J Int. (2010) 180:1313–28. doi: 10.1111/j.1365-246X.2009.04487.x
12. Cisternas A, Polat O, Rivera L. The Marmara Sea region: seismic behaviour in time and the likelihood of another large earthquake near Istanbul (Turkey). J Seismol. (2004) 8:427–37. doi: 10.1023/B:JOSE.0000038451.04626.18
13. Barani S, Mascandola C, Riccomagno E, Spallarossa D, Albarello D, Ferretti G, et al. Long-range dependence in earthquake-moment release and implications for earthquake occurrence probability. Sci Rep. (2018) 8:5326. doi: 10.1038/s41598-018-23709-4
14. Barani S, Cristofaro L, Taroni M, Gil-Alaña, LA, Ferretti G. Long memory in earthquake time series: the case study of the geysers geothermal field. Front Earth Sci. (2021) 3:3649. doi: 10.3389/feart.2021.563649
15. Nandan S, Ouillon G, Sornette D, Wiemer S. Forecasting the full distribution of earthquake numbers is fair, robust, and better. Seismol Res Lett. (2019) 90:1650–9. doi: 10.1785/0220180374
16. Kagan YY. Earthquake number forecasts testing. Geophysical J Int. (2017) 211:335–45. doi: 10.1093/gji/ggx300
17. Dziewonski AM, Chou TA, Woodhouse JH. Determination of earthquake source parameters from waveform data for studies of global and regional seismicity. J Geophysical Res Solid Earth. (1981) 86:2825–52. doi: 10.1029/JB086iB04p02825
18. Ekström G, Nettles M, Dziewoński AM. The global CMT project 2004–2010: centroid-moment tensors for 13,017 earthquakes. Physics Earth Planet Int. (2012) 200:1–9. doi: 10.1016/j.pepi.2012.04.002
19. Schorlemmer D, Wiemer S, Wyss M. Variations in earthquake-size distribution across different stress regimes. Nature. (2005) 437:539–42. doi: 10.1038/nature04094
20. Kagan YY. Accuracy of modern global earthquake catalogs. Physics Earth Planet Int. (2003) 135:173–209. doi: 10.1016/S0031-9201(02)00214-5
21. Iwata T. Low detection capability of global earthquakes after the occurrence of large earthquakes: Investigation of the Harvard CMT catalogue. Physics Earth Planet Int. (2008) 174:849–56. doi: 10.1111/j.1365-246X.2008.03864.x
22. Camassi R, Azzaro R, Tertulliani A. Macroseismology: The lessons learnt from the 1997/98 Colfiorito seismic sequence. Annals Geophysics. (2008) 3:453. doi: 10.4401/ag-4453
23. Basili R, Brizuela B, Herrero A, Iqbal S, Lorito S, Maesano FE, et al. The making of the NEAM tsunami hazard model 2018 (NEAMTHM18). Front Earth Sci. (2021) 753. doi: 10.3389/feart.2020.616594
24. Lolli B, Randazzo D, Vannucci G, Gasperini P. The HOmogenized instRUmental Seismic catalog (HORUS) of Italy from 1960 to present. Seismol Res Lett. (2020) 91:3208–22. doi: 10.1785/0220200148
25. Cornell CA. Engineering seismic risk analysis. Bullet Seismol Soc Am. (1968) 58:1583–606. doi: 10.1785/BSSA0580051583
26. Jackson DD, Kagan YY. Testable earthquake forecasts for 1999. Seismol Res Lett. (1999) 70:393–403. doi: 10.1785/gssrl.70.4.393
27. Kagan YY, Jackson DD. Probabilistic forecasting of earthquakes. Geophysical J Int. (2000) 143:438–53. doi: 10.1046/j.1365-246X.2000.01267.x
28. Pearson KX. On the criterion that a given system of deviations from the probable in the case of a correlated system of variables is such that it can be reasonably supposed to have arisen from random sampling The London, Edinburgh, and Dublin Philosophical Magazine. J Sci. (1900) 50:157–75. doi: 10.1080/14786440009463897
29. Plackett RL. Karl Pearson and the chi-squared test. Int Stat Rev Rev Int de Stat. (1983) 59–72. doi: 10.2307/1402731
30. Balakrishnan N, Voinov V, Nikulin MS. Chi-Squared Goodness Of Fit Tests With Applications. Oxford: Academic Press. (2013).
31. Aguilera Bustos JP, Taroni M, Adam L. A robust statistical framework to properly test the spatiotemporal variations of the b-value: an application to the geothermal and volcanic zones of the nevado del ruiz volcano. Seismol Soc Am. (2022) 93:2793–803. doi: 10.1785/0220220004
32. Bonferroni C. Teoria statistica delle classi e calcolo delle probabilità. Publ del Real Istit Sup di Sci Econ e Comm di Fir. (1936) 8:3–62.
Keywords: earthquake forecast, Poisson distribution, Negative Binomial (NB) distribution, chi-squared test, seismic catalog
Citation: Taroni M, Spassiani I, Laskin N and Barani S (2023) How many strong earthquakes will there be tomorrow? Front. Appl. Math. Stat. 9:1152476. doi: 10.3389/fams.2023.1152476
Received: 27 January 2023; Accepted: 14 June 2023;
Published: 05 July 2023.
Edited by:
Jisheng Kou, Shaoxing University, ChinaReviewed by:
Peter Shebalin, Institute of Earthquake Prediction Theory and Mathematical Geophysics (RAS), RussiaPiyang Liu, Qingdao University of Technology, China
Copyright © 2023 Taroni, Spassiani, Laskin and Barani. This is an open-access article distributed under the terms of the Creative Commons Attribution License (CC BY). The use, distribution or reproduction in other forums is permitted, provided the original author(s) and the copyright owner(s) are credited and that the original publication in this journal is cited, in accordance with accepted academic practice. No use, distribution or reproduction is permitted which does not comply with these terms.
*Correspondence: Matteo Taroni, bWF0dGVvLnRhcm9uaUBpbmd2Lml0