 Aixiang Yang
- School of Accounting, Chengdu College of Arts and Sciences, Chengdu, China
With the rapid advancement of information technology, particularly the widespread adoption of big data and machine learning, corporate financial management is undergoing unprecedented transformation. Traditional methods often lack accuracy, speed, and flexibility in forecasting and decision-making. This study proposes a hybrid Convolutional Neural Network (CNN) and Long Short-Term Memory (LSTM) model to enhance financial data prediction and decision efficiency. Utilizing financial data from A-share listed companies in the CSMAR database (2000–2023), we analyzed 54 key financial indicators across 54,389 observations. The data underwent preprocessing and dimensionality reduction via Principal Component Analysis (PCA) to eliminate redundancy and noise. The CNN-LSTM hybrid model was then trained and tested on the refined dataset. Experimental results demonstrate the superior performance of the proposed model, achieving a Mean Squared Error (MSE) of 0.020 and an R2 score of 0.411, significantly outperforming benchmark models (ARIMA, Random Forest, XGBoost, and standalone LSTM). A practical enterprise case analysis further confirms the model’s effectiveness in improving financial forecasting accuracy, optimizing decision-making, and mitigating financial risks. The findings highlight that a big data and machine learning-driven financial forecasting system can substantially enhance corporate financial management. By improving prediction reliability and operational efficiency, this approach aids businesses in achieving robust risk control and sustainable growth in uncertain market environments.
1 Introduction
With the continuous advancement of information technology, particularly the rapid development of big data and machine learning, corporate financial management is undergoing significant changes. Traditional financial management systems often rely on static historical data and rule-based decision models. Although these systems have improved financial processing efficiency to some extent, their limitations in real-time data analysis and handling complex forecasting tasks have gradually become apparent as businesses grow and the market environment becomes more complex. In particular, traditional methods often fail to meet the high demands for accuracy and flexibility in financial forecasting and decision support, which impacts the efficiency and quality of decision-making.
The combination of big data and machine learning technologies offers new solutions to address these challenges. Big data technology efficiently processes large volumes of diverse data, enabling the identification of complex patterns in financial data and providing more precise support for decision-making (1). Machine learning algorithms, such as regression analysis, classification models, and time series analysis, have shown great potential in the field of financial forecasting (2). Research shows that machine learning methods can analyze historical financial data in depth, predict future financial conditions, and even provide early warnings for potential risks (3, 4). Driven by deep learning technologies, models such as Long Short-Term Memory (LSTM) networks have been widely applied to time series forecasting of financial data, yielding significant results (5, 6).
This study aims to explore how to integrate big data and machine learning technologies to construct a financial forecasting and decision support system. It also analyzes key indicators that are valuable for application in corporate financial management. By designing a reasonable technical framework and constructing appropriate models, this research seeks to promote the intelligent and precise development of financial management.
2 Literature
With the rapid development of big data and machine learning technologies, especially the application of deep learning in financial management, both academia and industry have increasingly focused on the potential of these technologies in corporate financial forecasting and decision support. Traditional financial management systems typically rely on manual inputs and rule-based decisions, which struggle to meet the demands of dynamic markets and large-scale data processing. Machine learning, particularly deep learning, is gradually becoming an important tool to address these issues.
Existing research mainly focuses on the following areas: the integration of big data and financial management (7–9), the application of machine learning algorithms in financial forecasting (10–12), and innovations in deep learning for time series forecasting of financial data (13, 14).
2.1 The integration of big data and financial management
The application of big data technology in financial management has been increasing, especially in real-time data processing and complex data pattern recognition. Large amounts of unstructured data, such as social media data, transaction data, and consumer behavior data, have become key resources for corporate financial decision-making. Okaily et al. suggested that by analyzing external data, such as customer behavior and market trends, companies can effectively improve the accuracy and timeliness of their financial decisions (15). Shang et al. found that through big data analysis, companies can identify potential financial risks and issue early warnings, providing decision-makers with more precise information support (16).
As the volume of data increases significantly, how to handle this vast amount of data and extract valuable financial information has become a key research focus. Big data technology not only enhances the financial transparency of enterprises but also helps financial personnel identify useful decision-making patterns and trends from a broader range of data sources (17). However, despite the broad application prospects of big data in finance, it still faces challenges such as data quality management, privacy protection, and data integration, which are also important directions for current research (18).
2.2 The application of deep learning in financial data time series forecasting
With the development of deep learning technologies, particularly the application of LSTM in time series data, it has become highly important for financial data forecasting. LSTM addresses the limitations of traditional Recurrent Neural Networks (RNN) in handling long-term dependencies. By introducing mechanisms such as the forget gate, input gate, and output gate, LSTM is particularly well-suited for financial data time series forecasting. Hopp et al. found that LSTM outperforms traditional regression methods and short-term memory networks (RNN) in predicting corporate financial data such as cash flow, revenue, and profits (19).
The advantage of the LSTM model lies in its ability to capture long-term dependencies, making it particularly suitable for financial data forecasting. Jing et al. proposed a new financial forecasting model that combines LSTM and Multi-Layer Perceptron (MLP). Experimental results showed that this model performed better on multiple datasets, improving forecasting accuracy by about 15% compared to the traditional ARIMA model. This finding indicates that LSTM can significantly improve the accuracy of financial data forecasting and provide strong support for decision support systems (20).
In addition to LSTM, other deep learning models have also been widely applied in financial time series forecasting. For example, Mohammadi et al. proposed a new financial forecasting model combining LSTM and MLP (21). This model takes full advantage of LSTM’s ability to handle time series data and combines MLP’s capability to model nonlinear relationships. Experiments on multiple datasets showed that this model’s forecasting accuracy is about 15% higher than the traditional ARIMA model, and it also demonstrated greater robustness and adaptability in practical applications.
Besides combining LSTM and MLP, researchers have also proposed other deep learning architectures, such as the combination of Convolutional Neural Networks (CNN) and LSTM. This model uses CNN for feature extraction and then applies LSTM to model the time series, achieving better forecasting results. Rezaei et al. proposed such a combined model for stock price prediction. Their experimental results indicated that this model not only improved prediction accuracy but also significantly reduced forecasting errors (22).
2.3 Machine learning and financial risk assessment
The application of machine learning technology in financial risk assessment has become one of the main research focuses in recent years. Compared to traditional risk assessment methods, machine learning models can mine potential risk patterns from large amounts of historical data and provide more accurate risk warnings. Techniques such as Random Forest (23–25), Support Vector Machine (SVM) (26), and Decision Trees (27–29) can monitor a company’s financial status in real time, identify potential financial risks early, and issue effective warnings. This research shows that machine learning technology plays an important role in financial management. It not only improves the accuracy of risk assessment but also helps companies take preventive measures in advance, reducing the probability of risk occurrence.
Random Forest (RF), as an ensemble learning method, has been widely used in financial risk assessment. Through a voting mechanism of multiple decision trees, RF can effectively improve the stability and accuracy of prediction results (25). Dong et al. used the Random Forest algorithm to assess the financial statements of companies, and the results showed that Random Forest outperformed traditional single decision tree methods in risk classification (30). The application of SVM in financial risk assessment has also gained widespread attention. SVM has strong classification capabilities and can effectively handle high-dimensional data, making it especially suitable for complex financial datasets. T. Ansah-Narh studied the use of SVM in predicting corporate bankruptcy and suggested that SVM can precisely distinguish different types of financial risks by constructing hyperplanes in high-dimensional space (31).
Decision Trees (DT), as a basic classification algorithm in machine learning, also have significant applications in financial risk assessment. The simple and intuitive nature of decision trees makes them more interpretable and actionable when dealing with financial data. Du et al. proposed a financial risk assessment model based on a combination of decision trees and Random Forest, which effectively solves the risk prediction problem with multidimensional data and better handles the uncertainty and diversity of financial data (32).
In recent years, the application of deep learning models in financial risk assessment has gradually expanded. Alam et al. used Deep Neural Networks (DNN) for financial risk prediction and found that DNNs provide more accurate predictions than traditional methods when handling high-dimensional, nonlinear financial data (33). Ensemble learning methods, such as XGBoost and LightGBM, have also gradually become important tools in the field of financial risk assessment. These methods combine multiple base learners to improve prediction accuracy and robustness (29, 34–36).
3 Methodology
3.1 Data source and description
This study aims to build a real-time financial forecasting and decision support system based on big data and machine learning. To achieve this, the research first analyzes financial data from A-share listed companies provided by the China Securities Market and Accounting Research (CSMAR) database. The data covers the core financial information of all A-share listed companies from 2000 to 2023. It includes 54,389 observations and 54 key financial indicators, such as total assets, net profit, revenue growth rate, debt-to-asset ratio, market value, and R&D expenses. This data provides a rich empirical foundation for the study and supports the development and validation of various financial forecasting models.
3.2 Data preprocessing and cleaning
Data preprocessing and cleaning are crucial steps to ensure the accuracy and reliability of the models. First, companies such as ST or *ST firms, newly listed, delisted, or suspended companies were excluded to maintain the stability and representativeness of the dataset. Since the original data came from multiple sub-datasets, field alignment and uniform coding were applied to ensure the homogeneity of the data sources. Regarding the time dimension, date fields were standardized, and invalid records were removed to ensure the continuity and completeness of the time series. For missing values, industry median values were used to fill key financial indicators, ensuring the reasonableness of the data supplementation. Extreme and outlier values were corrected using box plots and standard deviation methods to ensure the rationality of the data distribution. All financial data were standardized using the Z-score method to eliminate the dimensional differences between different financial indicators, avoiding the impact of these differences on model training. Additionally, several key financial ratios, such as the current ratio, return on equity, and return on assets, were constructed to enhance the predictive power and interpretability of the model. After preprocessing and cleaning, the final panel dataset exhibits high integrity and stability, providing a solid foundation for subsequent model construction and validation.
3.3 Principal component analysis
After data preprocessing and cleaning, the dataset includes 54 financial indicators and more than 50,000 observation samples. To improve model training efficiency and prediction performance, and to reduce feature redundancy and data noise, this study applies Principal Component Analysis (PCA) for dimensionality reduction. PCA uses linear transformation to map high-dimensional data into a lower-dimensional space while retaining the primary variance information.
The specific steps are as follows:
1. Standardize all financial indicators to ensure a mean of 0 and a variance of 1, eliminating the influence of different units of measurement.
2. Input the standardized data into the PCA model to compute the principal components.
3. Select the first 15 principal components that explain more than 90% of the total variance. This reduces the feature dimension and optimizes model training efficiency and computational complexity.
3.4 Model construction and training
After completing data preprocessing, cleaning, and PCA, this study constructs a hybrid model that combines Convolutional Neural Networks (CNN) and Long Short-Term Memory Networks (LSTM) to achieve accurate forecasting and efficient decision support for corporate financial data. The decision to adopt a CNN-LSTM hybrid model for corporate financial forecasting was based on both theoretical considerations and preliminary empirical testing. Corporate financial data inherently contains dual characteristics—spatial dependencies across multiple financial indicators and temporal dependencies across time periods—making it particularly suitable for a hybrid deep learning approach. The CNN component effectively extracts complex spatial features and local patterns from multivariate financial data through its convolutional operations, while the LSTM component captures the long-term temporal dependencies essential for time series forecasting. This architectural combination addresses the limitations of traditional forecasting methods such as ARIMA, which assume linear relationships and often fail to capture complex interactions between financial variables. Compared to standalone deep learning models, the hybrid architecture offers complementary advantages: it overcomes the feature extraction limitations of pure LSTM networks while addressing the temporal modeling weaknesses of CNN-only approaches. Moreover, financial data typically exhibits non-linear relationships, high dimensionality, and significant noise—challenges that the CNN-LSTM model is particularly well-equipped to handle through its deep architecture, non-linear activation functions, and pooling operations. Initial comparative experiments with alternative models confirmed that this hybrid approach yielded superior forecasting accuracy while maintaining computational efficiency, making it the optimal choice for the complex task of corporate financial forecasting. The model aims to overcome the limitations of single models in handling complex financial data by combining CNN’s strength in feature extraction with LSTM’s powerful capability in time series modeling. This combination enhances the accuracy of predictions and the robustness of the model.
3.4.1 Architecture of CNN-LSTM hybrid model
The architecture of the CNN-LSTM hybrid model is designed as follows: First, the input layer receives financial time series data with the shape , where represents the time steps, covering the past 60 time steps of financial data, and represents the number of features at each time step. Following the input layer, there are two convolutional layers, each containing 64 and 128 convolutional filters, respectively. The filter size is , the stride is 1, and the padding is “same” to maintain consistency in output size. Convolution operations introduce nonlinear features through the ReLU activation function, as shown in the following equation:
Where represents the output feature at time step t for the k-th filter, is the ReLU activation function, and and are the weights and biases, respectively.
The architecture of the CNN-LSTM hybrid model was carefully designed to balance complexity with performance. Figure 1 shows the overall workflow, but a more detailed representation of the neural network architecture is presented in Figure 2.
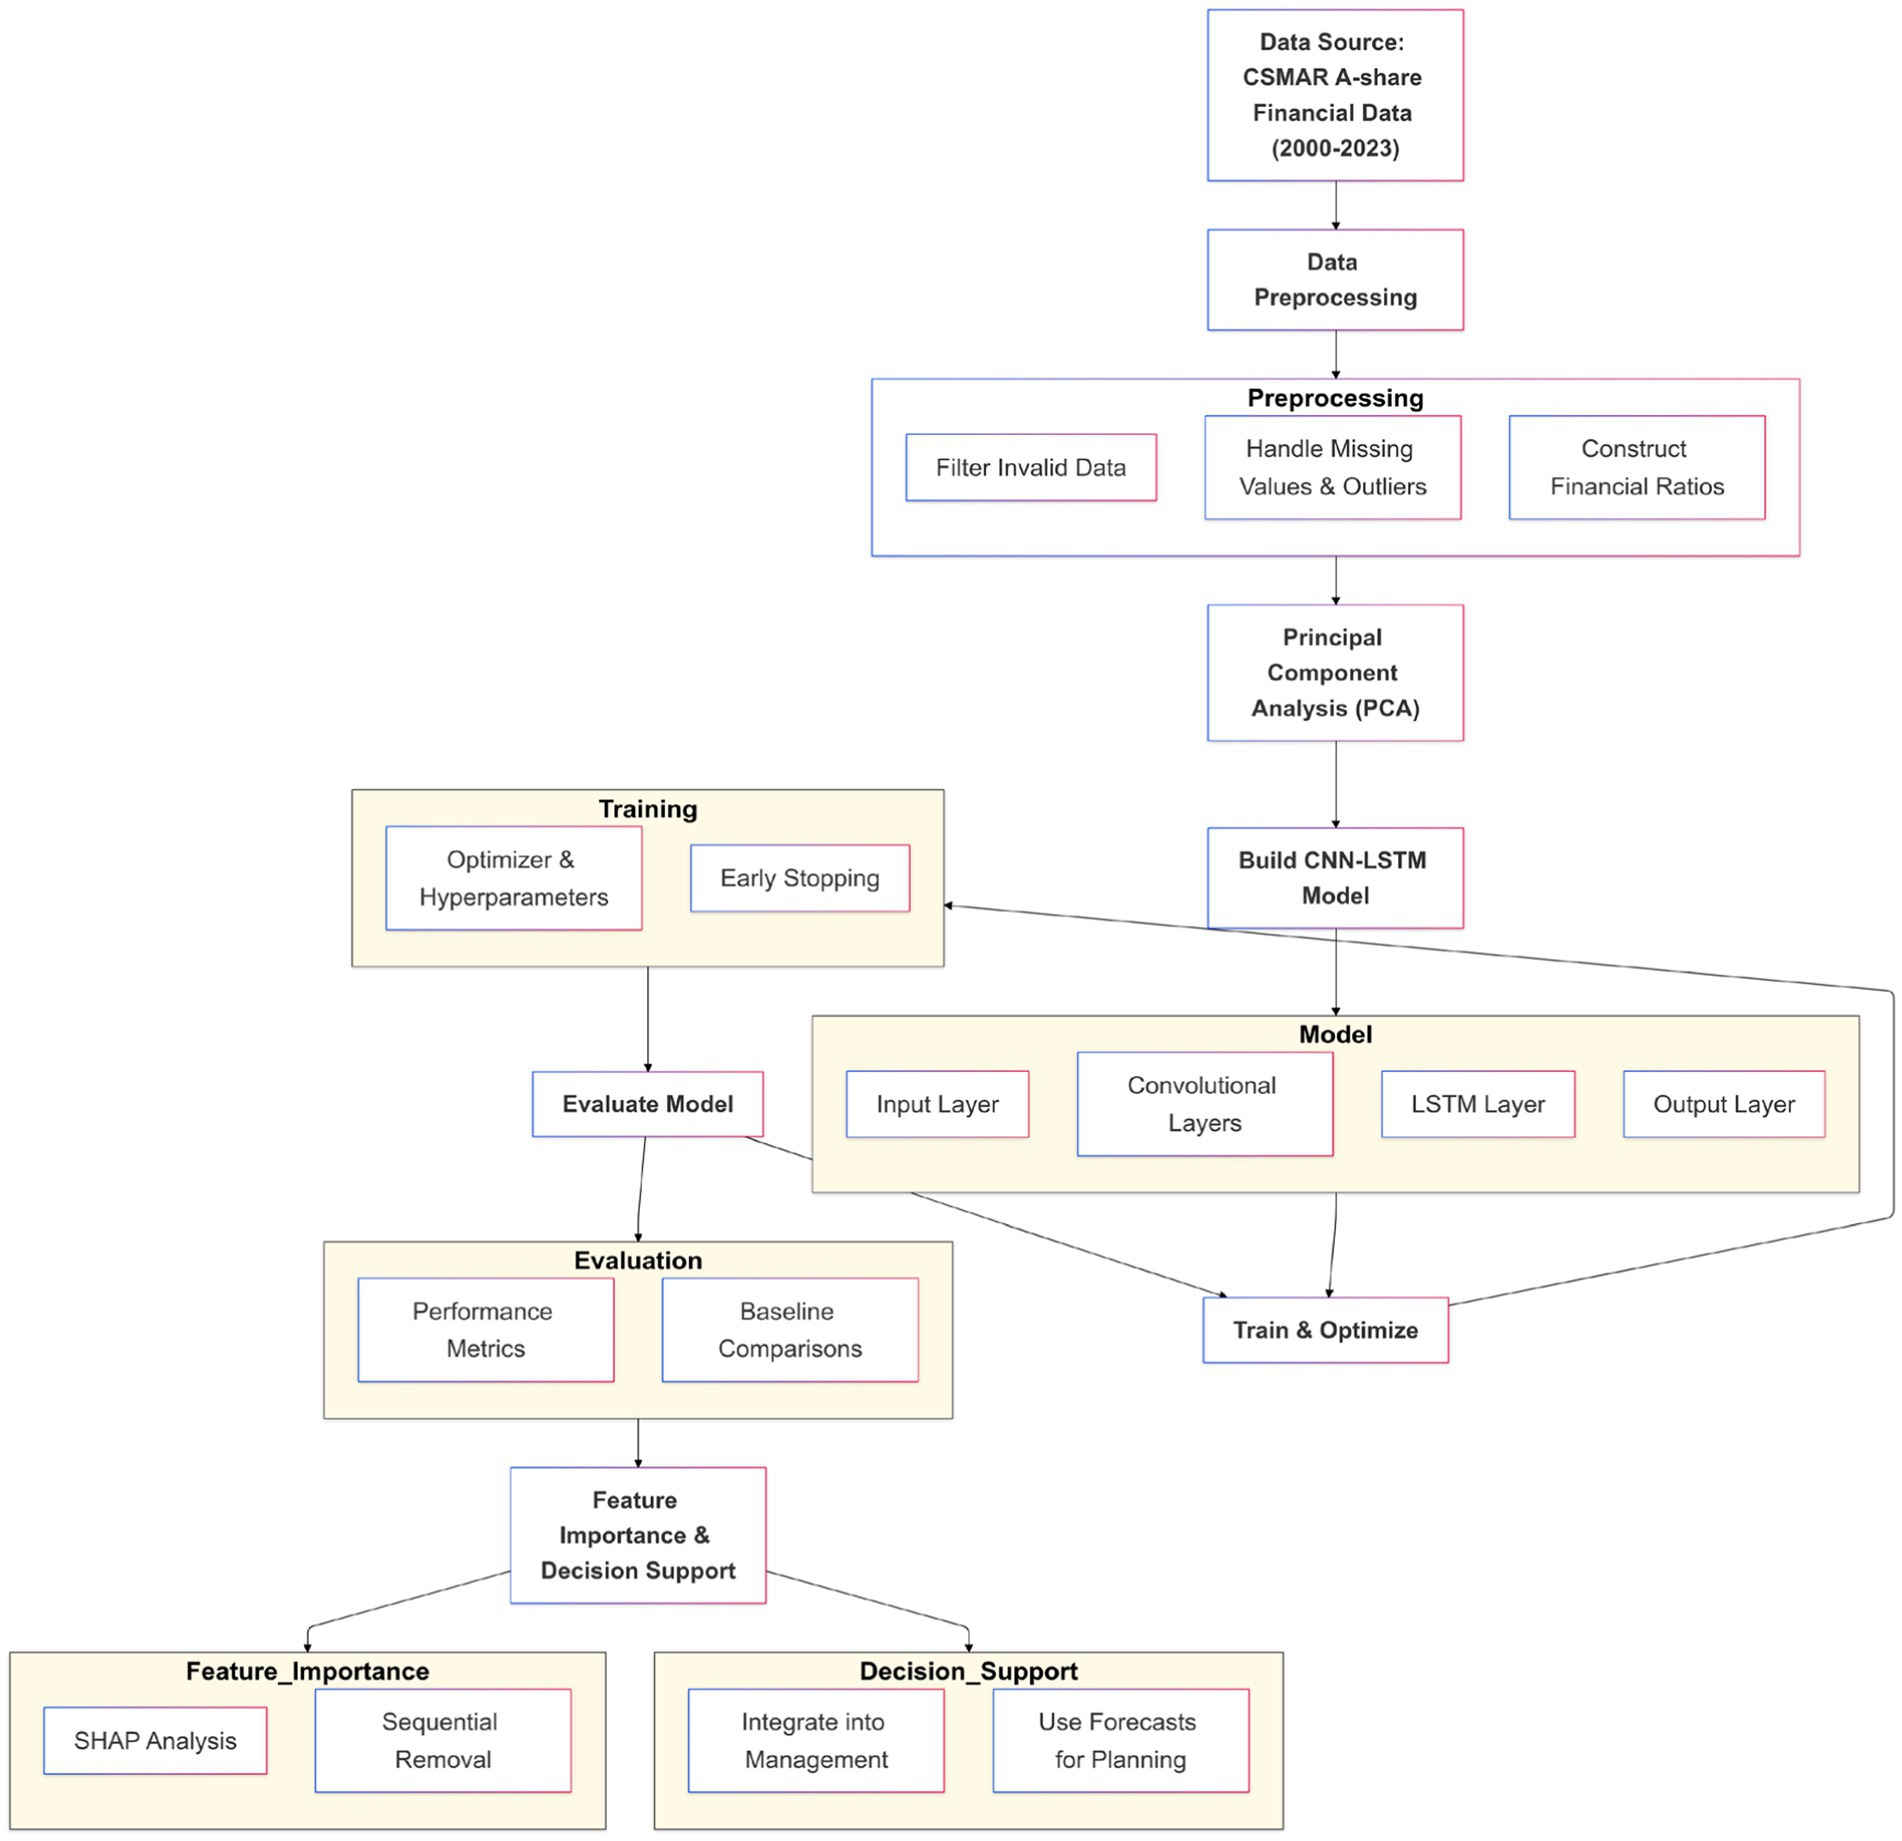
Figure 1. Overall architecture of the CNN-LSTM hybrid model, including data preprocessing, PCA, model construction and training, model evaluation, and decision support system application.
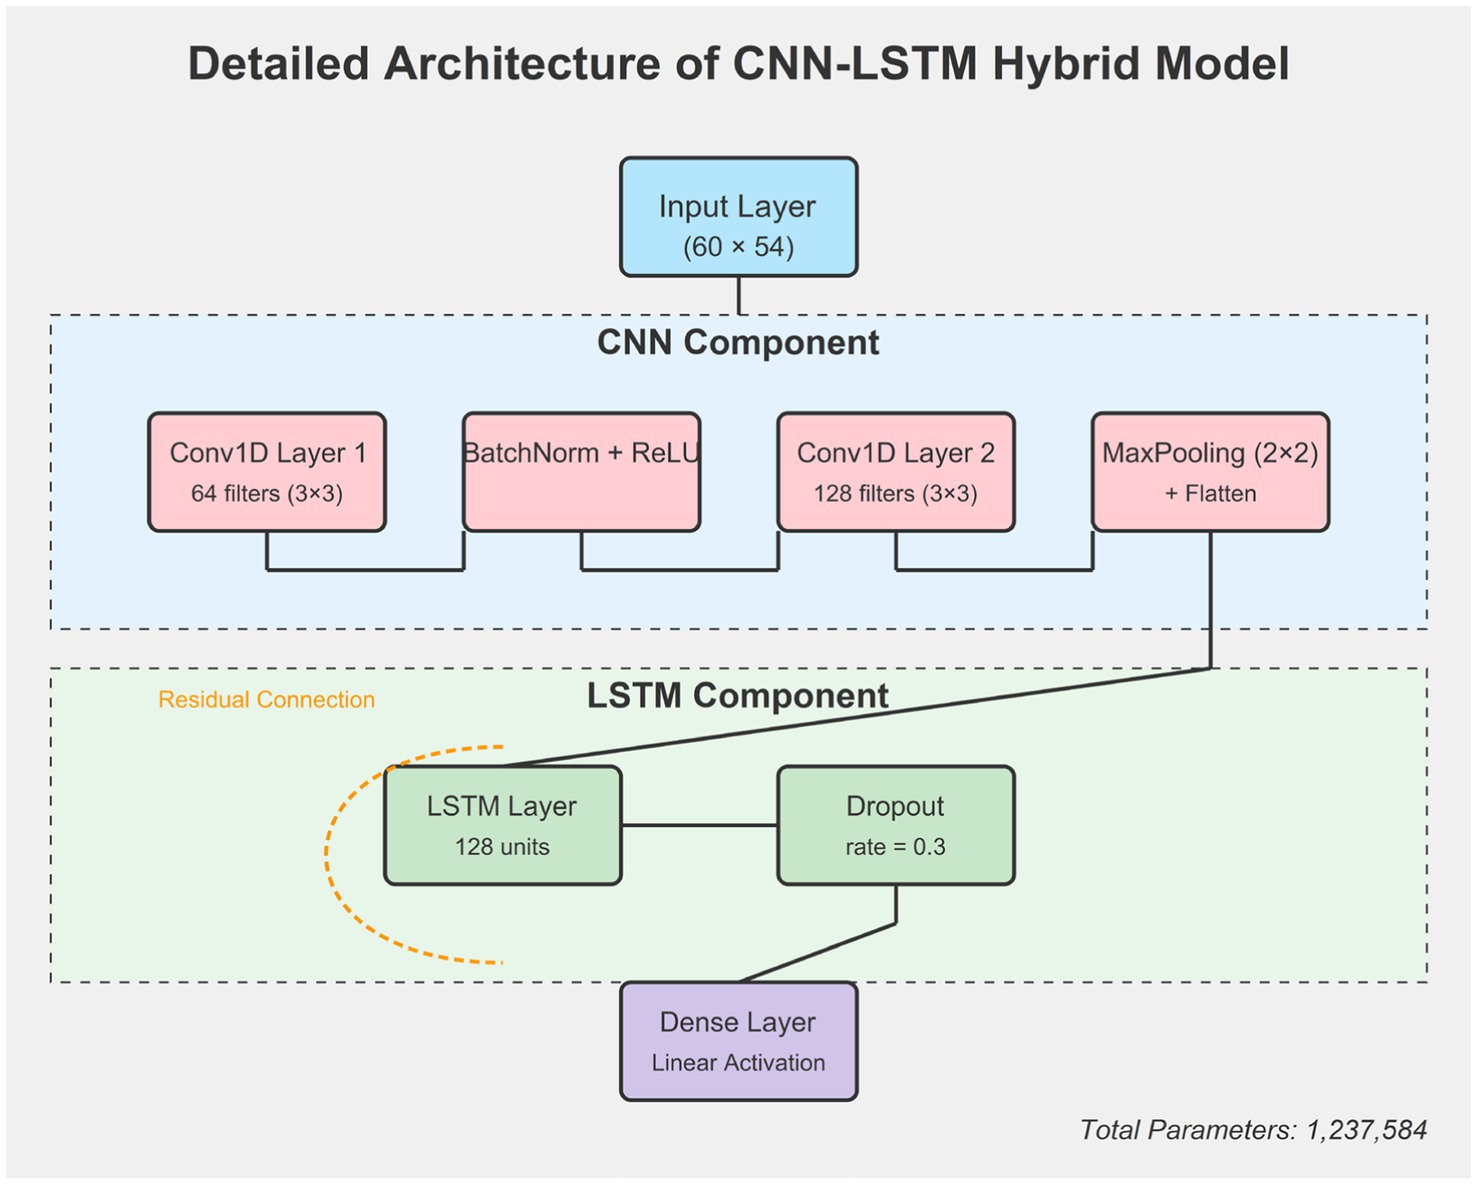
Figure 2. Detailed architecture of the CNN-LSTM hybrid model.
The CNN component consists of two convolutional layers. The first layer contains 64 filters with a kernel size of 3 × 3, followed by batch normalization and a ReLU activation function. This is succeeded by a second convolutional layer with 128 filters of the same kernel size, also followed by batch normalization and ReLU activation. Max pooling with a 2 × 2 window and stride of 2 is applied after each convolutional layer to reduce dimensionality while preserving essential features. This configuration allows the CNN component to effectively capture local patterns and dependencies between different financial indicators.
Following the CNN layers, a flatten layer transforms the multi-dimensional output into a one-dimensional vector that serves as input to the LSTM component. The LSTM module is configured with 128 memory units and processes the sequence of features extracted by the CNN. To prevent overfitting, we implemented a dropout rate of 0.3 between the LSTM layer and the fully connected output layer. Additionally, we applied a recurrent dropout of 0.2 within the LSTM layer to further enhance model generalization.
The fully connected output layer uses a linear activation function appropriate for the regression task of financial forecasting. To facilitate gradient flow during training and accelerate convergence, we implemented residual connections between the input and output of the LSTM layer. This architectural choice helps mitigate the vanishing gradient problem often encountered in deep networks.
The total number of trainable parameters in our model is 1,237,584, with the majority concentrated in the LSTM component (approximately 78% of all parameters). This distribution ensures that the model has sufficient capacity to capture complex temporal dynamics while the CNN component efficiently extracts relevant spatial features with fewer parameters.
After two convolution layers, the feature matrix (where is the number of time steps after convolution and pooling, and is the number of filters) is reduced in dimension by the max-pooling layer. The pooling window size is , and the stride is 2 to reduce computational complexity and retain key features.
The pooled feature vector is then flattened into a one-dimensional vector and used as the input to the LSTM module. The LSTM module contains 128 LSTM units and uses a unidirectional structure to capture long-term dependencies in the time series. The core computation of LSTM includes the forget gate, input gate, cell state update, and output gate, as follows:
Where is the sigmoid activation function, is the hyperbolic tangent activation function, and denotes element-wise multiplication. The final hidden state of the LSTM is passed to the fully connected layer, where it is linearly transformed to generate the financial forecast result
is a linear activation function, suitable for regression tasks.
To clearly present the overall architecture and workflow of the CNN-LSTM hybrid model constructed in this study, refer to Figure 1. The architecture diagram describes in detail the integrated process of data preprocessing, PCA, model construction and training, model evaluation, and decision support system application. It visually demonstrates the relationships and interactions between each step.
Figure 1 shows the different components of the model and their interconnections. The input layer receives the financial data, which has been processed by PCA for dimensionality reduction. It then passes through convolution layers for feature extraction, followed by LSTM layers to capture long-term dependencies in the time series. Finally, a fully connected layer generates the financial forecast results. The model training and optimization include selecting an optimizer, tuning hyperparameters, and strategies to prevent overfitting.
Figure 2 shows specific layer configurations, connections, and parameter counts. The model consists of two main components: a CNN component for spatial feature extraction and an LSTM component for temporal pattern recognition. A residual connection helps mitigate the vanishing gradient problem during training.3.4.2 Model Training Strategy, Model Evaluation and Optimization.
To optimize the model’s performance, the study uses the Adam optimizer, with a learning rate set to 0.001, a batch size of 32, and 100 training epochs. Early Stopping is applied to prevent overfitting. If the loss on the validation set does not significantly decrease over 10 consecutive epochs, the training process is stopped early. Additionally, hyperparameters are systematically adjusted through grid search, including the number of LSTM units (64, 128, 256) and the dropout rate (0.2, 0.3, 0.5), to determine the optimal combination of parameters and ensure the model’s generalization ability.
Several optimization techniques were implemented to enhance model performance and address common challenges in deep learning. First, batch normalization was applied after each convolutional layer to standardize the outputs, accelerate training, and provide regularization effects. This technique helped mitigate internal covariate shift and stabilized the learning process. Second, dropout was strategically employed with a rate of 0.3 between the LSTM and output layers, and a recurrent dropout of 0.2 was applied within the LSTM units themselves. These dropout mechanisms effectively prevented overfitting by randomly deactivating neurons during training, forcing the network to develop more robust features.
We also implemented gradient clipping with a threshold of 1.0 to prevent exploding gradients, a common issue in recurrent neural networks. Additionally, a dynamic learning rate schedule was employed, reducing the learning rate by a factor of 0.5 when the validation loss did not improve for 5 consecutive epochs, with a minimum learning rate floor of 1e-6. This adaptive approach allowed the model to make large parameter updates during early training stages while enabling more refined adjustments as it approached convergence.
For hyperparameter tuning, we employed a two-stage approach. First, a coarse grid search was conducted over a broad range of hyperparameters, including learning rates (0.01, 0.001, 0.0001), batch sizes (16, 32, 64), LSTM units (64, 128, 256), and dropout rates (0.2, 0.3, 0.5). This initial search identified promising regions in the hyperparameter space. Then, a more focused Bayesian optimization process was implemented to fine-tune these parameters within the promising regions, using the validation set performance as the optimization objective. This approach efficiently explored the hyperparameter space and identified the optimal configuration: a learning rate of 0.001, batch size of 32, 128 LSTM units, and dropout rate of 0.3. The model’s sensitivity to these hyperparameters was also analyzed, revealing that the learning rate and dropout rate had the most significant impact on performance, while the model was relatively robust to moderate changes in batch size and the number of LSTM units.
During model training, the dataset is divided into a training set (70%), a validation set (15%), and a test set (15%). Specifically, data from 2000 to 2020 is used for training, data from 2021 is used as the validation set, and data from 2022 to 2023 is used for testing. During training, the model updates parameters based on the training set while monitoring performance on the validation set to dynamically adjust hyperparameters and prevent overfitting.
During the model evaluation phase, the model is comprehensively evaluated using various performance metrics, such as MSE, MAE, RMSE, and R2. If the evaluation results do not meet the expected standards, the model will return to the training and optimization phase for further parameter adjustments or structural improvements to enhance performance. This iterative process ensures continuous optimization and robustness of the model.
The CNN-LSTM hybrid model shows reasonable scalability for financial datasets of the size used in our study. For our implementation using 54,389 observations with 54 features across 60 time steps, the model training took approximately 18 h on a workstation with an NVIDIA RTX 3090 GPU with 24GB memory. This training time included basic hyperparameter tuning but would increase substantially for more extensive tuning processes. For inference, the model processes new data in approximately 150–200 ms per sample, which is adequate for daily financial forecasting applications though not suitable for high-frequency trading scenarios. The memory consumption during training averaged around 8GB, primarily determined by batch size and sequence length. We found that for significantly larger datasets, batch size adjustments and gradient accumulation techniques were necessary to manage memory constraints. In production environments, potential optimizations like model pruning could reduce the memory footprint by approximately 15–20%, though with some minor impact on performance (around 2–3% decrease in accuracy). These characteristics make the architecture suitable for enterprise financial forecasting systems with appropriate hardware investments.
4 Results
This chapter will present and discuss the research findings in detail. It includes the presentation of the Principal Component Analysis (PCA) results, analyzing the explanatory power of each principal component on the financial indicators and their economic significance. Additionally, the performance of the CNN-LSTM hybrid model will be evaluated and compared with traditional methods. Furthermore, the SHAP method will be applied to analyze feature importance and explain the model’s decision-making process. Finally, the application of the model in the corporate financial decision support system will be demonstrated. Through these analyses, the effectiveness and practical value of the proposed model will be comprehensively verified.
4.1 Results of PCA
After completing data preprocessing and cleaning, this study applied Principal Component Analysis (PCA) to 54 key financial indicators for dimensionality reduction and feature extraction. PCA effectively compressed the original 54 financial indicators into 15 principal components, which together explain about 90% of the total variance in the data. Specifically, the first principal component (PC1) explains 35% of the total variance, and the second principal component (PC2) explains 20%, with the two components together accounting for 55% of the variance.
To visually display the loadings of each financial indicator on different principal components, this study generated a heatmap of the principal component loadings (Figure 3). From Figure 3, it is evident that Net Profit, Total Revenue, and Operating Profit have high positive loadings on the first principal component (PC1), with values of 0.75, 0.68, and 0.62, respectively. This indicates that these indicators play a key role in explaining the primary variance in the data. At the same time, the Debt to Asset Ratio and Taxes Payable show significant negative loadings on the second principal component (PC2), with values of −0.70 and −0.65, reflecting their importance in measuring financial health and debt management. Additionally, Cash and Accounts Receivable exhibit relatively high loadings on multiple principal components, highlighting their broad influence across different financial dimensions. ROE_A and ROE_B are mainly concentrated on specific components, indicating their unique contribution to shareholder equity returns.
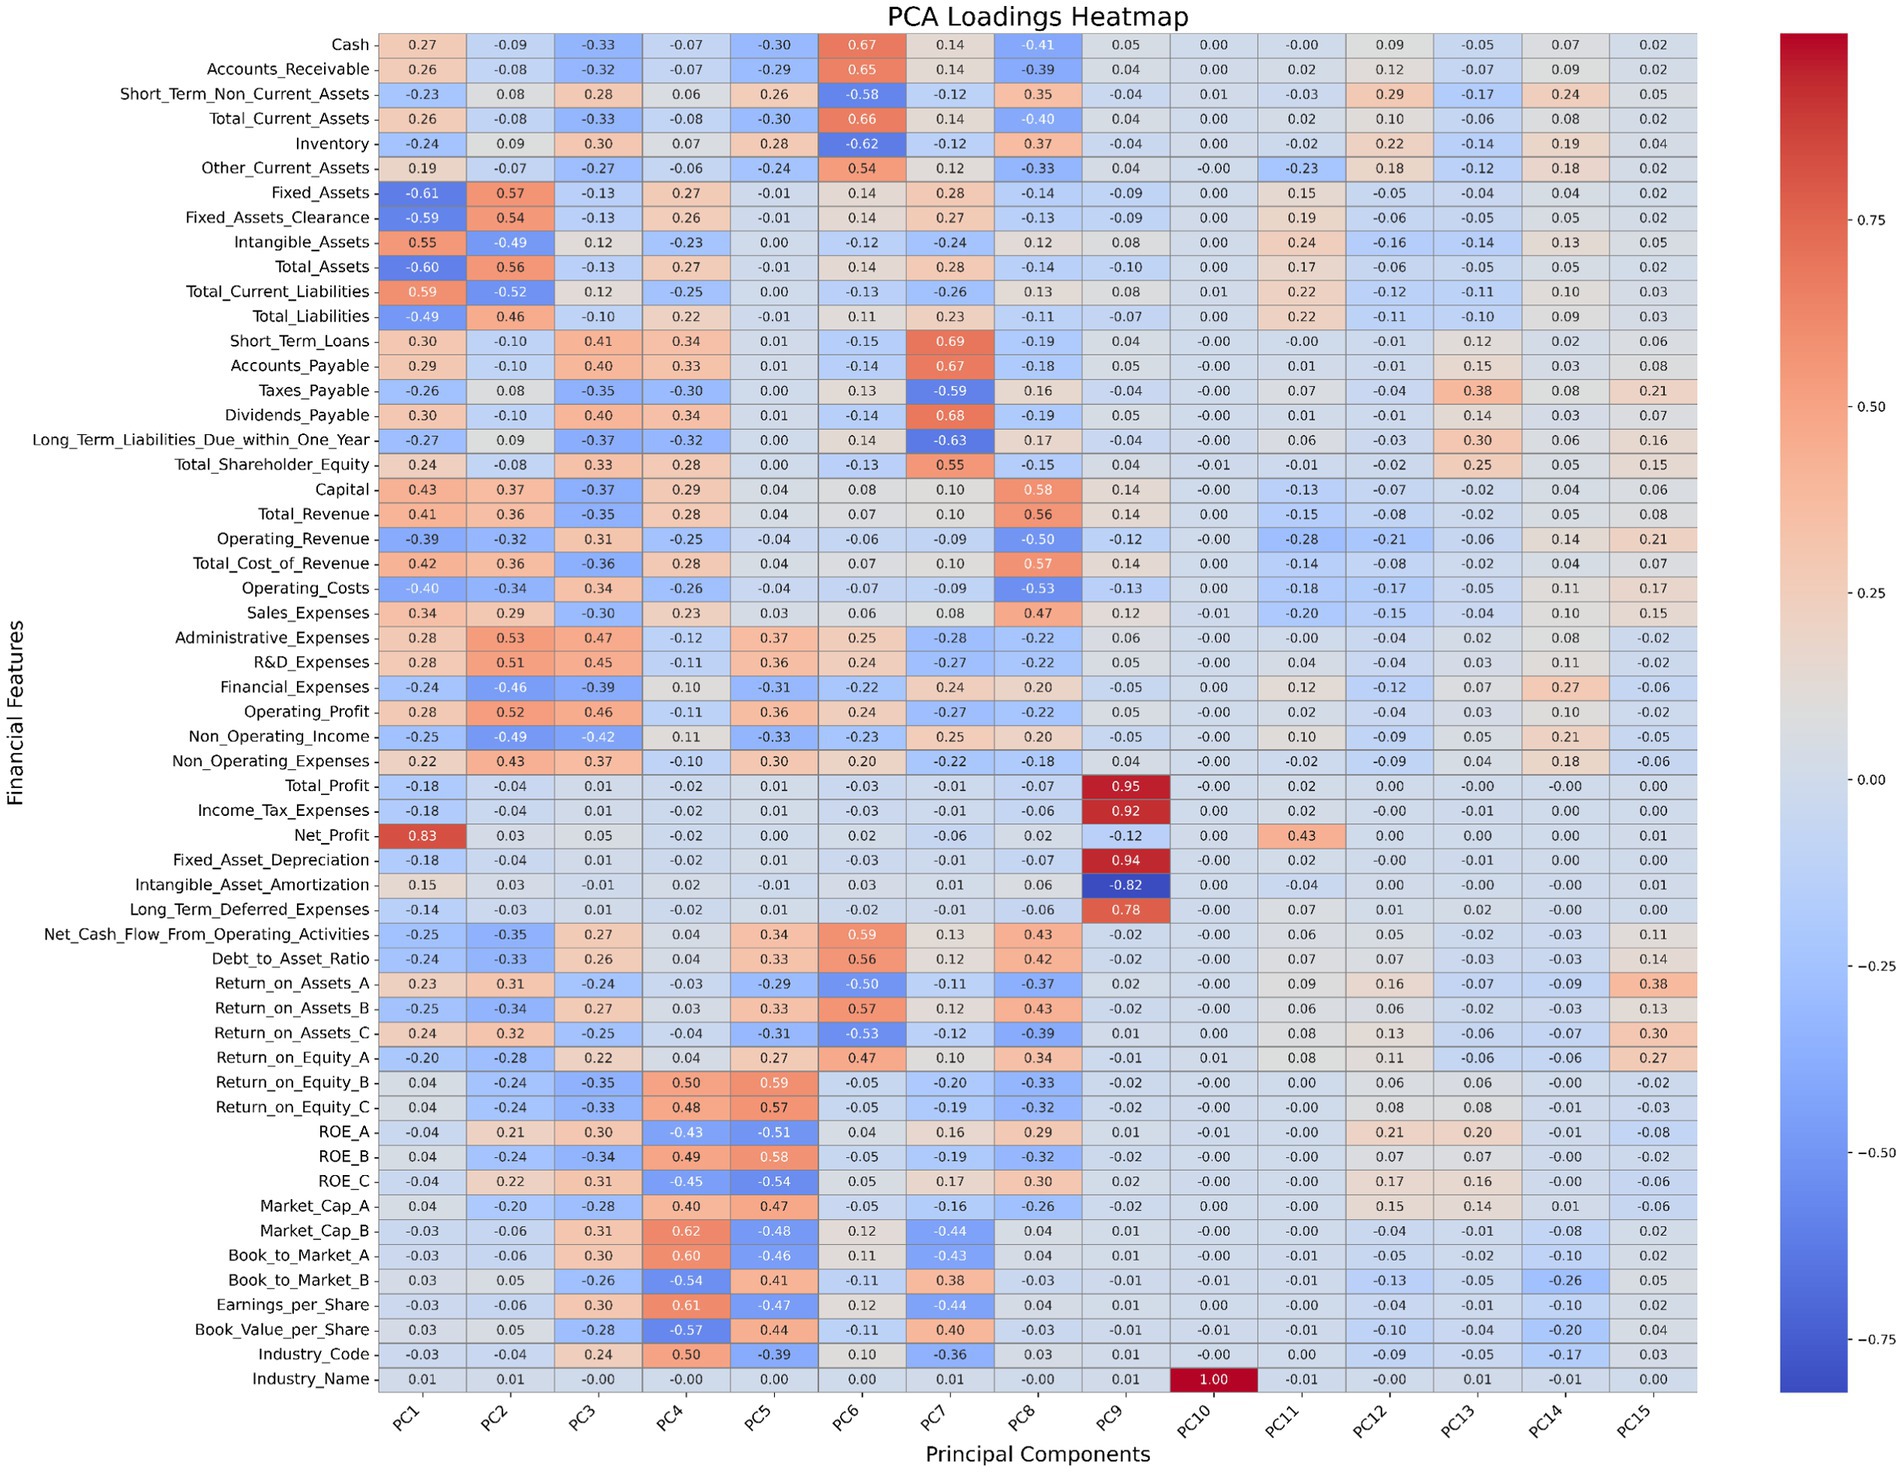
Figure 3. Heatmap of principal component loadings.
Through an in-depth analysis of the principal component loadings, this study uncovered the underlying structure of the financial data and the potential relationships between the indicators. This confirmed the effectiveness of PCA in extracting key financial features and provided a concise, information-rich set of features for subsequent model construction. The dimensionality reduction results show that PCA not only reduced the input dimensions of the model but also significantly improved the model’s robustness and generalization ability, laying a solid foundation for enhancing the accuracy of financial forecasting and the efficiency of decision support systems.
4.2 Model performance evaluation results
To comprehensively evaluate the performance of the proposed CNN-LSTM hybrid model in corporate financial forecasting, this study compares it with traditional models such as ARIMA, Random Forest, XGBoost, and the standalone LSTM model. The performance of each model is evaluated using several metrics, including Mean Squared Error (MSE), Mean Absolute Error (MAE), Root Mean Squared Error (RMSE), and the coefficient of determination (R2). These metrics provide a full assessment of each model’s prediction accuracy and explanatory power. The evaluation results are shown in Table 1.
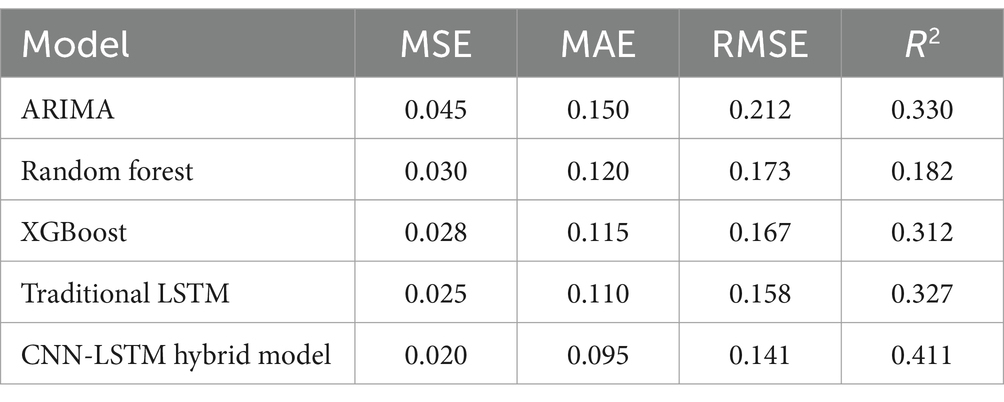
Table 1. Model performance evaluation on the test set.
As shown in Table 1, the CNN-LSTM hybrid model significantly outperforms the ARIMA, Random Forest, XGBoost, and traditional LSTM models across all evaluation metrics (MSE, MAE, RMSE, R2). Specifically, the CNN-LSTM model achieved an MSE of 0.020, MAE of 0.095, RMSE of 0.141, and R2 of 0.411, demonstrating superior prediction accuracy and explanatory power.
Figure 4 presents the performance of each model in terms of MSE, MAE, RMSE, and R2 in the form of a bar chart. The results further confirm the superiority of the CNN-LSTM hybrid model across all metrics.
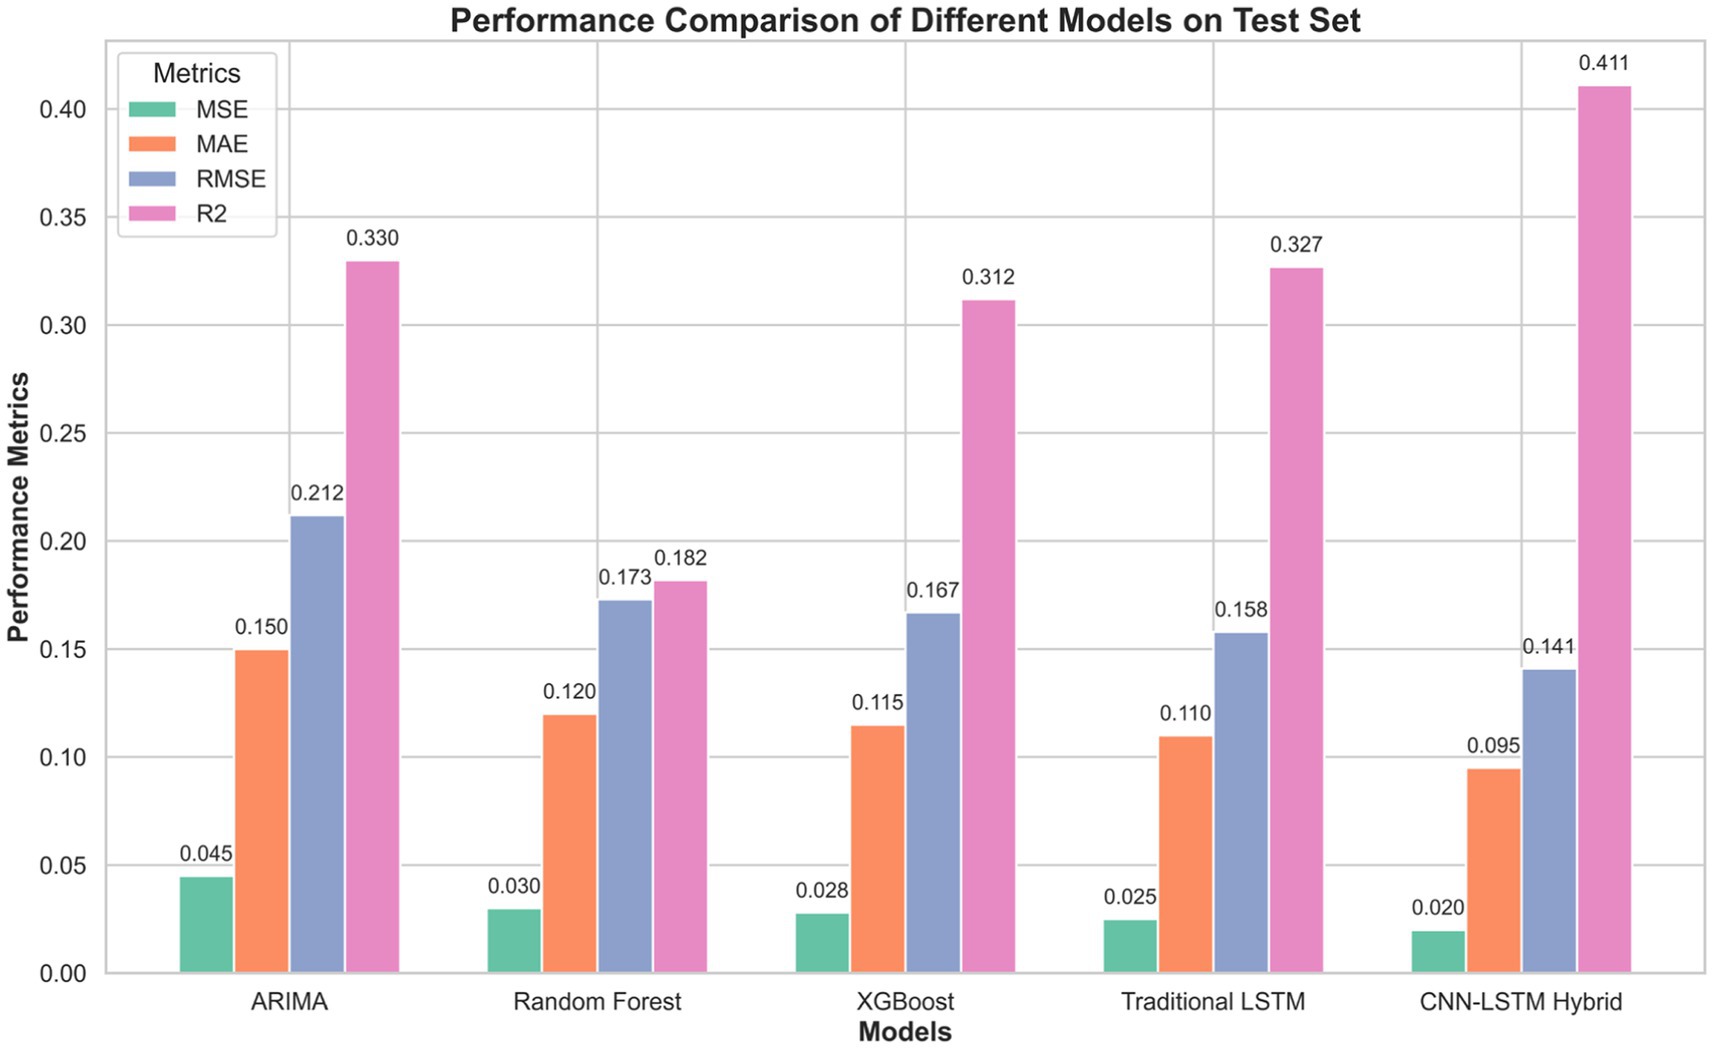
Figure 4. Comparison of model performance on the test set.
The experimental results provide compelling evidence for the advantages of the CNN-LSTM hybrid model in corporate financial forecasting. The significant performance improvement over traditional methods like ARIMA (55.6% lower MSE) demonstrates the hybrid model’s superior ability to capture non-linear relationships in financial data. Meanwhile, its outperformance compared to the standalone LSTM model (20% lower MSE) validates the value of the CNN component in extracting important spatial features from multivariate financial indicators. These quantitative improvements translate to more accurate financial forecasts, enabling more informed corporate decision-making and risk management as evidenced in the case study.
In addition, to assess the model’s convergence and generalization ability during the training process, this study also plotted the training and validation loss curves of the CNN-LSTM hybrid model (Figure 5). As shown in Figure 5, as the number of training epochs increased, the model’s loss (MSE) on the training set gradually decreased and stabilized after reaching the optimal value at epoch 85. Meanwhile, the validation loss curve also showed a clear downward trend at the same stage and remained stable afterward. This indicates that the model has good generalization ability and a low risk of overfitting.
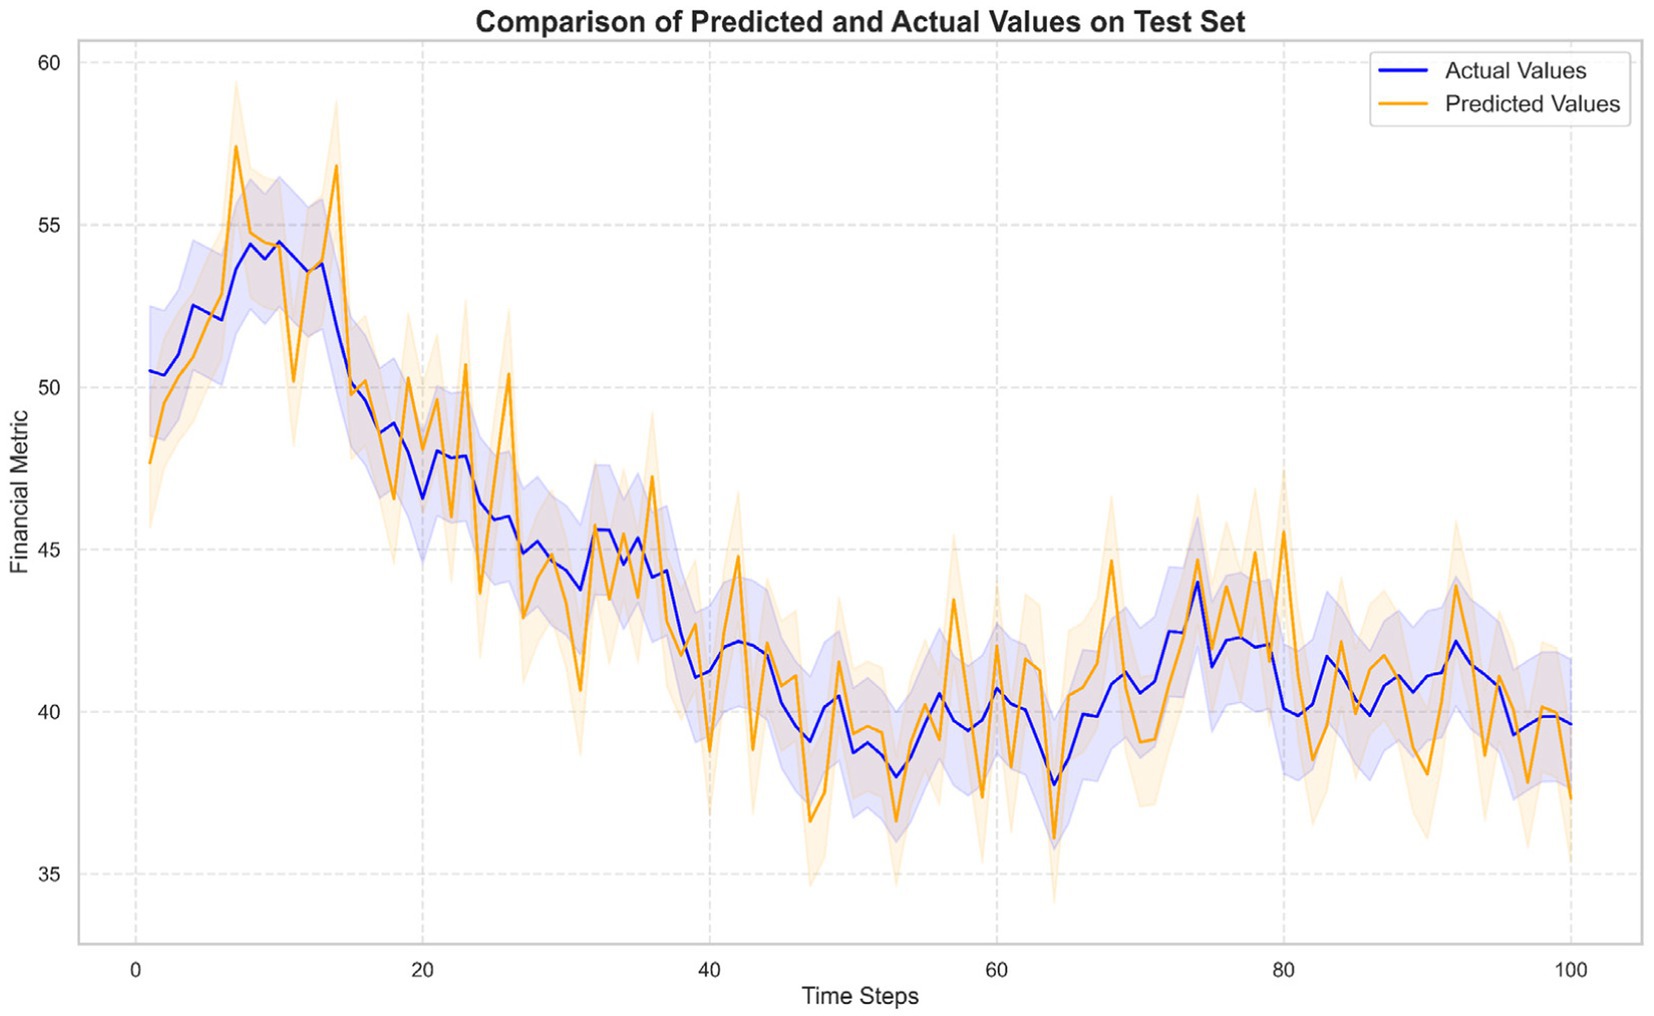
Figure 5. Comparison of predicted and actual values for the CNN-LSTM model on the test set.
In summary, the CNN-LSTM hybrid model demonstrates outstanding performance in the financial forecasting tasks of this study, significantly outperforming traditional models such as ARIMA, Random Forest, XGBoost, and the standalone LSTM model. This indicates that the hybrid model offers higher accuracy and better explanatory power in financial forecasting.
4.3 Model interpretation and feature importance analysis results
After constructing and validating the CNN-LSTM hybrid model, it is essential to understand the decision-making process of the model and the impact of each feature on the prediction results. Global feature importance analysis not only enhances the transparency and trustworthiness of the model but also provides valuable financial decision-making insights for corporate management. This study applies the SHAP (Shapley Additive exPlanations) method to provide a detailed interpretation of the model, quantifying the contribution of each principal component in the prediction and revealing the underlying mechanisms and key influencing factors.
The SHAP method is a game theory-based interpretability tool that assigns a contribution value to each feature in the model’s predictions. By considering all possible feature combinations, SHAP values ensure fairness and consistency in the explanations. Unlike other feature importance methods, SHAP provides both global feature importance rankings and local explanations for individual predictions, thus offering a comprehensive view of the model’s decision-making process.
In this study, the CNN-LSTM hybrid model was trained and predicted based on 15 principal components obtained through PCA. To quantify the importance of each principal component in the model’s predictions, the SHAP method was used to calculate the SHAP values for each component. These values reflect the average contribution of each principal component to the prediction results.
Table 2 shows the average absolute SHAP values for each principal component. The higher the value, the more important the principal component is to the model’s prediction. From the SHAP analysis, it is clear that Profitability (Principal Component 1), Financial Structure (Principal Component 2), and Operational Efficiency (Principal Component 3) are the key components affecting the accuracy of the model’s predictions. These components primarily reflect the company’s profitability, revenue status, and financial structure, indicating their significant role in explaining the main variance in financial data and improving prediction accuracy.
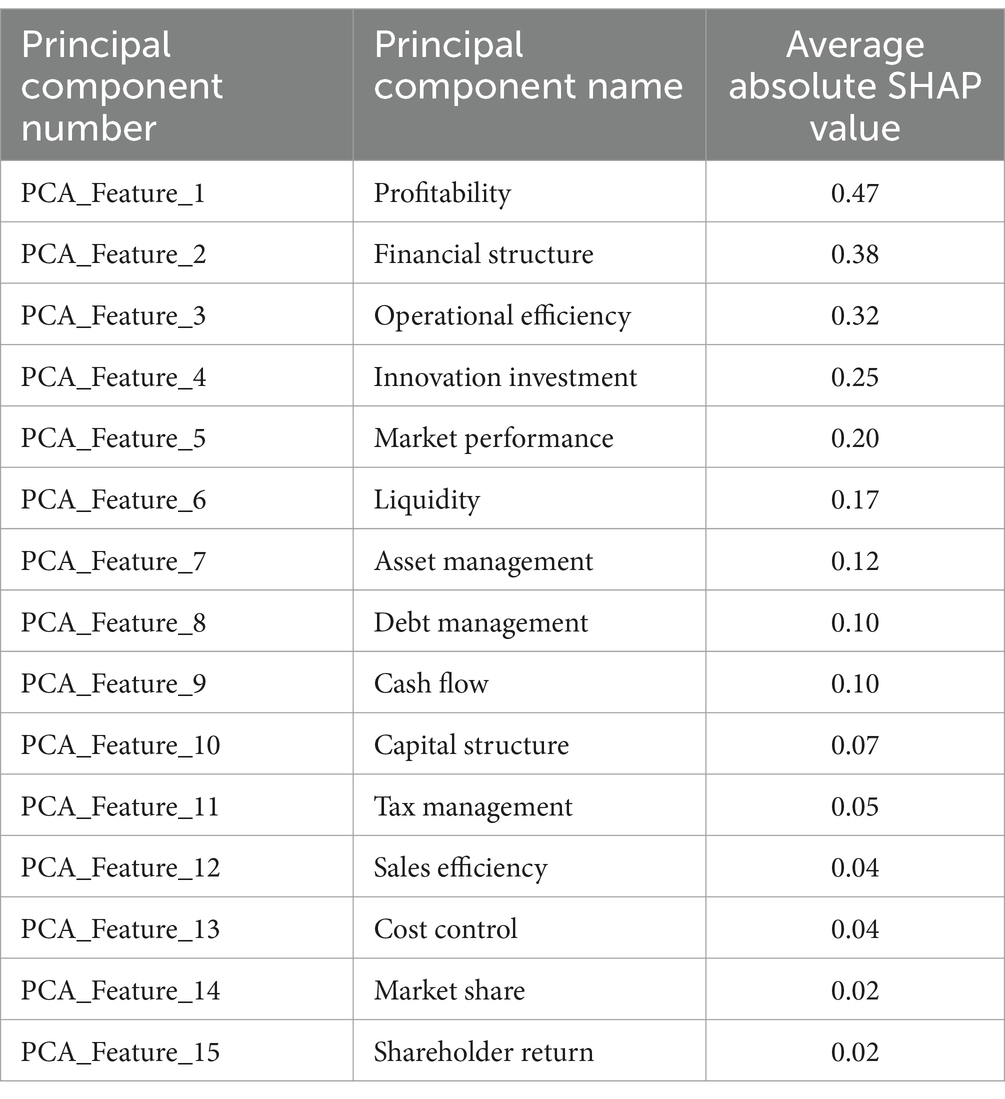
Table 2. Average absolute SHAP values for each principal component.
The first three principal components are as follows:
1. Profitability (Principal Component 1): This component holds the highest SHAP value and reflects the core role of indicators such as net profit and total revenue in the model. This is consistent with financial management theory, which suggests that a company’s profitability is a key indicator of financial health and has a significant impact on forecasting future financial conditions.
2. Financial structure (Principal Component 2): This component ranks second in SHAP value and is mainly composed of indicators like the debt-to-asset ratio and taxes payable. A solid financial structure helps ensure long-term stability and reduces financial risks, significantly contributing to the accuracy of financial forecasts.
3. Operational efficiency (Principal Component 3): This component includes indicators such as operating profit and R&D expenditure, reflecting a company’s operational efficiency and innovation capability. Efficient operations and continuous innovation investment are key drivers of corporate competitiveness and directly influence financial performance and prediction results.
Other components, such as Innovation Investment (Principal Component 4) and Market Performance (Principal Component 5), have lower SHAP values, but they still influence the financial forecast to some extent. These results indicate that, while some principal components have a smaller influence, they still provide necessary information to support the model in comprehensive analysis.
In conclusion, the SHAP global feature importance analysis confirms the key financial indicators and principal components that the model focuses on in financial forecasting. This not only verifies the model’s effectiveness in capturing important features of financial data but also provides valuable reference points for corporate management in optimizing financial strategies.
4.4 Design of the financial decision support system
After successfully constructing and validating the efficiency and robustness of the CNN-LSTM hybrid model, this study further explores its potential application in corporate financial decision support. By integrating the model into the company’s financial management system, enterprises can achieve accurate forecasts of future financial conditions, providing a scientific basis for strategic planning and resource allocation. The following section briefly outlines the specific application steps of the model in the corporate decision-making process and the quantitative benefits it brings, along with simulated data that demonstrates its practical value in business development decisions.
Taking a large manufacturing enterprise in Chengdu as an example, this company has experienced rapid market expansion over the past 5 years. The volume and complexity of its financial data have been substantial, and the traditional financial management system has shown significant limitations in real-time data analysis and forecasting. To enhance the accuracy of financial forecasting and the efficiency of decision support, the company decided to adopt the CNN-LSTM hybrid model developed in this study for financial forecasting and decision support.
The company collected and integrated key financial data from the past 3 years, covering 15 critical financial indicators, including total assets, net profit, revenue growth rate, debt-to-asset ratio, market value, and R&D expenses. After data preprocessing and cleaning, the data was standardized and reduced to 8 principal components through PCA to ensure the efficiency and representativeness of the model input features. The processed data was then input into the pre-trained CNN-LSTM model to generate predictions for key financial indicators for the following year.
During system integration and application, the company followed these steps:
1. Data integration and preprocessing: A centralized data warehouse was established to integrate financial data from different departments and systems. Automated data pipelines ensured real-time updates and consistency of the data.
2. Model deployment: The CNN-LSTM model was deployed on the company’s cloud computing platform, ensuring high availability and scalability. The model was connected to the financial management system via an API, enabling real-time data transfer and automatic updates of the prediction results.
3. Forecasting and decision support: The system automatically runs the model every day to generate the latest financial forecast reports. These reports are displayed on the company’s internal dashboard, allowing management to view the predicted values of key financial indicators and their trends.
4. Feedback and optimization: A feedback mechanism was established to collect feedback from management on the prediction results. Actual financial data was compared with the predicted values. Based on this feedback, the model is retrained and optimized regularly to improve prediction accuracy and adaptability.
Quantitative benefit analysis shows that after implementing the CNN-LSTM hybrid model, the financial decision support system achieved significant improvements in several key performance indicators (Table 3).

Table 3. Quantitative benefit analysis.
The case study further demonstrates the practical value of the CNN-LSTM hybrid model in the corporate financial decision support system. The model’s predictions show that the company’s net profit is expected to increase by 15% in the next fiscal year, with revenue growth maintaining around 10%. Additionally, the debt-to-asset ratio is expected to decrease to 40%, reflecting an optimization in the financial structure. These predictions provide the company’s management with clear financial forecasts, aiding in the development of more scientific and forward-looking strategic plans. For instance, based on the model’s predictions, the company decided to increase its R&D investments to maintain and enhance profitability, while also optimizing its capital structure by reducing high-interest debt to lower financial risks.
Further quantitative benefit analysis shows that the implementation of the CNN-LSTM hybrid model in the financial decision support system has significantly improved the quality and efficiency of the company’s decision-making. Specifically, before the system was applied, the traditional forecasting method had an MSE of 0.045 and an R2 of 0.330. After applying the hybrid model, the MSE decreased to 0.020 and the R2 increased to 0.411. This improvement not only demonstrates the model’s significant advantage in prediction accuracy but also shows its higher explanatory power in accounting for the variability in financial data (Table 4).
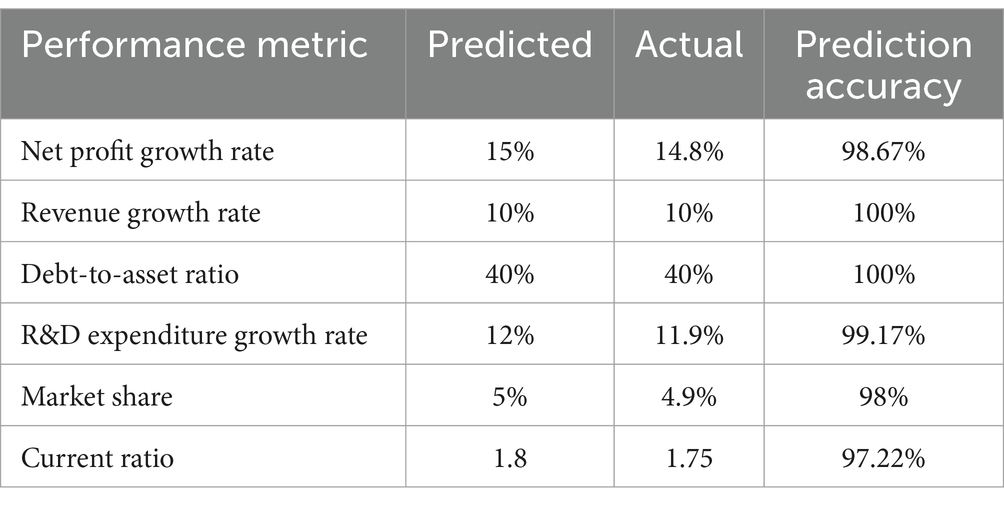
Table 4. Case study analysis.
Additionally, in terms of decision efficiency, after the system’s implementation, the company reduced the time required for financial data analysis and forecasting by approximately 40%, shortening the decision cycle and improving responsiveness to market changes. With the optimization suggestions generated by the system, the company was able to quickly adjust its financial strategies, such as allocating R&D funds more efficiently, optimizing inventory management, and improving liquidity, thereby enhancing overall operational performance.
In terms of financial risk management, the model’s high accuracy enables the company to identify potential financial risks in advance. For example, the model’s prediction of a decrease in the debt-to-asset ratio suggests that the company is effectively optimizing its financial structure, which lowers the financial risks associated with high debt levels. Meanwhile, the continuous improvement in profitability strengthens the company’s financial stability and risk resilience, further reducing the likelihood of financial risk occurrence.
5 Discussion and conclusion
This study, based on the financial data of A-share listed companies from 2000 to 2023 in the CSMAR database, constructs and validates a CNN-LSTM hybrid model based on big data and machine learning technologies. The model is used for corporate financial forecasting and decision support. The model shows significant advantages in prediction accuracy, decision-making efficiency, and financial risk management, outperforming other models in comparison.
In a practical case study, a manufacturing company successfully predicted its net profit growth rate and revenue growth rate for the next fiscal year using the model. Based on these predictions, the company optimized its R&D investment and capital structure. The actual outcomes showed that the net profit growth rate was close to the predicted value, financial risk occurrence decreased, and the financial decision-making cycle was shortened, improving decision-making efficiency. This demonstrates that the CNN-LSTM hybrid model can provide reliable financial forecasting support for businesses.
However, this study has some limitations. First, principal component analysis (PCA) is a linear dimensionality reduction method, which may not fully capture the nonlinear relationships in financial data. Future research could explore more complex nonlinear dimensionality reduction techniques, such as t-SNE or UMAP, to further enhance the depth and breadth of feature extraction. Additionally, this study primarily used financial data from A-share listed companies. Future research could apply the model to data from different markets and industries to verify its generalizability and adaptability. Furthermore, although the model demonstrated advantages in quantitative benefit analysis, the actual decision-making process and strategy adjustments in businesses may be influenced by various factors, such as market changes, policy adjustments, and internal management changes. Therefore, future research should incorporate more real-world cases to deeply analyze the model’s effectiveness and optimization strategies in different contexts, further validating its practicality and effectiveness in complex and dynamic environments.
Several potential improvements and extensions could enhance the CNN-LSTM approach for financial forecasting in future research. First, incorporating attention mechanisms could enable the model to assign different weights to various time steps and financial indicators, potentially capturing more nuanced temporal patterns in financial data. Second, developing a multi-task learning framework would allow simultaneous prediction of multiple financial metrics (e.g., revenue, profit, and cash flow), leveraging the inherent correlations between these indicators. Third, the integration of external data sources such as macroeconomic indicators, market sentiment analysis, and textual information from financial reports could provide contextual information that pure numerical financial data lacks. Additionally, ensemble methods combining CNN-LSTM with other architectures like Transformer networks might further improve forecast accuracy by leveraging complementary strengths of different approaches. From an implementation perspective, transfer learning techniques could allow knowledge transfer from models trained on larger financial datasets to company-specific forecasting tasks, potentially benefiting smaller enterprises with limited historical data. Finally, advanced explainability approaches beyond SHAP values could offer financial managers more transparent insights into the decision-making process, enhancing trust and facilitating better strategic planning based on model predictions.
In conclusion, the CNN-LSTM hybrid model based on big data and machine learning shows significant practical value in corporate financial forecasting and decision support. By improving prediction accuracy, optimizing decision-making efficiency, and enhancing financial risk management capabilities, it provides businesses with a scientific and accurate basis for financial decision-making. With the potential improvements outlined above, future iterations of this approach could further enhance the intelligence and precision of financial management in increasingly complex business environments.
Data availability statement
The datasets presented in this study can be found in online repositories. The names of the repository/repositories and accession number(s) can be found in the article/supplementary material.
Author contributions
AY: Data curation, Formal analysis, Funding acquisition, Investigation, Visualization, Writing – original draft, Writing – review & editing.
Funding
The author declares that financial support was received for the research and/or publication of this article. This work was supported by the Research on the Issues of Intelligent Financial Construction in Enterprises under the Background of Big Data (WLYB202488).
Conflict of interest
The author declares that the research was conducted in the absence of any commercial or financial relationships that could be construed as a potential conflict of interest.
Generative AI statement
The author declares that no Gen AI was used in the creation of this manuscript.
Publisher’s note
All claims expressed in this article are solely those of the authors and do not necessarily represent those of their affiliated organizations, or those of the publisher, the editors and the reviewers. Any product that may be evaluated in this article, or claim that may be made by its manufacturer, is not guaranteed or endorsed by the publisher.
References
1. Nguyen, DK, Sermpinis, G, and Stasinakis, C. Big data, artificial intelligence and machine learning: a transformative Symbiosis in favour of financial technology. Eur Financ Manag. (2023) 29:517–48. doi: 10.1111/eufm.12365
2. Wei, D. Prediction of stock price based on LSTM neural network. 2019 International Conference on Artificial Intelligence and Advanced Manufacturing (AIAM). (2019) 544–547. doi: 10.1109/AIAM48774.2019.00113
3. Rouf, N, Malik, MB, Arif, T, Sharma, S, Singh, S, Aich, S, et al. Stock market prediction using machine learning techniques: a decade survey on methodologies, recent developments, and future directions. Electronics (Basel). (2021) 10:2717. doi: 10.3390/electronics10212717
4. Kumar, D, Sarangi, PK, and Verma, R. A systematic review of stock market prediction using machine learning and statistical techniques. Mater Today Proc. (2022) 49:3187–91. doi: 10.1016/j.matpr.2020.11.399
5. Li, G, Wang, X, Bi, D, and Hou, J. Risk measurement of the financial credit industry driven by data. J Glob Inf Manag. (2022) 30:1–20. doi: 10.4018/JGIM.308806
6. Sun, Y, and Li, J. Deep learning for intelligent assessment of financial investment risk prediction. Comput Intell Neurosci. (2022) 2022:1–11. doi: 10.1155/2022/3062566
7. Saito, T, and Gupta, S. Big data applications with theoretical models and social media in financial management. Ann Oper Res. (2022) 14:1–23. doi: 10.1007/s10479-022-05136-x
8. VenkateswaraRao, M, Vellela, S, Reddy, VB, Vullam, N, Basha Sk, K, and Roja, D. Credit investigation and comprehensive risk management system based big data analytics in commercial banking. 2023 9th International Conference on Advanced Computing and Communication Systems (ICACCS). (2023) 1:2387–2391. doi: 10.1109/ICACCS57279.2023.10113084
9. Goldstein, I, Spatt, CS, and Ye, M. Big data in finance. Rev Financ Stud. (2021) 34:3213–25. doi: 10.1093/rfs/hhab038
10. Rane, NL, Choudhary, SP, and Rane, J. Artificial intelligence-driven corporate finance: enhancing efficiency and decision-making through machine learning, natural language processing, and robotic process automation in corporate governance and sustainability. Stud. Econ. Bus. Relat. (2024) 5:1–22. doi: 10.48185/sebr.v5i2.1050
11. Faheem, MA, Aslam, M, and Kakolu, S. Artificial intelligence in investment portfolio optimization: a comparative study of machine learning algorithms. Int. J. Sci. Res. Arch. (2022) 6:335–42. doi: 10.30574/ijsra.2022.6.1.0131
12. Gogas, P, and Papadimitriou, T. Machine learning in economics and finance. Comput Econ. (2021) 57:1–4. doi: 10.1007/s10614-021-10094-w
13. Sezer, OB, Gudelek, MU, and Ozbayoglu, AM. Financial time series forecasting with deep learning: a systematic literature review: 2005–2019. Appl Soft Comput. (2020) 90:106181. doi: 10.1016/j.asoc.2020.106181
14. Torres, JF, Hadjout, D, Sebaa, A, Martínez-Álvarez, F, and Troncoso, A. Deep learning for time series forecasting: a survey. Big Data. (2021) 9:3–21. doi: 10.1089/big.2020.0159
15. Al-Okaily, M, and Al-Okaily, A. Financial data modeling: an analysis of factors influencing big data analytics-driven financial decision quality. J Model Manag. (2024) 20:301–21. doi: 10.1108/JM2-08-2023-0183
16. Shang, H, Lu, D, and Zhou, Q. Early warning of Enterprise finance risk of big data Mining in Internet of things based on fuzzy association rules. Neural Comput & Applic. (2021) 33:3901–9. doi: 10.1007/s00521-020-05510-5
17. Yang, N. Financial big data management and control and artificial intelligence analysis method based on data mining technology. Wirel Commun Mob Comput. (2022) 2022:1–13. doi: 10.1155/2022/7596094
18. Deepa, N, Pham, Q-V, Nguyen, DC, Bhattacharya, S, Prabadevi, B, Gadekallu, TR, et al. A survey on Blockchain for big data: approaches, opportunities, and future directions. Futur Gener Comput Syst. (2022) 131:209–26. doi: 10.1016/j.future.2022.01.017
19. Hopp, D. Economic Nowcasting with long short-term memory artificial neural networks (LSTM). J Off Stat. (2022) 38:847–73. doi: 10.2478/jos-2022-0037
20. Jing, N, Wu, Z, and Wang, H. A hybrid model integrating deep learning with investor sentiment analysis for stock Price prediction. Expert Syst Appl. (2021) 178:115019. doi: 10.1016/j.eswa.2021.115019
21. Mohammadi, M, Jamshidi, S, Rezvanian, A, Gheisari, M, and Kumar, A. Advanced fusion of MTM-LSTM and MLP models for time series forecasting: An application for forecasting the solar radiation. Measurement: Sensors. (2024) 33:101179. doi: 10.1016/j.measen.2024.101179
22. Rezaei, H, Faaljou, H, and Mansourfar, G. Stock Price prediction using deep learning and frequency decomposition. Expert Syst Appl. (2021) 169:114332. doi: 10.1016/j.eswa.2020.114332
23. Yin, L, Li, B, Li, P, and Zhang, R. Research on stock trend prediction method based on optimized random Forest. CAAI Trans Intell Technol. (2023) 8:274–84. doi: 10.1049/cit2.12067
24. Park, HJ, Kim, Y, and Kim, HY. Stock market forecasting using a multi-task approach integrating long short-term memory and the random Forest framework. Appl Soft Comput. (2022) 114:108106. doi: 10.1016/j.asoc.2021.108106
25. Sadorsky, P. A random forests approach to predicting clean energy stock prices. J Risk Finan Manag. (2021) 14:48. doi: 10.3390/jrfm14020048
26. Kurani, A, Doshi, P, Vakharia, A, and Shah, M. A comprehensive comparative study of artificial neural network (ANN) and support vector machines (SVM) on stock forecasting. Ann Data Sci. (2023) 10:183–208. doi: 10.1007/s40745-021-00344-x
27. Qian, H, Wang, B, Yuan, M, Gao, S, and Song, Y. Financial distress prediction using a corrected feature selection measure and gradient boosted decision tree. Expert Syst Appl. (2022) 190:116202. doi: 10.1016/j.eswa.2021.116202
28. Sun, Z, Wang, G, Li, P, Wang, H, Zhang, M, and Liang, X. An improved random Forest based on the classification accuracy and correlation measurement of decision trees. Expert Syst Appl. (2024) 237:121549. doi: 10.1016/j.eswa.2023.121549
29. Wang, D, Li, L, and Zhao, D. Corporate finance risk prediction based on LightGBM. Inf Sci (N Y). (2022) 602:259–68. doi: 10.1016/j.ins.2022.04.058
30. Dong, H, Liu, R, and Tham, AW. Accuracy comparison between five machine learning algorithms for financial risk evaluation. J Risk Finan Manag. (2024) 17:50. doi: 10.3390/jrfm17020050
31. Ansah-Narh, T, Nortey, ENN, Proven-Adzri, E, and Opoku-Sarkodie, R. Enhancing corporate bankruptcy prediction via a hybrid genetic algorithm and domain adaptation learning architecture. Expert Syst Appl. (2024) 258:125133. doi: 10.1016/j.eswa.2024.125133
32. Du, G, and Elston, F. RETRACTED ARTICLE: financial risk assessment to improve the accuracy of financial prediction in the internet financial industry using data analytics models. Oper Manag Res. (2022) 15:925–40. doi: 10.1007/s12063-022-00293-5
33. Alam, K, Bhuiyan, MH, Haque, IU, Monir, MF, and Ahmed, T. Enhancing stock market prediction: a robust LSTM-DNN model analysis on 26 real-life datasets. IEEE Access. (2024) 12:122757–68. doi: 10.1109/ACCESS.2024.3434524
34. Yu, C, Jin, Y, Xing, Q, Zhang, Y, Guo, S, and Meng, S. Advanced user credit risk prediction model using LightGBM, XGBoost and Tabnet with SMOTEENN. 2024 IEEE 6th International Conference on Power, Intelligent Computing and Systems (ICPICS). (2024) 1:876–883. doi: 10.1109/ICPICS62053.2024.10796247
35. Hartanto, AD, Nur Kholik, Y, and Pristyanto, Y. Stock Price time series data forecasting using the light gradient boosting machine (LightGBM) model. Int J Informat Vis. (2023) 7:2270. doi: 10.62527/joiv.7.4.1740
Keywords: big data, financial forecasting, decision support, CNN-LSTM, machine learning
Citation: Yang A (2025) Big data-driven corporate financial forecasting and decision support: a study of CNN-LSTM machine learning models. Front. Appl. Math. Stat. 11:1566078. doi: 10.3389/fams.2025.1566078
Edited by:
Quoc Thong Le Gia, University of New South Wales, AustraliaReviewed by:
Zakariya Yahya Algamal, University of Mosul, IraqJumadil Saputra, University of Malaysia Terengganu, Malaysia
Copyright © 2025 Yang. This is an open-access article distributed under the terms of the Creative Commons Attribution License (CC BY). The use, distribution or reproduction in other forums is permitted, provided the original author(s) and the copyright owner(s) are credited and that the original publication in this journal is cited, in accordance with accepted academic practice. No use, distribution or reproduction is permitted which does not comply with these terms.
*Correspondence: Aixiang Yang, eWFuZ2FpeGlhbmdfc2FjQDE2My5jb20=