 Hajar M. Alkhezi1
 Ahmad Shafee
 Yousuf Alkhezi
- 1Department of Statistics and Operations Research, Faculty of Science, Kuwait University, Kuwait City, Kuwait
- 2Laboratory Technology Department, College of Technological Studies, Public Authority for Applied Education and Training (PAAET), Kuwait City, Kuwait
- 3Mathematics Department, College of Basic Education, Public Authority for Applied Education and Training (PAAET), Kuwait City, Kuwait
Ranking cricket teams are crucial in determining their standing and precedence in international cricket. In this study, we propose a novel approach to assess cricket team rankings using the Bayesian paired comparison method. The Bayesian paired comparison method is a statistical technique that leverages subjective assessments from a group of teams to evaluate their relative performance. The proposed approach is compared with the official rankings provided by the International Cricket Council (ICC), and it is found that the results obtained from the Bayesian method closely align with the ICC rankings. By incorporating subjective assessments and leveraging Bayesian inference, the method proves to be a reliable and accurate tool for evaluating team performance. The study highlights the advantages of the Bayesian paired comparison approach over traditional statistical techniques and provides valuable insights for cricket administrators, coaches, and enthusiasts in assessing and comparing the performance of cricket teams.
1 Introduction
Cricket, being a highly popular sport worldwide, implements a long-standing ranking system to assess team performance and establish their superiority. Its origins can be traced back to the late 16 century in England [1], and the sport has evolved significantly since then. Keeping a record of rating of each team from the earliest cricket matches has always been essential.
In the early stages, team ratings were documented manually without the aid of any specialized tools, relying on handwritten records. Due to its immense popularity, cricket generates extensive public discussion, often focused on comparing the skills and achievements of the past and present players. In order to showcase the relative standing of different teams and players, cricket rankings are established based on the outcomes of competitions and matches. The conventional approach involves assigning positions to teams based on points accumulated, with the team having the highest points being ranked first. However, traditional sports rankings primarily rely on win-loss or tie ratios and subjective assessments through polls. For instance, the ICC utilizes a set of ad hoc regulations to determine the cricket rankings. The methods employed by the ICC to rank cricket teams and individuals have been criticized for their perceived complexity and lack of transparency [2]. There is a growing need for a thorough examination of these mechanisms in order to develop improved ranking techniques that offer more clarity and fairness.
The theory of inference offered by Bayesian statistics allows us to describe observed outcomes through hypothetical predictions [3]. Bayesian statistics provides the fundamental framework for incorporating new empirical data and updating existing information. Pair comparisons (PC) have long been employed as a technique for comparing different items and addressing certain challenges. In the context of our study, we assign preference or indifference scores to each pair of items when comparing them. Traditional PC models typically assign scores to items on a linear scale, reflecting the reference point for evaluating the items.
Due to the substantial interest observed in recent years, researchers have shifted their focus toward the Bayesian analysis of multiple PC models, as evidenced by several studies [4–7], along with many others. The model proposed by Bradley and Terry [8] is widely regarded as the fundamental model for PCs. Extensive research has been conducted in the field of PC techniques leading up to the present moment although this discussion only covers a small portion of the extensive literature. A scaling method was explored by Guttman [9], which bears a striking resemblance to the process of discriminate analysis.
A probabilistic model for PC experiments is described in Gridgeman [10]. The author investigates cases with and without ties, examining their implications within the models. The problem posed by the non-linear state space model for contrasting objects is addressed by Glickman [11]. The study explores a solution where the performance of the objects may change significantly as the citizen variable increases. Several generalizations of the Bradley–Terry model are proposed by Hunter [12]. The author adopts a robust approach to iteratively determine optimal prospect parameter approximations. In the Bayesian framework, Aslam [13] investigates the PC model with ties. Non-informative priors are employed to conduct Bayesian analyses for two theories, namely, the Rao–Kupper and the Davidson models. Posterior means, posterior probabilities, and predictive probabilities are evaluated and subsequently discussed.
The methods for addressing pairwise comparison selection issues are proposed by Priekule and Meisel [14]. The authors numerically compare four sampling strategies, including different knowledge gradient policies, an exploration policy, and a knockout competition. For the analysis, they utilize a multi-binomial model. The results of their study indicate that knowledge gradient policies outperform exploration and knockout tournament policies. In analyzing wrestling data, Usami [15] focus on the PC model. They combine the Bradley–Terry and non-linear models to develop their proposed model. The author suggests that the proposed model yields superior results than existing models.
The consideration of ties in the basic model is extended by including threshold parameters as discussed in Rao and Kupper [16]. The results reveal that the Bradley–Terry model, which compares two treatments, exhibits a clear preference for one of the treatments. However, disregarding the possibility of ties completely results in the loss of valuable information contained within the no preference class.
In this study, the PC model studied by Altaf et al. [17] is subjected to Bayesian analysis. Non-informative priors are employed for the Bayesian analyses. By deriving joint posterior distributions and marginal posterior distributions for the parameters of the model, posterior estimates (means), predictive probabilities, and posterior probabilities for contrasting the two treatment parameters are obtained. Additionally, graphical representations of the marginal posterior distributions of the parameters are provided. Some recent papers have also explored similar topics. Various generalizations of different paired comparison models are presented in Oliveira et al. [18], Orbán-Mihálykó et al. [19], Orbán-Mihálykó et al. [20], Osei and Davidov, [21], Ghosh and Davidov [22].
The remaining sections of this paper discuss the Rao–Kupper model in Section 1, providing an overview of the notation used in the suggested model. The prior distribution of the suggested model is described in Section 2. Section 3 derives the likelihood function of the suggested model. In Section 4, the detailed derivation of the posterior distribution and its graphical representation are presented. This section also covers several statistical measures, such as posterior mean, preference probabilities, Bayesian hypothesis testing, predictive probability, and the adequacy of the proposed model. Finally, the conclusion and future research directions are addressed in the last section.
2 Materials and methods
2.1 Data
The extracted data cover the top six teams in the International Cricket Council (ICC) rankings, which can be found at the link https://stats.espncricinfo.com/ci/engine/stats. These have been summarized into summary statistics of the number of matches played between the top six ICC teams in Table 1.

Table 1. Summary statistics of the number of matches played among six teams.
2.2 Methods
2.2.1 Rao–Kupper model
According to Rao and Kupper [16], in order to account for tied observations, modifications need to be made to the Bradley–Terry model. The introduction of a new parameter, denoted as σ = lnγ(threshold parameter), is proposed. The assumption made is that if the observed difference (Xk − Xl) between treatments tk and tl is smaller than σ, the panelist will be unable to distinguish between the two treatments and will declare a tie. Thus, when comparing treatments tk and tl, the probability that treatment tk is preferred to treatment tl (where k ≠ l) is represented as ψ(k.kl) and is defined as follows:
The Rao–Kupper model that tkand tl having no preference is denoted by
ψ(0.kl). The ψ(0.kl) given by
The Rao–Kupper model becomes the Bradley–Terry model if γ = 1.
2.2.2 Notations of Rao–Kupper model
In the analysis of the proposed Rao–Kupper model, the following notations are utilized: Nk, klm takes the value of 1 or 0, indicating whether the treatment tk is preferred over treatment tl or not in the kth repetition (m = 1, 2, …, rkl) of the comparison. Similarly,N0, klm takes the value of 1 or 0, indicating whether the treatment tk is tied to treatment tl or not. It should be noted that Nk, klm + Nl, klm + N0, klm = 1 and represents the number of times treatment tk is preferred to treatment tl. N0.kl = ∑mN0.klm = the number of times treatment tkand treatment tlis tied. rk.kl is the number of times of comparisons between treatment tkand treatment tl. With rkl = N0.kl + Nk.kl + Nl.kl = rlk.
The following notation is useful for further simplification of the likelihood function:
where is the number of times treatment tk is preferred to tland the number of Times treatment tk and tl are tied. is the total number of times treatment tk is preferred to any other treatment, and the number of times treatment tk and tl are tied. the total number of times treatment tk and tl are tied.
2.2.3 Prior distributions for the proposed model
Two non-informative Jeffreys and Uniform priors are taken into account for the Bayesian analysis of the suggested model [23, 24]. Every unit receives the same probability under the Uniform prior. Symbolically, it can be expressed as
In contrast, the Jeffreys prior can be found as:
where the Fisher information matrix is represented by I(ϑ). Fisher's information matrix is as follows for n = 2:
Given that the Jeffreys prior has an extended and difficult algebraic equation that is difficult to apply for n = 6, we derive the Jeffreys prior numerically for n = 6 using SAS programming.
2.2.4 Likelihood function for the proposed model
According to the Rao–Kupper model, the likelihood function of the observed outcome, the probability of the observed outcome in the repetitions of the treatment pair (tk, tl)
where .
The treatment parameters in this case are ϑ1, ϑ2, …, ϑn, and the threshold parameter is γ.
2.2.5 Posterior distribution using uniform prior for n = 6 teams
Let us consider the case for the parameters of six teams ϑ1, ϑ2, …, ϑ6. The following is the joint posterior distribution for the unknown parameters:
where and γ>1 is the order parameter, using the constraint ϑ1 + ϑ2 + ϑ3 + ϑ4 + ϑ5 + ϑ6 = 1, then ϑ6 = 1 − (ϑ1 + ϑ2 + ϑ3 + ϑ4 + ϑ5) with ϑ1, ϑ2, ϑ3, ϑ4, ϑ5 ≥ 0 and R is normalizing constant.
The marginal posterior distribution of ϑ1using Uniform prior is defined as
The expression for the marginal posterior densities for the rest of the parameters can also be derived.
2.2.6 Appropriateness of the Rao–Kupper model
The observed numbers of preferences are compared to the expected number of preferences in order to determine whether the Rao–Kupper model is appropriate for the paired comparisons. If the differences are minimal, the result is considered as consistent. The hypothesis that the model is true for some value of ϑ0(the vector of parameter values) is tested using the chi-squaretest. We have
where the parameters of the vector are ϑ. Using chi-square χ2 test, we evaluate the appropriateness of the model. Let us consider how often treatments tkare predicted to be preferred over treatments tland how on treatments tlare likely to be preferred over treatments tk. The chi−squaretest is expressed as
which has chi-square distribution with (N − 1) degree of freedom. The expected number of treatments is obtained as
3 Results
3.1 Graphical presentation of the marginal distribution for parameters n = 6 teams
Graph of the marginal posterior distribution in the case of six parameters n = 6, on the data basis of the above data of 1 Day International matches, are given below. The behavior of all the teams is positive skewness. The behavior of the worth parameter γ shows positive skewness. The behavior of the team ϑ2 shows less slightly positive skewness than ϑ3. The behavior of the team ϑ3 shows less slightly positive skewness than the team ϑ1. The behavior of the team ϑ1 shows less slightly positive skewness than the team ϑ4. Table 2 shows the ODI matches from 2019 to 2022, whereas Figure 1 shows the graph for n = 6 teams using ODI's data.
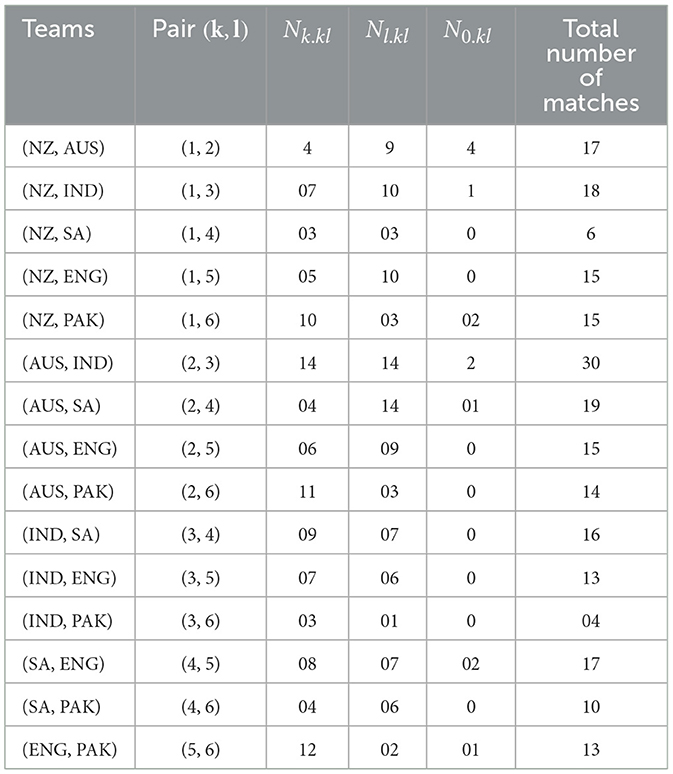
Table 2. The data of ODI matches from 2016 to 2022 for n = 6 teams.

Figure 1. Graphs for the n = 6 teams using ODI's data.
3.2 Posterior means
The Bayes estimations of the parameters are based on posterior means. The SAS package is used to find posterior means. This is derived from the joint distribution 2.1 of the six parameters denoted by ϑ1, ϑ2, …, ϑ6. For the data listed in Table 3, the posterior estimates (means) for the aforementioned parameters of the proposed model are as follows: according to the estimates found in Table 3, we conclude that of the six teams, Australia is the top, followed by India, South Africa, England, New Zealand, and Pakistan at last.
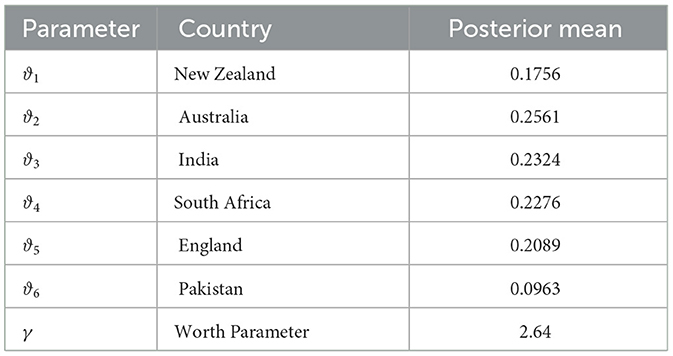
Table 3. The data of ODI matches from 2016 to 2022 for n = 6 teams.
3.3 Preference probabilities
Using a Uniform prior distribution, the preference probabilities are calculated from the data in Table 4 and are then provided in According to the results shown in Table 4, it can be concluded that in matches between New Zealand and Australia, Australia has a 0.6579 winning probability while New Zealand has a 0.3421 winning probability. Similarly, in matches between New Zealand and India, New Zealand has a 0.3674 winning probability while India has a 0.7326 winning probability. Similarly, the rest of the table can be interpreted in the same way.

Table 4. Preference Probabilities for n = 6.
3.4 Bayesian hypothesis testing for n = 6 using Rao–Kupper model
The posterior probabilities of the hypotheses for comparing six parameters are calculated.
Table 5 contains that P12 = 0.0762 and Q12 = 0.9238 the hypothesis that H12 is accepted with high probability Q12 = 0.9325 and interpreted that the Australian team wins the match, the hypothesis that H13 is accepted with a high probability Q13 = 0.8314 and interpreted that the India team won the match, and the rest of the table can be interpreted in the same way as the above interpretation.
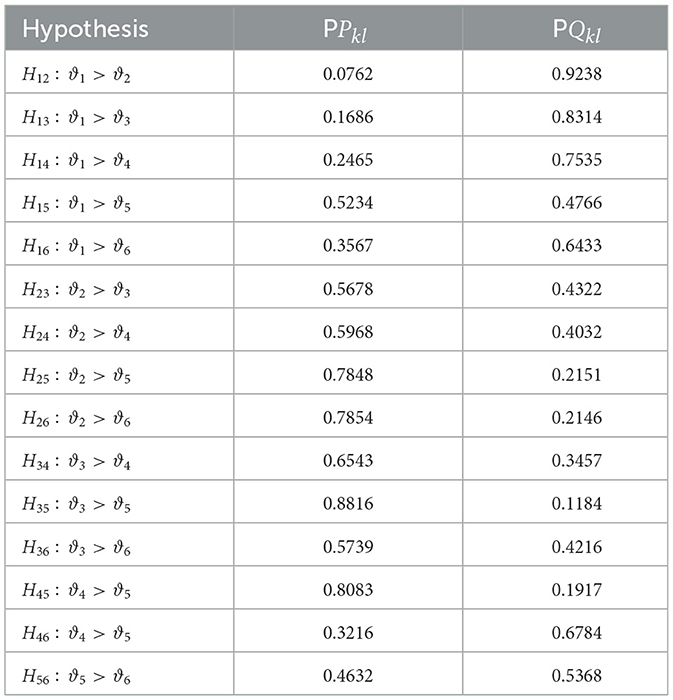
Table 5. Posterior probabilities for n = 6.
3.5 Predictive probability
The probability of treatment tk is favored over tl in a single future comparison in the Rao–Kupper model is calculated in the term of predictive probability P(kl) is given Table 6 is that it is expected that in the future the matches between New Zealand and Australia that there is 63.45% chance that the Australian team will win the match, it is expected that in the future the matches between New Zealand and India that there is a 66.26% chance that India will win, in the matches between New Zealand and South Africa that there in the future is a 64.52% chance that South Africa will win the match. The rest of Table 6 can be interpreted in the same way. The predictive probabilities P(0.12), P(0.13), P(0.14), P(0.15), and P(0.16) are 0.4, 1.13, 3.44, 2.25, and 1.43%, respectively. These values are very small, so one can say that the probability of declaring a tie in a future single comparison of different treatments is < 11% and the rest of the predictive probability can be interpreted in the same way. The appropriateness of the proposed model is calculated using the observed and expected number of preferences calculated using the χ2 statistic using the data given in Table 7, χ2 = 23.147 with a p-value found to be 0.541, so there is no evidence that the model is not a good fit.
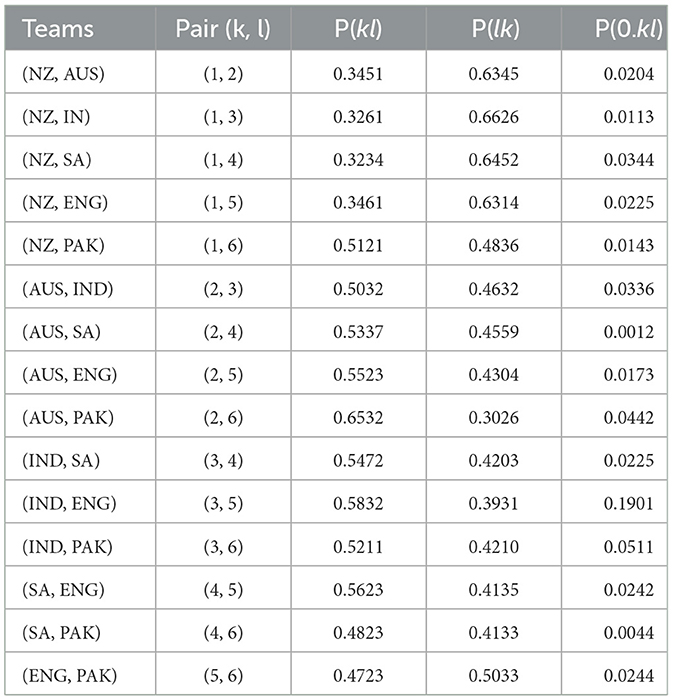
Table 6. Predictive probabilities are obtain for n = 6.
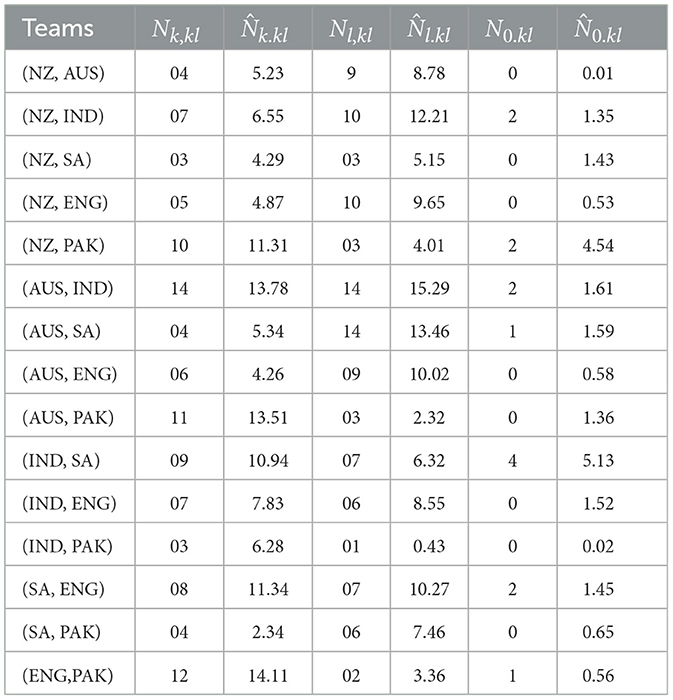
Table 7. Observed frequencies and expected frequencies.
4 Discussion
The ICC (International Cricket Council) ranking system uses a different approach. The ICC rankings are typically determined based on a points system that considers match outcomes, series results, and tournament performances. The specific algorithms and criteria used by the ICC might include factors such as the quality of opposition, home and away performances, and the ODI matches. We compare the results of our proposed study with the ICC ranking system.
With the proposed model of paired comparison and its methodology it is challenging to make a direct comparison or provide a preference over the ICC ranking system. However, we discuss general reasons why some cricket enthusiasts or analysts might prefer alternative ranking models over the ICC system.
4.1 Transparency of methodology
Some fans and analysts may prefer ranking systems that are more transparent about their methodologies. The suggested model openly shares its algorithms and criteria, users might find it easier to understand how rankings are calculated.
4.2 Specific criteria consideration
Different ranking systems may prioritize different criteria in assessing team performance. The proposed model considers factors that are perceived as more accurate or relevant by some cricket enthusiasts, they may prefer its results over the ICC rankings.
4.3 Up-to-date data
Some ranking models might incorporate more recent performance data or different types of statistics that enthusiasts believe better reflect current form of a team. If the Rao–Kupper model updates more frequently or includes more recent information, users may find its rankings more reflective of the current scenario.
4.4 Accuracy in predicting outcomes
The suggested model has demonstrated accuracy in predicting match outcomes or has consistently aligned with fan perceptions of team strength, users might prefer it over a ranking system that they perceive as less accurate.
4.5 International consistency
Some enthusiasts may prefer a ranking system that is consistent across various formats and tournaments, providing a more comprehensive evaluation of overall performance of a team. If the Rao–Kupper model offered this consistency, and viewed favorably.
4.6 Incorporation of contextual factors
The suggested model incorporates contextual factors, such as player form, team strategies, or match conditions in a way that is seen as more sophisticated or accurate, users may prefer its rankings.
It is crucial to note that the ICC ranking system is widely recognized and accepted as the official ranking system for international cricket. However, preferences for alternative models may arise due to subjective opinions about what factors are most important in assessing team performance and how well a particular model captures those factors. Ultimately, the choice of a ranking system may depend on individual preferences and the perceived strengths and weaknesses of each model.
In summary, the preference for a paired comparison model, such as the Rao–Kupper model, over the ICC cricket ranking system for ODI teams may stem from the desire for a more nuanced and context-specific evaluation. Paired comparison models allow for a direct comparison between teams, taking into account-specific match-ups and individual performances. This approach can capture the subtleties of team dynamics and adaptability, providing a more dynamic and responsive ranking system. Supporters of paired comparison models often appreciate the transparency and simplicity of the methodology as it avoids complex weighting systems and allows for a straightforward understanding of how teams are positioned relative to each other. Additionally, these models may be seen as offering a more immediate reflection of the current form of a team, emphasizing recent performances and capturing changes in dynamics more rapidly than broader, long-term-oriented ranking systems. While the ICC cricket ranking system holds official recognition and global acceptance, some enthusiasts may lean toward paired comparison models for their ability to offer a more finely tuned assessment of team capabilities based on direct comparisons.
5 Conclusion
The present study applies a Bayesian analysis to PC data using the suggested model studied by [16, 17], which allows for the inclusion of ties. By incorporating ties through a Bayesian approach, this research aims to generate increased interest in PC analysis. The paper provides a Bayesian analysis using both the Uniform prior and Jeffreys prior. We utilize specifically focusing on ODI matches between 2016 and 2022, employing various programs within the SAS package to obtain results such as posterior means, preference probabilities, and predictive and posterior probabilities. The results reveal that based on the posterior means, the following ranking is observed: Australia is ranked first, India is ranked second, South Africa is ranked third, New Zealand is ranked fourth, England is ranked fifth, and Sri Lanka is ranked last. This ranking aligns with the ICC ranking of 2022. The calculated preference probabilities indicate that Australia, India, South Africa, and New Zealand are favored over England, South Africa, and New Zealand, respectively, thereby supporting the ICC ODI rankings. To assess the adequacy of the proposed model, the chi-squared statistic is employed. The results confirm that the model fits well, and the use of a non-informative Uniform prior is deemed suitable for the Bayesian analysis of the model. In order to conduct a Bayesian analysis of the PC models, alternative non-informative priors that are more appropriate are suggested. Additionally, suitable informative priors are proposed for the observed frequencies and their expected frequencies Bayesian analysis of the model. It is also feasible to perform analysis without imposing any limitations on the parameters. Moreover, Bayesian analysis can be applied to other PC models. Furthermore, the PC technique can reliably rank more than six teams.
In terms of future research, it would be valuable to extend the analysis to include a larger dataset encompassing a wider range of time periods and matches. This would provide a more comprehensive understanding of the rankings and preferences in ODI cricket. Additionally, exploring alternative PC models and priors for Bayesian analysis could yield further insights and comparisons. Finally, investigating the applicability of the PC technique for ranking teams in other sports or domains would expand the scope and applicability of the research.
Data availability statement
The original contributions presented in the study are included in the article/supplementary material, further inquiries can be directed to the corresponding author.
Author contributions
HA: Conceptualization, Data curation, Formal analysis, Writing – original draft. AS: Investigation, Methodology, Resources, Validation, Writing – original draft. YA: Data curation, Investigation, Project administration, Resources, Visualization, Writing – review & editing.
Funding
The author(s) declare that no financial support was received for the research and/or publication of this article.
Acknowledgments
We sincerely thank the referee for their valuable comments and suggestions, which have significantly improved the quality and clarity of our paper. Their detailed feedback helped us refine our arguments and strengthen the overall presentation. We greatly appreciate their time and effort in reviewing our study.
Conflict of interest
The authors declare that the research was conducted in the absence of any commercial or financial relationships that could be construed as a potential conflict of interest.
Generative AI statement
The author(s) declare that no Gen AI was used in the creation of this manuscript.
Publisher's note
All claims expressed in this article are solely those of the authors and do not necessarily represent those of their affiliated organizations, or those of the publisher, the editors and the reviewers. Any product that may be evaluated in this article, or claim that may be made by its manufacturer, is not guaranteed or endorsed by the publisher.
References
1. Underdown D. The history of cricket. Hist Compass. (2006) 4:43–53. doi: 10.1111/j.1478-0542.2006.00304.x
2. Borooah VK, Mangan JE. The “bradman class”: an exploration of some issues in the evaluation of batsmen for test matches, 1877–2006. J Quantitative Anal Sports. (2010) 6:14. doi: 10.2202/1559-0410.1201
3. Gelman A, Shalizi CR. Philosophy and the practice of bayesian statistics. Br J Math Stat Psychol. (2013) 66:8–38. doi: 10.1111/j.2044-8317.2011.02037.x
4. Davidson RR, Solomon DL. A bayesian approach to paired comparison experimentation. Biometrika. (1973) 60:477–87. doi: 10.1093/biomet/60.3.477
5. Leonard T. An alternative bayesian approach to the bradley-terry model for paired comparisons. Biometrics. (1977) 33:121–32. doi: 10.2307/2529308
6. Chen C, Smith TM. A bayes-type estimator for the bradley-terry model for paired comparison. J Stat Plan Inference. (1984) 10:9–14. doi: 10.1016/0378-3758(84)90028-4
7. Kim D-H, Kim H-J. “A bayesian approach to paired comparison of several products of poisson rates.” In: Proceedings of the Korean Statistical Society Conference. The Korean Statistical Society (2004). p. 229–36.
8. Bradley RA, Terry ME. Rank analysis of incomplete block designs: I. the method of paired comparisons. Biometrika. (1952) 39:324–45. doi: 10.1093/biomet/39.3-4.324
9. Guttman L. An approach for quantifying paired comparisons and rank order. Ann Math Stat. (1946) 17:144–63. doi: 10.1214/aoms/1177730977
10. Gridgeman N. Pair comparison, with and without ties. Biometrics. (1959) 15:382–8. doi: 10.2307/2527742
11. Glickman ME. Parameter estimation in large dynamic paired comparison experiments. J R Stat Soc Ser C Appl Stat. (1999) 48:377–94. doi: 10.1111/1467-9876.00159
12. Hunter DR. MM algorithms for generalized bradley-terry models. Ann Stat. (2004) 32:384–406. doi: 10.1214/aos/1079120141
13. Aslam M. Bayesian analysis for paired comparison models allowing ties and not allowing ties. Pak J Stat All Ser. (2002) 18:53–70.
14. Priekule L, Meisel S. “A bayesian ranking and selection problem with pairwise comparisons.” In: 2017 Winter Simulation Conference (WSC). IEEE (2017). p. 2149–60. doi: 10.1109/WSC.2017.8247947
15. Usami S. Bayesian longitudinal paired comparison model and its application to sports data using weighted likelihood bootstrap. Commun Stat Simul Comput. (2017) 46:1974–90. doi: 10.1080/03610918.2015.1026989
16. Rao P, Kupper LL. Ties in paired-comparison experiments: a generalization of the bradley-terry model. J Am Stat Assoc. (1967) 62:194–204. doi: 10.1080/01621459.1967.10482901
17. Altaf S, Aslam M, Aslam M. Bayesian analysis of the Rao-Kupper model for paired comparison with order effect. J Stat. (2015) 22:41–7.
18. Oliveira IF, Ailon N, Davidov O. A new and flexible approach to the analysis of paired comparison data. J Mach Learn Res. (2018) 19:2458–86. Available online at: http://jmlr.org/papers/v19/17-179.html
19. Orbán-Mihálykó É, Mihálykó C, Koltay L. A generalization of the' thurstone method for multiple choice and incomplete paired comparisons. Cent Eur J Oper Res. (2019) 27:133–59. doi: 10.1007/s10100-017-0495-6
20. Orbán-Mihálykó É, Mihálykó C, Koltay L. Incomplete paired compar-'isons in case of multiple choice and general log-concave probability density functions. Cent Eur J Oper Res. (2019) 27:515–32. doi: 10.1007/s10100-018-0568-1
21. Osei PP, Davidov, O. Bayesian linear models for cardinal paired comparison data. Comput Stat Data Anal. (2022) 172:107481. doi: 10.1016/j.csda.2022.107481
22. Ghosh S, Davidov O. Graph-based estimators for paired comparison data. J Stat Plan Inference. (2020) 209:1–11. doi: 10.1016/j.jspi.2020.02.004
23. Laplace PS. Theorieanalytique des probabilit' es suppl.'The'orieanalytique des probabilite's (1812).
Keywords: paired comparison method, Rao–Kupper model, non-informative prior, Bayesian inference, preference probability, predictive probability
Citation: Alkhezi HM, Shafee A and Alkhezi Y (2025) A Bayesian framework perspective for model of paired comparison in cricket teams ranking. Front. Appl. Math. Stat. 11:1568445. doi: 10.3389/fams.2025.1568445
Received: 17 February 2025; Accepted: 25 March 2025;
Published: 11 April 2025.
Edited by:
Xiaoqian Sun, Clemson University, United StatesReviewed by:
Massimo Cannas, University of Cagliari, ItalyFan Zhang, Clemson University, United States
Copyright © 2025 Alkhezi, Shafee and Alkhezi. This is an open-access article distributed under the terms of the Creative Commons Attribution License (CC BY). The use, distribution or reproduction in other forums is permitted, provided the original author(s) and the copyright owner(s) are credited and that the original publication in this journal is cited, in accordance with accepted academic practice. No use, distribution or reproduction is permitted which does not comply with these terms.
*Correspondence: Ahmad Shafee, YXMuemFkYUBwYWFldC5lZHUua3c=