 Zihan Liu
- Haide College, Ocean University of China, Qingdao, China
Stock price prediction plays a crucial role in investment, corporate strategic planning, and government policy formulation. However, stock price prediction remains a challenging issue. To tackle this issue, we propose a novel hybrid model, termed M-A-BiLSTM, which integrates Attention mechanisms, Multi-Layer Perceptron (MLP), and Bidirectional Long Short-Term Memory (Bi-LSTM). This model is designed to enhance feature selection capabilities and capture nonlinear patterns in financial time series. Evaluated on stock datasets from Apple, ExxonMobil, Tesla, and Snapchat, our model outperforms existing deep learning methods, achieving a 15.91% reduction in Mean Squared Error (MSE) for Tesla and a 5.95% increase in R-squared (R2) for Apple. Meanwhile, the MSE on the ExxonMobil dataset decreased to 1.8954, showing a significant reduction, while the R2 increased to 0.9887. These results demonstrate the model's superior predictive power, offering a robust and interpretable approach for financial forecasting.
1 Introduction
In recent years, stock market prediction has become one of the most challenging and important research tasks in the field of finance. The stock market is the primary venue for institutions to allocate stocks and raise funds [1]. It also functions as an intermediary that facilitates the flow of funds from savers to investors, providing a system and mechanism to mobilize domestic savings and effectively channel them into productive investments. Reducing capital costs for investors accelerates a country's economic growth. Consequently, predicting stock market trends is considered an important task because accurate stock price predictions can lead to enticing profits through correct decision-making [2].
The stock market is a challenging field, characterized by complex multivariate and time-evolving nature, and is correlated with various external factors [3]. The problem of stock price prediction has long been a subject of research for researchers. In the 1990s, Lawrence [4] discussed the application of neural networks in the field of financial markets for stock price prediction and found that it provided more accurate predictive capabilities. Subsequently, Kim and Han [5] proposed the application of genetic algorithms to artificial neural networks for determining the relevant key values of the stock price prediction index, which reduces the dimension of the feature space and demonstrates a superior prediction effect. Traditional statistical methods such as simple moving averages, weighted moving averages, exponential smoothing, and naive methods have been commonly used in stock price prediction [6]. However, these traditional methods fail to many additional factors, such as semantic factors, which reduce the accuracy of the models.
Numerous studies have shown that deep learning techniques play a significant role in advancing financial analysis and stock price prediction. For example, Lu et al. used CNN to capture local features to predict time series [7]. Ali et al. [8] used logistic regression models to calculate index variables affecting company stocks or stock returns, enhancing investors' ability to predict stock prices at any given moment. Gao et al. used GRU to capture dynamic patterns in time series and effectively predict stock prices [9]. Wang et al. [10] demonstrated that using Long Short-Term Memory (LSTM) to predict stock returns, unidirectional LSTM can effectively capture long-term dependencies in time series data. However, its primary limitation lies in its reliance solely on past information for prediction, i.e., it can only utilize the forward temporal information from historical data. In some cases, the current stock market trend is influenced not only by past information but may also be guided by future trends or potential market changes. Siami-Namini et al. [11] indicates that Bidirectional LSTM (Bi-LSTM) can overcome this limitation by processing the input sequence twice, enabling it to capture contextual information more effectively and resulting in improved prediction performance. Furthermore, Alizadegan et al. [12] has demonstrated that LSTM and Bi-LSTM consistently outperform traditional forecasting models, such as ARIMA and SARIMA, in terms of predictive accuracy. Notably, their findings highlight that Bi-LSTM exhibits superior capability in capturing complex nonlinear patterns and effectively modeling long-range dependencies within the data.
However, due to the unpredictability and complexity of stock market behavior, existing methods have achieved limited success. Although Bi-LSTM can address the issues of unidirectional LSTM in time series, it may face challenges such as information decay or poor transmission when dealing with long time series analysis, leading to imbalanced attention on crucial parts of the prediction task. The Attention mechanism, a key technique in processing sequential data, allows a model to automatically assess the importance of different parts of the input sequence [13]. By dynamically focusing the model on the most relevant segments, the Attention mechanism improves the model's ability to capture critical information, which is essential when handling complex and noisy time series data, such as stock price. Incorporating the Attention mechanism into Bi-LSTM brings several advantages [14], especially in situations where important features may not be immediately apparent or are distributed across different time points in the sequence. By combining these two mechanisms, the model can dynamically adjust its focus on important parts, improving the learning of relevant patterns and long-range dependencies, thus enhancing predictive accuracy [15]. Inspired by the oil and gas industry, the Attention mechanism in deep learning addresses information overload by prioritizing key segments, thereby improving both performance and interpretability [16]. And Li and Xu [17] also mentioned that the attention mechanism can selectively focus on the important features and patterns within the data, which is beneficial for identifying the key market indicators that influence stock prices.
In addition, Multilayer Perceptrons (MLP) are widely used as basic classifiers for time series trend prediction due to their strong ability to model nonlinear relationships [18, 19]. In previous studies, combining LSTM with MLP has effectively enhanced the model's ability to capture complex patterns, improving overall predictive performance [20]. Specifically, MLP, with its multi-layer structure, can capture the complex nonlinear relationships in input data, thereby improving the model's adaptability to complex systems such as financial markets. At the same time, Mohammadi et al. [21] pointed out that integrating MLP with LSTM can better capture the temporal dependencies and nonlinear features in the data, thus improving the model's predictive accuracy. Additionally, Liu et al. [22] proposed combining Bi-LSTM with MLP, leveraging Bi-LSTM's powerful ability to model bidirectional dependencies and MLP's capacity to extract complex features, using MLP as the output layer of Bi-LSTM. This combination further improves the model's prediction accuracy and generalization ability when dealing with long time series data.
Based on the above understanding, this paper proposes an integrated model combining Bi-LSTM, the Attention mechanism, and Multilayer Perceptrons (MLP), referred to as the M-A-BiLSTM model. In this model, Bi-LSTM captures both forward and backward dependencies in the sequence by combining two LSTM networks, overcoming the information capture limitations of unidirectional LSTM in certain scenarios. The Attention mechanism is incorporated to identify and focus on the most important features in the input sequence, improving feature selection. MLP, with its multi-layer structure, enhances the model's ability to express complex patterns through nonlinear mapping.
The model is evaluated using stock market data from Tesla, Apple, ExxonMobil, and Snapchat, with Mean Squared Error (MSE) as the loss function to assess prediction performance. MSE quantifies the difference between predicted and actual values, with lower values indicating better accuracy. The experimental results show that the M-A-BiLSTM model outperforms traditional models like LSTM, Bi-LSTM, and MLP in stock price prediction, achieving a significantly lower MSE, demonstrating stronger predictive ability and higher accuracy when applied to stock market data.
Through model comparison and performance evaluation, the contributions of this study to the stock price prediction process are as follows:
1. Instead of adopting a single deep learning model, we combine Bi-LSTM, MLP, and Attention for stock price training and prediction, naming this integrated model M-A-BiLSTM. By leveraging the complementary strengths of these different models, it effectively enhances the feature extraction and representation capabilities for financial time series data.
2. Extensive experiments on multiple real-world stock price datasets show that our proposed integrated model achieves significant improvements in predictive performance compared to traditional deep learning approaches. Specifically, it demonstrates superior results in terms of Mean Squared Error (MSE), Mean Absolute Error (MAE), and the R-squared (R2) coefficient, highlighting its feasibility and effectiveness in real-world forecasting tasks.
3. Building on parameter tuning and comparative experiments, this study further conduct an ablation study by progressively removing or replacing different components of the model to evaluate their impact on overall predictive performance. This investigation confirms the advantages of the integrated model in terms of both accuracy and robustness.
2 Related work
The potential value of stock market trend prediction is immeasurable, which has motivated extensive research in recent years. Traditional stock price prediction methods, such as simple moving averages, weighted moving averages, exponential smoothing, and naive approaches, have been widely used but exhibit increasing limitations, especially when unable to incorporate key factors. For instance, traditional methods fail to account for external factors like market sentiment, news semantics, and policy changes, all of which significantly impact stock market fluctuations. As a result, the prediction accuracy of these models is limited, often failing to capture the complex dynamics of market trends.
2.1 Traditional models
In recent years, the rapid advancement of deep learning has led to notable progress in the development of stock market prediction models within the financial sector. For example, Ye et al. [23] employed a CNN-based model to capture local features and enhance an algorithmic trading framework, demonstrating its potential for handling noisy input data. In 2019, Zhang et al. [24] introduced a Generative Adversarial Network (GAN) architecture for predicting stock closing prices, where a Multilayer Perceptron (MLP) functioned as the discriminator and a Long Short-Term Memory (LSTM) network served as the generator. Meanwhile, Sathish and Kiran [25] compared eight machine learning models and four LSTM-based deep learning regression models, revealed that the latter outperformed other approaches. Despite the growing popularity of deep learning techniques, however, the inherently unpredictable and complex nature of the stock market continues to limit the extent of progress achieved thus far.
2.2 The applications of LSTM models
Stock market data, with its temporal continuity and strong contextual dependence, makes LSTM networks highly effective for capturing long-term dependencies. As a variant of Recurrent Neural Networks (RNNs), LSTM addresses the gradient vanishing or explosion issues in traditional RNNs by using gating mechanisms (e.g., input, forget, and output gates), making it particularly suitable for stock price prediction. LSTM models excel at identifying long-term trends and underlying market patterns, which has led to their widespread use in finance. However, LSTM still faces challenges in selectively processing relevant information, especially when dealing with large amounts of irrelevant data. Efficiently focusing on important features is essential for improving prediction accuracy and model robustness. Bi-LSTM networks, which integrate deep and temporal learning, address the instability of unidirectional models and their sensitivity to data fluctuations, enhancing accuracy, robustness, and generalization ability [26, 27]. Bi-LSTM has shown superior performance in stock price prediction compared to traditional LSTM models. For instance, while the MSE for a standard LSTM model during training is 0.0003, Bi-LSTM reduces it to 0.0002. Additionally, fine-tuning hyperparameters (e.g., epochs and hidden layers) has significantly enhanced stock price prediction. For example, using 100 epochs resulted in the lowest RMSE in experiments conducted by Sunny et al. [28]. Furthermore, a hybrid model combining MLP with Bi-LSTM, as proposed in Chen et al. [29], improves feature extraction and accelerates gradient descent, boosting prediction accuracy. This model achieved an MSE of 0.00123, outperforming both the MLP-only model (MSE of 0.00288) and the LSTM model (MSE of 0.00221).
2.3 The applications of Attention mechanism
LSTM models may suffer from information decay or poor propagation over long time spans, prompting recent research to focus on the widely used Attention mechanism. By weighting different parts of the input sequence and emphasizing the most critical features for prediction, the Attention mechanism addresses LSTMs limitations in feature selection. For example, the self-attention mechanism introduced by Vaswani [30] calculates correlations between elements in the input sequence and assigns weights, focusing more on the most important information. Additionally, models employing spatiotemporal attention integrated with deep learning have been introduced in various domains, aiming to optimize spatiotemporal dependencies. These models merge spatial and temporal attention to more accurately identify and exploit key information for prediction, ultimately boosting adaptability in dynamic markets [31]. The core principle underlying these mechanisms is weight assignment, wherein higher weights are allocated to more important information, thus refining external focus on the data and amplifying the intended features [32].
2.4 The applications of MLP models
Multilayer Perceptron (MLP), as a classical feedforward neural network model, is widely used in various prediction and classification tasks. Its basic structure consists of an input layer, multiple hidden layers, and an output layer, with information transmitted between layers through fully connected connections. Due to its strong capability for nonlinear fitting, MLP has been widely applied in fields such as image recognition, speech processing, and financial forecasting. In the field of financial forecasting, MLP has been used for tasks such as stock price prediction and market trend analysis. For example, many studies have shown that MLP can predict short-term fluctuations in stock prices by capturing complex patterns in historical data [20]. By optimizing the number of layers and neurons in the network, MLP can improve the model's generalization ability, thereby maintaining better prediction performance under different market conditions.
2.5 The advantages of the hybrid model
The integration of MLP, Attention, and BiLSTM leverages the unique strengths of each model to enhance the accuracy, robustness, and adaptability of financial time series forecasting. MLP, as a powerful nonlinear model, efficiently extracts complex features from high-dimensional data, capturing underlying trends in financial data. However, MLP alone struggles with sequential dependencies, limiting its effectiveness in capturing temporal relationships crucial for stock price prediction. The Attention mechanism dynamically adjusts the focus on crucial information, improving the models ability to capture long-term dependencies and handle complex market fluctuations. This addresses a fundamental limitation of traditional deep learning models, such as LSTM, which often suffer from vanishing gradient issues when processing long sequences. For example, Hossein et al. proposed a hybrid LSTM model with multi-head attention, which outperformed traditional Exponential Smoothing Models(ETS) and ARIMA methods in terms of Symmetric Mean Absolute Percentage Error (SMAPE), achieving the highest average ranking and improved predictive capabilities [33]. Bi-LSTM, on the other hand, captures dependencies in both forward and backward directions in the time series, overcoming the limitations of traditional LSTM in handling sequential data and enhancing the model's understanding of both past and future information. Andri et al. also conducted comparative experiments, demonstrating that hybrid models offer significant advantages for time series forecasting [34]. Therefore, the integration of these three models leverages their strengths, enhancing the model's predictive capability and stability when dealing with complex market data.
Accordingly, this paper integrates the Attention mechanism into a Bi-LSTM framework to dynamically adjust the focus on different parts of the sequence, ensuring that pivotal information is captured rather than overlooked. By incorporating an MLP model, we propose the M-A-BiLSTM system to improve information extraction and enhance overall performance in stock market forecasting. Through weighted learning of critical features, the Attention mechanism enables the model to more effectively manage the complex data and nonlinear relationships characteristic of financial markets. The objective of this study is to apply the M-A-BiLSTM model to stock price prediction, further refine the models structure and boost both predictive accuracy and robustness, thereby enhancing its practical value in real-world financial settings.
3 Methodology
For stock price prediction, we integrate Bi-LSTM, MLP, and Attention mechanisms into a unified framework, termed M-A-BiLSTM (M-A-B). By leveraging the complementary strengths of these models, the proposed approach enhances feature extraction and representation, thereby improving the predictive performance and robustness in financial time series forecasting. The overall architecture of the proposed system is illustrated in Figure 1. First, the model employs Bi-LSTM to process the time-series data, capturing the long-term dependencies inherent in stock price fluctuations. Next, the embedded Attention mechanism in Bi-LSTM identifies and emphasizes the most influential historical time steps, allowing the model to focus on the segments most critical to accurate price prediction. Finally, the MLP further refines the features extracted by both Bi-LSTM and Attention and produces the final stock price prediction.
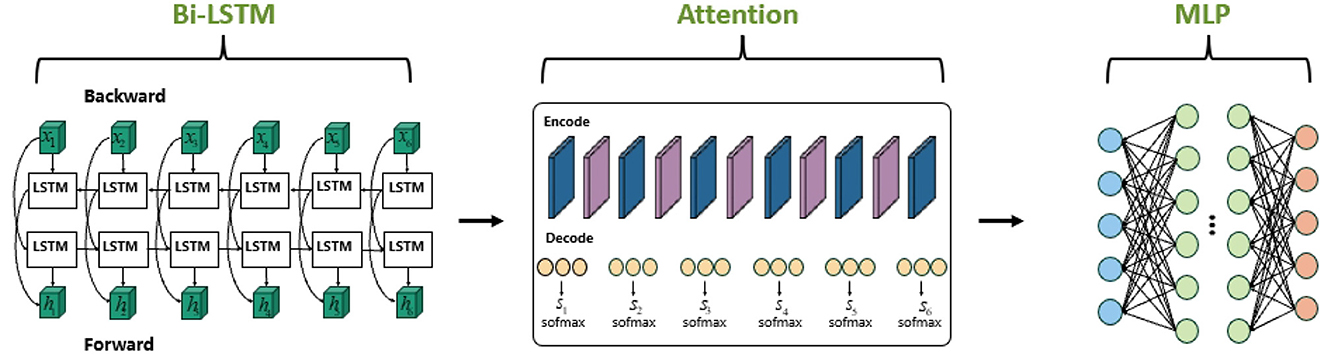
Figure 1. The overall architecture of our approach M-A-BiLSTM.
3.1 LSTM
Long Short-Term Memory (LSTM) networks, a special type of RNN, tackle the vanishing and exploding gradients that occur in traditional RNNs when capturing long-term dependencies. Vanishing gradients make it difficult to update parameters far from the current time step, while exploding gradients cause training instability.
LSTM introduces three gating mechanisms (forget, input, and output) to manage information storage, updating, and forgetting, enabling the effective capture of long-term dependencies. The state transitions and outputs are described by the following equations:
1. Forget gate, Input gate, and Candidate memory cell calculations:
Here, σ is the sigmoid activation, and tanh is the hyperbolic tangent function. Wf, Wi, WC and bf, bi, bC correspond to the weights and biases associated with each respective gate. ht−1 denotes the previous hidden state, and xt is the current input.
2. Memory cell state update:
3. Output gate and Hidden state calculations:
Through these gating mechanisms, LSTM can flexibly control the flow of information, thereby effectively capturing long-term dependencies and overcoming the vanishing and exploding gradient problems present in traditional RNNs.
On the other hand, the Bi-LSTM network extends the standard LSTM by processing input sequences in both forward and backward directions, thus capturing future context that unidirectional LSTMs cannot. Bi-LSTM consists of two LSTM networks: one processes the sequence from start to end, and the other from end to start. Their hidden states are then combined for subsequent processing, enabling a more comprehensive understanding of each time step's context.
The computational process of Bi-LSTM is as follows:
1. Forward LSTM: Similar to the standard LSTM, the forward LSTM processes the sequence starting from the first time step to the last, generating hidden states .
2. Backward LSTM: In contrast to the forward LSTM, the backward LSTM processes the sequence starting from the last time step to the first, generating hidden states .
3. Merge outputs: Finally, Bi-LSTM combines the hidden states from the forward and backward LSTMs to generate the final output. A common approach is to concatenate the hidden states from both directions:
By using a bidirectional structure, the model captures both past and future information, enhancing its ability to interpret temporal data. This is especially useful for tasks like stock price prediction, which depend on both long-term and short-term patterns.
Bi-LSTM overcomes the limitation of standard LSTM, which only captures forward information, improving accuracy and robustness.
3.2 Attention
The Attention mechanism is crucial for processing time series data by computing compatibility scores between queries (q) and key-value (k − v) pairs to determine the relative importance of each value in the output. We integrate this mechanism into the Bi-LSTM model to enhance the model's ability to identify and prioritize critical time-step information, thereby improving prediction accuracy.
First, the LSTM generates hidden states for each time step in the input series, which are then fed into the attention mechanism. These states are subsequently fed into the attention module. The compatibility score between the query and key vectors is calculated via a dot product:
Here, q represents the query vector and k denotes the key vector. Hidden states with higher scores gain more weight, while those with lower scores receive less attention.
Next, the scores are normalized using the Softmax function to yield the weight for each key:
Here, αi denotes the weight assigned to the i-th key under the current query. After normalization, all weights sum to 1, allowing each value to contribute to the final output based on its importance.
Using the Softmax normalized weights, we compute a weighted sum of the value vectors corresponding to each key, resulting in the encoder's final feature vector:
Here, vk is the value vector corresponding to each key, and c is the final context vector, capturing the most useful features for future predictions at the current time step. By focusing on the time steps that matter most, the Attention mechanism enhances predictive performance.
3.3 MLP model
In stock price prediction, the MLP effectively captures nonlinear patterns through hierarchical processing. As a feed-forward network, the MLP processes outputs from the Bi-LSTM and attention layers via fully connected layers to generate final predictions. Each layer applies weight matrices, biases, and non-linear activations to model complex relationships:
Here, x is the input feature vector (from Bi-LSTM and Attention), Wi and bi are the weight matrix and bias for the ith layer (i = 1, 2, ⋯ , L), f(·) is the activation function (e.g., ReLU or Sigmoid), and y is the predicted stock price.
In MLP models, activation functions are crucial. ReLU in hidden layers mitigates the vanishing gradient problem and improves efficiency, while a linear output layer supports continuous predictions in regression tasks. This multi-layer architecture enables robust nonlinear mappings, resulting in accurate stock price forecasts.
3.4 Evaluation metrics
Relying on a single metric often fails to capture a stock price forecasting model's performance fully. Therefore, this study employs multiple statistical indicators Mean Squared Error (MSE), Root Mean Squared Error (RMSE), and the coefficient of determination (R2)—to evaluate predictive accuracy. MSE measures the average squared error, and RMSE is its square root for a more intuitive scale. R2 indicates how much variance in the data is explained by the model, with higher values signifying better fit. By combining these metrics, we gain a more comprehensive assessment of each models stability and accuracy.
1. Mean Squared Error (MSE)
Where n is the number of samples, yi is the true value of the i-th sample, and ŷi is the predicted value. MSE measures the average squared deviation between predictions and true values, with a smaller value indicating higher accuracy.
2. Root Mean Squared Error (RMSE)
Since RMSE is the square root of MSE, it shares the same units as the original target variable, which makes it more interpretable in practical scenarios. A smaller RMSE value indicates that the model's predictions deviate less from the true values.
3. Coefficient of determination (R2)
where is the mean of the actual values. The closer R2 is to 1, the stronger the model's capacity to explain the variation in the dataset, leading to higher predictive accuracy.
4 Experiments
4.1 Dataset
We evaluate our model using decade-long stock data [35] from Apple, Tesla, Snapchat, and ExxonMobil (XOM). Details are summarized in Table 1. Apple, Inc. is a global technology company engaged in the design, manufacturing, and marketing of a wide range of electronic products, including smartphones, personal computers, tablets, wearables, and accessories. The dataset used in this study contains historical stock price data for Apple, Inc. spanning from October 30, 2000, to October 17, 2021. Tesla, Inc. is an American company specializing in electric vehicles and sustainable energy solutions, headquartered in Palo Alto, CA, USA, and engaged in the production of solar panels, solar roof tiles, and other energy-related products and services. The dataset comprises historical stock price data for Tesla, Inc. from June 29, 2010, to October 27, 2021. Snapchat, a social media platform, represents a relatively new company compared to the others, with its dataset including 3 years and 9 months of stock price data from February 3, 2017, to November 11, 2021. ExxonMobil, a major oil company formed from the merger of Exxon and Mobil, has a dataset covering historical stock price data from January 3, 2000, to December 7, 2021. To ensure a rigorous evaluation, we partition each dataset into training, validation, and test sets, allocating 70% of the data for training, 15% for validation, and 15% for testing. The test set remains entirely unseen by the model during training, ensuring an unbiased assessment of predictive performance.
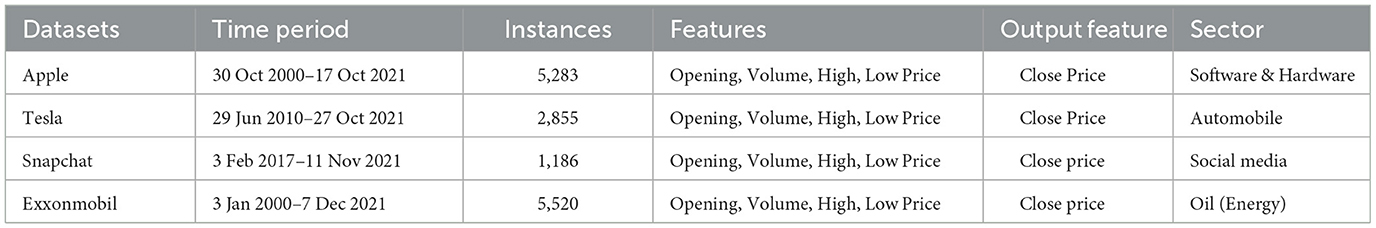
Table 1. Datasets information.
4.2 Baseline methods
We compare our M-A-BiLSTM with the following baselines: (1) MLP [36]: A predictive model composed of stacked perceptrons, capable of learning complex nonlinear relationships in financial time series data; (2) LSTM [37]: A specialized recurrent neural network (RNN) model designed for long-term memory retention, widely applied in stock market prediction and portfolio management by leveraging historical time-series data; (3) GRU [38]: A gated recurrent unit (GRU) model, which is a more computationally efficient variant of LSTM, specifically developed to capture both short-term and long-term dependencies in sequential data; (4) CNN [39]: A convolutional neural network model that applies convolutional and pooling operations to extract spatial patterns from financial time series, enabling analysis across multiple market datasets; (5) Bi-LSTM [40]: A bidirectional LSTM model that enhances the capture of complex temporal dependencies by processing sequential data in both forward and backward directions; (6) CNN-LSTM [35]: A hybrid model integrating CNN and LSTM architectures, leveraging CNN's feature extraction capabilities with LSTM's sequential modeling for improved financial time-series forecasting; (7) MLP-BiLSTM [20]: A hybrid predictive model combining MLP and Bi-LSTM networks to enhance feature extraction and sequential learning in stock price prediction; (8) Attention-BiLSTM [14]: A hybrid model integrating the Attention mechanism with Bi-LSTM, enabling the model to focus on critical temporal patterns while mitigating noise, thereby improving predictive accuracy in financial time series.
4.3 Experiment settings
We partition the dataset into training, validation, and test sets in a 7:1.5:1.5 ratio. All experiments are conducted on a Windows server [CPU: 12th Gen Intel(R) Core(TM) i5-1240P @ 1.70 GHz, GPU: Intel(R) Iris(R) Xe Graphics]. The model is implemented using PyTorch. Through our experiments, we set the following hyperparameters: K = 3. The sizes of the M-GTU convolution kernels along the time dimension {S1, S2, S3} are {3, 5, 8}, and the window size W for the pooling layer is 3. The number of attention heads in the temporal attention module is 3, and d = 64 in the spatiotemporal attention module. Weight initialization follows Xavier initialization. We use the Adam optimizer to train our model, with the number of epochs set to 64, the learning rate to 1 × 10⁻⁵, and the batch size to 64. For different datasets, we set the same hidden layer size of 1024, and we use MSE, RMSE, and R2 to measure the model's performance. Additionally, for the ablation study, all models are trained under the same experimental setup, maintaining consistent parameters.
4.4 Experiment results and analysis
The detailed experimental results, shown in Tables 2–5 and Figures 2, 3, indicate that our M-A-BiLSTM (M-A-B) model outperforms several other models across all evaluation metrics. Notably, on the Snapchat, Xom, Tesla, and Apple datasets, the M-A-B model not only achieves MSE and RMSE but also yields higher coefficients of determination R2. These results suggest that, compared with other models, the M-A-B model provides more accurate stock price trend predictions.
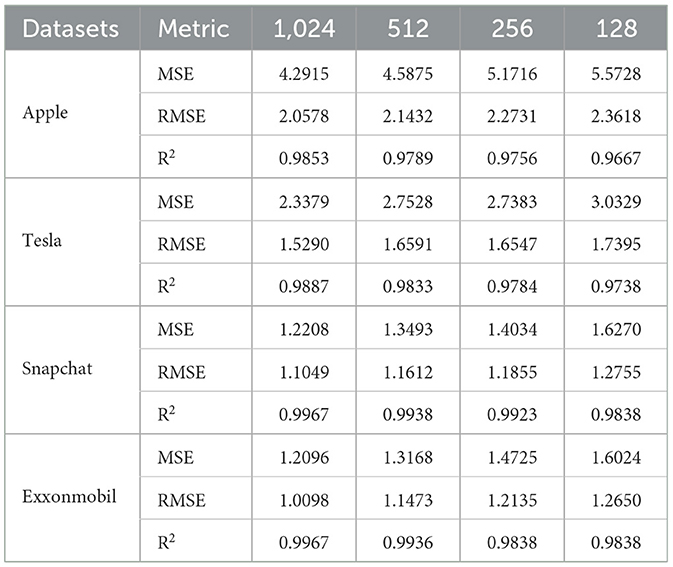
Table 2. Training results of our model with different numbers of hidden layers.
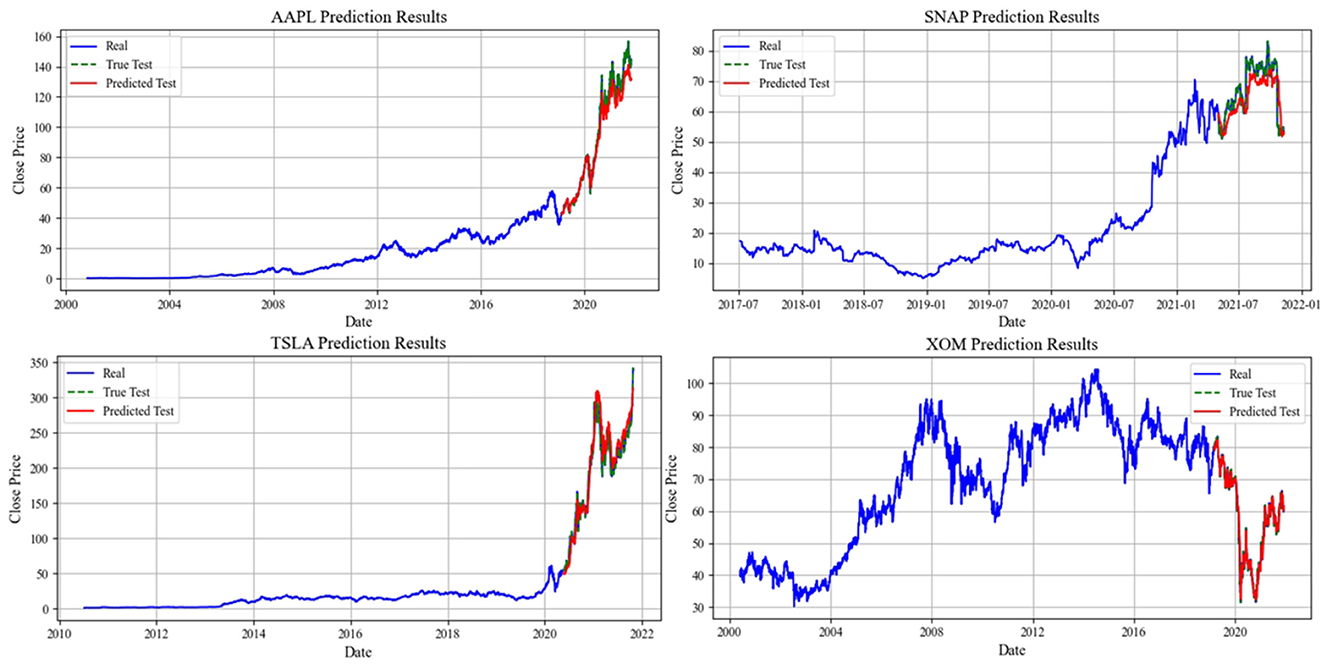
Figure 2. Figures of the M-A-BiLSTM model's prediction performance on four datasets.
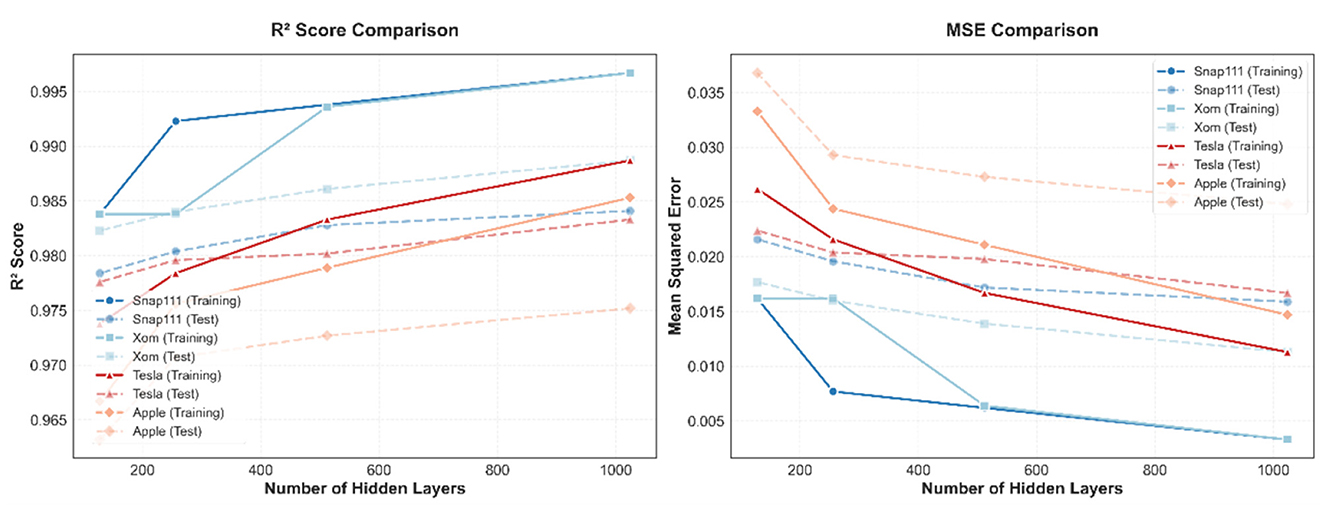
Figure 3. A comparative visualization of the M-A-BiLSTM model's performance: R2 and MSE metrics on training and test sets for four diverse datasets.
Specifically, on the Apple dataset, our model reduces MSE by up to 6.69% compared to other models, by 8.28% compared to the Attention-Bi-LSTM model, and by 11.56% compared to the BiLSTM model. On the Xom dataset, our model's R2 measure improves by at least 0.77% over other models, with the M-A-B model in particular outperforming Bi-LSTM by 1.45% and CNN-LSTM by 1.35%.
4.4.1 Hyperparameter tuning experiment
Throughout our experiments, we observed that the hidden layer size significantly influences model performance. Consequently, we evaluated our novel M-A-BiLSTM model on four different datasets, testing various hidden layer sizes (1,024, 512, 256, 128) using the training set to identify the optimal configuration. The detailed experimental outcomes are summarized in Table 2.
From the experimental results in Table 2, we observe that as the hidden layer size increases, the MSE and RMSE values decrease, whereas the R2 value rises. This trend indicates that larger hidden layer sizes lead to improved model performance. Consequently, we set the Bi-LSTM module's hidden layer size in the M-A-BiLSTM model to 1,024 for all subsequent experiments.
4.4.2 Ablation experiment
To systematically evaluate the contribution of each module to the overall performance of our proposed model, we conducted an ablation study using four different datasets. Specifically, to assess the impact of the Attention module within the M-A-BiLSTM architecture, we removed it from our model, resulting in the MLP-BiLSTM variant. Similarly, to examine the role of the MLP module, we removed it and denoted the resulting model as Attention-BiLSTM. Furthermore, to analyze the combined effect of both the MLP and Attention modules, we eliminated both components, leaving only the BiLSTM module as the baseline configuration. The results of these experiments, presented in Tables 3, 4, provide insight into the contribution of each module to the overall model performance.
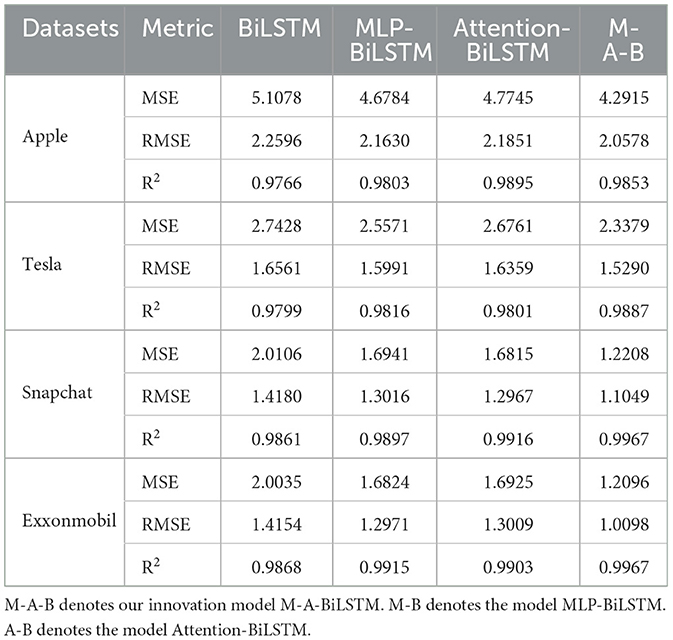
Table 3. Ablation study results on the training set.
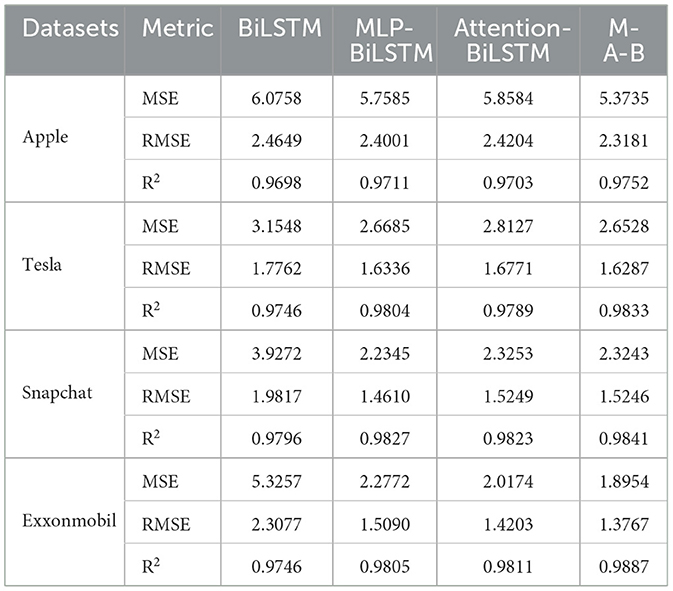
Table 4. Ablation study results on the test set.
As shown in Tables 3, 4, the M-A-BiLSTM model consistently achieves the best performance on both the training and test sets. We also observe that the MLP and Attention modules play pivotal roles in the model's overall effectiveness. Notably, removing the Attention module-resulting in the MLP-BiLSTM (M-B) variant—significantly degrades performance across all metrics, underscoring the importance of the Attention mechanism in capturing long-range dependencies and salient features. Likewise, omitting the MLP module from the Attention-BiLSTM (producing the A-B variant) also reduces performance, albeit to a lesser extent. In sum, both the MLP and Attention modules are vital for enhancing predictive accuracy and robustness. These findings validate the efficacy of our proposed deep learning framework—combining a Multilayer Perceptron (MLP) and Attention mechanism—for financial time series forecasting tasks.
4.4.3 Comparative experiments
To validate the efficacy of our newly proposed M-A-BiLSTM (M-A-B) model, we conducted comparative experiments on four different datasets, benchmarking it against several state-of-the-art algorithms. The results of these experiments are presented in Tables 5, 6.
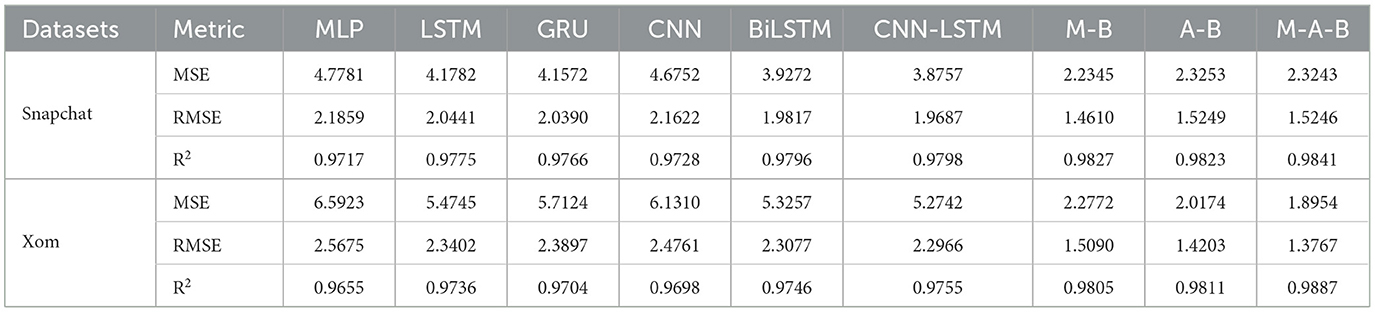
Table 5. The testing results are based on MLP-Attention-BiLSTM.
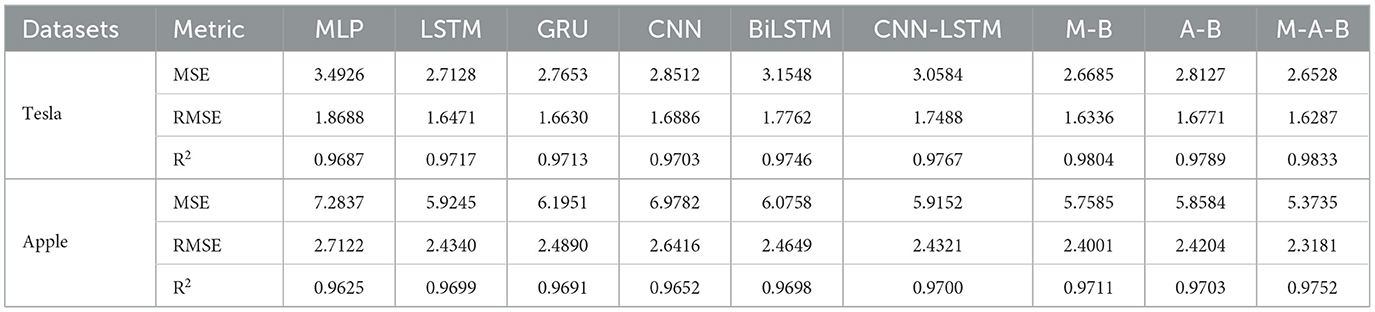
Table 6. The testing results are based on MLP-Attention-BiLSTM.
From Table 5, it is evident that our M-A-BiLSTM (M-A-B) model outperforms the other models on both the Snapchat and Xom datasets. Notably, for the Xom dataset, the Mean Squared Error (MSE) decreases from 5.7124 (GRU) and 5.2742 (CNN-LSTM) to 1.8954—a substantial reduction—while the coefficient of determination (R2) increases from 0.9704 and 0.9755 to 0.9887, representing an improvement of over 2.2%. Among all the evaluated models, our M-A-B approach demonstrates the strongest performance.
From Table 6, it is evident that our M-A-B model surpasses other advanced algorithms on both the Tesla and Apple datasets. In the Tesla dataset, the MSE decreases from 3.1548 to 2.6528—a 15.91% reduction compared with the Bi-LSTM model. For the Apple dataset, the R2 shifts from 2.4649 to 2.3181, reflecting a 5.95% improvement over Bi-LSTM. Overall, these results demonstrate that our model achieves notably better performance relative to multiple other models on both datasets.
From the experimental results presented in Tables 5, 6, it is clear that our M-A-B model outperforms other methods across all four datasets. For every evaluation metric (MSE, RMSE, and R2), the M-A-B model exhibits a marked improvement. Notably, it attains the highest R2 values on all datasets, underscoring its advantages in predictive accuracy and robustness. Furthermore, we conducted Wilcoxon Signed-Rank tests on MSE and RMSE across all models, with results indicating that p < 0.05 in all cases. These findings suggest that our proposed model captures the underlying patterns in the data more effectively. Furthermore, the incorporation of the Attention mechanism strengthens the model's ability to handle time series data, particularly by addressing long-term dependencies and highlighting critical features, thereby fully leveraging its capabilities.
5 Discussion
Figure 2 presents a visualization of the M-A-BiLSTM model's sequential predictions across four datasets, demonstrating its superior performance compared to the baseline models. Notably, on the Tesla and ExxonMobil datasets, the predicted stock price trends closely align with the actual market movements, with a prediction horizon extending beyond one year. Tesla's dataset, in particular, poses a significant challenge due to its high volatility in market capitalization and stock prices. Nevertheless, as shown in Figure 2, the model exhibits strong long-term predictive capabilities. However, its performance on the Apple and Snapchat datasets reveals areas for potential improvement. Enhancing the model's predictive accuracy on these datasets will be a key focus of our future work.
Additionally, to investigate the impact of different hidden layer sizes on the overall model performance, we visualize the model's training and testing performance across various datasets under different numbers of hidden layers (see Figure 3). The results indicate that as the number of hidden layers increases, predictive performance improves—evidenced by higher R2 values and lower MSE values. This trend suggests that a deeper network enhances the model's capacity for feature extraction and representation. Across all datasets, the proposed model exhibits consistent results on both training and testing sets, underscoring its stability and robustness. However, for the Apple dataset, the difference in MSE metrics between training and testing grows with additional hidden layers, indicating that further improvement in model robustness may be required for this dataset.
Despite the strong performance demonstrated in the above experiments, certain datasets—most notably Apple and Snapchat—still reveal areas for improvement, particularly regarding the handling of local anomalies and the generalization of long-term trends.
6 Conclusion
In this study, we introduced a novel MLP-Attention-BiLSTM model for stock price prediction. Through a series of rigorous experiments on four distinct datasets, we evaluated the performance of the model and compared it with several baseline models. The experimental results indicate that the M-A-B model outperforms the baseline models in terms of MSE, RMSE, and R2. The ablation experiment underscores the essential roles of both the MLP and Attention modules in the model's performance, highlighting the significance of integrating local feature extraction, long—term dependency capture, and attention—based information selection. The hyperparameter tuning experiment demonstrates that the hidden layer size significantly affects the model's performance. By setting the hidden layer size to 1,024, we achieved optimal performance across all datasets. In conclusion, the MLP-Attention-BiLSTM model offers a promising approach for stock price prediction. Its ability to capture both local and global features in financial time - series data makes it a powerful tool for financial forecasting. Future research could focus on further optimizing the model's hyperparameters, exploring more sophisticated network architectures, and applying the model to a broader range of financial time—series data.
Data availability statement
Publicly available datasets were analyzed in this study. This data can be found at: https://finance.yahoo.com/.
Author contributions
ZL: Formal analysis, Methodology, Writing – original draft.
Funding
The author declares that no financial support was received for the research and/or publication of this article.
Conflict of interest
The author declares that the research was conducted in the absence of any commercial or financial relationships that could be construed as a potential conflict of interest.
Generative AI statement
The author(s) declare that no Gen AI was used in the creation of this manuscript.
Publisher's note
All claims expressed in this article are solely those of the authors and do not necessarily represent those of their affiliated organizations, or those of the publisher, the editors and the reviewers. Any product that may be evaluated in this article, or claim that may be made by its manufacturer, is not guaranteed or endorsed by the publisher.
References
1. Al Qaisi F, Tahtamouni A, Al-Qudah M. Factors affecting the market stock price-The case of the insurance companies listed in Amman Stock Exchange. Int J Bus Soc Sci. (2016) 7:81–90.
2. Gandhmal DP, Kumar K. Systematic analysis and review of stock market prediction techniques. Comput Sci Rev. (2019) 34:100190. doi: 10.1016/j.cosrev.2019.08.001
3. Corizzo R, Rosen J. Stock market prediction with time series data and news headlines: a stacking ensemble approach. J Intell Inf Syst. (2024) 62:27–56. doi: 10.1007/s10844-023-00804-1
4. Lawrence R. Using neural networks to forecast stock market prices. Univ Manitoba. (1997) 333:2013.
5. Kim KJ, Han I. Genetic algorithms approach to feature discretization in artificial neural networks for the prediction of stock price index. Expert Syst Applic. (2000) 19:125–132. doi: 10.1016/S0957-4174(00)00027-0
6. Bhattacharjee I, Bhattacharja P. Stock price prediction: a comparative study between traditional statistical approach and machine learning approach. In: 2019 4th International Conference on Electrical Information and Communication Technology (EICT). IEEE (2019). p. 1–6. doi: 10.1109/EICT48899.2019.9068850
7. Lu W, Li J, Wang J, Qin L. A CNN-BiLSTM-AM method for stock price prediction. Neural Comput Applic. (2021) 33:4741–53. doi: 10.1007/s00521-020-05532-z
8. Ali SS, Mubeen M, Hussain A. Prediction of stock performance by using logistic regression model: evidence from Pakistan Stock Exchange (PSX). In: Patron of the Conference. (2018).
9. Gao Y, Wang R, Zhou E. Stock prediction based on optimized LSTM and GRU models. Sci Program. (2021) 2021:4055281. doi: 10.1155/2021/4055281
10. Wang J, Hong S, Dong Y, Li Z, Hu J. Predicting stock market trends using LSTM networks: overcoming RNN limitations for improved financial forecasting. J Comput Sci Softw Applic. (2024) 4:1–7.
11. Siami-Namini S, Tavakoli N, Namin AS. The performance of LSTM and BiLSTM in forecasting time series. In: 2019 IEEE International conference on big data (Big Data). IEEE (2019). p. 3285–3292. doi: 10.1109/BigData47090.2019.9005997
12. Alizadegan H, Rashidi Malki B, Radmehr A, Karimi H, Ilani MA. Comparative study of long short-term memory (LSTM), bidirectional LSTM, and traditional machine learning approaches for energy consumption prediction. Energy Explor Exploit. (2025) 43:281–301. doi: 10.1177/01445987241269496
13. Niu Z, Zhong G, Yu H, A. review on the attention mechanism of deep learning. Neurocomputing. (2021) 452:48–62. doi: 10.1016/j.neucom.2021.03.091
14. Dai H, Wang W, Cao J, Wu H. A Deep Neural Network for Stock Price Prediction. In: Journal of Physics: Conference Series. IOP Publishing (2021). p. 012029. doi: 10.1088/1742-6596/1994/1/012029
15. Rusho MA, Azizova R, Mykhalevskiy D, Karyonov M, Hasanova H. Advanced earthquake prediction: unifying networks, algorithms, and attention-driven lstm modelling. GEOMATE J. (2024) 27:135–42. doi: 10.21660/2024.119.m2415
16. Oyewola DO, Akinwunmi SA, Omotehinwa TO. Deep LSTM and LSTM-Attention Q-learning based reinforcement learning in oil and gas sector prediction. Knowl-Based Syst. (2024) 284:111290. doi: 10.1016/j.knosys.2023.111290
17. Li S, Xu S. Enhancing stock price prediction using GANs and transformer-based attention mechanisms. Empir Econ. (2025) 68:373–403. doi: 10.1007/s00181-024-02644-6
18. Tashakkori A, Talebzadeh M, Salboukh F, Deshmukh L. Forecasting gold prices with MLP neural networks: a machine learning approach. Int J Sci Eng Applic. (2024) 13:13–20.
19. Chen SA, Li CL, Yoder N, Arik SO, Pfister T. Tsmixer: an all-mlp architecture for time series forecasting. arXiv preprint arXiv:230306053 (2023).
20. Badal MKI, Saha S. Performance analysis of deep neural network models for weather forecasting in Bangladesh. In: Proceedings of the Third International Conference on Trends in Computational and Cognitive Engineering: TCCE 2021. Springer (2022). p. 81–92. doi: 10.1007/978-981-16-7597-3_7
21. Mohammadi M, Jamshidi S, Rezvanian A, Gheisari M, Kumar A. Advanced fusion of MTM-LSTM and MLP models for time series forecasting: an application for forecasting the solar radiation. Measur Sensors. (2024) 33:101179. doi: 10.1016/j.measen.2024.101179
22. Liu S, Xu M, Zhao J, Su L. BiLSTM-MLP based hysteresis modeling for soft pneumatic joint actuator. Proc Inst Mechan Eng Part C. (2024) 238:7705–7718. doi: 10.1177/09544062241233924
23. Ye W, Yang J, Chen P. Short-term stock price trend prediction with imaging high frequency limit order book data. Int J Forecast. (2024) 40:1189–205. doi: 10.1016/j.ijforecast.2023.10.008
24. Zhang K, Zhong G, Dong J, Wang S, Wang Y. Stock market prediction based on generative adversarial network. Procedia Comput Sci. (2019) 147:400–6. doi: 10.1016/j.procs.2019.01.256
25. Sathish S, Kiran G. Stock price prediction with LSTM based deep learning techniques. Int J Adv Sci Innov. (2021) 2:18–21.
26. Shah J, Jain R, Jolly V, Godbole A. Stock market prediction using bi-directional LSTM. In: 2021 International Conference on Communication information and Computing Technology (ICCICT). IEEE (2021). p. 1–5. doi: 10.1109/ICCICT50803.2021.9510147
27. Sang S, Li L. A stock prediction method based on heterogeneous bidirectional LSTM. Appl Sci. (2024) 14:9158. doi: 10.3390/app14209158
28. Sunny MAI, Maswood MMS, Alharbi AG. Deep learning-based stock price prediction using LSTM and bi-directional LSTM model. In: 2020 2nd Novel Intelligent and Leading Emerging Sciences Conference (NILES). IEEE (2020). p. 87–92. doi: 10.1109/NILES50944.2020.9257950
29. Chen Q, Zhang W, Lou Y. Forecasting stock prices using a hybrid deep learning model integrating attention mechanism, multi-layer perceptron, and bidirectional long-short term memory neural network. IEEE Access. (2020) 8:117365–76. doi: 10.1109/ACCESS.2020.3004284
30. Vaswani A. Attention is all you need. In: Advances in Neural Information Processing Systems (2017).
31. Mu S, Liu B, Gu J, Lien C, Nadia N. Research on stock index prediction based on the spatiotemporal attention BiLSTM model. Mathematics. (2024) 12:2812. doi: 10.3390/math12182812
32. Luo J, Zhang X. Convolutional neural network based on attention mechanism and Bi-LSTM for bearing remaining life prediction. Appl Intell. (2022) 52:1076–1091. doi: 10.1007/s10489-021-02503-2
33. Abbasimehr H, Paki R. Improving time series forecasting using LSTM and attention models. J Ambient Intell Humaniz Comput. (2022) 13:673–91. doi: 10.1007/s12652-020-02761-x
34. Pranolo A, Mao Y, Wibawa AP, Utama ABP, Dwiyanto FA. Robust LSTM with tuned-PSO and bifold-attention mechanism for analyzing multivariate time-series. IEEE Access. (2022) 10:78423–34. doi: 10.1109/ACCESS.2022.3193643
35. Alkhatib K, Khazaleh H, Alkhazaleh HA, Alsoud AR, Abualigah L. A new stock price forecasting method using active deep learning approach. J Open Innov. (2022) 8:96. doi: 10.3390/joitmc8020096
36. Boniecki P, Zaborowicz M, Pilarska A, Piekarska-Boniecka H. Identification process of selected graphic features apple tree pests by neural models type MLP, RBF and DNN. Agriculture. (2020) 10:218. doi: 10.3390/agriculture10060218
37. Pawar K, Jalem RS, Tiwari V. Stock market price prediction using LSTM RNN. In: Emerging Trends in Expert Applications and Security: Proceedings of ICETEAS 2018. Springer (2019). p. 493–503. doi: 10.1007/978-981-13-2285-3_58
38. Choe DE, Kim HC, Kim MH. Sequence-based modeling of deep learning with LSTM and GRU networks for structural damage detection of floating offshore wind turbine blades. Renewable Energy. (2021) 174:218–35. doi: 10.1016/j.renene.2021.04.025
39. Hoseinzade E, Haratizadeh S. CNNpred: CNN-based stock market prediction using a diverse set of variables. Expert Syst Appl. (2019) 129:273–85. doi: 10.1016/j.eswa.2019.03.029
Keywords: stock price prediction, deep learning, Bi-LSTM, MLP, attention
Citation: Liu Z (2025) Improving stock price forecasting with M-A-BiLSTM: a novel approach. Front. Appl. Math. Stat. 11:1588202. doi: 10.3389/fams.2025.1588202
Received: 05 March 2025; Accepted: 10 April 2025;
Published: 04 June 2025.
Edited by:
Andrea Mazzon, University of Verona, ItalyReviewed by:
Marina Resta, University of Genoa, ItalyDragos Bozdog, Stevens Institute of Technology, United States
Copyright © 2025 Liu. This is an open-access article distributed under the terms of the Creative Commons Attribution License (CC BY). The use, distribution or reproduction in other forums is permitted, provided the original author(s) and the copyright owner(s) are credited and that the original publication in this journal is cited, in accordance with accepted academic practice. No use, distribution or reproduction is permitted which does not comply with these terms.
*Correspondence: Zihan Liu, bGl1emloYW4zMDU5QHN0dS5vdWMuZWR1LmNu