 W. K. Peterson
- Laboratory for Atmospheric and Space Physics, University of Colorado, Boulder, CO, United States
Atmospheric photoelectrons are central to the production of planetary ionospheres. They are created by photoionization of the neutral planetary atmosphere by solar EUV and soft X-ray irradiance. They provide the energy to heat the thermosphere. Thermalized photoelectrons permeate magnetospheres creating polarization electric fields and plasma waves as they interact with ions to maintain charge neutrality. Energetic photoelectrons (>1 eV) have a distinctive energy spectral shape as first revealed in data from the Atmosphere Explorer satellites. Energetic photoelectrons escaping the ionosphere follow local magnetic fields illuminating the planet's magnetic topology. Current models using state-of-the-art EUV observations accurately capture their production and transport. However, in spite of 60 years of space research the electron thermalization processes occurring below 1 eV at low altitudes in planetary thermospheres are not understood quantitatively. Results from event analysis of data from the Mars Atmosphere and Volatile Evolution (MAVEN) mission are not consistent with current models of photoelectron thermalization. The lack of quantitative understanding reflects the complexity of the physics and the lack of a large data base of simultaneous neutral, ion, and electron densities and temperatures in lower planetary thermospheres.
Introduction
Electrons in the atmosphere were investigated by Chapman (1931) and by early radio scientists who inferred the existence of an ionized region surrounding the Earth created by the absorption of radiation from the sun. Early observations of the solar EUV irradiance (e.g., Rense, 1953) and atmospheric photoelectrons (e.g., Hinteregger et al., 1959) demonstrated the need for simultaneous, space based, observations of key ionospheric parameters over all local times and latitudes. NASA addressed this need in the early 1970's with the Atmosphere Explorer (AE) -C, -D, and -E satellites (Dalgarno et al., 1973). The AE satellites provided calibrated measurements of the solar EUV flux, the neutral atmosphere, and ionized components including atmospheric photoelectrons. These data supported the explosion of thermospheric research summarized in Schunk and Nagy (2009).
Current and planned NASA missions investigating planetary thermosheres are focused on understanding energy transport but do not directly address energy transfer associated with electron thermalization. The measurement techniques required to observe energetic (>1 eV) and thermalized (<10,000 °K) photoelectrons have improved since AE. However, there is no systematic investigation of simultaneous in-situ electron fluxes spanning the energy range between energetic electrons measured by particle detectors and thermal electrons, measured by Langmuir probes or radars.
I participated in the Atmosphere Explorer mission at the beginning of my career and the Mars Atmosphere and Volatile Evolution (MAVEN) mission to the Martian thermosphere near the end. Here I provide my perspective on observations and models of production, transport, and thermalization of atmospheric photoelectrons. Because of space limitations I'll focus primarily on published observations. The selection of data and models discussed is representative, not complete. Specifically, we do not address the optical observations such as those from NASA's GOLD satellite that use and test models of photoelectron production and transport (e.g., Solomon et al., 2020).
Observations
Figure 1 shows an overview of atmospheric photoelectron observations and selected model outputs from the AE (Dalgarno et al., 1973, inset panel B), Fast Auroral SnapshoT (FAST, Carlson et al., 1998a, inset panel C), and the MAVEN (Jakosky et al., 2015, panel A) satellites. The AE and FAST satellites sampled the Earth's ionosphere; the MAVEN satellite sampled the Martian ionosphere. Each panel shows electron flux in units of (cm2-s-sr-eV)−1 as a function of energy in units of eV. The MAVEN data shown in panel A cover the energy range from 0.01 to 1,000 eV and the flux range from 1 to 1025 (cm2-s-sr-eV)−1, spanning both the thermal and energetic ranges. Panels B and C span sub sets of these ranges as indicated by the broad colored lines along the respective axes. In the next few paragraphs the data in Figure 1 are discussed in the order they were acquired, i.e., AE, FAST, and then MAVEN.
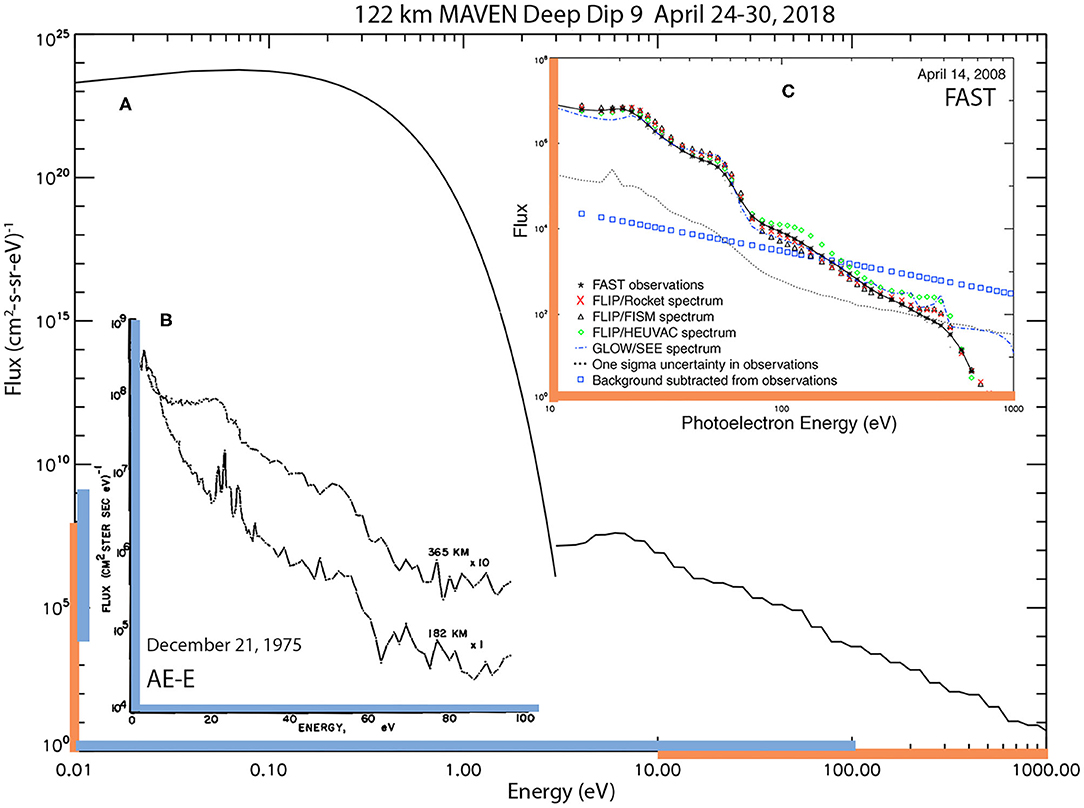
Figure 1. Photoelectron energy spectra in units of number flux (cm2-s-sr-eV)−1 vs. energy from MAVEN (A), AE-E (B), and FAST (C). MAVEN data were acquired at 122 km, below the region of maximum photoelectron production. AE-E data were acquired at 182 and 365 km near and above the region of maximum photoelectron production. FAST data were acquired above 1,000 km in the source cone as described in the text. The number flux ranges for AE-E (blue) and FAST (orange) are sub sets of the MAVEN range as indicated. The AE-E energy scale (blue) is linear; it is logarithmic for FAST (orange) and MAVEN. The solar zenith angles (SZA) for AE-E observations presented are 50° at 182 km and 37° at 365 km. For MAVEN it is 54° at 122 km. For FAST, above 1,000 and for SZA's <90° Peterson et al. (2008) demonstrated that the escaping photoelectron flux is insensitive to the SZA.
The AE-E data in panel B are reproduced from Doering et al. (1976). The low altitude spectral features in the 20–30 eV range are produced by the ionization of O and N2 into various energy states by the intense solar irradiance at 30.4 nm. Doering et al. show that the strength of the emission features from O and N2 as a function of altitude follows the changes in both absolute density and composition. Doering noted that the ~20–30 eV features are smeared out at higher altitudes because the increasing fractional ionization enhances electron-electron collisions. He noted that there is a strong decrease in the spectrum near 60 eV which we now know corresponds to a large decrease in solar irradiance below ~16 nm (e.g., Woods et al., 2008). Doering et al. were able to determine the absolute spacecraft potential using energy resolved observations of the 20–30 eV emission lines (Lee et al., 1978). A comprehensive summary of the photoelectron data obtained from the AE satellites was published by Lee et al. (1980a,b).
Above 60 eV the signal in panel B is dominated by instrument noise. Winningham et al. (1989) extended the energy range of photoelectron observations to ~1,000 eV using a more sensitive electron spectrometer with coarser energy resolution. Thousand-eV photoelectrons are produced by the solar soft X-ray flux near 1 nm. Winningham et al. pointed out that the existing observations of the solar flux in the EUV and soft X-ray ranges were inconsistent with their photoelectron observations. This point will be addressed in the section addressing models below.
The data in panel C of Figure 1 are the daily averaged photoelectron flux measurements acquired above 1,000 km during apogee passes of the FAST satellite equatorward of the auroral zone on April 14, 2008 reproduced from Peterson et al. (2009). These data were acquired in the “source cone.” Figure 2 illustrates the “source cone” concept. It displays data from one of the passes included in the average shown in panel C of Figure 1. The FAST electron analyzer has a 360° field of view. The top panel in Figure 2 shows energy spectra averaged over all angles as a function of time. The bottom panel shows angular spectra averaged over the energy range of 100–12,000 eV. As noted above, the daily average photoelectron spectrum shown in Figure 1, Panel C does not include spectra obtained in the polar cap and auroral zone (such as before 19:17 UT in the orbit pass shown in Figure 2). The widest band in the lower panel, centered on 180°, is created by energetic photoelectrons produced in the ionosphere below the satellite. The angular width of the band is called the source cone. It is determined by the relative strengths of the magnetic field at the satellite and at the top of the ionosphere, respectively. A weaker band centered on 0° is created by photoelectrons coming from the magnetically conjugate hemisphere (See, for example, Peterson et al., 1977a).
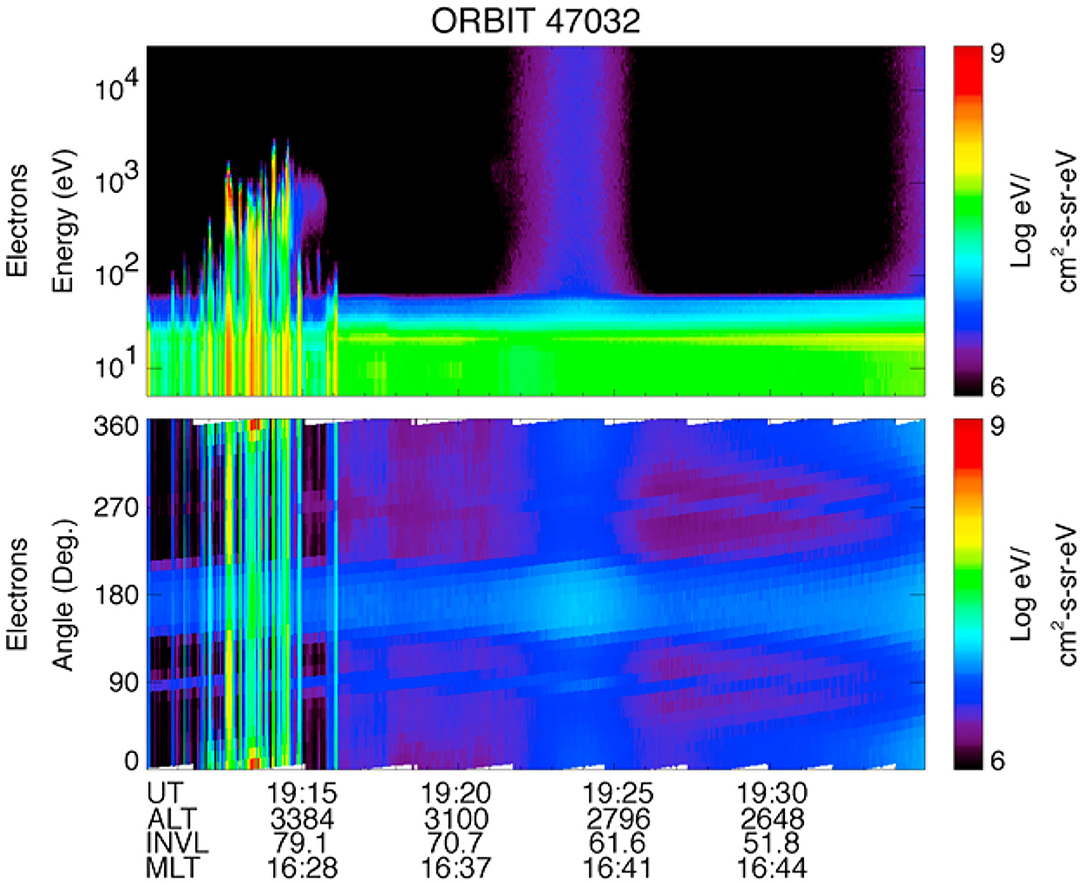
Figure 2. Photoelectron energy flux energy-time (top) and angle-time (bottom) spectrograms from the FAST satellite on April 14, 2008, in units of (cm2-s-sr)−1, are shown by the color bars. Electron pitch angle β in the range 0–180 is related to the angle shown as β = min(ϕ, 360 − ϕ) where ϕ is the angle shown.
Note that the photoelectron flux in the source cone in units of (cm2-s-sr-eV)−1 above the ionosphere is independent of altitude because of magnetic focusing associated with the source cone formation, as the width of the source cone decreases while the area of the magnetic flux tube increases with increasing altitude. The narrow bands near 90 and 270° come from photoelectrons produced on the spacecraft surface. The vertical bands between 19:20 and 19:25 UT are the noise signal produced by energetic ring current particles that penetrate instrumental shielding.
Peterson et al. (2009) assembled daily averaged photoelectron spectra from within the source cone, corrected individual spectra for spacecraft potential variations and the background from penetrating radiation. The solid black line in panel C of Figure 1 reports the daily average spectrum for April 14, 2008. The square boxes show the magnitude of the correction for penetrating radiation and the dotted line indicates the estimated one sigma uncertainty of the average spectrum shown. We defer discussion of the model results shown in panel C to the modeling section below.
The data in Figure 1, Panel A span 25 orders of magnitude in flux and 5 orders of magnitude in energy. They include thermal electrons with temperatures of <1 eV or 1.16 · 104 °K. The electron data below 3 eV were obtained at Mars from the Langmuir Probe and Waves (LPW) instrument on MAVEN (Andersson et al., 2015). They are presented as a Maxwellian distribution representing the average electron density (1.2 · 105 cm−3) and average electron temperature (760 °K) observed between 120 and 125 km from April 24 to 30, 2018 during the deep dip #9 interval (Peterson et al., 2020). Above 3 eV the data are from the MAVEN Solar Wind Electron Analyzer (SWEA) instrument (Mitchell et al., 2016) averaged over the same intervals.
Global Information Obtained From Localized Photoelectron Observations
The energetic photoelectron energy spectrum is non-thermal and distinct from those found in the solar wind or the magnetosheath. The extremely intense solar He 30.4 nm irradiance produces narrow peaks in the 20–30 eV range that are easily detected by instruments with sufficient energy resolution, as shown in panel B of Figure 1. Above ~60 eV the energy spectrum decreases by almost an order of magnitude corresponding to a decrease in the solar irradiance spectra at ~15 nm. At higher energies (~500 eV) emission peaks have been detected in the photoelectron spectra at Mars (Mitchell et al., 2000). These emission features are the result of the production of Auger electrons from atomic oxygen by soft X rays from the sun.
These distinct features in the photoelectron energy spectra allow investigators to use them to trace magnetic field lines, determine global magnetic topology, determine spacecraft potential, infer potential drops along magnetic field lines, and monitor variations in solar extreme ultraviolet (EUV) irradiance. Coates et al. (2011) and others have used instruments with high energy resolution in the 20–30 eV range to identify photoelectrons at large distances from their sources on Venus, Mars, and Titan. Weber et al. (2020), Xu et al. (2019), and others have used instruments with higher sensitivity but coarser energy resolution than those used by Coates et al. to trace and explore the influences and dynamics associated with Martian crustal magnetic fields and their interaction with the solar wind magnetic field. Peterson et al. (1977a,b) used photoelectron energy spectra to identify photoelectrons originating in the magnetically conjugate hemisphere and place limits on the inter-hemispherical potential difference. Peterson et al. (2009, 2012) used photoelectrons to infer solar EUV and XUV energy input to the thermosphere on both solar flare and solar rotation time scales. Richards and Peterson (2008) directly measured the fraction of conjugate photoelectrons backscattered from the dark hemisphere.
Models of Photoelectron Production, Transport, and Thermalization
Initial comparisons of AE photoelectron fluxes and those calculated from AE neutral density and solar EUV measurements were presented by Nagy et al. (1977). Subsequent analysis by Richards and Torr (1984) demonstrated that the generally accepted EUV irradiance spectrum in 1984 (Heroux and Hinteregger, 1978) below 25 nm was inconsistent with observed photoelectron flux above 35 eV. Richards and Torr concluded that the Heroux and Hinteregger solar flux below 25 nm was about a factor of two too low. Modern measurements and models of the solar irradiance confirm the Richards and Torr assertion (e.g., Richards et al., 2006; Woods et al., 2008). The model/data comparisons shown in Figure 1, Panel C reproduced from Peterson et al. (2009) illustrate good agreement between observations and current models. The photoelectron models used were the Field Line Interhemispheric Plasma (FLIP) model (Richards et al., 2000) and the Global Airglow (GLOW) model (Solomon et al., 1988). The EUV model/data irradiance sets used as input to the models include a rocket-borne calibration spectrum (Chamberlin et al., 2009), the Solar EUV Experiment (SEE) Version 9 reference spectrum (Woods et al., 2005), the Flare Irradiance Spectral Model (FISM; Chamberlin et al., 2007), and the High-resolution Solar EUV Model for Aeronomic Calculations (HEUVAC; Richards et al., 2006).
The major differences between data and models of energetic photoelectrons now arise from the variability of the solar EUV irradiance, uncertainties in the observed or modeled neutral density from the Mass Spectrometer and Incoherent Scatter (MSIS) model (Hedin et al., 1977) and uncertainties in ionization cross sections, as well as observational uncertainties. McGranaghan et al. (2015) describe a publicly available model that is consistent with the photoelectron data shown in Figure 1, with the important caveat that the model has been validated in the low altitude range using electron density, not electron temperature profiles.
Thermalization of Energetic Photoelectrons
Thermalized photoelectrons permeate planetary ionospheres and magnetospheres creating polarization electric fields (e.g., Axford, 1968) and plasma waves as they interact with ions to maintain charge neutrality (e.g., Borisov and Nielsen, 2005). They carry field aligned currents (e.g., Carlson et al., 1998b) and transfer energy via a heat flux between the ionosphere and magnetosphere (e.g., Kozyra et al., 1987; Khazanov et al., 2020).
Thermal electrons are created when photoelectron energy is transferred to ions and electrons. There have been too few simultaneous observations of thermal neutral, ion, and electron temperatures in the high-density region of a planetary thermosphere to confirm or refute the assumptions associated with photoelectron thermalization processes included in current models. However, recent results from the MAVEN spacecraft (Hanley et al., 2020; Peterson et al., 2020) have shown that the observed ion, neutral, and electron temperatures on Mars are not consistent with current models. In particular, Hanley et al. have measured ion temperatures using the MAVEN SupraThermal and Thermal Ion Composition (STATIC) instrument (McFadden et al., 2015). They demonstrated that during the MAVEN deep dip interval in October 2015, at the lowest altitudes sampled (~120 km), the neutral (110 °K), ion (250 °K), and electron (500 °K) temperatures were far from thermal equilibrium and warmer than expected.
Discussion
The production and transport of energetic atmospheric photoelectrons are well-understood and accurately captured by current models using state-of-the-art EUV observations. Techniques have been developed to use the unique energy spectral shape of energetic photoelectrons to tease out details of planetary magnetic topology. However, in spite of 60 years of observations, the processes thermalizing photoelectrons at low altitudes in planetary thermospheres are not quantitatively understood. This lack of progress reflects the complexity of the physics and the lack of a data base of simultaneous neutral, ion, and electron temperatures at low altitudes to guide model development.
Current models of photoelectron thermalization are based on the heat equation which quantifies balance of electron heating and cooling (e.g., Matta et al., 2014). Thermalization occurs where the electron, ion, and neutral temperatures (TE, TI, TN) are equal. It is expected to occur in regions of high density and low fractional ionization. Existing models postulate an altitude (neutral density) where thermalization occurs. MAVEN observations of ion temperatures reported by Hanley et al. (2020) show that thermalization occurs on Mars at higher density (>1011 cm−3) and lower fractional ionization (<2 × 10⁻⁶) than expected. The analysis of observed electron and neutral temperatures presented in Peterson et al. (2020) suggests thermalization on Mars occurs below 100 km where the Bougher et al. (2015) model gives a density ~1012 cm−3 and a fractional ionization of ~10−8. Energetic photoelectron production by solar EUV and X-rays occurs well below Earth's mesopause (~80 km, density > ~1014 cm−3) where it is strongly modulated by solar activity (e.g., Chamberlin et al., 2007).
Although the data base of incoherent radar ion and electron temperatures is vast, we are unaware of a large-scale data base of simultaneously obtained electron, ion, and neutral temperatures obtained in the Earth's thermosphere at densities ~ >1012 cm−3. Such in-situ observations at Earth appear to be possible from satellites at altitudes as low as 100 km (neutral densities ~1014 cm−3 and fractional ionization of ~10−9) using state-of-the-art- instruments and innovative spacecraft (Sarris et al., 2020; Palmroth et al., 2021). Observations below and above 100 km can be made from rockets.
Maven data and analysis show that current one-dimensional codes which use Maxwellian temperatures, empirical ion and electron temperature profiles, and relatively poorly determined cross sections do not adequately account for energy transfer between ions, neutrals, and electrons at the low temperatures and low altitudes below those that have been sampled on Earth and Mars. Deeper insights into the thermalization will require new observations and models. Relevant observations can be made from satellites and rockets as noted above. They can also be made in laboratory plasma chambers (Koepke, 2008). If sensitive enough diagnostics can be developed, the Enormus Toroidal Plasma Device (ETPD Cooper and Gekelman, 2013) could obtain definitive observations of how electrons, ions, and neutrals thermalize at high densities and low fractional ionization. However, it is more likely that large-scale kinetic codes which do not use assumed electron and ion temperature profiles will provide the needed new insights into the complex physics of electron thermalization.
Data Availability Statement
All datasets presented in this study are included in the article/supplementary material.
Author's Note
This paper summarizes what I've learned about thermal and energetic atmospheric photoelectrons since I first began investigating them in 1973. This paper examines the source of thermalized photoelectrons, demonstrates that we do not yet have a quantitative understanding of the thermalization process, and suggests how progress can be made.
Author Contributions
The author confirms being the sole contributor of this work and has approved it for publication.
Conflict of Interest
The author declares that the research was conducted in the absence of any commercial or financial relationships that could be construed as a potential conflict of interest.
Acknowledgments
WKP thanks Gwen Hanley for sharing her preliminary ion temperature observations from the MAVEN spacecraft, Phil Richards for re-igniting my interest in atmospheric photoelectrons, and Andrew Yau and Mark Koepke for insightful comments on an early version of this paper.
References
Andersson, L., Ergun, R. E., Delory, G. T., Eriksson, A., Westfall, J., Reed, H., et al. (2015). The Langmuir Probe and Waves (LPW) instrument for MAVEN. Space Sci. Rev. 195, 173–198. doi: 10.1007/s11214-015-0194-3
Axford, W. I. (1968). The polar wind and the terrestrial helium budget. J. Geophys. Res. Sp. Phys. 73, 6855–6859. doi: 10.1029/JA073i021p06855
Borisov, N., and Nielsen, E. (2005). Excitation of plasma waves by unstable photoelectron and thermal electron populations on closed magnetic field lines in the Martian ionosphere. Ann. Geophys. 23, 1249–1258. doi: 10.5194/angeo-23-1249-2005
Bougher, S. W., Pawlowski, D., Bell, J. M., Nelli, S., McDunn, T., Murphy, J. R., et al. (2015). Mars global ionosphere-thermosphere model: solar cycle, seasonal, and diurnal variations of the mars upper atmosphere. J. Geophys. Res. Planets 120, 311–342. doi: 10.1002/2014JE004715
Carlson, C. W., McFadden, J. P., Ergun, R. E., Temerin, M., Peria, W., Mozer, F. S., et al. (1998b). FAST observations in the downward auroral current region: Energetic upgoing electron beams, parallel potential drops, and ion heating. Geophys. Res. Lett. 25, 2017–2020. doi: 10.1029/98GL00851
Carlson, C. W., Pfaff, R. F., and Watzin, J. C. (1998a). The Fast Auroral SnapshoT (FAST) mission. Geophys. Res. Lett. 25, 2013–2016. doi: 10.1029/98GL01592
Chamberlin, P. C., Woods, T. N., Crotser, D. A., Eparvier, F. G., Hock, R. A., and Woodraska, D. L. (2009). Solar cycle minimum measurements of the solar extreme ultraviolet (EUV) spectral irradiance on April 14, 2008. Geophys. Res. Lett. 36:L05102. doi: 10.1029/2008GL037145
Chamberlin, P. C., Woods, T. N., and Eparvier, G. F. (2007). Flare Irradiance Spectral Model (FISM): daily component algorithms and results. Space Weather 5:S07005. doi: 10.1029/2007SW000316
Chapman, S. (1931). The absorption and dissociative or ionizing effect of monochromatic radiation in an atmosphere on a rotating earth. Proc. Phys. Soc. London 43, 26–45, 483–501. doi: 10.1088/0959-5309/43/5/302
Coates, A. J., Tsang, S. M. E., Wellbrock, A., Frahm, R. A., Winningham, J. D., Barabash, S., et al. (2011). Atmospheric photoelectrons: comparing Venus, Earth, Mars, and Titan. Planet. Space Sci. 59, 1019–1027. doi: 10.1016/j.pss.2010.07.016
Cooper, C. M., and Gekelman, W. (2013). Termination of a magnetized plasma on a neutral gas: the end of the plasma. Phys. Rev. Lett. 110:265001. doi: 10.1103/PhysRevLett.110.265001
Dalgarno, A., Hanson, W. B., Spencer, N. W., and Schmerling, E. R. (1973). The atmosphere explorer mission. Radio Sci. 8, 263–266. doi: 10.1029/RS008i004p00263
Doering, J. P., Peterson, W. K., Bostrom, C. O., and Potemra, T. A. (1976). High resolution daytime photoelectron energy spectra from AE-E. Geophys. Res. Lett. 3, 129–131. doi: 10.1029/GL003i003p00129
Hanley, K. G., Mitchell, D. L., McFadden, J. P., Fowler, C. M., Stone, S. W., Pilinski, M., et al. (2020). “ temperature profiles measured by MAVEN STATIC,” in P049-06 presented at 2020 Fall Meeting, AGU, 1-17 Dec (San Francisco, CA). doi: 10.5194/epsc2020-349
Hedin, A. E., Salah, E., Evand, J. V., Reber, C. A., Newton, G. P., Spencer, N. W., et al. (1977). A global thermospheric model based on mass spectrometer and incoherent scatter data, MSIS 1. N2 density and temperature. J. Geophys. Res. 82, 2139–2147. doi: 10.1029/JA082i016p02148
Heroux, L., and Hinteregger, H. E. (1978). Aeronomical reference spectrum for solarUV below 2000A°. J. Geophys. Res. 8, 5305–5308. doi: 10.1029/JA083iA11p05305
Hinteregger, H. E., Damon, K. R., and Hall, L. A. (1959). Analysis of photoelectrons from solar extreme ultraviolet. J. Geophys. Res. 64, 961–969. doi: 10.1029/JZ064i008p00961
Jakosky, B. M., Lin, R. P., and Zurek, R. (2015). The Mars Atmosphere and Volatile Evolution (MAVEN) mission. Space Sci. Rev. 195, 3–48. doi: 10.1007/s11214-015-0221-4
Khazanov, G. V., Glocer, A., and Chu, M. (2020). The formation of electron heat flux in the region of diffuse aurora. J. Geophys. Res. 125:e2020JA028175. doi: 10.1029/2020JA028175
Koepke, M. E. (2008). Interrelated laboratory and space plasma experiments. Rev. Geophys. 46:RG3001. doi: 10.1029/2005RG000168
Kozyra, J. U., Shelley, E. G., Comfort, R. H., Brace, L. H., Cravens, T. E., and Nagy, A. F. (1987). The role of ring current O+ in the formation of stable auroral red arcs. J. Geophys. Res. 92, 7487– 7502. doi: 10.1029/JA092iA07p07487
Lee, J. S., Doering, J. P., Bostrom, C. O., and Potemra, T. A. (1978). Measurement of the daytime photoelectron energy distribution from AE-E with improved energy resolution. Geophys. Res. Lett. 5, 581–583. doi: 10.1029/GL005i007p00581
Lee, J. S., Doering, J. P., Potemra, T. A., and Brace, L. H. (1980a). Measurements of the ambient photoelectron spectrum from Atmosphere Explorer: I. AE-E measurements below 300 km during solar minimum conditions. Planet. Sp. Sci. 28, 947–971. doi: 10.1016/0032-0633(80)90058-6
Lee, J. S., Doering, J. P., Potemra, T. A., and Brace, L. H. (1980b). Measurements of the ambient photoelectron spectrum from Atmosphere Explorer: II. AE-E measurements from 300 to 1000 km during solar minimum conditions. Planet. Sp. Sci. 28, 973–996. doi: 10.1016/0032-0633(80)90059-8
Matta, M., Galand, M., Moore, L., Mendillo, M., and Withers, P. (2014). Numerical simulations of ion and electron temperatures in the ionosphere of Mars: multiple ions and diurnal variations. Icarus 227, 78–88. doi: 10.1016/j.icarus.2013.09.006
McFadden, J. P., Kortmann, O., Curtis, D., Dalton, G., Johnson, G., Abiad, R., et al. (2015). MAVEN SupraThermal and Thermal Ion Composition (STATIC) instrument. Space Sci. Rev. 195,199–256. doi: 10.1007/s11214-015-0175-6
McGranaghan, R., Knipp, D. J., Solomon, S. C., and Fang, X. (2015). A fast, parameterized model of upper atmospheric ionization rates, chemistry, and conductivity. J. Geophys. Res. Space Phys. 120, 4936–4949. doi: 10.1002/2015JA021146
Mitchell, D. L., Lin, R. P., Rème, H., Crider, D. H., Cloutier, P. A., Connerney, J. E. P., et al. (2000). Oxygen Auger electrons observed in Mars' ionosphere. Geophys. Res. Lett. 27, 1871–1874. doi: 10.1029/1999GL010754
Mitchell, D. L., Mazell, C., Sauvaud, J.-A., Thocaven, J.-J., Rouzaud, J., Fedorov, A., et al. (2016). The MAVEN Solar Wind Electron Analyzer (SWEA). Space Sci. Rev. 200, 495–528. doi: 10.1007/s11214-015-0232-1
Nagy, A. F., Doering, J. P., Peterson, W. K., Torr, M. R., and Banks, P. M. (1977). Comparison between calculated and measured photoelectron fluxes from Atmosphere Explorer C and E. J. Geophys. Res. 82, 5099–5103. doi: 10.1029/JA082i032p05099
Palmroth, M., Grandin, M., Sarris, T., Doornbos, E., Tourgaldis, S., Aikio, A., et al. (2021). Lower-thermsphere-ionosphere (LTI) quantities: current status of measuring techniques and models. Ann. Geophys. 49, 189–237. doi: 10.5194/angeo-39-189-2021
Peterson, W. K., Andersson, L., Ergun, R., Thiemann, E., Pilinski, M., Thaller, S., et al. (2020). Subsolar electron temperatures in the lower Martiionosphere. J. Geophys. Res. 125:e2019JA027597. doi: 10.1029/2019JA027597
Peterson, W. K., Doering, J. P., Potemra, T. A., Brace, L. H., Heelis, R. A., and Hanson, W. B. (1977b). Measurement of magnetic field aligned potential differences using high resolution conjugate photoelectron energy spectra. Geophys. Res. Lett. 4, 373–376. doi: 10.1029/GL004i009p00373
Peterson, W. K., Doering, J. P., Potemra, T. A., McEntire, R. W., and Bostrom, C. O. (1977a). Conjugate photoelectron fluxes observed on Atmosphere Explorer C. Geophys. Res. Lett. 4, 109–112. doi: 10.1029/GL004i003p00109
Peterson, W. K., Stavros, E. N., Richards, P. G., Chamberlin, P. C., Woods, T. N., Bailey, S. M., et al. (2009). Photoelectrons as a tool to evaluate spectral variations in solar EUV irradiance over solar cycle timescales. J. Geophys. Res. 114:A10304. doi: 10.1029/2009JA014362
Peterson, W. K., Woods, T. N., Chamberlin, P. C., and Richards, G. P. (2008). Photoelectron flux variations observed from the FAST satellite. Adv. Space Res. 42, 947–956. doi: 10.1016/j.asr.2007.08.038
Peterson, W. K., Woods, T. N., Fontenla, J. M., Richards, P. G., Chamberlin, P. C., Solomon, S. C., et al. (2012). Solar EUV and XUV energy input to thermosphere on solar rotation time scales derived from photoelectron observations. J. Geophys. Res. 117:A05320. doi: 10.1029/2011JA017382
Rense, W. A. (1953). Intensity of Lyman-alpha line in the solar spectrum. Phys. Rev. 91,229–302. doi: 10.1103/PhysRev.91.299
Richards, P. G., Buonsanto, M. J., Reinisch, B. W., Holt, J., Fennelly, J. A., Scali, J. L., et al. (2000). On the relative importance of convection and temperature on the behavior of the ionosphere in North America during January 6–12, 1997. J. Geophys. Res. 105, 12763–12776. doi: 10.1029/1999JA000253
Richards, P. G., and Peterson, K. W. (2008). Measured and modeled backscatter of ionospheric photoelectron fluxes. J. Geophys. Res. 113:A08321. doi: 10.1029/2008JA013092
Richards, P. G., and Torr, D. G. (1984). An investigation of the consistency of ionospheric measurements of the photoelectron flux and solar EUV flux. J. Geophys. Res. 89, 5625–5635. doi: 10.1029/JA089iA07p05625
Richards, P. G., Woods, T. N., and Peterson, W. K. (2006). HEUVAC: a new high resolution solar EUV proxy model. Adv. Sp. Res. 37, 315–322. doi: 10.1016/j.asr.2005.06.031
Sarris, T. E., Talaat, E. R., Palmroth, M., Dandouras, I., Armandillo, E., Kervalishvili, G., et al. (2020). Daedalus: a low-flying spacecraft for in situ exploration of the lower thermosphere–ionosphere. Geosci. Instrum. Method. Data. Syst. 9, 153–191. doi: 10.5194/gi-9-153-2020
Schunk, R., and Nagy, A. (2009). Ionospheres: Physics, Plasma Physics, and Chemistry (2nd ed., Cambridge Atmospheric and Space Science Series). Cambridge: Cambridge University Press. doi: 10.1017/CBO9780511635342
Solomon, S. C., Andersson, L., Burns, A. G., Eastes, R. W., Martinis, C., McClintock, W. E., et al. (2020). Global scale observations and modeling of far ultraviolet airglow during twilight. J. Geophys. Res. 125:e2019JA027645. doi: 10.1029/2019JA027645
Solomon, S. C., Hays, P. B., and Abreu, J. V. (1988). The auroral 6300A emission: observations and modeling. J. Geophys. Res. 93, 9867–9882. doi: 10.1029/JA093iA09p09867
Weber, T., Brain, D., Xu, S., Mitchell, D., Espley, J., Halekas, J., et al. (2020). The influence of interplanetary magnetic field direction on Martian crustal magnetic field topology. Geophys. Res. Lett. 47:e2020GL087757. doi: 10.1029/2020GL087757
Winningham, J. D., Decker, D. T., Kozyra, J. U., Nagy, A. F., and Jasperse, J. R. (1989). Energetic (>60 eV) atmospheric photoelectrons. J. Geophys. Res. 94, 15335–15348. doi: 10.1029/JA094iA11p15335
Woods, T. N., Chamberlin, P. C., Peterson, W. K., Meier, R. R., Richards, P. G., Strickland, D. J., et al. (2008). XUV Photometer System (XPS): improved solar irradiance algorithm using CHIANTI spectral models. Solar Phys. 250, 235–267. doi: 10.1007/s11207-008-9196-6
Woods, T. N., Eparvier, F. G., Bailey, S. M., Chamberlin, P. C., Lean, J., Rottman, G. J., et al. (2005). The solar EUV Experiment (SEE): mission overview and first results. J. Geophys. Res. 110:A01312. doi: 10.1029/2004JA010765
Keywords: photoelectrons, thermalization, ionization, ionosphere, Mars, Earth
Citation: Peterson WK (2021) Perspective on Energetic and Thermal Atmospheric Photoelectrons. Front. Astron. Space Sci. 8:655309. doi: 10.3389/fspas.2021.655309
Received: 18 January 2021; Accepted: 10 March 2021;
Published: 09 April 2021.
Edited by:
Joseph Eric Borovsky, Space Science Institute, United StatesReviewed by:
Nickolay Ivchenko, Royal Institute of Technology, SwedenRoger Varney, SRI International, United States
Copyright © 2021 Peterson. This is an open-access article distributed under the terms of the Creative Commons Attribution License (CC BY). The use, distribution or reproduction in other forums is permitted, provided the original author(s) and the copyright owner(s) are credited and that the original publication in this journal is cited, in accordance with accepted academic practice. No use, distribution or reproduction is permitted which does not comply with these terms.
*Correspondence: W. K. Peterson, YmlsbC5wZXRlcnNvbkBsYXNwLmNvbG9yYWRvLmVkdQ==