 Bibhuti Kumar Jha1,2,3*
 Manjunath Hegde1,2
 Aditya Priyadarshi1,2
 Sudip Mandal4
 B. Ravindra1
 Dipankar Banerjee1,2,5*
- 1Aryabhatta Research Institute of Observational Sciences, Nainital, Uttarakhand, India
- 2Indian Institute of Astrophysics, Bangalore, Karnataka, India
- 3Department of Physics, Pondicherry University, Kalapet, Puducherry, India
- 4Max Planck Institute for Solar System Research, Göttingen, Germany
- 5Center of Excellence in Space Sciences India, IISER Kolkata, Mohanpur, West Bengal, India
Kodaikanal Solar Observatory (KoSO) possesses one of world’s longest and homogeneous records of sunspot observations that span more than a century (1904–2017). Interestingly, these observations (originally recorded in photographic plates/films) were taken with the same setup over this entire time period which makes this data unique and best suitable for long-term solar variability studies. A large part of this data, between 1921–2011, were digitized earlier and a catalog containing the detected sunspot parameters (e.g., area and location) was published in Mandal et al. (2017). In this article, we extend the earlier catalog by including new sets of data between 1904–1921 and 2011–2017. To this end, we digitize and calibrate these new datasets which include resolving the issue of random image orientation. We fix this by comparing the KoSO images with co-temporal data from Royal Greenwich Observatory. Following that, a semi-automated sunspot detection and automated umbra detection algorithm are implemented onto these calibrated images to detect sunspots and umbra. Additionally, during this catalog updation, we also filled data gaps in the existing KoSO sunspot catalog (1921–2011) by virtue of re-calibrating the “rouge” plates. This updated sunspot area series covering nearly 115 years (1904–2017) are being made available to the community and will be a unique source to study the long term variability of the Sun.
1 Introduction
Sunspots have always been a central part of our understanding of the Sun and its long-term variability (Solanki, 2003). The systematic and methodical observation of these spots has revealed that their appearance is periodic, with a periodicity of around 11 years, known as the solar cycle or solar activity cycle (Schwabe, 1844; Hathaway, 2015). Furthermore, the magnetic nature of these spots (Hale, 1908; Parker, 1955b) makes them an ideal proxy for understanding solar magnetism and its complex variability (Tlatov and Pevtsov, 2014; Nagovitsyn et al., 2017). Today, it is well established that the solar activity cycle is governed by the solar dynamo process operating in the convection zone of the Sun (Parker, 1955a; Parker, 1975; Charbonneau, 2010). In the dynamo process, the solar activity cycle is the manifestation of the periodic nature of the large-scale solar magnetic field (poloidal ⇌ toroidal). As a consequence, the number of sunspots and the corresponding area covered by these spots on the solar surface is dictated by the strength of the toroidal field generated in the dynamo process. Hence, the historical observation of these spots carries a vital information about the nature of toroidal field in the past and it will be crucial for the reconstruction of historical global solar magnetic field (Jiang et al., 2011, 2014). Apart from that, sunspots and solar activity are also intrinsically linked to solar transient events such as solar flares and coronal mass ejections (CMEs) and their frequency of occurrence. Since these transients are the primary drivers for the space weather condition, the historical observation will have crucial role for the understanding of space weather condition in past.
Over the last 150 years, many observatories around the world have begun regular observations of the Sun. The Royal Observatory of Greenwich (RGO; Willis et al., 2013) had been the leader in such a campaign having the record of white-light observations from 1874 to 1976, which was later continued using the Solar Optical Observing Network (SOON) by the US Air Force (USAF). After a few decades, in 1904, Kodaikanal Solar Observatory (KoSO; Hasan et al., 2010) also joined this campaign and started regular observation of the Sun on photographic plates/films in multi-wavelengths (white-light since 1904, Ca-K since 1904 and H-α since 1912), independently in India. In particular, the white-light observation taken at KoSO provides one of the most homogeneous data series for over 100 years. Since these observations are taken from the same location and using the same telescope (since 1918) for such an extended period, KoSO provides a unique data series ideal for the long-term study of the Sun. Although the white-light data had been digitized (Ravindra et al., 2013) since 1904; owing to calibration issues, it has not been utilized for the period 1904–1920. Therefore, the area series (Mandal et al., 2017), the study of penumbra to umbra area ratio (1923–2011; Jha et al., 2018; Jha et al., 2019) and solar differential rotation (1923–2011; Jha et al., 2021) were limited to the period 1921–2011.
In-spite of the fact that RGO is the only observatory in the world with white-light data for 1904–1920 (Cycle-14 and Cycle-15), these images are available either in low resolution or in the form of drawings1. In this regard, the high-resolution white-light data available from KoSO serves as the only data set for this time frame. It is almost impossible for the ground based observatories to have a uniform and homogeneous data because of the varying atmospheric conditions and bad weather. Hence, in the last 30 years, there has been considerable effort to make the homogeneous sunspot area series by cross-correlating the sunspot area from various observatories, e.g., Fligge and Solanki (1997), Baranyi et al. (2001, 2013), Balmaceda et al. (2009) and recently Mandal et al. (2020). In all these studies, RGO data has been used primarily as a reference to cross-correlate other data because of its outstanding data coverage. Now, the availability of KoSO data will complement the existing data series and will be helpful in cross-correlating the RGO and KoSO data in these initial overlapping periods. In this article, we present the extension of the KoSO sunspot area series reported in Mandal et al. (2017) for 1904–2017 along with the umbral area after resolving the calibration issues for the initial 17 years of data. We have also included data for the period of 2012–2017, which was previously not reported due to ongoing digitization. In this article we present the updated data statistics, the issues with the calibration and the resolution of these issues in Section 2. In Section 3, we will discuss the updated area series and its comparison with the earlier ones, and finally, in Section 4 we will summarize our findings.
2 Data
The white-light observation at Kodaikanal started in 1904 using a 10 cm objective lens telescope which was later replaced in 1912 by a better quality lens while maintaining same size. A few years later, a 15 cm achromatic lens was installed, and the same setup has been used to take observations since 13 June 1918 (Sivaraman et al., 1993), and is still in use. Since 2017, the unavailability of photographic films has interrupted regular observation, but it is still taken whenever the films are available. These observations at KoSO, initially taken on the photographic plates/films, have been digitized using 4 k×4 k CCD at Kodaikanal and made available for the community (Ravindra et al., 2013; Mandal et al., 2017). Here, we use the white-light digitized data for the period of 1904–1920 and 2012–2018, and will extend the sunspot-area series reported earlier (1921–2011; Mandal et al., 2017) for the period of 1904–2017 (114 years, covering ≈11 solar cycles). An example of a digitized white-light image from the very initial period, is shown in Figure 1A. Furthermore, we discovered that there are a few observations during 1921–2011, that were missed in earlier area series (Mandal et al., 2017), so we included them in the updated and revised series.
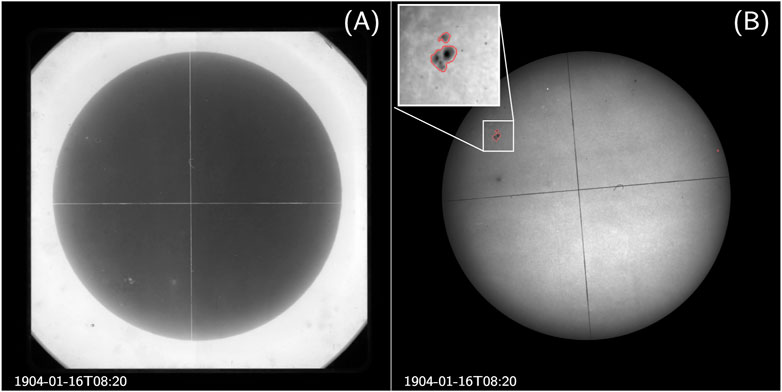
FIGURE 1. A representative example of a very first observation at KoSO, dated 16 January 1904 (A) raw digitised negative image and (B) calibrated image with the contour of sunspot regions detected using a semi-automated method. A zoomed-in view of the detected sunspot is shown in the inset.
2.1 Updated data statistics
In Figure 2A, we present the number of observations per year from 1904 to 2017, with grey histograms representing the observations used in area-series as reported by Mandal et al. (2017) and blue ones representing the additional observations included in this new series. Since, Figure 2A includes the multiple observation from the same day hence, to get an idea about the data coverage, we counted the number of observing days in each year and plotted it against the years in Figure 2B. From Figure 2B, we infer that the KoSO provides continuous white-light observations in the last 114 years with coverage of ≈ 73%. However, Kodaikanal experiences a rainy season each year during July to November and this has an impact on the data coverage (see Bappu, 1967).
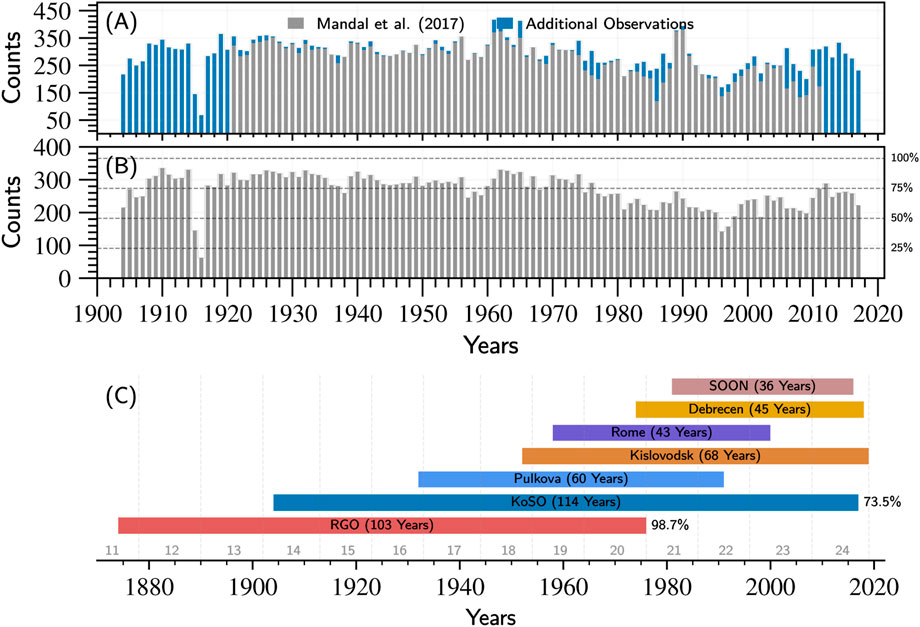
FIGURE 2. Data statistics showing (A) the number of observations per year for each year where two colours (grey) data used in Mandal et al. (2017) and (blue) the additional observation that has been added to the series; (B) the number of observing days in a year after including all the data for 1904–2017. (C) Is showing the data coverage for different observatories, including KoSO and RGO.
2.1.1 Where does the Kodaikanal Solar Observatory stand?
In Figure 2C, we compare the extent of data from the various observatories, showing that the KoSO has one of the most extended white-light data series (114 years) in the world. After KoSO, RGO provides the longest white-light sunspot data series (103 years). Although KoSO offers the most extended series, if we look at the percentage data coverage, RGO stands far ahead of the KoSO with data coverage of
2.2 Data calibration
We follow the same calibration steps, which include flat fielding, disk detection and disk centring–to bring the disk centre to the image centre, as described in Ravindra et al. (2013). Here we also like to point out that in the year 1920, we notice something very peculiar, the size of the disk is larger by more than 400 pixels compared to the rest of the images in the archive (see Supplementary Figure S1A,B). This difference is because, during digitization, the camera has been moved a bit closer to the plate (see Ravindra et al., 2013, for the details of digitizer unit) leading to the bigger size of the disk for this particular year.
Now, the next step is to correctly orient these images to get the solar North at the top of the image. In the earlier work by Ravindra et al. (2013) and Mandal et al. (2017), this correction has been performed using the East-West line present in the image as a reference line. The same technique is used here to correctly rotate the digitized images from the period of 2012–2017. However, this technique can not be used for the data from 1904 to 1920 as they suffer from two different inconsistencies. Firstly, during 1904–1908 (till 11 September 1908), images have two perpendicular straight lines, as seen in Figure 1A, which represent the geographical East-West (EW) and the North-South (NS) direction, but the problem is we do not know which of them represents EW or NS; and secondly, during digitization, corresponding to the period of 1904–1920 accidentally images were flipped and rotated randomly, which makes the task of de-rotation even more challenging. Before we discuss the details of the alternative method that we used to get the proper orientation (discussed in Section 2.2.1) of these effected images we go for the sunspot detection first. For that, we follow the same semi-automatic sunspot detection algorithm described in Ravindra et al. (2013) and Mandal et al. (2017) and stored the information of sunspot regions in the form of binary masks. A representative example is shown in Figure 1B, where detected sunspot regions are marked using red contours.
2.2.1 Orientation correction
So far, we have discussed the issue of image orientation, and now we will look at how we can get the correct orientation of the images for the aforementioned period. Here, we cannot use EW or NS reference line for the first 5 years of data (1904–1908) since we do not know which of them represents EW or NS. In principle, only the EW line in the rest of the data can be used as a reference to get proper orientation. However, these images were flipped in the EW or NS direction during the digitization process, so we have to look for an alternate method. For this we used the already available sunspot location information from the RGO digitized full-disk images. In this method, firstly we chose the closest observation from the RGO data series, noted the time difference between observations is less than 12 h. Then using the available sunspot heliographic location information, we create a dummy mask with the same image size as the KoSO sunspot detected binary mask. After that, the sunspot binary mask obtained from the KoSO data is overlapped with the dummy mask created from RGO data for five different possibilities 1) no change, i.e., correct orientation, 2) North-South flip, 3) East-West flip, 4) 90°clockwise and, 5) 90°anti-clockwise. We also looked for the overlap and mark the observations with the appropriate flag. There are few cases where no overlap is seen in any of the five mentioned cases; hence we flag these observations as “others.” An example of the steps mentioned above is represented in Figures 3A–H.
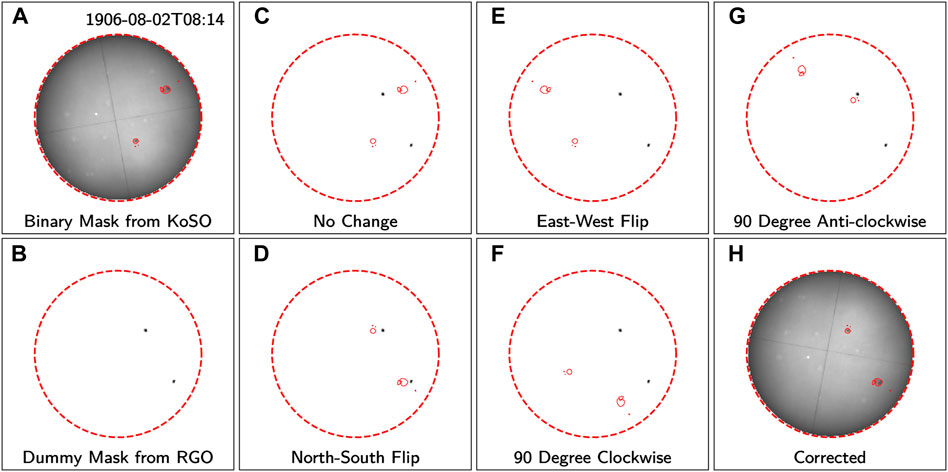
FIGURE 3. A representative example shows the steps we use to identify the correct orientation. (A) Shows the image we have taken from KoSO; here, red contours denote the identified sunspot regions. (B) Shows the dummy mask we create from the near-simultaneous RGO sunspot data. Here, small dark regions represent the location of sunspots as per RGO observation. (C–G) represents the binary mask of KoSO overlapped with RGO (dummy) mask for all five possible orientations. (H) Shows the corrected digitized image; in this case, it is N-S flipped.
Now, following the aforementioned steps, we go through 3,565 observations during 1904–1920 and flag them accordingly, as represented in Table 1. We see in Table 1 that the majority (
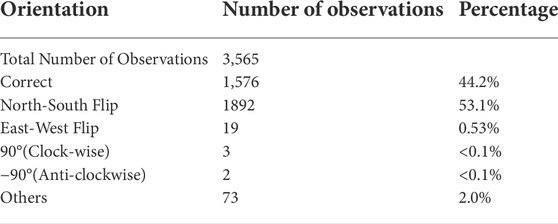
TABLE 1. Number of observations for different flags representing the orientation of the images during 1904–1920.
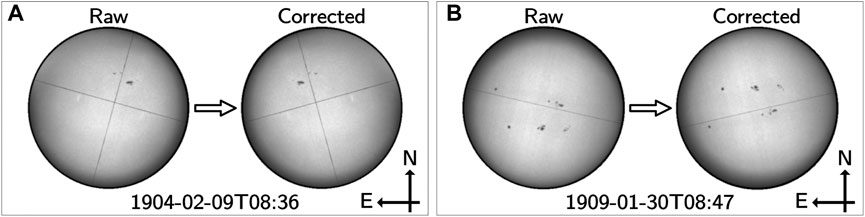
FIGURE 4. Two representative examples from 1904 to 1909 show the orientation correction (A) for East-West flip and (B) North-South flip images.
3 Results
To detect the sunspots, we use a modified version of the sunspot Tracking And Recognition Algorithm (STARA, Watson et al., 2011). Our algorithm is a semiautomated one and has previously been used successfully on KoSO white-light images by Ravindra et al. (2013) and Mandal et al. (2017). It is important to note here that although the observing setup at KoSO was modified several times between 1904–1918, it has no effect on our sunspot detection algorithm (see Supplementary Figure S3). Lastly, for each detected spot, we calculate its area (corrected for projection) and heliographic coordinates (latitude and longitude).
First and foremost, we compare the sunspot area obtained from KoSO digitized white-light data with the existing sunspot area series. Then we discuss the sunspot umbra area extracted from them.
3.1 Sunspot area series
3.1.1 Comparison with existing series
In Figures 5A,B we compare the daily sunspot area obtained from KoSO with the recently cross calibrated composite sunspot area series from Mandal et al. (2020) (M2020 hereafter) for 1904–1920 and 2012–2017, respectively. In M2020 the sunspot area data series for 1904–1920 primarily contains data from the RGO photographic results, whereas for 2012–2017 it is from Debrecen Photographic Data (DPD). The daily sunspot data show a good correlation with M2020 in both periods, with a correlation coefficient (cc) of more than 0.9. When we use linear fit (y = mx) for the daily sunspot data, the slope turns out to be 0.9 for both the periods 1904–1920 and 2012–2017. Slope less than unity signifies that, in KoSO data, we overestimated the area in these periods, whereas the earlier series (Mandal et al., 2017) and recently M2020 reported underestimation for 1921–2011. In Figure 5C, we compare the KoSO daily sunspot area data for the whole period (1904–2017) with M2020, and we see the underestimation of the sunspot area in KoSO as it is dominated by 80% of data (1921–2011) where it is undervalued. In Figures 5D–F), we see similar properties with monthly averaged data but with slightly higher cc values, which is obvious because averaging will reduce the scatter. The possible reasons for this difference could be 1) the data quality, which is not uniform through the whole data span, 2) degradation of plates/films with time, and 3) presence of artefacts, e.g., scratch, dust etc. In addition to the availability of data for Cycle 14 and Cycle 15, the outstanding homogeneity of the KoSO white-light data makes this data an excellent resource to cross-correlate RGO sunspot data with KoSO sunspot area data in overlapping periods.
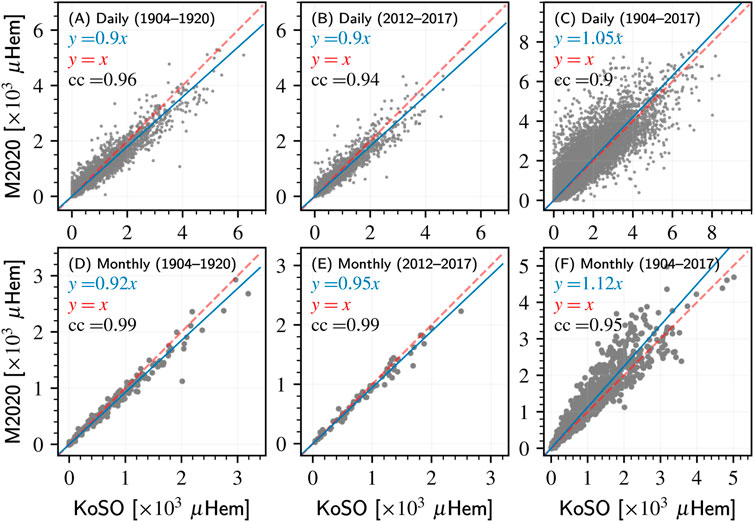
FIGURE 5. The scatter plot showing the comparison of the daily sunspot area, panels (A–C); and monthly averaged sunspot area, panels (D–F) with M2020 for 1904–1920, 2012–2017 and for the extended period of 1904–2017. In each panel, the line with unit slop and the linear fit with zero intercepts are represented by dashed red and solid blue lines, respectively.
3.1.2 Extended sunspot area series
Now, in Figure 6A, we show the variation of yearly averaged sunspot area from KoSO for the extended period of 1904–2017 (covering 11 solar cycles, Cycle 14 to Cycle 24) along with M2020. It is evident from Figure 6A that the new addition in the series shows a good match with M2020 during 1904–1920 and 2012–2017 whereas in 1921–2011, the yearly averaged value is lower than M2020, and the possible reasons have been already been reported and discussed in Mandal et al. (2017). In Figure 6B, we also show the latitude-time plot, the so-called butterfly diagram, for the extended period of 1904–2017. The important point to notice here is the butterfly diagram for 1904–1920 giving us the correct representation of latitude-time plot consistent with other sunspot data series, M2020. This was the period in which images were corrected for random flip and rotation; therefore, the consistency of the butterfly diagram verifies orientation corrections applied. This extended and updated area series, along with orientation information for the initial 17 years, will be publicly available for community use.
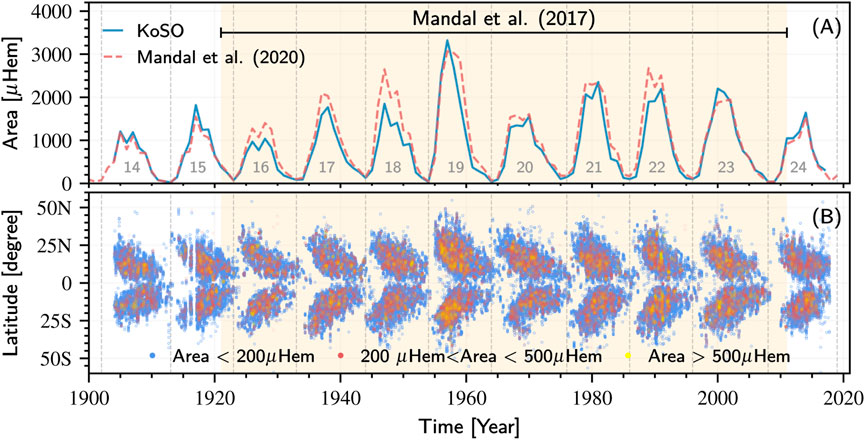
FIGURE 6. In panel (A) yearly averaged sunspot area obtained from KoSO white-light digitized data (solid blue) is plotted as a function of time along with the yearly averaged M2020 (dashed red). Panel (B) show the latitude time plot for the extended period obtained from KoSO sunspot data.
3.2 Umbra area series
Following the automatic umbra detection method as explained in Jha et al. (2019), we detected the umbra area from the updated and extended white-light data series. In Figure 7A, we show the scatter plot between the monthly averaged umbra area from KoSO and RGO for 1904–1976. After 1976 RGO does not provide sunspot (and umbral) area data (as observation program has been transferred to Debrecen Observatory), hence we use the DPD umbral area in 1977–2017 to compare with KoSO, as shown in Figure 7B. Both the data (RGO and DPD) show a very good correlation (0.94 and 0.95) with the KoSO umbra area in their corresponding periods. Despite the fact that the correlation coefficient is quite good, we can infer from the fitted line that there is a considerable underestimation of the umbra area in KoSO compared to RGO, which is not so severe in the case of DPD. When we compare the yearly average by plotting all of them simultaneously in Figure 7C, we notice that this underestimation is primarily coming from three cycles (Cycle 16, Cycle 17, and Cycle 18). For the same set of cycles, we also see a bit of undervalued sunspot area in Figure 6A.
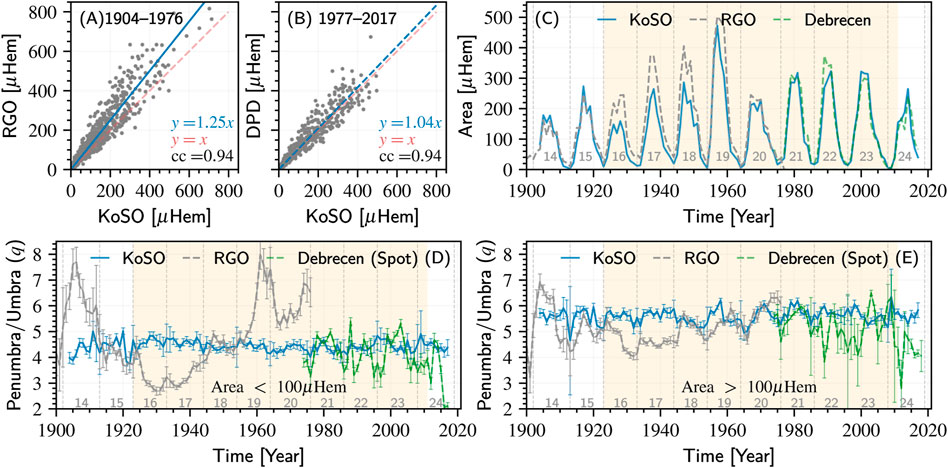
FIGURE 7. In panels (A) and (B), we compare the KoSO monthly averaged umbra area with RGO and DPD umbra, respectively, in their corresponding periods. Panel (C) shows the solar cycle variation of yearly averaged umbra area compared to RGO and DPD umbra area. Panel (D) and (E) show the variation of q for smaller and larger sunspots for an extended period, respectively. The shaded regions represent the data used in Jha et al. (2019).
3.2.1 Penumbra to umbra area ratio
In this subsection, we extend the work presented in Jha et al. (2019) by calculating the penumbra to umbra area ratio (q) for the extended period. In Figures 7D,E, we show the variation in q with time for smaller (Area
In Figure 7D, we do not notice any variation in q for smaller spots even in the extended period, which is consistent with the findings of Jha et al. (2019). Furthermore, the variation of q for larger sunspots is also consistent with the earlier findings of Jha et al. (2019) as well as Hathaway (2013). We do note, however, that in KoSO, the spots are yet to be classified into groups, unlike RGO. Hence, there may be a slight variation in the absolute value of q if we consider individual spots. To check this hypothesis, we over-plot the q values calculated from DPD, which provides information of individual spots. And indeed, we find that although the absolute value of q is slightly less than that of KoSO, the trend remains similar in both the data sets. Furthermore, Carrasco et al. (2018), and recently Hou et al. (2022) (including all spots altogether) did not find any such trend in q as was seen in RGO data.
4 Summary and conclusion
In this article, we present the sunspot area series from KoSO, for the period of 1904–1920, and 2012–2017, which were not included due to calibration issues and incomplete digitization in the earlier published series (Mandal et al., 2017). The inclusion of these data has extended the sunspot area series reported in Mandal et al. (2017) for 1904–2017 (114 years, covering
We have also compared the yearly averaged umbra area series with RGO (1904–1976) and DPD (1977–2017) in their corresponding periods, which show a good agreement between the umbral areas (cc
The availability of high-resolution white-light digitized data for Cycle 14 and Cycle 15 is a key asset for the long-term studies of the Sun, and it provides an excellent opportunity to cross-correlate the sunspot area data for observatories. In addition, the accessibility of a homogeneous and uniform white-light digitized data for such a long period observed from the same location and setup will benefit the community for the long-term studies of the Sun and its global magnetic field variability. Moreover, KoSO also provides Sun charts, which combine the multi-wavelength observation in a single drawing. These Sun charts are getting digitized and will help fill the gaps and make the series even more homogeneous. In future, we will be looking for machine learning (ML), artificial intelligence (AI) and deep learning based methods to further improve the sunspot detection method by making it completely automatic. Furthermore, ML and AI based method can be expended to the study of historical global solar magnetic field and space weather conditions.
The digitized white-light data and the area series for the extended period will be available at https://kso.iiap.res.in/new/data. The sunspot area series for the extended period presented here is also available at https://github.com/bibhuraushan/KoSoDigitalArchive.
Data availability statement
The datasets presented in this study can be found in online repositories. The names of the repository/repositories and accession number(s) can be found below: https://kso.iiap.res.in/new/data or https://github.com/bibhuraushan/KoSoDigitalArchive.
Author contributions
BJ has done the data calibration (orientation correction), umbra detection using an automatic algorithm, all the analysis presented and manuscript drafting. MH has done 80% of sunspot detection, and AP has done the rest 20% of sunspot detection and contributed to the calibration step of orientation correction. BR has performed the data’s basic calibration (flat fielding and disk detection) step. SM and DB have helped in the structuring of the draft and helped in the language correction.
Funding
This project is partially funded by the project grant DST/ICPS/CLUSTER/DataScience/2018/General/Sl. No. 18.
Acknowledgments
Kodaikanal Solar Observatory is a facility of the Indian Institute of Astrophysics, Bangalore, India. This data is now available for public use at http://kso.iiap.res.in through a service developed at IUCAA under the Data Driven Initiatives project funded by the National Knowledge Network. BJ would like to thank the entire digitization team for their tireless effort to digitize the historical data and make data publically available. A special mention to Satish, who has digitized all the plates/films after 2011.
Conflict of interest
The authors declare that the research was conducted in the absence of any commercial or financial relationships that could be construed as a potential conflict of interest.
Publisher’s note
All claims expressed in this article are solely those of the authors and do not necessarily represent those of their affiliated organizations, or those of the publisher, the editors and the reviewers. Any product that may be evaluated in this article, or claim that may be made by its manufacturer, is not guaranteed or endorsed by the publisher.
Supplementary material
The Supplementary Material for this article can be found online at: https://www.frontiersin.org/articles/10.3389/fspas.2022.1019751/full#supplementary-material
Footnotes
1http://fenyi.solarobs.csfk.mta.hu/GPR/index.html.
References
Balmaceda, L. A., Solanki, S. K., Krivova, N. A., and Foster, S. (2009). A homogeneous database of sunspot areas covering more than 130 years. J. Geophys. Res. 114, A07104. doi:10.1029/2009JA014299
Baranyi, T., Gyori, L., Ludmány, A., and Coffey, H. E. (2001). Comparison of sunspot area data bases. Mon. Not. R. Astron. Soc. 323, 223–230. doi:10.1046/j.1365-8711.2001.04195.x
Baranyi, T., Király, S., and Coffey, H. E. (2013). Indirect comparison of Debrecen and Greenwich daily sums of sunspot areas. Mon. Not. R. Astron. Soc. 434, 1713–1720. doi:10.1093/mnras/stt1134
Carrasco, V. M. S., Vaquero, J. M., Trigo, R. M., and Gallego, M. C. (2018). A curious history of sunspot penumbrae: An update. Sol. Phys. 293, 104. doi:10.1007/s11207-018-1328-z
Charbonneau, P. (2010). Dynamo models of the solar cycle. Living Rev. Sol. Phys. 7, 3. doi:10.12942/lrsp-2010-3
Fligge, M., and Solanki, S. K. (1997). Inter-cycle variations of solar irradiance: Sunspot areas as a pointer. Sol. Phys. 173, 427–439. doi:10.1023/A:1004971807172
Hale, G. E. (1908). On the probable existence of a magnetic field in sun-spots. Astrophys. J. 28, 315. doi:10.1086/141602
Hasan, S. S., Mallik, D. C. V., Bagare, S. P., and Rajaguru, S. P. (2010). “Solar Physics at the kodaikanal observatory: A historical perspective,” in Magnetic coupling between the interior and atmosphere of the sun. Vol. 19 of Astrophysics and space science proceedings (Springer), 12–36. doi:10.1007/978-3-642-02859-5_3
Hathaway, D. H. (2013). A curious history of sunspot penumbrae. Sol. Phys. 286, 347–356. doi:10.1007/s11207-013-0291-y
Hou, J.-W., Zeng, S.-G., Zheng, S., Luo, X.-Y., Deng, L.-H., Li, Y.-Y., et al. (2022). Chinese sunspot drawings and their digitization-(VII) sunspot penumbra to Umbra area ratio using the hand-drawing records from yunnan observatories. Res. Astron. Astrophys. 22, 095012. doi:10.1088/1674-4527/ac7f87
Jha, B. K., Mandal, S., and Banerjee, D. (2018). Long-term variation of sunspot penumbra to umbra area ratio: A study using kodaikanal white-light digitized data. Proc. Int. Astron. Union 13, 185–186. doi:10.1017/S1743921318001989
Jha, B. K., Mandal, S., and Banerjee, D. (2019). Study of sunspot penumbra to Umbra area ratio using kodaikanal white-light digitised data. Sol. Phys. 294, 72. doi:10.1007/s11207-019-1462-2
Jha, B. K., Priyadarshi, A., Mandal, S., Chatterjee, S., and Banerjee, D. (2021). Measurements of solar differential rotation using the century long kodaikanal sunspot data. Sol. Phys. 296, 25. doi:10.1007/s11207-021-01767-8
Jiang, J., Cameron, R. H., Schmitt, D., and Schüssler, M. (2011). The solar magnetic field since 1700. II. Physical reconstruction of total, polar and open flux. Astron. Astrophys. 528, A83. doi:10.1051/0004-6361/201016168
Jiang, J., Hathaway, D. H., Cameron, R. H., Solanki, S. K., Gizon, L., and Upton, L. (2014). Magnetic flux transport at the solar surface. Space Sci. Rev. 186, 491–523. doi:10.1007/s11214-014-0083-1
Mandal, S., Hegde, M., Samanta, T., Hazra, G., Banerjee, D., and Ravindra, B. (2017). Kodaikanal digitized white-light data archive (1921-2011): Analysis of various solar cycle features. Astron. Astrophys. 601, A106. doi:10.1051/0004-6361/201628651
Mandal, S., Krivova, N. A., Solanki, S. K., Sinha, N., and Banerjee, D. (2020). Sunspot area catalog revisited: Daily cross-calibrated areas since 1874. Astron. Astrophys. 640, A78. doi:10.1051/0004-6361/202037547
Nagovitsyn, Y. A., Pevtsov, A. A., and Osipova, A. A. (2017). Long-term variations in sunspot magnetic field-area relation. Astron. Nachr. 338, 26–34. doi:10.1002/asna.201613035
Parker, E. N. (1955b). The formation of sunspots from the solar toroidal field. Astrophys. J. 121, 491. doi:10.1086/146010
Parker, E. N. (1975). The generation of magnetic fields in astrophysical bodies. X - magnetic buoyancy and the solar dynamo. Astrophys. J. 198, 205–209. doi:10.1086/153593
Ravindra, B., Priya, T. G., Amareswari, K., Priyal, M., Nazia, A. A., and Banerjee, D. (2013). Digitized archive of the Kodaikanal images: Representative results of solar cycle variation from sunspot area determination. Astron. Astrophys. 550, A19. doi:10.1051/0004-6361/201220416
Schwabe, H. (1844). Sonnenbeobachtungen im Jahre 1843. Von Herrn Hofrath Schwabe in Dessau. Astr. Nachr. 21, 234–235. doi:10.1002/asna.18440211505
Sivaraman, K. R., Gupta, S. S., and Howard, R. F. (1993). Measurement of Kodaikanal white-light images. Sol. Phys. 146, 27–47. doi:10.1007/BF00662168
Solanki, S. K. (2003). Sunspots: An overview. Astronomy Astrophysics Rev. 11, 153–286. doi:10.1007/s00159-003-0018-4
Tlatov, A. G., and Pevtsov, A. A. (2014). Bimodal distribution of magnetic fields and areas of sunspots. Sol. Phys. 289, 1143–1152. doi:10.1007/s11207-013-0382-9
Watson, F. T., Fletcher, L., and Marshall, S. (2011). Evolution of sunspot properties during solar cycle 23. Astron. Astrophys. 533, A14. doi:10.1051/0004-6361/201116655
Keywords: Sun, sunspots, solar cycle, Kodaikanal Solar Observatory, white-light, sunspot area, umbra area
Citation: Jha BK, Hegde M, Priyadarshi A, Mandal S, Ravindra B and Banerjee D (2022) Extending the sunspot area series from Kodaikanal Solar Observatory. Front. Astron. Space Sci. 9:1019751. doi: 10.3389/fspas.2022.1019751
Received: 15 August 2022; Accepted: 13 October 2022;
Published: 25 October 2022.
Edited by:
Maria Ann Weber, Delta State University, United StatesReviewed by:
Laure Lefevre, Royal Observatory of Belgium, BelgiumSergei Zharkov, University of Hull, United Kingdom
Copyright © 2022 Jha, Hegde, Priyadarshi, Mandal, Ravindra and Banerjee. This is an open-access article distributed under the terms of the Creative Commons Attribution License (CC BY). The use, distribution or reproduction in other forums is permitted, provided the original author(s) and the copyright owner(s) are credited and that the original publication in this journal is cited, in accordance with accepted academic practice. No use, distribution or reproduction is permitted which does not comply with these terms.
*Correspondence: Bibhuti Kumar Jha, YmliaHV0aUBhcmllcy5yZXMuaW4=; Dipankar Banerjee, ZGlwdUBhcmllcy5yZXMuaW4=