 Katharine K. Reeves
- Center for Astrophysics | Harvard & Smithsonian, Cambridge, MA, United States
Magnetic reconnection is a dynamic process that occurs in solar flares in a tenuous and hot environment. High-cadence, high-spatial resolution spectroscopic observations with the Interface Region Imaging Spectrometer (IRIS) have provided a unique window into the reconnection process that occurs during solar flares. IRIS has observed many consequences of the reconnection process, including detailed observations of outflows that are thought to be indicative of reconnection, possible observations of the termination shocks that are predicted by-products of reconnection, and observations of flare ribbons which are imprints of the reconnection process in the chromosphere. This paper will review these observations and put them in the context of flare models that predict reconnection signatures.
1 Introduction
The standard reconnection model of flares predicts that reconnection happens in the current sheet region above an arcade of flare loops. There are many possibly observable consequences of this process. As the magnetic fields reconfigure, outflows form emanating from the reconnection point. These flows impinge on the already reconnected flare loops below, potentially causing termination shocks. The energy released from the reconnection process is deposited in the flare ribbons, which demarcate the boundary between the closed magnetic flux of the flare loops and the open flux above.
Some manifestations of these reconnection signatures have been previously observed. Outflows due to reconnection have been identified in images (e.g., Savage et al., 2010, 2012; Yu et al., 2020) and with spectroscopic observations (e.g., Wang et al., 2007; Hara et al., 2011). Some possible evidence for a termination shock in flares has been found by the Solar Ultraviolet Measurements of Emitted Radiation (SUMER; Wilhelm et al., 1995), which observed a large blue shifted wing in the Fe xxi 1354.08 Å line in the region above the flare loops (Innes et al., 2003). The EUV Imaging Spectrometer (EIS; Culhane et al., 2007) on the Hinode mission observed similar large enhancements in the blue and red wings of the Fe xxiv line (Imada et al., 2013). These flows were similar in magnitude and were interpreted as flows downstream of the termination shock. Flare ribbons are straightforward to observe, and their motion has frequently been used to estimate the rate of the reconnection happening in the corona (e.g., Qiu et al., 2004, Qiu et al., 2010).
The Interface Region Imaging Spectrograph (IRIS; De Pontieu et al., 2014) has unprecedented spatial resolution and temporal cadence, allowing for a clearer view of reconnection processes. IRIS obtains spectra from the chromosphere, transition region, and corona with 0.33–0.4 arcsec spatial resolution, up to two-second temporal resolution, and 1 km/s velocity resolution over a field-of-view of up to 175 arcsec × 175 arcsec. IRIS is an imaging spectrograph with a scanning slit with three spectral passbands in the ranges 1332–1358 Å, 1389–1407 Å, and 2783–2834 Å. The most useful lines for flares are the Fe xxi 1354 Å line, formed at about 10 MK, which is an ideal temperature for observing flare loops and the reconnection region, and chromospheric (Mg II h 2803 Å and Mg II k 2796 Å) and transition region (Si IV 1393.76/1402.77 Å) lines which are useful for observing flare ribbons. IRIS also has four slit-jaw imagers (SJIs), which observe in four different passbands (C II 1330 Å, Si IV Å 1400, Mg II k 2796 Å, and Mg II wing 2830 Å) with a field of view up to 130 arcsec × 175 arcsec and a spatial resolution of 0.33 arcsec/pixel. The mission’s achievements can be found in a recent review paper by De Pontieu et al. (2021).
Many of the spectroscopic observations mentioned above contained blends of Doppler shifted and stationary lines, requiring careful analysis and interpretation. The high spatial resolution of IRIS means that often important features in flares, such as upflows from chromospheric evaporation, are completely separated from any stationary component, making them easier to identify. Similarly, the fast temporal cadence means that evolution of the spectra is captured in fast-moving events such as flares. Below we will review some of the IRIS observations of reconnection outflows, termination shock signatures, and flare ribbons that have increased our understanding of the reconnection process.
2 Reconnection outflows
One of the basic hallmarks of reconnection is bi-directional outflows from the reconnection point. Because of its sensitivity to the Fe xxi line, high time cadence and high spatial resolution, IRIS is capable of detailed observations of such outflows during a flare. For example, Tian et al. (2014) observed a strong redshift in the Fe xxi line during a C1.6 flare that occurred at about 17:19 UT on 2014 April 19 (SOL 2014-04-19T17:19 UT), as shown in Figure 1. This observation is unique in that the Fe xxi line is completely red-shifted, with no hint of a stationary component, as indicated by the green lines in Figures 1B,E. The location of the redshifted line is near the cusp of a hot flare loop as seen by the 131 Å channel of the Atmospheric Imaging Assembly (AIA; Lemen et al., 2012) on the Solar Dynamics Observatory (SDO), as shown in Figure 1D, which is also sensitive to hot plasma from the Fe xxi line. Its location strongly suggests that the redshifted Fe xxi emission is due to reconnection outflows. The initial detection of the outflows in IRIS is weak in intensity, but indicates that the redshifted velocity is as high as 300 km/s. The velocity decreases with each subsequent observation, likely because the reconnection site is moving upwards, away from the location of the slit.
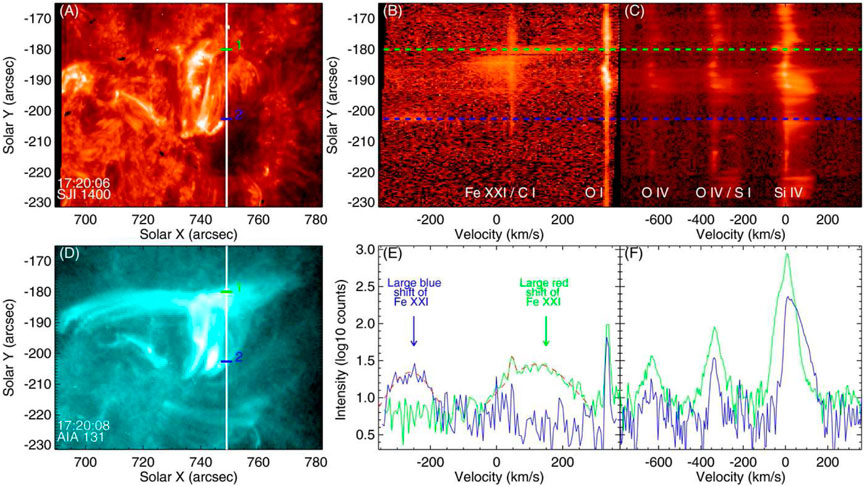
FIGURE 1. Panel (A) shows the 2014 April 19 flare in the IRIS 1400 Å slit jaw imager. Panels (B,C) show images of the spectra along the slit in various spectral windows. Panel (D) shows the location of the slit and points of interest superimposed on an AIA 131 Å image. Panels (E,F) show the spectra along the green and blue lines in the spectral windows of Panels (B,C), respectively. From Tian et al. (2014).
Another example comes from the observation of a small eruption at the limb of the Sun that was observed by IRIS and AIA on 2014 May 1, starting at 1:35 UT (Reeves et al., 2015). As the small filament erupts, it impinges on magnetic field lines above, where coronal rain is visible pre-eruption. The IRIS slit is located such that red shifts of 100–200 km/s are observed in the Si iv 1393.76 Å line due to outflows from the reconnection between the small filament and the overlying fields. Plane-of-sky velocities of ∼300 km/s are observed in the AIA 171 Å channel. The combination of line-of-sight velocities from IRIS and plane-of-sky velocities from AIA gives a complete picture of the speed of the outflow, which works out to be 320–360 km/s. Reconnection outflows are thought to be a significant fraction of the Alfvén speed (e.g., Forbes et al., 2018), which is often taken as about 1000 km/s in the corona. Furthermore, reconnection is verified in this case by heated plasma in the region where the filament contacted the overlying field, as observed by the AIA 131 Å channel and thin-Be images from the X-ray Telescope (XRT; Golub et al., 2007) on Hinode.
A spectacular example of bi-directional outflows observed by IRIS during a reconnection event was reported by Chen et al. (2016) during a filament eruption that commenced at ∼15:35 UT on 2014 August 29. IRIS was scanning across a filament on the limb with an 8-step raster program when brightenings were observed in the 1330 Å slit jaw image during the slow rise phase of a filament eruption. Spectra of the Si iv 1393.76 Å line in raster positions 5–7 clearly show opposing flows in the region where this brightening occurred just prior to the rapid phase of the filament eruption and subsequent C4.3 flare, as shown in Figure 2. These outflows were interpreted as evidence of tether-cutting reconnection, where reconnection below a filament causes an instability and eruption (e.g., Moore et al., 2001). In this case, the legs of two filaments reconnected to form one filament, in the process allowing the upwards magnetic pressure to overcome the overlying magnetic tension and causing the eruption.
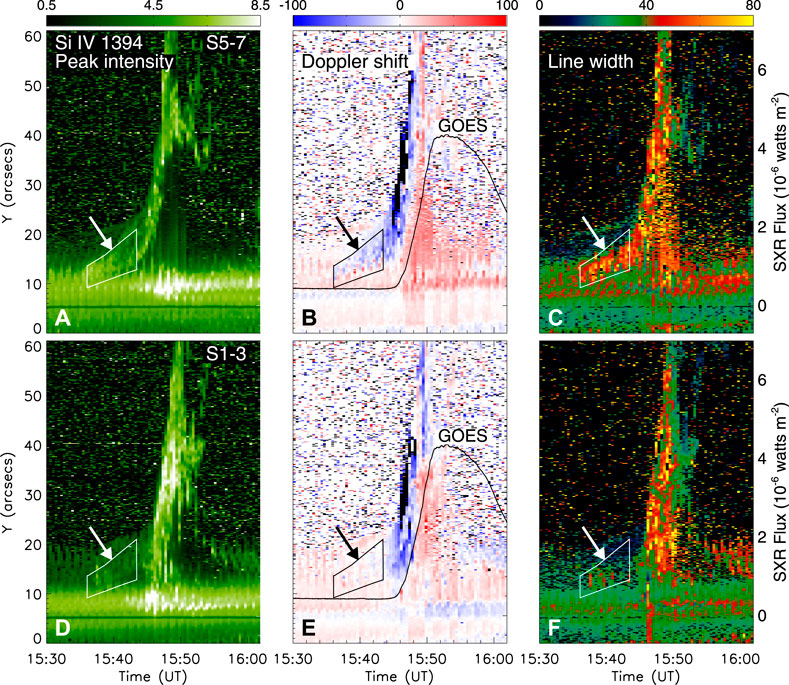
FIGURE 2. Panels (A–C) show the intensity, Doppler shift, and line widths, respectively, as a function of time from Gaussian fits to the Si iv 1393.76 Å line in positions 5–7 of the IRIS raster scan during a prominence eruption that occurred on 2014 August 29. Panels (D–F) show the same quantities, but in raster positions 1–3 for comparison. The GOES X-ray plot is shown on the panels with the Doppler shift measurements. The boxes and the arrows point to the region of interest where the opposing Doppler shifted flows are seen in raster positions 5–7. Similar signatures are not seen at raster positions 1–3. From Chen et al. (2016).
Even though IRIS has excellent spatial resolution, some reconnection events may create outflows at spatial scales such that IRIS is not able to separate red shifted from blue shifted flows. In this case, broadened spectral lines will be observed with IRIS. Several studies have observed broadened Si iv profiles and attributed them to superimposed bi-directional reconnection outflows in the same pixel. A convincing example of this phenomenon was presented by Li et al. (2017), who observed broadened Si iv 1402.77 Å line profiles outside of the flare ribbons during an unusual X-shaped M2.3 flare that occurred at 15:24 UT on 2014 November 9. The line profiles in this case have relatively symmetric wings that are well fit by Gaussian functions ranging in peak velocities from ±60—± 150 km/s, as shown in Figure 3. These profiles are taken from locations that are in regions where separators are expected to form, according to topological modeling. The authors interpret these line profiles as being due to reconnection happening low in the solar atmosphere as the chromospheric ribbons converge on the X-point between the ribbons.
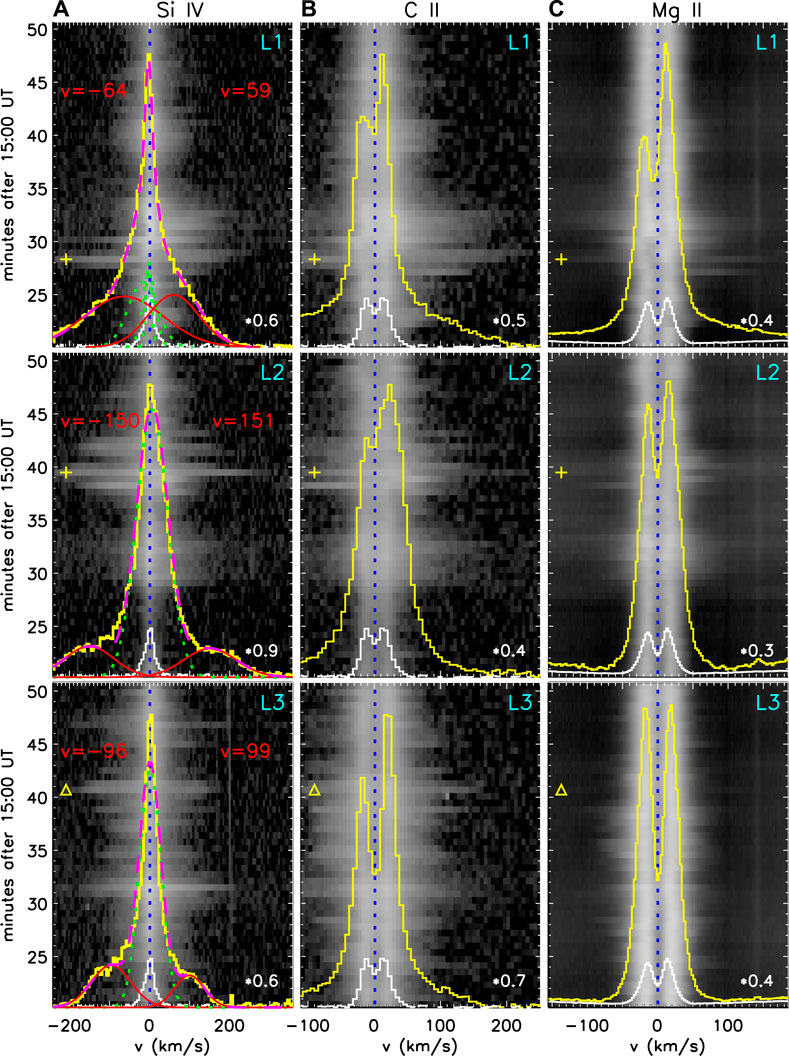
FIGURE 3. Left panels (A) show Si iv profiles during the 2014 November 9 flare as a function of time. Middle panels (B) show C ii and right panels (C) show Mg ii. Yellow profiles are from the time marked with the symbol (plus sign or triangle). White profiles are from a quiet Sun region. On the Si iv panels, red curves are Doppler shifted components, green dotted lines are stationary components, and dashed magenta lines are the total fit to the spectra. From Li et al. (2017).
A few other examples of broadened profiles in the Si iv 1402.77 Å line indicative of reconnection have been found. One was presented by Zhang et al. (2021), who studied a jet related to a C3.4 flare that occurred at about 9:00 UT on 2015 October 16. The Si iv broadenings are made up of red and blue shifted components ranging from a few tens of km/s up to 170 km/s, and they are observed at the expected location of the reconnection current sheet that is thought to form underneath the erupting minifilament causing the jet. Another example was found by Xue et al. (2018), who studied a small scale reconnection event in AR 12571 that occurred at 2:38 UT on 2016 August 08. Two cusp-shaped loops formed, with a linear feature in between, which is interpreted as the location of a current sheet. The line profiles of the Si iv 1402.77 Å line are red shifted at the ends of the linear feature, and blue shifted in the middle. The line profiles are to be broadened along the linear feature when compared to other bright regions. This broadening is likely due to superimposed reconnection outflows, given the shape of some of the line profiles. Turbulence in the current sheet region could also contribute to the broadening of the line profiles, as shown by recent modeling (Ruan et al., 2022; Shen et al., 2022; Shibata et al., 2022). For both of the above examples, the line profiles contain clear indications that the profiles are due to multiple separable components, so an increase of spatial and spectral resolution of 2–3 times might be able to completely separate components from opposing flows.
3 Termination shocks
Termination shocks are often predicted as the consequence of reconnection outflows impinging on flare loops below the reconnection site, but clear evidence of these structures is scant. Recent modeling has suggested that IRIS should be able to observe evidence of these termination shocks. Guo et al. (2017) used a MHD model of the reconnection process to simulate IRIS Fe xxi line emission due to a termination shock in a flare located at disk center. They find that when a termination shock is present, there is enhanced emission in the red wing of the Fe xxi line because of the compressed plasma in the region downstream of the shock. The enhancements are on the order of 200–300 km/s, well within the observing capability of IRIS.
High resolution observations from IRIS have allowed for the possible detection of these predicted signatures of termination shocks in flares. Polito et al. (2018) examined an X1 flare that occurred at 17:35 UT on 2014 March 29, shown in Figure 4. Faint red shifts of the IRIS Fe xxi line of ∼250 km/s are observed along with a strong stationary component near the tops of the flare loops, as shown in Figure 4C. These velocities are well within the range of those predicted by Guo et al. (2017). Some of these red shifts are accompanied by simultaneous blue shifts of a similar magnitude. Given the orientation of the flare, the authors speculate that these flows are deflection flows that are associated with a termination shock at the loop tops, as indicated in the diagram in Figure 4. These Doppler shifts are co-located with 30–70 keV hard X-ray sources observed by the Reuven Ramaty High Energy Solar Spectroscopic Imager (RHESSI; Lin et al., 2002), indicating that particle acceleration may be taking place, further strengthening the assertion that a termination shock is present. Similar Fe xxi line profiles were observed by Tian and Chen (2018) which may also be due to a termination shock, although the authors interpreted the flows as reconnection outflows since that was a common interpretation of red shifted flows observed in the reconnection region at the time (e.g., Wang et al., 2007; Tian et al., 2014).
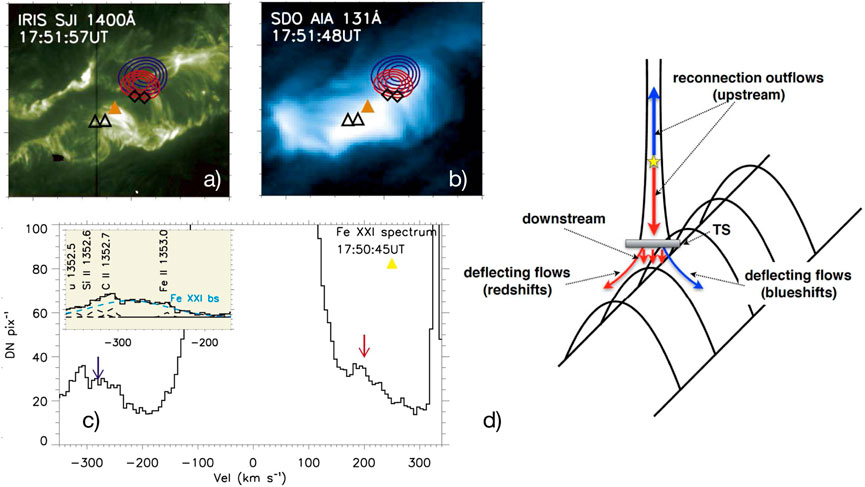
FIGURE 4. Panels (A,B) show the IRIS 1400 Å slit jaw image and SDO AIA 131 Å image, respectively, of the 2014 March 29 X flare. Symbols indicate locations where mainly red shifts (diamonds) or both blue and red shifts (triangles) are observed. Red and blue contours are RHESSI images formed in the 6–12 keV and 30–70 keV energy intervals, respectively. Panel (C) shows an example spectrum that includes both a red shift and a blue shift, from the location of the orange triangle in panels (A,B). The inset shows a zoom in to the blue side of the spectrum, where line blends are identified. Panel (D) shows a diagram of the deflection flows around the termination shock that may be responsible for the observed Doppler shifts. Adapted from Polito et al. (2018).
A pair of studies by Cai et al. (2019) and Cai et al. (2022) examines the supra-arcade fan region in the 2017 September 10 flare, and finds possible evidence for a termination shock. The IRIS 1330 Å slit jaw data show an increase in intensity as a function of height in the supra-arcade region. The ratio of the intensities over the increase is consistent with a shock with a temperature of 7–11 MK and a Mach number of 1–2.5 (Cai et al., 2019). Additionally, a clear discontinuity in the intensity of the Fe xxi line is observed as a function of height, further indicating a compressed interface. Across the discontinuity in intensity, increases in Doppler velocity and Doppler width of the Fe xxi line as a function of height are observed. Spectroscopic data from the Hinode/EIS Fe xxiv 255.10 Å and Fe xxiii 263.76 Å lines indicate a temperature and density discontinuity in the same location as the discontinuity seen in the Fe xxi intensity (Cai et al., 2022).
A more detailed analysis of the IRIS Fe xxi spectra in the supra-arcade region of this same event was performed by (Reeves et al., 2020). They find oscillations in the Doppler shift of the Fe xxi line at various locations above the intensity enhancement studied by Cai et al. (2019) with periods of 340–450 s. These periods are not correlated with loop length, ruling out standing slow mode waves (e.g., Wang et al., 2003) as the cause. One possible explanation for the oscillations is that they are due to the oscillating backflow from colliding termination shocks, as modeled in 2D by Takasao and Shibata (2016) and in 3D by Shibata et al. (2022).
4 Flare ribbon observations
IRIS is incredibly well-suited to study the ribbons formed at the footpoints of loops during flares. For example, it has been conclusively shown that IRIS can fully resolve blue shifted plasma at the flare ribbons in Fe xxi (e.g., Polito et al., 2015, 2016). Many studies have examined at the details of the energy deposition in the ribbons with IRIS (for a review see De Pontieu et al., 2021), but this section will focus on studies of ribbons that draw a direct connection between the observed emission at the flare ribbons the details of the reconnection process itself.
The high spatial resolution of IRIS means that there are many pixels that show brightenings in ribbons during flares. Thus it is possible to perform statistical studies on the spectral line profiles to obtain a clearer picture of the reconnection process. For example, Graham and Cauzzi (2015) examined the line profiles in 81 pixels encompassing the flare ribbons of an X1.6 class flare that occurred on 2014 September 10 (SOL 2014-09-10T17:45). They found that the Fe xxi line profiles along the flare ribbon show remarkably similar characteristics–completely blue shifted profiles with strong initial upflows of about 300 km/s. Line profiles of Mg ii are also very similar, showing red shifts of up to 40 km/s, indicating chromospheric condensation. The brightening ribbons are a manifestation of the energy release process higher in the corona, so the fact that all of the ribbon line profiles are so similar could indicate that the energy release process occurring in the current sheet is remarkably uniform. Another possibility, however, is that the chromospheric evaporation process is somehow decoupled from the initial energy release, and is more dependent on the local conditions in the chromosphere. Recent modeling seems to indicate that the first possibility is more likely–Graham et al. (2020) found that varying the parameters of the input electron beam in simulations of this flare led to differences in the modeled spectral profiles that were not observed.
The detail provided by IRIS observations of flare ribbons allows for some interesting potential interpretations of the flare ribbon emission and its connection to the reconnection process occurring in the corona. For example, Brannon et al. (2015) analyzed the substructure in a flare ribbon observed with IRIS on 2014 April 18 that peaked at 13:03 UT. The observations have a relatively high cadence of about 10 s, and analysis of the Si iv 1403 Å line profiles indicate that there is a sawtooth pattern of alternating red shifts and blue shifts along the ribbon with a period of about 140 s. The intensity oscillates as well, out of phase with the Doppler shifts. This pattern propagates along the slit with a phase velocity of ∼ 15 km/s. Their interpretation of these observations is that instabilities that form in the current sheet region propagate down to the flare ribbons and cause oscillatory motions that appear as alternating Doppler shifts. An alternate view of the same flare was presented by Brosius and Daw (2015), who interpret the IRIS data as being evidence for bursty reconnection followed by subsequent deposition of energetic particles in the chromosphere. This interpretation accounts for the alternating Doppler shifts, but does not account for the phase velocity. Modeling indicates that a tearing mode instability in the current sheet with an asymmetric shear flow can explain both the oscillations and the phase velocity observed by IRIS (Parker and Longcope, 2017).
Another interesting example comes from French et al. (2021), who used high-cadence IRIS slit jaw images to examine the growth of the intensity in flare ribbons at different spatial scales in a B class flare that occurred on 2016 December 6. In this study, the intensity along the ribbon is used to calculate a fast Fourier transform (FFT), resulting in a power spectrum in the spatial domain for each time. As the ribbon intensity brightens to its peak, an exponential rise in power is seen at all spatial scales. The exponential growth starts initially at a spatial scale of 1.75 Mm, and then other shorter and longer spatial scales follow, indicating that both a cascade and an inverse cascade process are occurring. The start and end times of the exponential growth as a function of spatial scale is plotted in Figure 5. Models show that the cascade and reverse cascade occurring together can be caused by a tearing mode instability due to the simultaneous coalescence and collapse of plasmoids (Tenerani and Velli, 2020). Thus the flare ribbons may be mirroring the effects of a tearing mode instability in the flare current sheet. Exponential growth at the 1.75 Mm spatial scale begins before non-thermal velocities are detected, suggesting the tearing mode is the driver of plasma turbulence.
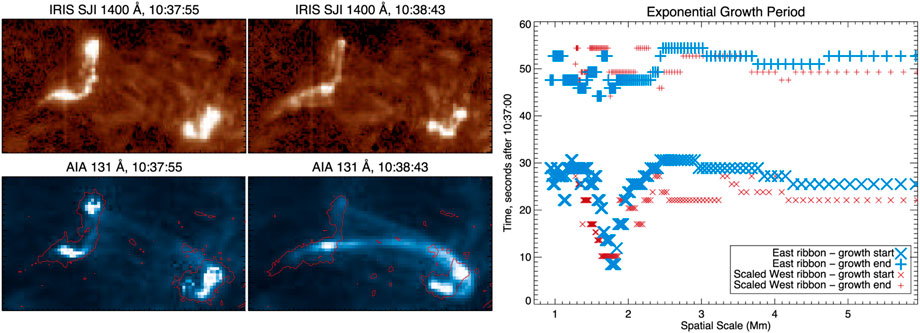
FIGURE 5. Left panels show the IRIS 1400 Å slit jaw images and SDO/AIA 131 Å images at two times during the 2016 December 6 flare. The right panel shows the start and end times of the period of exponential growth in power as a function of spatial scale. Adapted from French et al. (2021).
Naus et al. (2022) used the high resolution imaging of the IRIS Slit Jaw Imager (SJI) to examine the flare ribbons of the same flare observed by Brannon et al. (2015) and compared the results to hard X-ray footpoint emission observed by RHESSI and the Gamma-ray Burst Monitor (GBM) on Fermi. They find that in the later phase of this event the largest widths of the ribbon fronts and most intense bursts of UV emission are co-temporal and co-spatial with the hard X-ray emission, as shown in Figure 6. This observation implies that the hard X-rays are activated when the flare ribbon width is increasing quickly, an indication that the reconnection is bursty. The authors speculate that this burstiness could be caused by the formation of magnetic islands in the current sheet, consistent with the interpretation of Parker and Longcope (2017) that a tearing mode instability is present in this events. A model where particles are accelerated in magnetic islands would naturally lead to the close correlation between the UV brightness and the hard X-ray emission.
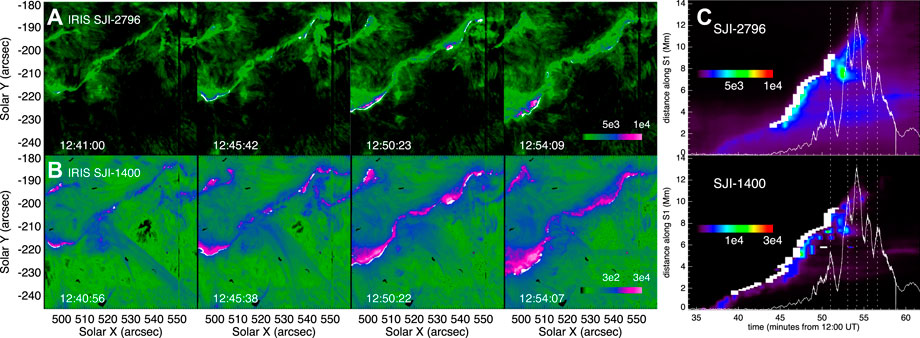
FIGURE 6. Panels (A,B) show the IRIS 2796 Å and 1400 Å slit jaw images, respectively, of the 2014 April 18 flare. White symbols indicate the newly brightened ribbon fronts. Panel (C) shows time distance diagrams of the ribbon intensity in the 2796 Å and 1400 Å images along a cut perpendicular to the ribbon. The height of the white bars corresponds to the width of the newly brightened part of the ribbon along the cut. The white line is the light curve of the hard X-ray emission in the 24–51 keV range from Fermi/GBM, and vertical dotted lines indicate the times of hard X-ray bursts. Adapted from Naus et al. (2022).
In the flare observed by Naus et al. (2022), the ribbon width enhancements precede the peaks in the UV emissions and hard X-rays by 30–120 s, indicating a timescale for the energy release process during reconnection, and that non-thermal electrons might be trapped in the corona before hitting the chromosphere. Several studies have found broadened Mg ii profiles consistently appear at the leading edge of flare ribbons (Xu et al., 2016; Panos et al., 2018; Panos and Kleint, 2021). These spectral signatures similarly precede the brightest emission in the UV and X-rays, indicating that they are the near UV signature of the reconnection occurring in the current sheet. Some possible explanations for the broadened profiles are turbulence or to the superposition of unresolved downflows at different heights in the chromosphere. However, more modeling is needed in order to understand exactly what these profiles mean for the energy release in the current sheet.
5 Conclusion
Thanks to its high spatial and temporal resolution, IRIS observations have led to several advances in the study of reconnection. IRIS has conclusively shown that fast outflows of up to ∼400 km/s occur during the reconnection process in flares, and the bi-directional outflows that are expected as part of the reconnection have also been clearly observed by IRIS. Some evidence for termination shocks in flares has also been found in IRIS observations, and it has become clear from IRIS observations that there are complicated dynamics occurring in the region above the flare loop tops. Flare ribbons are also proving to be a rich area of study, and IRIS observations of these regions are shedding light on the nature of the reconnection process.
While much progress in understanding the reconnection process has been made thanks to IRIS, there is still work to do. In particular, it is difficult to directly observe the region where reconnection is taking place with a spectroscopic instrument like IRIS simply because it is challenging to place the slit in the proper location at the right time during an eruption. Several serendipitous measurements of this region have occurred (e.g., Tian et al., 2014; Reeves et al., 2020), but much more progress will be made in understanding the reconnection process with the launch of the Multi-slit Solar Explorer (MUSE), which will combine high resolution (0.33 arcsec) context imaging with a 37-slit EUV spectrograph that has a resolution of 0.167 arcsec along the slits, covering the area of an active region with a cadence as fast as 12 s (Cheung et al., 2022). This configuration will guarantee that there will be spectroscopic coverage of areas of interest with both high spatial resolution and a fast cadence during flares, undoubtedly increasing our understanding of the reconnection region. Additionally, the upcoming EUV High-Throughput Spectroscopic Telescope (EUVST) on the Solar-C mission (Shimizu et al., 2020) will provide high spatial and temporal resolution spectroscopy in the EUV with a broad temperature coverage from the chromosphere (20,000 K) to hot plasma observed in flares (20 MK). This capability will provide data to discriminate between different models of energy deposition in flare ribbons and diagnostics of directly heated plasma in the reconnection region. High resolution spectropolarimetery of the photosphere, chromosphere, and low corona from the new Daniel K. Inoue Solar Telescope (Rimmele et al., 2020) will be able to diagnose changes in pre- and post-eruption magnetic fields, identifying flare triggering mechanisms and providing information about magnetic field changes as a function of height in the solar atmosphere (Rast et al., 2021). The future is indeed bright for studying reconnection physics in solar flares.
Author contributions
KR reviewed the papers summarized in this work and wrote the manuscript.
Funding
This work supported by contract 8100002705 from Lockheed-Martin to SAO and NASA grant NNX14AD43G.
Acknowledgments
The author would like to thank Dr. Graham Kerr for insightful comments that improved this paper. IRIS is a NASA small explorer mission developed and operated by LMSAL with mission operations executed at NASA Ames Research center and major contributions to downlink communications funded by the Norwegian Space Center (NSC, Norway) through an ESA PRODEX contract.
Conflict of interest
The author declares that the research was conducted in the absence of any commercial or financial relationships that could be construed as a potential conflict of interest.
Publisher’s note
All claims expressed in this article are solely those of the authors and do not necessarily represent those of their affiliated organizations, or those of the publisher, the editors and the reviewers. Any product that may be evaluated in this article, or claim that may be made by its manufacturer, is not guaranteed or endorsed by the publisher.
References
Brannon, S. R., Longcope, D. W., and Qiu, J. (2015). Spectroscopic observations of an evolving flare ribbon substructure suggesting origin in current sheet waves. Astrophys. J. 810, 4. doi:10.1088/0004-637X/810/1/4
Brosius, J. W., and Daw, A. N. (2015). Quasi-periodic fluctuations and chromospheric evaporation in a solar flare ribbon observed by IRIS. Astrophys. J. 810, 45. doi:10.1088/0004-637X/810/1/45
Cai, Q., Shen, C., Raymond, J. C., Mei, Z., Warmuth, A., Roussev, I. I., et al. (2019). Investigations of a supra-arcade fan and termination shock above the top of the flare-loop system of the 2017 September 10 event. MNRAS 489, 3183–3199. doi:10.1093/mnras/stz2167
Cai, Q., Ye, J., Feng, H., and Zhao, G. (2022). Variations of the plasma environment revealed by the evolution of the supra-arcade fan in the 2017 september 10 flare. Astrophys. J. 929, 99. doi:10.3847/1538-4357/ac5fa4
Chen, H., Zhang, J., Li, L., and Ma, S. (2016). Tether-cutting reconnection between two solar filaments triggering outflows and a coronal mass ejection. Astrophys. J. 818, L27. doi:10.3847/2041-8205/818/2/L27
Cheung, M. C. M., Martínez-Sykora, J., Testa, P., De Pontieu, B., Chintzoglou, G., Rempel, M., et al. (2022). Probing the physics of the solar atmosphere with the multi-slit solar explorer (MUSE). II. Flares and eruptions. Astrophys. J. 926, 53. doi:10.3847/1538-4357/ac4223
Culhane, J. L., Harra, L. K., James, A. M., Al-Janabi, K., Bradley, L. J., Chaudry, R. A., et al. (2007). The EUV imaging spectrometer for Hinode. Sol. Phys. 243, 19–61. doi:10.1007/s01007-007-0293-1
De Pontieu, B., Polito, V., Hansteen, V., Testa, P., Reeves, K. K., Antolin, P., et al. (2021). A new view of the solar Interface region from the Interface region imaging spectrograph (IRIS). Sol. Phys. 296, 84. doi:10.1007/s11207-021-01826-0
De Pontieu, B., Title, A. M., Lemen, J. R., Kushner, G. D., Akin, D. J., Allard, B., et al. (2014). The Interface region imaging spectrograph (IRIS). Sol. Phys. 289, 2733–2779. doi:10.1007/s11207-014-0485-y
Forbes, T. G., Seaton, D. B., and Reeves, K. K. (2018). Reconnection in the post-impulsive phase of solar flares. Astrophys. J. 858, 70. doi:10.3847/1538-4357/aabad4
French, R. J., Matthews, S. A., Jonathan Rae, I., and Smith, A. W. (2021). Probing current sheet instabilities from flare ribbon dynamics. Astrophys. J. 922, 117. doi:10.3847/1538-4357/ac256f
Golub, L., Deluca, E., Austin, G., Bookbinder, J., Caldwell, D., Cheimets, P., et al. (2007). The X-ray telescope (XRT) for the Hinode mission. Sol. Phys. 243, 63–86. doi:10.1007/s11207-007-0182-1
Graham, D. R., and Cauzzi, G. (2015). Temporal evolution of multiple evaporating ribbon sources in a solar flare. Astrophys. J. 807, L22. doi:10.1088/2041-8205/807/2/L22
Graham, D. R., Cauzzi, G., Zangrilli, L., Kowalski, A., Simões, P., and Allred, J. (2020). Spectral signatures of chromospheric condensation in a major solar flare. Astrophys. J. 895, 6. doi:10.3847/1538-4357/ab88ad
Guo, L., Li, G., Reeves, K., and Raymond, J. (2017). Solar flare termination shock and synthetic emission line profiles of the Fe xxi 1354.08 Å line. Astrophys. J. 846, L12. doi:10.3847/2041-8213/aa866a
Hara, H., Watanabe, T., Harra, L. K., Culhane, J. L., and Young, P. R. (2011). Plasma motions and heating by magnetic reconnection in a 2007 may 19 flare. Astrophys. J. 741, 107. doi:10.1088/0004-637X/741/2/107
Imada, S., Aoki, K., Hara, H., Watanabe, T., Harra, L. K., and Shimizu, T. (2013). Evidence for hot fast flow above a solar flare arcade. Astrophys. J. 776, L11. doi:10.1088/2041-8205/776/1/L11
Innes, D. E., McKenzie, D. E., and Wang, T. (2003). Observations of 1000 km s−1 Doppler shifts in 107 K solar flare supra-arcade. Sol. Phys. 217, 267–279. doi:10.1023/B:SOLA.0000006874.31799.bc
Lemen, J. R., Title, A. M., Akin, D. J., Boerner, P. F., Chou, C., Drake, J. F., et al. (2012). The atmospheric imaging assembly (AIA) on the solar dynamics observatory (SDO). Sol. Phys. 275, 17–40. doi:10.1007/s11207-011-9776-8
Li, Y., Kelly, M., Ding, M. D., Qiu, J., Zhu, X. S., and Gan, W. Q. (2017). Spectroscopic observations of magnetic reconnection and chromospheric evaporation in an X-shaped solar flare. Astrophys. J. 848, 118. doi:10.3847/1538-4357/aa89e4
Lin, R. P., Dennis, B. R., Hurford, G. J., Smith, D. M., Zehnder, A., Harvey, P. R., et al. (2002). The reuven ramaty high-energy solar spectroscopic imager (RHESSI). Sol. Phys. 210, 3–32. doi:10.1023/A:1022428818870
Moore, R. L., Sterling, A. C., Hudson, H. S., and Lemen, J. R. (2001). Onset of the magnetic explosion in solar flares and coronal mass ejections. Astrophys. J. 552, 833–848. doi:10.1086/320559
Naus, S. J., Qiu, J., DeVore, C. R., Antiochos, S. K., Dahlin, J. T., Drake, J. F., et al. (2022). Correlated spatio-temporal evolution of extreme-ultraviolet ribbons and hard X-rays in a solar flare. Astrophys. J. 926, 218. doi:10.3847/1538-4357/ac4028
Panos, B., and Kleint, L. (2021). Exploring mutual information between IRIS spectral lines. II. Calculating the most probable response in all spectral windows. Astrophys. J. 915, 77. doi:10.3847/1538-4357/ac00c0
Panos, B., Kleint, L., Huwyler, C., Krucker, S., Melchior, M., Ullmann, D., et al. (2018). Identifying typical Mg II flare spectra using machine learning. Astrophys. J. 861, 62. doi:10.3847/1538-4357/aac779
Parker, J., and Longcope, D. (2017). Modeling a propagating sawtooth flare ribbon structure as a tearing mode in the presence of velocity shear. Astrophys. J. 847, 30. doi:10.3847/1538-4357/aa8908
Polito, V., Galan, G., Reeves, K. K., and Musset, S. (2018). Possible signatures of a termination shock in the 2014 March 29 X-class flare observed by IRIS. Astrophys. J. 865, 161. doi:10.3847/1538-4357/aadada
Polito, V., Reep, J. W., Reeves, K. K., Simões, P. J. A., Dudík, J., Del Zanna, G., et al. (2016). Simultaneous IRIS andhinode/eis observations and modeling of the 2014 october 27 X2.0 class flare. Astrophys. J. 816, 89. doi:10.3847/0004-637X/816/2/89
Polito, V., Reeves, K. K., Del Zanna, G., Golub, L., and Mason, H. E. (2015). Joint high temperature observation of a small C6.5 solar flare with Iris/Eis/Aia. Astrophys. J. 803, 84. doi:10.1088/0004-637X/803/2/84
Qiu, J., Liu, W., Hill, N., and Kazachenko, M. (2010). Reconnection and energetics in two-ribbon flares: A revisit of the bastille-day flare. Astrophys. J. 725, 319–330. doi:10.1088/0004-637X/725/1/319
Qiu, J., Wang, H., Cheng, C. Z., and Gary, D. E. (2004). Magnetic reconnection and mass acceleration in flare-coronal mass ejection events. Astrophys. J. 604, 900–905. doi:10.1086/382122
Rast, M. P., Bello González, N., Bellot Rubio, L., Cao, W., Cauzzi, G., Deluca, E., et al. (2021). Critical science plan for the Daniel K. Inouye solar telescope (DKIST). Sol. Phys. 296, 70. doi:10.1007/s11207-021-01789-2
Reeves, K. K., McCauley, P. I., and Tian, H. (2015). Direct observations of magnetic reconnection outflow and CME triggering in a small erupting solar prominence. Astrophys. J. 807, 7. doi:10.1088/0004-637X/807/1/7
Reeves, K. K., Polito, V., Chen, B., Galan, G., Yu, S., Liu, W., et al. (2020). Hot plasma flows and oscillations in the loop-top region during the 2017 september 10 X8.2 solar flare. Astrophys. J. 905, 165. doi:10.3847/1538-4357/abc4e0
Rimmele, T. R., Warner, M., Keil, S. L., Goode, P. R., Knölker, M., Kuhn, J. R., et al. (2020). The Daniel K. Inouye solar telescope - observatory overview. Sol. Phys. 295, 172. doi:10.1007/s11207-020-01736-7
Ruan, W., Yan, L., and Keppens, R. (2022). MHD turbulence formation in solar flares: 3D simulation and synthetic observations.
Savage, S. L., Holman, G., Reeves, K. K., Seaton, D. B., McKenzie, D. E., and Su, Y. (2012). Low-altitude reconnection inflow-outflow observations during a 2010 november 3 solar eruption. Astrophys. J. 754, 13. doi:10.1088/0004-637X/754/1/13
Savage, S. L., McKenzie, D. E., Reeves, K. K., Forbes, T. G., and Longcope, D. W. (2010). Reconnection outflows and current sheet observed with Hinode/XRT in the 2008 April 9 ”cartwheel CME” flare. Astrophys. J. 722, 329–342. doi:10.1088/0004-637X/722/1/329
Shen, C., Polito, V., Reeves, K. K., Chen, B., Yu, S., and Xie, X. (2022). Non-thermal broadening of IRIS Fe XXI lines caused by plasma bulk flows in magnetic reconnection regions during solar eruptions. Frontiers.
Shibata, K., Takasao, S., and Reeves, K. K. (2022). Numerical study on excitation of turbulence and oscillation in above-the-loop-top region of a solar flare. Astrophys. J.
Shimizu, T., Imada, S., Kawate, T., Suematsu, Y., Hara, H., Tsuzuki, T., et al. (2020). The solar-C_EUVST mission: The latest status. Soc. Photo-Optical Instrum. Eng. (SPIE) Conf. Ser. 11444, 114440N. doi:10.1117/12.2560887
Takasao, S., and Shibata, K. (2016). Above-the-loop-top oscillation and quasi-periodic coronal wave generation in solar flares. Astrophys. J. 823, 150. doi:10.3847/0004-637X/823/2/150
Tenerani, A., and Velli, M. (2020). Spectral signatures of recursive magnetic field reconnection. Mon. Not. R. Astron. Soc. 491, 4267–4276. doi:10.1093/mnras/stz3310
Tian, H., and Chen, N. H. (2018). Multi-episode chromospheric evaporation observed in a solar flare. Astrophys. J. 856, 34. doi:10.3847/1538-4357/aab15a
Tian, H., Li, G., Reeves, K. K., Raymond, J. C., Guo, F., Liu, W., et al. (2014). Imaging and spectroscopic observations of magnetic reconnection and chromospheric evaporation in a solar flare. Astrophys. J. 797, L14. doi:10.1088/2041-8205/797/2/L14
Wang, T. J., Solanki, S. K., Curdt, W., Innes, D. E., Dammasch, I. E., and Kliem, B. (2003). Hot coronal loop oscillations observed with SUMER: Examples and statistics. Astron. Astrophys. 406, 1105–1121. doi:10.1051/0004-6361:20030858
Wang, T., Sui, L., and Qiu, J. (2007). Direct observation of high-speed plasma outflows produced by magnetic reconnection in solar impulsive events. Astrophys. J. 661, L207–L210. doi:10.1086/519004
Wilhelm, K., Curdt, W., Marsch, E., Schühle, U., Lemaire, P., Gabriel, A., et al. (1995). Sumer - solar ultraviolet measurements of emitted radiation. Sol. Phys. 162, 189–231. doi:10.1007/BF00733430
Xu, Y., Cao, W., Ding, M., Kleint, L., Su, J., Liu, C., et al. (2016). ULTRA-NARROW NEGATIVE FLARE FRONT OBSERVED IN HELIUM-10830 Å USING THE 1.6 m NEW SOLAR TELESCOPE. Astrophys. J. 819, 89. doi:10.3847/0004-637X/819/2/89
Xue, Z., Yan, X., Yang, L., Wang, J., Feng, S., Li, Q., et al. (2018). Spectral and imaging observations of a current sheet region in a small-scale magnetic reconnection event. Astrophys. J. 858, L4. doi:10.3847/2041-8213/aabe77
Yu, S., Chen, B., Reeves, K. K., Gary, D. E., Musset, S., Fleishman, G. D., et al. (2020). Magnetic reconnection during the post-impulsive phase of a long-duration solar flare: Bidirectional outflows as a cause of microwave and X-ray bursts. Astrophys. J. 900, 17. doi:10.3847/1538-4357/aba8a6
Keywords: solar magnetic reconnection, solar activity, solar flares, solar flare spectra, solar ultraviolet emission
Citation: Reeves KK (2022) A window into magnetic reconnection: IRIS observations of the consequences of reconnection during solar flares. Front. Astron. Space Sci. 9:1041951. doi: 10.3389/fspas.2022.1041951
Received: 12 September 2022; Accepted: 16 November 2022;
Published: 09 December 2022.
Edited by:
Viggo Hansteen, Bay Area Environmental Research Institute, United StatesReviewed by:
Graham S. Kerr, The Catholic University of America, United StatesCopyright © 2022 Reeves. This is an open-access article distributed under the terms of the Creative Commons Attribution License (CC BY). The use, distribution or reproduction in other forums is permitted, provided the original author(s) and the copyright owner(s) are credited and that the original publication in this journal is cited, in accordance with accepted academic practice. No use, distribution or reproduction is permitted which does not comply with these terms.
*Correspondence: Katharine K. Reeves, a3JlZXZlc0BjZmEuaGFydmFyZC5lZHU=