 Jeongwoo Lee1,2,3*
- 1Institute for Space Weather Sciences, New Jersey Institute of Technology, University Heights, Newark, NJ, United States
- 2Center for Solar-Terrestrial Research, New Jersey Institute of Technology, University Heights, Newark, NJ, United States
- 3Big Bear Solar Observatory, New Jersey Institute of Technology, Big Bear City, CA, United States
Microwave maps may provide critical information on the flux rope interaction and the breakout eruption if their polarization is measured with high precision. We demonstrate this diagnostic capability using the 17 GHz maps from the Nobeyama Radioheliograph (NoRH) of a circular ribbon flare SOL2014-12-17T04:51. The EUV images from SDO/AIA and the coronal magnetic field extrapolated from the HMI magnetogram are also used to support the interpretation of the microwave data. The most obvious evidence for the breakout eruption comes from the sign change of the microwave polarization over the AR at heliographic coordinates S20E09, indicating change of the overlying fields from a closed fan structure to a spine-like structure. Another important piece of evidence comes from the spatial and temporal variations of quasi-periodic pulsations (QPP) detected at the 17 GHz. The QPP was more obvious in one loop leg before the eruption and later moved to the spine field region on and after the flare. This indicates that the oscillatory power is transferred from an interacting flux rope to the outer spine, along which the reconnection launches torsional Alfvén waves, in good agreement with MHD model predictions for breakout eruption. In the practical viewpoint, these two diagnostics work because microwave observations are free of saturation even in strong flaring regions.
1 Introduction
In this paper, we study microwave emission during circular ribbon flares (CRFs) as a new topic in solar eruption not yet fully documented. CRFs occur in a special configuration where one parasitic magnetic field in a single magnetic polarity is surrounded by magnetic fields in the other polarity (Masson et al., 2009; Reid et al., 2012; Wang and Liu 2012; Sun et al., 2013). Such magnetic configuration implies a dome-shaped fan separatrix overlying the central field (Lau and Finn 1990; Rickard and Titov 1996; Galsgaard and Nordlund 1997; Galsgaard et al., 2003). Since this configuration is basically a magnetically confined structure, any eruption associated with CRFs will significantly alter the overlying field structure. Based on the existing knowledge of solar eruption, we can think of two possible scenarios. One is that magnetic fields are stretched out of the closed configuration to push up the overlying fields as proposed for the coronal mass ejection (CME) from a confined structure (e.g., Chen 2011), in line with the standard model for solar eruptive flares (Kopp and Pneuman 1976; Priest and Demoulin 1995; Demoulin et al. 1996). The other scenario is that magnetic reconnection occurs at the null point, and the so-called breakout eruption follows (Antiochos 1998). Since then, numerous MHD simulations on the eruption out of closed fan-spinestructure have followed to challenge the observed properties of CRFs (DeVore and Antiochos 2000; MacNeice et al. 2004; Karpen et al. 2012; Lynch et al. 2016; Wyper et al. 2017; Dahlin et al. 2019) to indicate possible observational signatures of each process involved with the breakout eruption. Some studies addressed eruptions associated with CRFs in terms of unstable filaments residing inside of the fan structure triggered by ideal magnetohydrodynamics (MHD) instabilities (Sun et al., 2013; Liu et al., 2016; Jing et al., 2017; Lee et al., 2016a, Lee et al., 2016b; Lee et al., 2018; Liu et al., 2019). Aside from the CRF observations, the physics of three-dimensional magnetic reconnection in such a spherical fan structure has also been discussed from a theoretical viewpoint (Pontin and Galsgaard 2007; Pontin et al., 2007; Pontin et al., 2013).
Extreme Ultraviolet (EUV), UV, X-rays and Hα images have mainly served as observational tools for studying CRFs (Masson et al., 2009; Reid et al., 2012; Wang and Liu 2012; Masson et al., 2017). Meanwhile, microwave radiation was not fully utilized. Since it is emitted by electrons gyrating about the coronal magnetic field, microwave radiation is regarded as being sensitive to both magnetic field and energetic electrons in the corona, and thus capable of exclusive diagnostics on CRFs (cf. Lee et al. 2020ab). The most commonly cited microwave diagnostic on magnetic field arises from the gyroresonant radiation mechanism, in which case knowledge of effective harmonic number allows us to determine the field strength in the source from the observing frequency (Lee et al., 1993a; Lee et al., 1993b; Gary and Hurford 2004). During solar flares, microwave emission can also be used as a diagnostic tool for energetic electrons like hard X-rays. In fact, it can be more sensitive to a small number of electrons depending on the ambient magnetic field under the mechanism of gyrosynchrotron radiation (Rybicki and Lightman 1979). The most important property is the microwave polarization, because its sign directly indicates the polarity of the coronal magnetic field (Zheleznyakov, 1970, 1998; Lee et al. 1993b; Zheleznyakov et al., 1996; Lee et al., 1998). On the other hand, microwave maps lack morphological details as fine as we can find on EUV and Hα images. Accordingly, microwave emission, while being sensitive to field strength and orientation, does not help tracing field lines, a capability critically important for studying magnetic reconnection and eruption. The diagnostic capability of microwave radiation on CRFs was therefore an open question.
To verify microwave diagnostics for CRFs, we investigate temporal and spatial variations of microwave polarization around the flare time with existing data. We also make use of the traditional tools available from (E)UV images and magnetograms along with the coronal field extrapolation techniques. As our focus is on the microwave diagnostics, we avoid a comprehensive review of ideal MHD instabilities and resistive processes leading to solar eruption in the CRFs. However, we attempt to test if microwave observation can help distinguish between the afore-mentioned two scenarios: the standard eruption and the breakout eruption from a confined magnetic structure.
2 Data and Analyses
We review multi-wavelength studies of the circular ribbon flare SOL2014-12-17T04:51. The main dataset is the 17/34 GHz maps from the Nobeyama Radioheliograph (NoRH) with the polarization information available at the 17 GHz. In other wavelengths, the data in the range of 1.2–2.0 GHz from the Mingantu Spectral Radioheliograph (MUSER, Chen et al., 2019) and 1.0–9.4 GHz from the Nobeyama Radiopolarimeter (NoRP) are used to complement the NoRH data. In addition, the (E)UV data from the Atmospheric Imaging Assembly (AIA) and magnetic data from the Helioseismic and Magnetic Imager (HMI) onboard the Solar Dynamics Observatory (SDO) are also used for contextual information.
The target CRF occurred in NOAA active region (AR) 12242 at its heliographic coordinates S20E09. The circular fan structure appears to be so strikingly clear in both EUV and microwave images as to attract many studies. They include analysis of EUV and magnetic field (Liu et al., 2019), quasi-periodic pulsations (QPP) with the 1.2–2.0 GHz MUSER data (Chen et al., 2019), thermal evolution using EUV differential emission measure (Lee et al., 2020a), and magnetic eruption using microwave polarization (Lee et al., 2020b). The data used in the present study are collected from those studies together with yet unpublished NoRH data.
2.1 The CRF in EUV and Microwave Wavelengths
Figure 1 shows how the microwave CRF evolved with time (Lee et al., 2020b). The NoRH 17 GHz maps are plotted as contours over the AIA (E)UV images at the six different times. In the preflare phase, the circular shape of the active region is apparent in the EUV imags and also in the 17 GHz maps (Figures 1A–C). Especially the 17 GHz maps on top of the AIA 94 Å images show that microwave emission also outlines the circular ribbon (Figure 1A). In the (E)UV channels, the 94 Å image best shows the hemispheric structure suggestive of the dome-shaped quasi-separatrix layer (QSL) postulated for the CRF-producing active regions. The outer spine structure is also visible at the western edge of the frame, which is another element for the CRF-producing active regions. The combination of the 17 GHz maps and the AIA 94 Å images suggests that the active region has a circular dome-shaped separatrix structure.
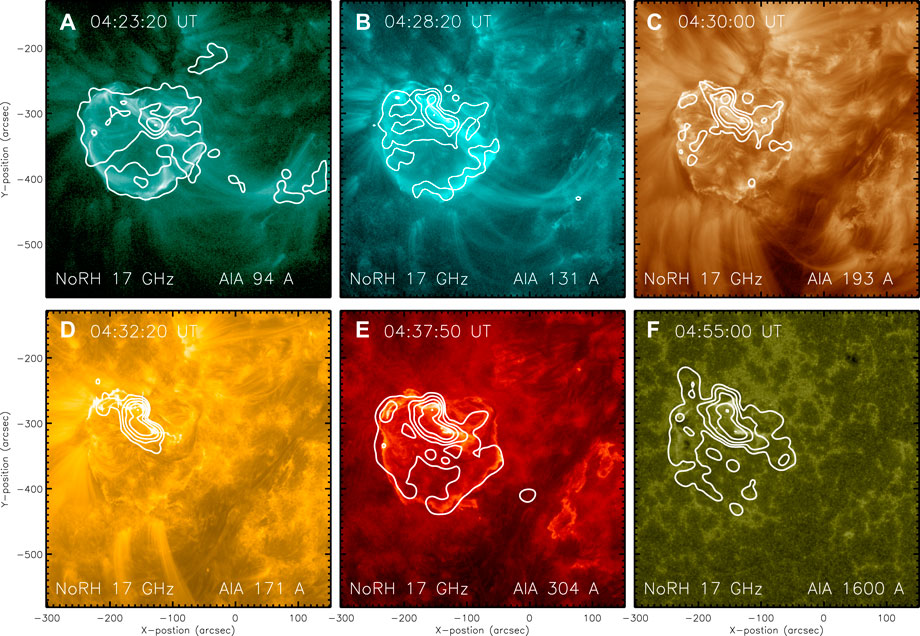
FIGURE 1. Microwave and (E)UV emissions of the CRF. The flare occurred at 04:51 UT on 2014-12-17 from NOAA AR 12242. Microwave sources evolving from the preflare phase (A–C) to the impulsive phase (D) and the postflare phase (D,F) are shown as contours over the AIA (E)UV images in the six channels at the corresponding times. Contour levels in the top panels are at [1.9, 7.0, 26.99]% of the maximum in each frame, and those in the bottom panels are at [0.5, 1.9, 7.0, 26.99]% of each maximum. (Source: Lee et al., 2020b).
Near the flare onset time, the local region in the north brightens up, while the circular ribbon remains apparent in the south of the active region (Figure 1B). In the background EUV images, the outer spine halo structure is best visible at 94 and 131 Å and less apparent in other channels, meaning that it is hot and tenuous (Lee et al., 2020). Around the impulsive phase, the strong EUV emission is more concentrated in the elongated shape connected to the center of the active region where magnetic fields are strongest (Figure 1C).
During the flare, the circular shape of the 17 GHz source is no longer visible as buried under the strong flare emission. Rather, the flare emission at 17 GHz is highly concentrated in the small elongated region, which appears to be a flare loop (Figure 1D). Due to the finite dynamic range in the 17 GHz maps, the southern part of the circular ribbon is less obvious at the flare peak time (Figure 1E).
In the decay phase, the circular shape of the 17 GHz source is partially recovered (Figure 1F). The circular ribbons are most clearly visible in the 304 Å images and the inner ribbons, in the 1,600 Å images. Since UV sources occur in the regions of intense energy deposition into the chromosphere and microwave sources show the coronal part, they may represent a loop-like structure with two conjugate footpoints.
2.2 Magnetic Structure
Liu et al. (2019) studied the coronal magnetic fields of this active region reconstructed from the HMI magnetogram at 04:07:54 UT under the assumption of either the potential field or nonlinear force-free field (NLFFF). Considering the fact that this AR NOAA 12242 is not isolated but surrounded by other ARs, they set the boundary of the extrapolation box large enough to cover 808 × 520 pixels2, with the modest height of the box, 256 pixels. The potential field was derived using the fast Fourier transform method (Alissandrakis 1981). The NLFFF was derived, after preprocessing of the boundary condition (Wiegelmann et al., 2006), using the “weighted optimization” method (Wheatland et al., 2000; Wiegelmann 2004) suitable for HMI magnetograms (Wiegelmann and Inhester 2010; Wiegelmann et al., 2012). They also calculated the squashing factor Q and twist number Tw using the Liu et al.’s (2016) code. Q is then used to define so-called quasi-separatrix layers (QSLs) where Q ≫ 1 (Titov et al., 2002). Tw is used to judge whether or not a flux rope is subject to the kink instability (Török et al., 2004; Fan 2005; Török and Kliem 2005; Kliem et al., 2010). The exact value of threshold Tw for the instability varies depending on the magnetic field configuration.
Figure 2A shows the potential field lines around the null point at a preflare time, which reproduces the dome-shaped separatrix with a great similarity to the EUV images (Figure 1). Figure 2B shows, as the background image, a 304 Å image blended with the signed logarithmic squashing factor s log Q at z = 0, computed with the potential field model, where s is the sign of Bz (Titov et al., 2011). The regions of high-Q outline the footpoints of the QSLs, and as expected, the fan and inner/outer spines are rooted in those regions. A magnetic null point is found at z = 31.3 Mm, close to the cusp-like structure seen in the EUV images. The null-point topology predicted by this potential field extrapolation is in good agreement with the EUV and microwave observations (Figure 1).
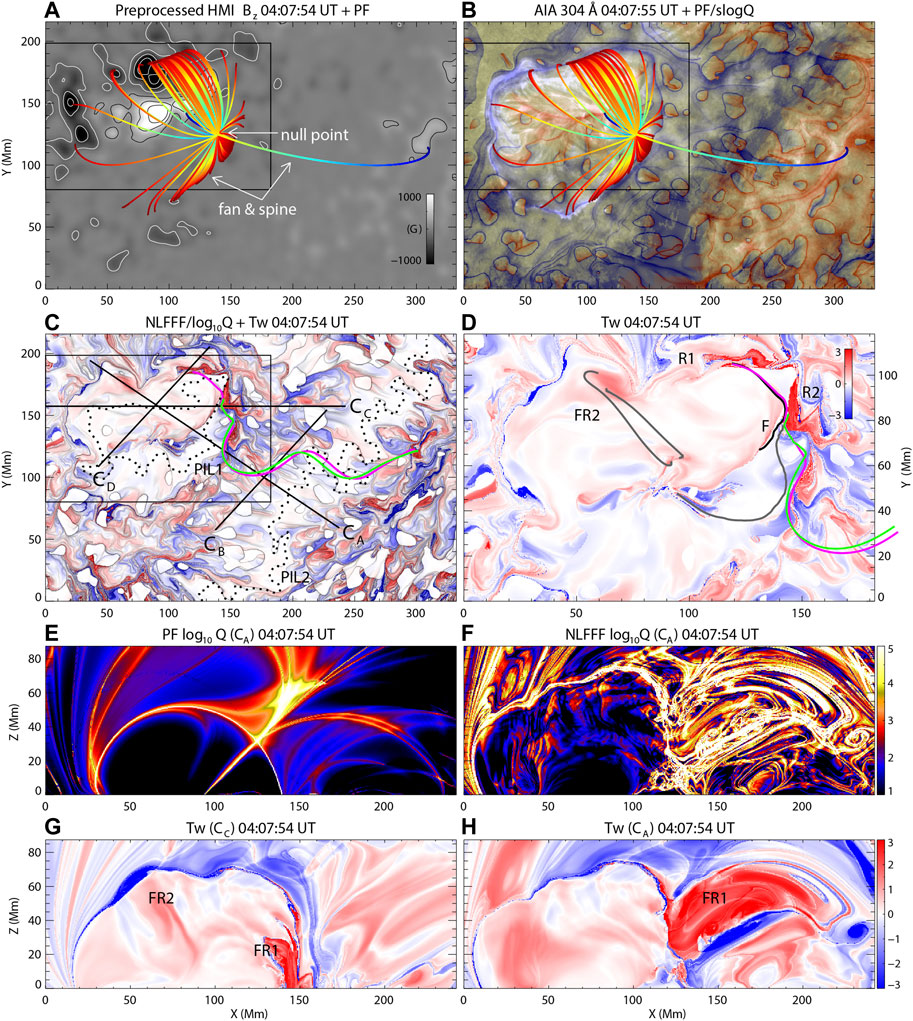
FIGURE 2. Magnetic structure and topology over the active region before the flare. Selective potential field lines around the null point are plotted over the HMI Bz (A) and over a composite AIA 304 Å image blended with s log Q (B). Maps of Tw computed with the NLFFF in the range of ∓2 (blue/red) are shown as composite images blended with log Q above 1 (white) and below 5 (black) in the full box (C) and in a subregion (D). Dotted lines show the PIL1 and PIL2. (D) Distribution of s log Q in the vertical plane CA passing through the null point predicted by the potential field (E) and the NLFFF (F). Distribution of Tw in the vertical plane CC (G) and CA (H). (Source: Liu et al., 2019).
Figures 2C,D show logarithmic Q blended with twist number Tw derived from the NLFFF at z = 0. The two regions, R1 and R2, are twisted in the positive sense and adjacent to the filament F, which can be the footpoints of a fux rope (FR1). The field lines from R1 and R2 (purple and green lines) are connected to the remote brightening region, which is twisted in the same sense. Another group of twisted field lines (FR2) is found to be sheared across the northern portion of the polarity inversion line (PIL).
Figures 2E,F display Q maps on two vertical planes, CA including the null point and CC passing through the footpoint of the inner spine. The potential field model clearly shows that the spine and the dome-shaped QSL (Figure 2E). It is also visible in the NFFF model, but more complicated than in the potential field model, although the basic structure is retained in both models. The Tw map on the cutting plane CA (Figure 2H) shows two flux ropes, FR1 and FR2, residing inside the fan surface. Along the northern horizontal portion of PIL1 (Figure 2C) the enhanced Tw indicates a large flux rope (FR3) outside of the fan surface (see Figure 5), which may affect the dynamical evolution of the AR as a whole upon interaction with either FR2 or FR3.
2.3 Polarization Change at 17 GHz
Lee et al. (2020b) presented microwave polarization maps of this active region around the flare time. We reproduce the result in Figure 3, which shows contours of the polarized intensity V = R − L (red/blue contours) at 17 GHz. Thus the red contours represent the right-hand circular polarization (RHCP) and the blue contours, the left-hand circular polarization (LHCP), respectively (see, for definition, Ratcliffe, 1959; Cohen, 1960). How microwave polarization should appear above solar active regions according with the magnetic polarity distribution is well known from earlier studies (Zheleznyakov, 1962; Zheleznyakov, 1970; Zheleznyakov and Zlotnik, 1964; Zheleznyakov and Zlotnik, 1988; Zhelznyakov 1970; Melrose 1975; Melrose, 1985; Dulk, 1985; Lee et al., 1993b; Lee, 2007). Microwave polarization could also be used as a diagnostic tool for twisted magnetic fields, as demonstrated by theoretical gyrosynchrotron radiation calculated using a set of model flare loops (Gordovskyy et al. 2017), and by analysis of the microwave data of the 2014-02-11 flare (Sharykin et al. 2018). The total intensity, I = R + L (yellow), maps at 17 GHz are also shown for comparison with Figure 1. The evolution of the total intensity is such that it was initially concentrated over the central sunspot and expands northward and eastward to form a loop-like structure (Figures 3A–C), which then expands during the impulsive phase and the decay phase (Figures 3D–F).
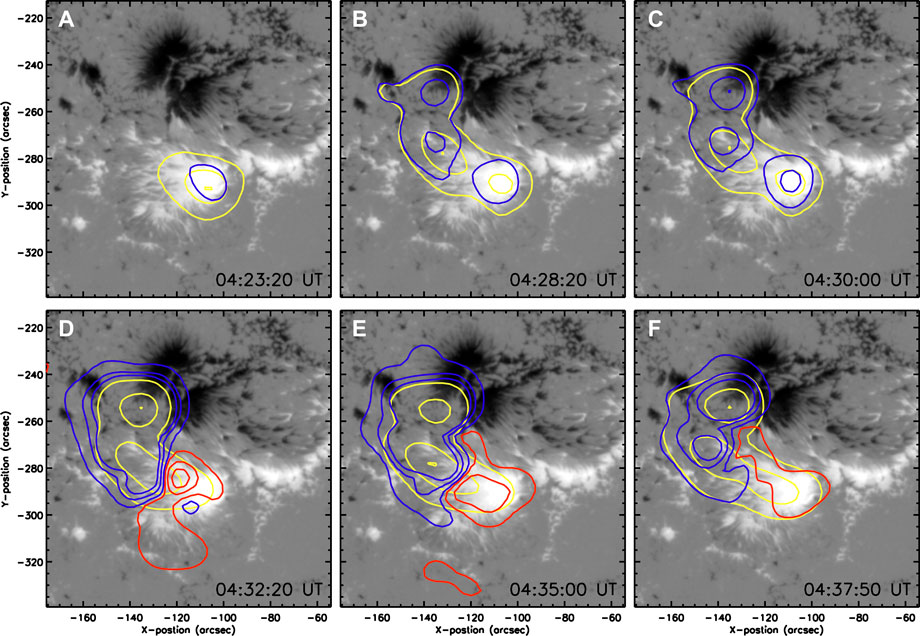
FIGURE 3. Total and polarized microwave emissions plotted over the HMI line-of-sight magnetograms. The 17 GHz total intensity (yellow contours) is plotted at [10, 50, 100]% of its maximum at each time. The polarized intensity in LHCP (RHCP) are plotted in blue (red) contours in absolute levels, [10, 50, 100]% of ±2.3 MK. In the preflare phase, all sources are LHCP (A–C), while the region over the central spot becomes RHCP during the impulsive phase (D) and remains so during the decay phase (E, F). (Source: Lee et al., 2020b).
In the preflare phase (Figures 3A–C), the microwave emission is polarized only in LHCP (blue contours). This is actually an odd phenomenon because microwave polarization should appear in two different states over bipolar magnetic fields. The northern source is from the negative magnetic polarity region, and it should be LHCP as observed. However, the central source is from the positive-polarity region and should be RHCP, but appears to be LHCP. We regard this LHCP over the central region as the one being reversed from its original polarization, RHCP. This requires that the sign of the microwave polarization at 17 GHz strictly represents the magnetic polarity distribution measured in the photosphere, i.e., no apparent polarity reversal due to the projection effect. At the time of the flare, this active region, NOAA AR 12242 was at the heliographic coordinates S20E09 close to the disk center. This 17 GHz intensity is found to be optically thin, in view of the relative brightness temperatures at the 17/34 GHz, and thus emitted from the strongest field region in the corona, practically close to the photospere. These two conditions make the projection effect negligible.
During the impulsive phase (Figure 3D), the central region over the positive-polarity sunspot restores its original polarization state, RHCP (red contours). The RHCP signal remains through the decay phase (Figures 3E,F). The restoration of the original polarization state on and after the flare is possible only when the overlying fields no longer block the rays. A drastic structural change should have occurred in the overlying field, and a magnetic breakout–type eruption in the fan-spine magnetic structure is the most compelling scenario (Lee et al., 2020b). This polarization change exclusively available from the microwave radiation may not be a well-reported phenomenon, which is unique to CRFs and indicates a structural change in the fan-spine system.
2.4 Microwave Activations in the Early and Late Phases
Lee et al. (2020ab) investigated activation of the preflare activity exploiting the high sensitivity of microwave radiation to thermal heating and nonthermal electron acceleration as shown in Figure 4. They investigated the local time variations of the microwave emissions from four subregions marked on the inverted 17 GHz intensity map (Figure 4A). Here A and C are identified as the conjugate footpoints to each other, and B is thus the looptop. D represents the loop as a whole including the three regions. In each region, they add up the brightness temperatures (hereafter, Tb) in all pixels, and divide it by the total number of pixels so that the quantities shown in Figure 4 can represent spatially–averaged intensity being equivalent to local mean Tb.
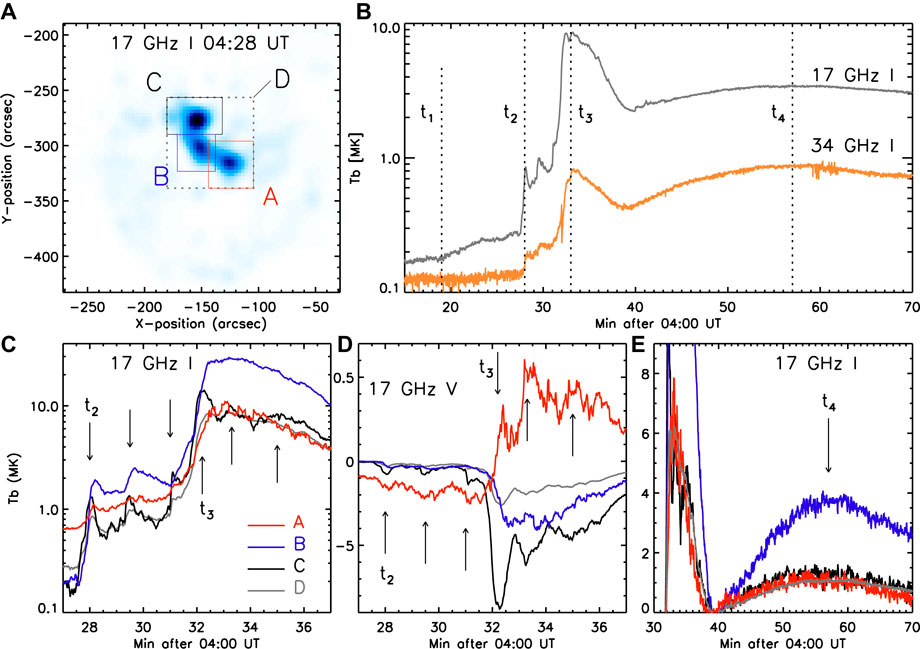
FIGURE 4. Activation and pulsation of the microwave emission during the CRF. Four local regions denoted as A–D are set for calculating local average Tb on the inverted 17 GHz map at t2 (A). The average Tb from D are plotted along with the four transition times, t1–t4 (B) marked with the vertical dotted lines. Time profiles of the total (C) and the polarized 17 GHz intensities (D) are plotted along with the arrows pointing to the temporally local peaks. Time profiles of the relative Tb in a longer period including the late phase (E) show that the largest △Tb occurred in region B, the looptop. (Adapted from Lee et al., 2020b).
Figure 4B shows the average Tb at the 17 and 34 GHz from the entire loop, D. The four key transition times denoted here are the thermal activation time (t1), the nonthermal activation time (t2), the peak energy release time (t3), and the second peak energy release time (t4). They count the first rise of the 17 GHz Tb as the thermal activation time, because at this time there is no corresponding increase of Tb at the 34 GHz as expected for thermal gyroresonant radiation. The second rise of Tb at the 17 GHz comes together with that of the 34 GHz, which is expected under the nonthermal gyrosynchrotron radiation mechanism. The two activations at t1 and t2 therefore represent the energy release of different nature, with the latter being more intense. It is obvious that the simultaneous increase of the 17 and 34 GHz Tb at t3 represent nonthermal gyrosynchrotron radiation associated with the maximum magnetic energy release. The gradual rise and fall of Tb around t4 is likely to represent the late phase activity of this event. Since thermal bremsstrahlung opacity is inversely proportional to the square of frequency (see, e.g., Dulk 1985), the agreement of the four-fold 34 GHz Tb (gray colored curve) to the 17 GHz Tb indicates that the thermal radiation dominates in this late phase.
Figures 4C,D shows the local 17 GHz Tb of the total and polarized Tb measured from the four regions, distinguished by colors. By marking the multiple peaks with the arrows, Lee et al. (2020b) argued that an oscillatory variation is superimposed on the average gradual lightcurve, a phenomenon very similar to QPPs. In the total intensity lightcurves (Figure 4C), the quasi-oscillation is the most obvious in C, and least in A. Namely, the quasi-oscillation is more clearly visible in regions farther from the inner spine. The polarized intensity (Figure 4D) also behaves similarly but its quasi-oscillation appears not only in the preflare phase but in the flare phase, and becomes even stronger during the impulsive phase. Such temporal evolution is consistent with the UV QPP (Chen et al., 2019, see Section 2.7). Spatial distribution of the oscillatory power in V is opposite to that in I. The quasi-oscillation of V is more obvious in A, namely, closer to the inner spine.
Figure 4E emphasizes the incremental Tb variation in the decay phase. Such a post-flare microwave enhancement in a looptop was detected in many events. Reznikova et al. (2009) presented a model for nonthermal electrons trapped in flare loops. Kim et al. (2014) interpreted it as due to enhancement of plasma flows along supra-arcade structures. Chen et al. (2016) and Chen et al. (2017) proposed that it represents strong heating near the coronal X-point. In the present event, however, the secondary peak at t4 is well separated from the impulsive peak at t3 by about 25 min. Such a long delay should be studied within the context of the EUV late phase activity (Woods et al., 2011; Hock et al., 2012). In solar radio community, a microwave burst with an impulsive peak followed by a gradual secondary peak coincident with the soft X-ray peak is regarded as a sign for the so-called compound flares with thermal activity in the decay phase (Lee et al., 2017; Ning et al., 2018). In the present case, we have already identified the dominant radiation mechanism with the optically-thin thermal Bremsstrahlung, and the largest △Tb found in B indicates the most significant plasma accumulation in the looptop.
2.5 Activations in the EUV Wavelengths
Liu et al. (2019) used only EUV and magnetic data, which provide no information on nonthermal particles, to extract insights into the cause of the flare loop activation. Figure 5 shows their results of the magnetic structure (left panels) and time variation of the EUV and X-ray emissions (right panels). The lightcurves of the soft X-rays (Figure 5A).
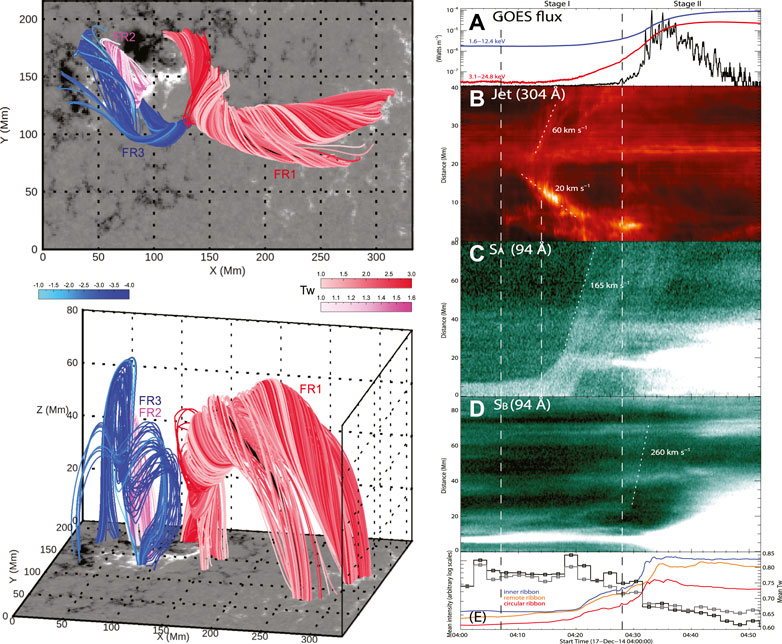
FIGURE 5. Left: the NLFFF field lines at a preflare time in the top view (top) and a perspective view (bottom). The colors represent Tw, and a different color table is used for Tw in each flux rope. Right: the GOES lightcurves and the time derivative of the 1.6–12.4 keV passband flux (A). Time-distance plots for a curved slit (B), and two linear slits, SA (C), and SB (D). Time profiles of the average 304 Å intensity of ribbons and the average Tw in the northern (black) and southern (gray) footpoint regions of FR2 (E). The dashed vertical lines denote stages I and II, respectively. (Source: Liu et al., 2019, Figures 4, 6).
Based on the time-distance plots, they determined two key times: 1) at ∼04:12 UT, bidirectional jets originated from between the filament F and the region R2 in he 94 Å. The jets ran both southward and northward at 20 km/s and 60 km/s, respectively (Figure 5B). This may have triggered the eruption of FR1, at least, partially, as the upper part of FR1 was already torus-unstable. Upon its eruption, FR1 could readily reconnect with FR3 because they are oppositely twisted. This reconnection at the null then produced the circular ribbon. 2) At ∼04:28 (see the second vertical dashed line) a compact 304 Å kernel, k1, suddenly appears and the time derivative of the GOES light curve shows a short peak (Figure 5A). The latter corresponds to an impulsive nonthermal acceleration, considering the Neupert effect (Neupert 1968). Note that this second major transition time is in exact match with the nonthermal activation time t2 detected from the relative 17/34 GHz variation in Section 2.4.
Interaction between FR1 and FR2 could lead to so-called fan-spine reconnection. However this reconnection could not immediately occur because FR3 lies between them and was playing a role in suppressing FR2 from eruption. Since FR1 and FR3 are twisted in the opposite sense, reconnection between them could occur first, reducing the flux of FR3. Figure 5E shows that the mean twists of both FR2 and FR3 measured at their footpoints were decreasing through 04:28 UT (the second vertical dashed line). This time corresponds to t2 identifed as the time of nonthermal activation based on the 17/34 GHz time profiles in Lee et al. (2020b). When FR3 is sufficiently weak, it no longer plays a role in suppressing FR2 and thus invites the breakout eruption. That occurs at t3, the time of significantly decreased magnetic twist (Figure 5E) and also the time of eruption, t3, as found from the 17/34 GHz time profiles (Lee et al., 2020b). Based on the role of FR3 in mediating the interaction between FR1 and FR2, Liu et al. (2019) claimed the two-stage eruption (cf. Török et al., 2009), which begin at the times denoted by the two vertical dashed lines in the right panels of Figure 5.
2.6 Quasi-Periodic Oscillations at 17 GHz
QPPs are a common feature of flare energy release detected in a wide range of wavelength. They seem to occur in both two-ribbon flares and CRFs. Reported QPP periods range from seconds (e.g., Aschwanden 1987; Tan 2008) to several minutes (e.g., Foullon et al. 2005; Kislyakov et al. 2006). We thus investigate the repeating peaks in the local 17 GHz intensity time profiles by performing a wavelet analysis, and show the result in Figure 6. We first remove the envelope of flare lightcurves, which we calculate by averaging the lightcurves over the time interval of 2.0 min, and the result is less sensitive to the choice of the interval in the range of 1.5–2.5 min. These net signals are still influenced by the drastic rise in the impulsive phase and can cause a bias in the wavelet analysis. To avoid this problem, we use logarithmic intensity log I rather than I. For the polarized intensity, we use the degree of polarization, i.e., V/I, which already takes care of the drastic increases in the impulsive phase. These time profiles, the original intensity (black line) and the envelope (red) used for the wavelet analysis, are shown in the inset of each panel in Figure 6, and the power spectral densities obtained by the wavelet analysis are shown as grayscale images. The blue dashed lines mark the lower boundaries of the regions where the wavelet results are regarded as valid.
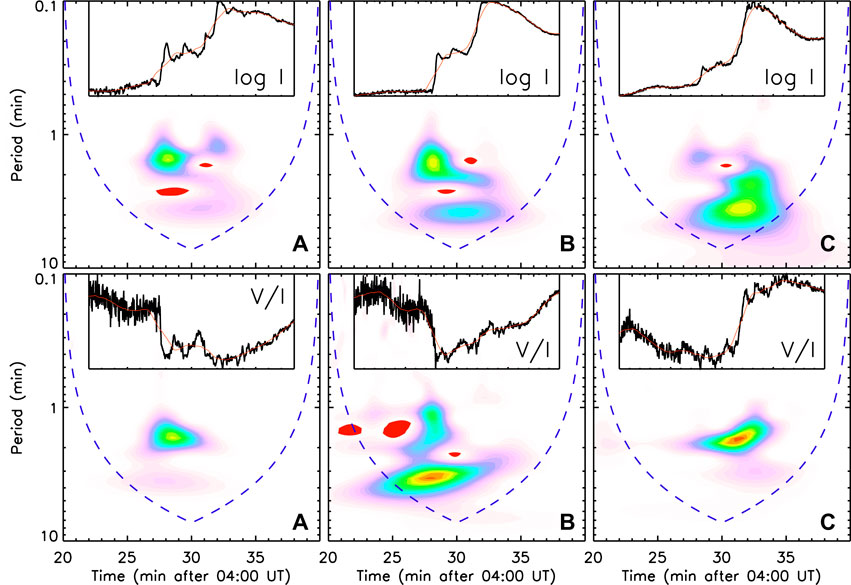
FIGURE 6. Wavelet analyses of the total intensity (top panels) and degree of polarization (bottom) of 17 GHz emissions from three regions (A–C) (denoted in Figure 4A). The inset in each panel shows the observed time profile (black line) and its running average (red). The difference between the two curves is used to produce the power spectral density (grayscale images) valid above the dashed blue line. Both the intensity and the power spectral density are plotted with the same time axis. (Source: Lee et al., 2020c).
In region A (the first column), the total intensity power density has the main peak at t2 with period ∼1.2 min and a secondary peak at t3 near 1.1 min. On the other hand, the polarization power density has a single peak around t2 with a quasi-period ∼1.3 min. In region B (looptop, second column), the total intensity power is more widely distributed with one peak at period ∼1.3 min and another at ∼4.0 min. The polarized power in B also shows multiple peaks with both a short and a longer period between 1 min and 5 min. In region C (third column), the total intensity power spectrum starts at t2 but extends to t3, with power in a wide range of periodicity between 2 min and 4 min. However, the polarized power spectrum is most concentrated in the period around 1.5–2.0 min. These results confirms the above qualitative investigation of the local lightcurves (Figure 4) in that the preflare oscillation (t2 ≤ t < t3) is more obvious around the northern footpoint (A) and the flare oscillations (t ≥ t3) are more obvious in the polarized intensity V of the inner spine region (C). Timewise, these oscillations all start at t2. For t2 ≤ t ≤ t3, both total and polarized power spectra are more clearly detected in A. For t ≥ t3, the quasi-periodicity is more evident in the polarized power of C. Such a change in oscillation property at t3 may be associated with the magnetic field structural change due to the eruption.
As a comparison, Chen et al. (2019) found 2 min radio QPPs in the frequency range 1.2–2.0 GHz during the impulsive phase. Considering the spatial resolutions used in the study, these two findings are almost identical with each other, except that Lee et al. (2020b) used NoRH’s high resolution to resolve the flare loop structure. These periods are shorter than any likely period of MHD waves (if presumed to be a longitudinal fundamental mode) for typical coronal active region conditions (Aschwanden et al., 2020), but within the range of the kink oscillation periods, 5.4 ± 2.3 min, found in a statistical study (Aschwanden et al., 2002).
2.7 Quasi-Periodic Pulsations in Other Wavelengths
The QPPs in this event were also found at other wavelengths. Figure 7 shows the result of a wavelet analysis performed by Chen et al. (2019). Top six panels show AIA (E)UV images and mark local regions of interests in the left and time profiles of the mean intensity calculated from the local region(s) in the right. The bottom two panels show the wavelet analysis results. They started with the 171 Å channel data by setting a slit (white arrow) across the circular ribbon (Figure 7A) to create a time–distance map for the 171 Å intensity (Figure 7B). That map shows the local motion of the circular ribbon, and the intensity lightcurve clearly presents the periodic oscillations before the flare onset. After the flare, the ribbon continues to expand at the speed of about 6 km/s, but the periodicity is less obvious.
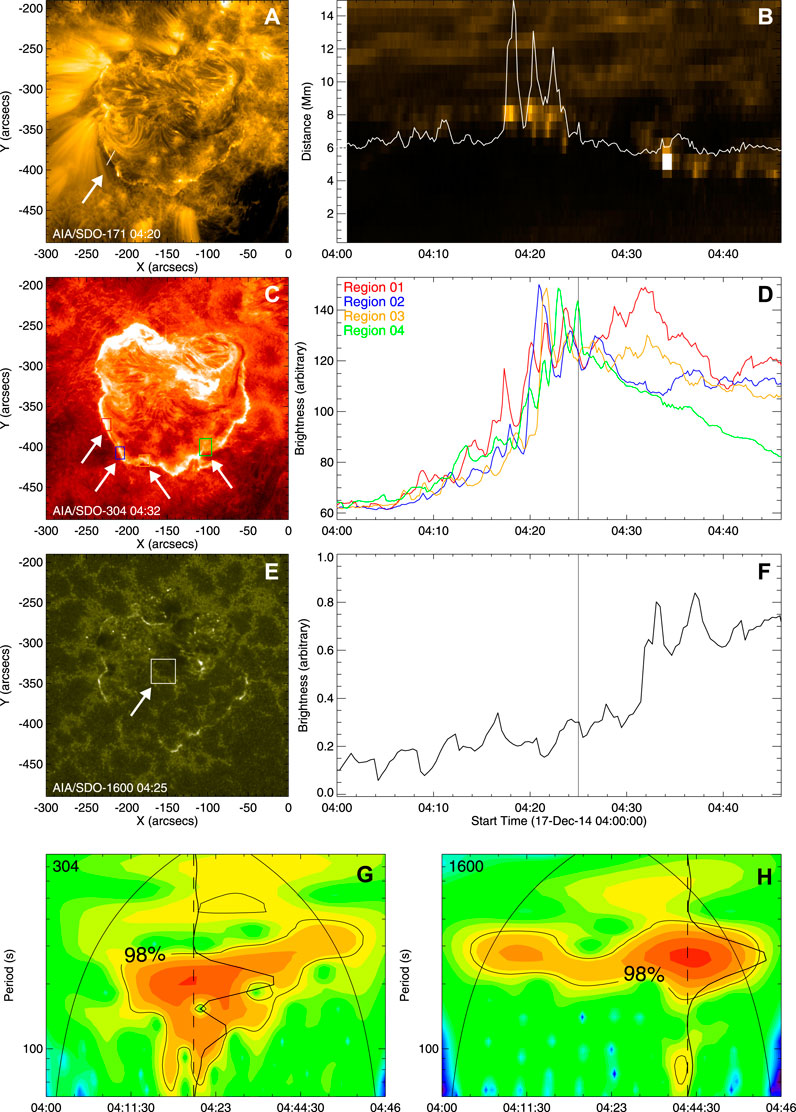
FIGURE 7. AIA (E)UV observations and wavelet analyses. Upper left panels show AIA (E)UV images: 171 Å (A), 304 Å (C), and 1,600 Å (E). Upper right panels show time profiles of the mean intensity calculated from the box(es) marked in the left panels: the time–distance map and the time profile of the 171 Å intensity in the center of the slit (B), the average 304 Å intensities in the four local regions (D), and that of the 1,600 Å intensity (F). The vertical line represents the starting time of this flare based on the GOES lightcurves. Bottom two panels show the wavelet analysis results of the 304 Å flux collected from the red box (G) and that of the 1,600 Å from the white box (H). (Source: Chen et al., 2019).
To further investigate oscillatory motion of the circular ribbon, they set four small boxes on the 304 Å ribbon as marked in Figure 7C. The local fluxes plotted in Figure 7D show that the QPPs again appeared before the flare (04:00–04:25 UT) and disappear after the flare onset. The wavelet analysis using this data is plotted in Figure 7G which shows the period of 198 s. When they apply the same analyses to other channels of the 304, 131, and 211 Å, they found similar quasi-periods of about 200 s, close to 3 min.
Now we need to check if the QPP also occurred in the core of the active region. This could be studied with the EUV channel data, because their measurements are saturated during the flare maximum phase. Chen et al. (2019) also investigated the 1,600 Å UV intensity at the center of the active region (Figures 7E,F) to find that the QPPs appear from 04:00 UT and last until 04:46 UT. Unlike the above EUV analysis result, the QPP sustained from the preflare to the post-flare phase, and actually even stronger during and a little after the flare. The period of this UV QPP with is about 250 s a little longer and rather close to 4 min (Figure 7H).
We thus find that the QPPs around this CRF appear all of the active region with quasi-periods varying with location and time. The EUV QPPs with ∼3 min period occurs along the circular ribbon in the preflare phase. The UV QPPs has a period of ∼4 min is well visible in the active region core and active from the preflare to the postflare phase. The radio (1.2–2.0 GHz) QPPs occurs with ∼2 min period around the flaring region during the impulsive phase. The microwave (17 GHz) emission from the loop-like structure shows both the short period (2 min) and long period (3–4 min), and sustains from the preflare phase to the impulsive phase changing the location.
The different period may arise from different length of the field lines participating in the oscillation, which in turn depends on location within the active region. The location of the dominant oscillatory power in different wavelengths may depend on the detectability of the radiation. Namely, the oscillation period varies with position and time. In each wavelength we detected different part of the oscillations, as discussed in the previous section (Section 2.6). It is an interesting result that the quasi-period of the 17 GHz flux (Lee et al., 2020b) agrees closely to those of the QPP sources at the 2 GHz (Chen et al., 2019). These oscillatory powers must reside in the flare loop. On the other hand, the EUV QPPs are found in the outskirt of the active region as the EUV emission in the flare loop is saturated.
3 Discussion
We mainly discuss the newly found properties of the microwave CRF: the sudden change of microwave polarization during the flare, the quasi-oscillation persisting during the eruption, and the microwave signature of the nonthermal activation. To facilitate this discussion, we use the illustrations (Lee et al. 2020c) presented in Figure 8, which shows the structural changes of the active region as described thus far. Key elements are the fan-spine structure (cyan), the flaring loop with magnetic polarities colored red and blue, along with the null point (orange dot), inner ribbon (red circle), and circular ribbon (cyan circle). It also shows the hypothetical torsional Alfvén waves (black wavy curves) generated at time of BCS (orange dashed circle) formation at t2, and propagate away along the outer spine after the breakout eruption at t3. The polarization maps on the top are meant to schematically represent the actual observations shown in Figure 3. They are not the degrees of polarization but the polarized intensities thus showing only the prominent components rather than the full polarization distributions over the entire active region. Figure 8A shows the single polarization concentration above the central spot at the null point reconnection (t1) as in Figure 3A. Figure 8B reproduces the observed polarization map at t2 when nonthermal energetic electrons fill up the flare loop to let the northern footpoint stand out in the polarized intensity (Figures 3B,C). Figure 8C shows the appearance of the RHCP source in the location of the previously LHCP source on and after the breakout eruption at t3 as shown in Figures 3D–F.
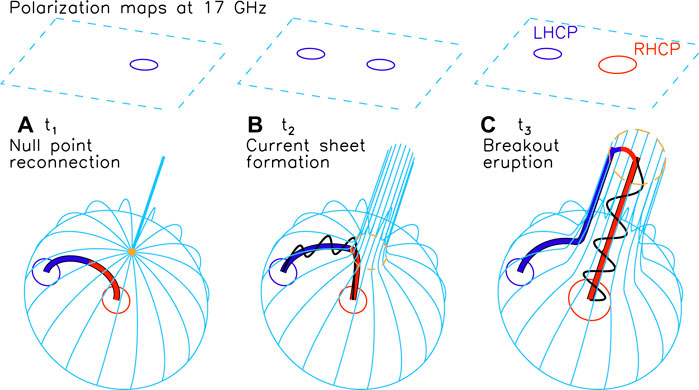
FIGURE 8. Schematic illustration of the three stages of the event evolution: (A) nullpoint reconnection, (B) nonthermal activation, and (C) breakout eruption. Top panels: microwave polarization maps on the projected sky plane showing LHCP (blue) and RHCP (red). Bottom panels: magnetic structural evolution showing the fan-spine field (cyan), the flaring loop with magnetic polarities distinguished in color, and the Alfvén waves (black wavy curves) as well as the null point (orange dot), BCS (orange dashed circle), inner ribbon (red circle) and circular ribbon (cyan circle). (Source: Lee et al., 2020c).
3.1 Rapid Change of Microwave Polarization
Microwave polarization reversal is often explicable as a mode-coupling process in which the original sense of polarization is reversed while the rays are passing through a quasi-transverse field (QT) layer from the source to observer (Cohen 1960; Zheleznyakov 1970). Not only that such a quasi-transverse layer should be present, but the degree of mode coupling in the layer should be high for the polarization reversal to occur (Melrose 1975; White et al., 1992; Lee et al., 1998). The fan–spine structure shown in Figure 8A does have such a magnetic field configuration, where the fan surface plays a role as a QT layer for the radio waves emitted below the fan surface.
However, looking at the fan structure shown in Figure 8, the mode coupling is an unlikely answer. In the initial configuration (Figure 8A), the magnetic fields above the fan surface are in the negative polarity, and the microwave radiation from below will be observed as LHCP regardless of the magnetic polarity at emission. Therefore, the LHCP observed over the entire active region can simply be explained based on the magnetic polarity distribution around the fan-spine structure, without any strong mode-coupling. At the onset of the flare, a structural change of the corona will occur as the fan surface partially turns into the so-called breakout current sheet (BCS, the orange dashed circle in Figure 8). Across the BCS, the magnetic fields inside the fan may reconnect with those outside of the fan, and the lower part of the rising and expanding BCS amounts to the newly open field lines (see, e.g., Lynch et al., 2016; Karpen et al., 2017). Such a change of magnetic field structure without the mode coupling can explain the rapid change of microwave polarization more naturally (Figure 8C).
If the strong mode coupling across a current sheet indeed affected the polarization (Zheleznyakov et al., 1996), then we should have been able to detect the change of polarization earlier than the flare. We thus conclude that the change from LHCP to RHCP of the 17 GHz emission over the active region core must indicate a breakout eruption out of the closed fan structure. This change of microwave polarization due to the rapid variation of magnetic polarity around the null point can be a new feature inherent to the fan–spine structure, which was never studied before.
3.2 Microwave Oscillations Around the Main Phase
The quasi-periodic oscillations in the 17 GHz lightcurves are depicted as black wavy curves in Figures 8B,C. They may represent either MHD oscillations or intermittent flare energy release. In the latter case, the peaks should have started after the eruption. Otherwise if they are one of the preflare activities, they should have ceased at the eruption. It is also possible that multiple peaks may arise before and after the eruption for different reasons. In this case, however, they do not necessarily maintain the same periodicity. We thus favor the former view that the oscillations which started before the flare and survived through the flare. The 17 GHz flux around the time of the eruption shows quasi-periodic peaks separated by 1–2 min. These quasi-periods are comparable to those of Chen et al.’s (2019) study on QPPs in EUV and 2 GHz data for this event and Zhang et al. (2020) for another CRF. Such short periods (≤5 min) are typically could be due to kink mode oscillations (Aschwanden et al., 2002; Chen et al., 2019; Aschwanden & Wang 2020).
We also emphasize that the clear-cut starting time of the 17/34 GHz flux increase at t2 coincides with that of the QPP at 2 GHz (Chen et al., 2019), and also agrees to the eruption signatures at 131 Å (Figure 4) and 94 Å (Liu et al., 2019). Therefore the pre-flare reconnection implied by the nonthermal activation also played a role as an external driver on this fan surface, and upon the impact on the fan surface, all closed field lines underneath may well undergo the oscillation altogether. In this sense, we regard this oscillatory phenomena as a characteristic feature of the CRF hosting structure, which works like a drum tied to the spines and the circular which works like a drum tied to the spines and the circular ribbon.
As a unique feature of the microwave polarization observation, the carrier of the dominant oscillatory power changes from I(t < t3) to V(t > t3) maintaining a similar period. A compelling scenario for this change is that the closed field lines around the inner spine field open up by the breakout eruption to serve as a conduit for the waves propagating along the spine. Many numerical simulations for fan-spine reconnection (Pariat et al., 2009; Pariat et al., 2010; Karpen et al., 2012; Pariat et al., 2015; Pariat et al., 2016; Wyper et al., 2016; Karpen et al., 2017; Wyper et al., 2017; Wyper et al., 2018) predict that reconnection at the null should launch torsional Alfvén waves propagating away along the outer spine. Some of these models can explain why the major oscillatory power is transferred from A to C at t3 in terms of the accumulation and release of the magnetic twist.
We may need to prove why torsional Alfvén waves should be the only candidate for the 17 GHz quasi-periodic oscillation. First of all, this wave mode was predicted specifically for the reconnection in a fan-spine structure like the current active region (Wyper et al., 2017). Secondly, suppose that either gas pressure or magnetic pressure (instead of magnetic twist) is released at the eruption to generate slow or fast MHD waves. They will cause change of field strength, which then contributes more to the oscillation of the 17 GHz total intensity. On the other hand, torsional Alfvén waves or simply Alfvén waves are capable of changing the field orientation to explain the oscillation of the 17 GHz polarized intensity.
3.3 Nonthermal Activation and Flux Rope Dynamics
Lee at al. (2020b) detected the nonthermal activation at t2 solely based on the different behavior of the 17 GHz flux from that of the 34 GHz flux. On the other hand, Liu et al. (2019) addressed this trigger issue using EUV and magnetic data alone, which has no direct access to the nonthermal particle information. According to their NFFF model, even this simple structured CRF is invloved with three flux ropes: FR1 formed by the outer spine-like loops rooted at the edge of the fan, a smaller loop, FR2 at the PIL inside the fan, and its overlying flux rope, FR3. Based on such a large-scale magnetic structure, Liu et al. (2019) concluded that the interaction of FR1 and FR2 has to be modulated by FR3 lying between them to invite the two-stage eruption. It is our interpretation that the dynamic evolution of FR3 acts as an external forcing for triggering the reconnection responsible for the nonthermal activation at t2, and that at this time the BCS starts to form and soon the breakout eruption follows at t3. Therefore the two different approaches confirm that t2 is the time of significant transition prior to the main eruption. The time interval, t3 − t2 ≈ 5 min between these two events agrees well to the model prediction (Wyper et al., 2017).
4 Conclusion
We have discussed a set of microwave and EUV studies on the circular ribbon flare, SOL2014-12-17T04:51 as a unique example for exploring the breakout eruption from a fan-spine structure. We paid special attention to the microwave polarization of the CRF as yet unexploited in other studies of CRFs. The noteworthy findings related to the breakout eruption are: 1) nonthermal activation in the form of simulataneous flux increases at 17/34 GHz, 2) 17 GHz polarization reversal at the time of the maximum flux, and 3) QPP of 17 GHz total intensity in the preflare phase and that of the polarized intensity in the flare phase.
The most obvious piece of evidence for the breakout eruption is the abrupt and permanent change of the microwave polarization, because the change from the preflare single polarization state to the mixed polarization state on and after the flare means that the multipolar magnetic fields underneath is covered by the single polarity magnetic field in the above, which then breaks out to let the original magnetic polarization escape as is. This conclusion is made solely based on the 17 GHz polarization observation with no reference to any particular model.
The second obvious piece of evidence is the quasi-oscillations detected in the microwave maps. Although QPPs are detected in other wavelengths too, the 17 GHz quasi-oscillation is the only one that persists from the pre-eruption oscillation to the post-eruption with positional shift of the oscillatory power from the loop to the outer spine field at the eruption. The mode of the oscillation seems to change from the kink mode the torsional Alfvén waves. Together with other QPPs, this finding leads to the picture that the dome-shaped fan structure vibrates like a drum tied to the spines and the circular ribbon. Note that the NoRH 17 GHz observation could detect the continuous change of the quasi-oscillation through the flare, because it did not saturate in the flare core region unlike in other wavelengths.
Thirdly, the microwave observation allows us to detect three major transition times. Especially, the nonthermal activation at t2, which we identified with the onset of the BCS formation appears too subtle in other radiations to be detected, and cannot directly be predicted by MHD models. The time intervals between t2 and two other critical times for the thermal activation (t1) and the impulsive energy release (t3) as detected in the microwave maps provide quantitative measures for the serial process starting with the transformation of a null point to the BCS, which then led to the breakout eruption from the fan-spine structure.
Finally we remark that the standard model for normal CMEs from a confined structure (Chen 2011) can also predict the change of the microwave polarization as observed. In that model, magnetic fields are stretched out to reconfigure the overlying field structure, which is practically not very different from the above picture. However, in the standard eruptive model, the reconnection below the flux rope occurs later than or almost simultaneously with the eruption. On the other hand, we witnessed that the processes of the null-point reconnection at t1, and the BCS formation at t2 followed by the breakout eruption at t3 are well separated from each other by noticeable time intervals. This series of processes is in accordance with the numerical simulation of the breakout model rather than the standard model for eruptive flares.
Author Contributions
The author confirms being the sole contributor of this work and has approved it for publication.
Funding
This work was supported by NASA grant, 80NSSC18K1705, and by the Center for Solar-Terrestrial Research (CSTR) at NJIT.
Conflict of Interest
The author declares that the research was conducted in the absence of any commercial or financial relationships that could be construed as a potential conflict of interest.
Publisher’s Note
All claims expressed in this article are solely those of the authors and do not necessarily represent those of their affiliated organizations, or those of the publisher, the editors and the reviewers. Any product that may be evaluated in this article, or claim that may be made by its manufacturer, is not guaranteed or endorsed by the publisher.
Acknowledgments
I thank Dr. Chang Liu for his long-term collaboration with me, which enabled this study. Nobeyama Radioheliograph was operated by the International Consortium for the Continued Operation of Nobeyama Radioheliograph (ICCON) consisting of ISEE/Nagoya University, NAOC, KASI, NICT, and GSFC/NASA.
References
Aschwanden, M. J., De Pontieu, B., Schrijver, C. J., and Title, A. M. (2002). SoPh 206, 99–132. doi:10.1023/a:1014916701283
Aschwanden, M. J. (1987). Theory of Radio Pulsations in Coronal Loops. Sol. Phys. 111, 113–136. doi:10.1007/bf00145445
Aschwanden, M. J., and Wang, T. (2020). Torsional Alfvénic Oscillations Discovered in the Magnetic Free Energy during Solar Flares. Astrophysical J. 891, 99. doi:10.3847/1538-4357/ab7120
Chen, X., Yan, Y., Tan, B., Huang, J., Wang, W., Chen, L., et al. (2019). Quasi-periodic Pulsations before and during a Solar Flare in AR 12242. Astrophysical J. 878, 78. doi:10.3847/1538-4357/ab1d64
Chen, Y., Wu, Z., Liu, W., Schwartz, R. A., Zhao, D., Wang, B., et al. (2017). Astrophysical J. 843, 8.
Cohen, M. H. (1960). Magnetoionic Mode Coupling at High Frequencies. Astrophysical J. 131, 664. doi:10.1086/146878
Dahlin, J. T., Antiochos, S. K., and DeVore, C. R. (2019). A Model for Energy Buildup and Eruption Onset in Coronal Mass Ejections. Astrophysical J. 879, 96. doi:10.3847/1538-4357/ab262a
Demoulin, P., Henoux, J. C., Priest, E. R., and Mandrini, C. H. (1996). Astron. Astrophysics 308, 643.
DeVore, C. R., and Antiochos, S. K. (2000). Dynamical Formation and Stability of Helical Prominence Magnetic Fields. Astrophysical J. 539, 954–963. doi:10.1086/309275
Dulk, G. A. (1985). Radio Emission from the Sun and Stars. Annu. Rev. Astron. Astrophys. 23, 169–224. doi:10.1146/annurev.aa.23.090185.001125
Fan, Y. (2005). Coronal Mass Ejections as Loss of Confinement of Kinked Magnetic Flux Ropes. Astrophysical J. 630, 543–551. doi:10.1086/431733
Foullon, C., Verwichte, E., Nakariakov, V. M., and Fletcher, L. (2005). Astron. Astrophysics 440L, 59.
Galsgaard, K., and Nordlund, Å. (1997). Heating and Activity of the Solar corona: 3. Dynamics of a Low Beta Plasma with Three-Dimensional Null Points. J. Geophys. Res. 102, 231–248. doi:10.1029/96ja02680
Galsgaard, K., Priest, E. R., and Titov, V. S. (2003). Numerical Experiments on Wave Propagation towards a 3D Null point Due to Rotational Motions. J. Geophys. Res. 108, 1042. doi:10.1029/2002ja009393
Gary, D. E., and Hurford, G. J. (2004). Radio Spectral Diagnostics. ASSL 314, 71–87. doi:10.1007/1-4020-2814-8_4
Hock, R. A., Chamberlin, P. C., Woods, T. N., Crotser, D., Eparvier, F. G., Woodraska, D. L., et al. (2012). Extreme Ultraviolet Variability Experiment (EVE) Multiple EUV Grating Spectrographs (MEGS): Radiometric Calibrations and Results. Sol. Phys. 275, 145–178. doi:10.1007/s11207-010-9520-9
Jing, J., Liu, R., Cheung, M. C. M., Lee, J., Xu, Y., Liu, C., et al. (2017). Astrophysical J. 842L, 18.
Karpen, J. T., DeVore, C. R., Antiochos, S. K., and Pariat, E. (2012). The Mechanisms for the Onset and Explosive Eruption of Coronal Mass Ejections and Eruptive Flares. Astrophysical J. 760, 81. doi:10.1088/0004-637x/760/1/81
Kim, S., Shibasaki, K., Bain, H.-M., and Cho, K.-S. (2014). Plasma Upflows and Microwave Emission in Hot Supra-arcade Structure Associated with an M1.6 Limb Flare. Astrophysical J. 785, 106. doi:10.1088/0004-637x/785/2/106
Kislyakov, A. G., Zaitsev, V. V., Stepanov, A. V., and Urpo, S. (2006). On the Possible Connection between Photospheric 5-Min Oscillation and Solar Flare Microwave Emission. Sol. Phys. 233, 89–106. doi:10.1007/s11207-006-2850-y
Kliem, B., Linton, M. G., Török, T., and Karlický, M. (2010). Reconnection of a Kinking Flux Rope Triggering the Ejection of a Microwave and Hard X-Ray Source II. Numerical Modeling. Sol. Phys. 266, 91–107. doi:10.1007/s11207-010-9609-1
Lau, Y.-T., and Finn, J. M. (1990). Three-dimensional Kinematic Reconnection in the Presence of Field Nulls and Closed Field Lines. Astrophysical J. 350, 672. doi:10.1086/168419
Lee, J., Karpen, J. T., Liu, C., and Wang, H. (2020a). Heating and Eruption of a Solar Circular-Ribbon Flare. Astrophysical J. 893, 158. doi:10.3847/1538-4357/ab80c4
Lee, J. (2007). Radio Emissions from Solar Active Regions. Space Sci. Rev. 133, 73–102. doi:10.1007/s11214-007-9206-2
Lee, J. W., Gary, D. E., and Hurford, G. J. (1993b). Microwave Emission from a sunspot. Sol. Phys. 144, 349–360. doi:10.1007/bf00627599
Lee, J., White, S. M., Chen, X., Chen, Y., Ning, H., Li, B., et al. (2020b). Microwave Study of a Solar Circular Ribbon Flare. Astrophysical J. 901, L10. doi:10.3847/2041-8213/abb4dd
Lee, I., White, S. M., Chen, X., Chen, Y., Ning, H., Li, B., et al. (2020c). arXiv:2009.11926 [astro-ph.SR].
Lee, J., White, S. M., Jing, J., Liu, C., Masuda, S., and Chae, J. (2017). Thermal and Nonthermal Emissions of a Composite Flare Derived from NoRH andSDOObservations. Astrophysical J. 850, 124. doi:10.3847/1538-4357/aa96b6
Lee, J., White, S. M., Kundu, M. R., Mikić, Z., and McClymont, A. N. (1998). SoPh 180, 193–211. doi:10.1023/a:1005061416572
Lee, J., White, S. M., Liu, C., Kliem, B., and Masuda, S. (2018). Magnetic Structure of a Composite Solar Microwave Burst. Astrophysical J. 856, 70. doi:10.3847/1538-4357/aaadbc
Lee, J. W., Hurford, G. J., and Gary, D. E. (1993a). Microwave Emission from a sunspot. Sol. Phys. 144, 45–57. doi:10.1007/bf00667981
Liu, C., Lee, J., and Wang, H. (2019). The Eruption of Outer Spine-like Loops Leading to a Double-Stage Circular-Ribbon Flare. Astrophysical J. 883, 47. doi:10.3847/1538-4357/ab3923
Liu, R., Kliem, B., Titov, V. S., Chen, J., Wang, Y., Wang, H., et al. (2016). Structure, Stability, and Evolution of Magnetic Flux Ropes from the Perspective of Magnetic Twist. Astrophysical J. 818, 148. doi:10.3847/0004-637x/818/2/148
Lynch, B. J., Edmondson, J. K., Kazachenko, M. D., and Guidoni, S. E. (2016). Reconnection Properties of Large-Scale Current Sheets during Coronal Mass Ejection Eruptions. Astrophysical J. 826, 43. doi:10.3847/0004-637x/826/1/43
MacNeice, P., Antiochos, S. K., Phillips, A., Spicer, D. S., DeVore, C. R., and Olson, K. (2004). A Numerical Study of the Breakout Model for Coronal Mass Ejection Initiation. Astrophysical J. 614, 1028–1041. doi:10.1086/423887
Masson, S., Pariat, E., Aulanier, G., and Schrijver, C. J. (2009). The Nature of Flare Ribbons in Coronal Null-point Topology. Astrophysical J. 700, 559–578. doi:10.1088/0004-637x/700/1/559
Masson, S., Pariat, É., Valori, G., Deng, N., Liu, C., Wang, H., et al. (2017). Flux Rope, Hyperbolic Flux Tube, and Late Extreme Ultraviolet Phases in a Non-eruptive Circular-Ribbon Flare. Astron. Astrophysics 604, A76. doi:10.1051/0004-6361/201629654
Melrose, D. B. (1985). in Solar Radiophysics. Editors D. J. McLean and N. R. Labrum (Cambridge: Cambridge University Press).
Melrose, D. B. (1975). Small-scale Inhomogeneities in the Solar corona: Evidence from Meter-λ Radio Bursts. Sol. Phys. 43, 79–86. doi:10.1007/bf00155144
Neupert, W. M. (1968). Comparison of Solar X-Ray Line Emission with Microwave Emission during Flares. Astrophysical J. 153, L59. doi:10.1086/180220
Ning, H., Chen, Y., Wu, Z., Su, Y., Tian, H., Li, G., et al. (2018). Two-stage Energy Release Process of a Confined Flare with Double HXR Peaks. Astrophysical J. 854, 178. doi:10.3847/1538-4357/aaaa69
Pariat, E., Antiochos, S. K., and DeVore, C. R. (2009). A Model for Solar Polar Jets. Astrophysical J. 691, 61–74. doi:10.1088/0004-637x/691/1/61
Pariat, E., Antiochos, S. K., and DeVore, C. R. (2010). Three-dimensional Modeling of Quasi-Homologous Solar Jets. Astrophysical J. 714, 1762–1778. doi:10.1088/0004-637x/714/2/1762
Pariat, E., Dalmasse, K., DeVore, C. R., Antiochos, S. K., and Karpen, J. T. (2016). A Model for Straight and Helical Solar Jets. Astron. Astrophysics 596, A36. doi:10.1051/0004-6361/201629109
Pariat, E., Dalmasse, K., DeVore, C. R., Antiochos, S. K., and Karpen, J. T. (2015). Model for Straight and Helical Solar Jets. Astron. Astrophysics 573, A130. doi:10.1051/0004-6361/201424209
Pontin, D. I., Bhattacharjee, A., and Galsgaard, K. (2007). Current Sheet Formation and Nonideal Behavior at Three-Dimensional Magnetic Null Points. Phys. Plasmas 14 (5), 052106. doi:10.1063/1.2722300
Pontin, D. I., Priest, E. R., and Galsgaard, K. (2013). On the Nature of Reconnection at a Solar Coronal Null Point above a Separatrix Dome. Astrophysical J. 774, 154. doi:10.1088/0004-637x/774/2/154
Priest, E. R., and Démoulin, P. (1995). Three-dimensional Magnetic Reconnection without Null Points: 1. Basic Theory of Magnetic Flipping. J. Geophys. Res. 100, 23443. doi:10.1029/95ja02740
Ratcliffe, J. A. (1959). The Magnetoionic Theory and its Application to the Ionosphere. Cambridge: Cambridge University Press, 206.
Reid, H. A. S., Vilmer, N., Aulanier, G., and Pariat, E. (2012). X-ray and Ultraviolet Investigation into the Magnetic Connectivity of a Solar Flare. Astron. Astrophysics 547, A52. doi:10.1051/0004-6361/201219562
Reznikova, V. E., Melnikov, V. F., Shibasaki, K., Gorbikov, S. P., Pyatakov, N. P., Myagkova, I. N., et al. (2009). 2002 August 24 Limb Flare Loop: Dynamics of Microwave Brightness Distribution. Astrophysical J. 697, 735–746. doi:10.1088/0004-637x/697/1/735
Rickard, G. J., and Titov, V. S. (1996). Current Accumulation at a Three‐dimensional Magnetic Null. Astrophysical J. 472, 840–852. doi:10.1086/178114
Rybicki, G. B., and Lightman, A. P. (1979). Radiative Processes in Astrophysics. Hoboken, NJ, USA: John Wiley & Sons.
Sun, X., Todd Hoeksema, J., Liu, Y., Aulanier, G., Su, Y., Hannah, I. G., et al. (2013). Hot Spine Loops and the Nature of a Late-phase Solar Flare. Astrophysical J. 778, 139. doi:10.1088/0004-637x/778/2/139
Tan, B. (2008). Observable Parameters of Solar Microwave Pulsating Structure and Their Implications for Solar Flare. Sol. Phys. 253, 117–131. doi:10.1007/s11207-008-9235-3
Titov, V. S., Mikić, Z., Linker, J. A., Lionello, R., and Antiochos, S. K. (2011). Magnetic Topology of Coronal Hole Linkages. Astrophysical J. 731, 111. doi:10.1088/0004-637x/731/2/111
Török, T., Aulanier, G., Schmieder, B., Reeves, K. K., and Golub, L. (2009). Astrophysical J. 704, 485.
Wang, H., and Liu, C. (2012). Circular Ribbon Flares and Homologous Jets. Astrophysical J. 760, 101. doi:10.1088/0004-637x/760/2/101
Wheatland, M. S., Sturrock, P. A., and Roumeliotis, G. (2000). An Optimization Approach to Reconstructing Force‐free Fields. Astrophysical J. 540, 1150–1155. doi:10.1086/309355
White, S. M., Thejappa, G., and Kundu, M. R. (1992). Observations of Mode Coupling in the Solar corona and Bipolar Noise Storms. Sol. Phys. 138, 163–187. doi:10.1007/bf00146202
Wiegelmann, T., and Inhester, B. (2010). How to deal with Measurement Errors and Lacking Data in Nonlinear Force-free Coronal Magnetic Field Modelling? A&A 516, A107. doi:10.1051/0004-6361/201014391
Wiegelmann, T., Inhester, B., and Sakurai, T. (2006). Preprocessing of Vector Magnetograph Data for a Nonlinear Force-free Magnetic Field Reconstruction. Sol. Phys. 233, 215–232. doi:10.1007/s11207-006-2092-z
Wiegelmann, T. (2004). Optimization Code with Weighting Function for the Reconstruction of Coronal Magnetic fields. Solar Phys. 219, 87–108. doi:10.1023/b:sola.0000021799.39465.36
Wiegelmann, T., Thalmann, J. K., Inhester, B., Tadesse, T., Sun, X., and Hoeksema, J. T. (2012). SoPh 281, 37.
Woods, T. N., Hock, R., Eparvier, F., Jones, A. R., Chamberlin, P. C., Klimchuk, J. A., et al. (2011). New Solar Extreme-Ultraviolet Irradiance Observations during Flares. Astrophysical J. 739, 59. doi:10.1088/0004-637x/739/2/59
Wyper, P. F., Antiochos, S. K., and DeVore, C. R. (2017). A Universal Model for Solar Eruptions. Nature 544, 452–455. doi:10.1038/nature22050
Wyper, P. F., DeVore, C. R., and Antiochos, S. K. (2018). A Breakout Model for Solar Coronal Jets with Filaments. Astrophysical J. 852, 98. doi:10.3847/1538-4357/aa9ffc
Wyper, P. F., DeVore, C. R., Karpen, J. T., and Lynch, B. J. (2016). Three-dimensional Simulations of Tearing and Intermittency in Coronal Jets. Astrophysical J. 827, 4. doi:10.3847/0004-637x/827/1/4
Zhang, Q. M., Dai, J., Xu, Z., Li, D., Lu, L., Tam, K. V., et al. (2020). Astron. Astrophysics 638A, 32. doi:10.1051/0004-6361/202038233
Zheleznyakov, V. V., Kocharovsky, V. V., and Kocharovsky, V., (1996). Astron. Astrophysics 308, 685.
Keywords: magnetic reconnection, magnetic fan-spine structure, alfven waves, solar extreme ultraviolet emission, solar radio emission, solar flares, solar magnetic eruption, breakout reconnection
Citation: Lee J (2022) Microwave Perspective on Magnetic Breakout Eruption. Front. Astron. Space Sci. 9:855737. doi: 10.3389/fspas.2022.855737
Received: 15 January 2022; Accepted: 07 March 2022;
Published: 14 April 2022.
Edited by:
Peter Wyper, Durham University, United KingdomReviewed by:
Mykola Gordovskyy, The University of Manchester, United KingdomPeng-Fei Chen, Nanjing University, China
Copyright © 2022 Lee. This is an open-access article distributed under the terms of the Creative Commons Attribution License (CC BY). The use, distribution or reproduction in other forums is permitted, provided the original author(s) and the copyright owner(s) are credited and that the original publication in this journal is cited, in accordance with accepted academic practice. No use, distribution or reproduction is permitted which does not comply with these terms.
*Correspondence: Jeongwoo Lee, bGVlakBuaml0LmVkdQ==