 S. N. F. Chepuri1*
 A. N. Jaynes1
 D. N. Baker2
 B. H. Mauk3
 I. J. Cohen3T. Leonard2
 D. L. Turner3J.B. Blake4J.F. Fennel4T. D. Phan5
- 1Department of Physics and Astronomy, University of Iowa, Iowa City, IA, United States
- 2Laboratory of Atmospheric and Space Physics, University of Colorado Boulder, Boulder, CO, United States
- 3The Johns Hopkins University Applied Physics Laboratory, Laurel, MD, United States
- 4Space Science Applications Laboratory, El Segundo, CA, United States
- 5Space Sciences Laboratory, University of California, Berkeley, Berkeley, CA, United States
We took a survey of boundary layer (or low-latitude boundary layer) crossings by the Magnetospheric Multiscale (MMS) mission. Out of 250 total crossings, about half showed enhancements of high-energy (
Introduction
The boundary layer (or low-latitude boundary layer) is the region of the magnetosphere just inside the magnetopause. It contains a mixture of solar wind plasma from the magnetosheath and magnetosphere plasma. Energetic electrons have been observed in the boundary layer but not often enough to draw broad conclusions about the characteristics of those events. The study presented here found that energetic electrons occurred about half of the time we passed through the boundary layer and colocated whistler-mode waves were observed a little less than half the time. Although we only observed direct evidence of reconnection in the immediate vicinity of whistler waves a few times, we found indications that reconnection was likely occurring, which fits with the common association of whistler waves with reconnection.
There has long been evidence of energetic electrons
Electron acceleration has previously been connected to wave activity associated with magnetic reconnection (Drake et al., 2006; Pritchett, 2008; Fu et al., 2019) or with cusp energization, which has been observed in the magnetosheath, a region where energetic electrons have been studied more thoroughly (Nykyri et al., 2012). Nykyri et al. (2012) found high energy particles in the cusp diamagnetic cavity with pitch angles around 90°. Reconnection converts magnetic energy into kinetic energy, which transports solar energy into the magnetosphere and also allows solar wind particles to mix with magnetospheric particles (Dungey, 1961). This process could be mediated by whistler-mode waves, which has been shown both theoretically (Mandt et al., 1994) and experimentally (Deng and Matsumoto, 2001). This follows the longstanding theoretical and observational evidence that connects whistler wave excitation with magnetic reconnection (Fujimoto and Sydora, 2008; Graham et al., 2016). These whistler-mode waves propagate away from the site of reconnection (the X-line) so we would expect to see them in the region of reconnection, not necessarily just at the source (Tang et al., 2013). Whistler waves have also been more widely observed in the inner magnetosphere and have been connected to the precipitation of energetic electrons (Yahnin et al., 2019). There are detailed models of how whistler waves accelerate electrons in the radiation belt in addition to precipitating electrons (Trakhtengerts et al., 2003; Demekhov et al., 2006). Even though these processes occur in a different region of the magnetosphere there could be similarities to these VLF events with energetic electrons in the boundary layer. Therefore, whistler-mode waves are something to look for when investigating electron enhancements, and since they propagate between around 0.1 and 1 times the electron cyclotron frequency and they exhibit narrow-band power, we can easily identify them in the data (Wilder et al., 2016).
Most of the observations summarized above were case studies of only one or a few events as opposed to a wide-ranging survey of these events as a whole. In this paper, we will take that wider view. By studying a large number of boundary layer crossings, we will determine how common events with energetic electrons and whistler-mode waves are and then search for properties these events have in common.
Instrumentation
Launched in 2015, NASA’s Magnetospheric Multiscale (MMS) mission has unprecedentedly high-resolution, especially its burst mode data (Burch et al., 2016). The mission consists of four spacecraft, although we only used data from one (MMS 1) because the spatial difference between the spacecraft was smaller than the scale at which we would expect to see a meaningful difference in the energetic electron data given their large gyroradii. The mission changed its orbit from a lower-apogee orbit that skimmed through the boundary layer at apogee to a higher-apogee orbit that passes through the boundary layer more quickly at the end of 2016. Our dataset runs from 2016 to 2020, so we include some data from both orbits.
All four MMS spacecraft have a wide range of instruments to measure both field and particle data. We used several instruments from the FIELDS suite onboard (Torbert et al., 2016a): the flux gate magnetometer (FGM) (Russell et al., 2016), the electron drift instrument (EDI) (Torbert et al., 2016b), the search coil magnetometer (SCM) (Le Contel et al., 2016), and the electric field double probe (EDP) (Ergun et al., 2016; Lindqvist et al., 2016). Additionally, we used the Fast Plasma Investigation (FPI) (Pollock et al., 2016) and, from the Energetic Particle Detector suite (Mauk et al., 2016), the Fly’s Eye Electron Proton Spectrometer (FEEPS) (Blake et al., 2016). The FEEPS sensor has six heads, each of which has two eyes. Of the 12 eyes for each FEEPS, nine are for electrons and three for ions. FEEPS covers an energy range of 25–650 keV for electrons and each MMS spacecraft has two FEEPS sensors that combine to give a solid-angle coverage of over 3π sr. These data were used to identify boundary layer regions as well as find the occurrences of energetic electron enhancements and to look for waves during the electron enhancement events.
Data
Example Boundary Layer Crossing Event
In order to get a sample, we used the SITL reports to pick out boundary layer observations. The SITL (scientist in the loop) model is the method by which MMS decides what data to download. A SITL looks at all the low resolution data and flags it if they see something interesting. Then, they write a brief report mentioning why that data was noteworthy and the high resolution data is downloaded. MMS has two data types: low resolution “survey” data and high resolution “burst” data. For example, for the FEEPS instrument, burst mode acquires 64 samples per spin, which would be 0.3125 s per sample for a 20 s spin period, compared to the fast survey mode which only has a sample rate of eight per spin (Blake et al., 2016). This eightfold increase in time resolution in the burst data is crucial to our study because boundary layer crossings and FEEPS enhancements can be for very brief periods of time and would be averaged out in the lower resolution data. Therefore, we were limited to burst data, which we only have access to for the exact times a SITL asks for it. After downloading all the reports, we used a string search to find any time the SITL flagged a boundary layer crossing. We searched through every available SITL report, which covered April 2016-1 May 2020.
For each of these crossings, we graphed several variables from various instruments on MMS to confirm that this event was in fact a boundary layer crossing (Figure 1). Panel a) shows the magnetic field, both the components and total magnitude, in Despun Major Principal Axis of inertia (DMPA) coordinates, which is considered “near-GSE” (Leinweber et al., 2016). Panel b) shows the FEEPS intensity of electrons at different energies. Panels c) and d) are the intensity of background thermal electrons and ions, respectively, at different energies. Panel e) compares the flux of background thermal electrons in two opposite directions, while f) and g) show the electron and ion temperatures, respectively, in both the parallel and perpendicular directions. Finally, panels h) and i) are the magnetic field and electric field power spectra with half of the electron cyclotron frequency plotted for reference. The indicators of a boundary layer crossing were a slowly varying magnetic field as measured by the FGM, a mixture of higher energy plasma (electrons and ions) and lower energy plasma showing the mixture of magnetosheath and magnetosphere plasma using the FPI, and divergence between the flux of lower-energy electrons at 0° and 180° using the EDI. These parameters were examined visually to confirm that the observation did in fact pass through the boundary layer. In cases where we did find evidence of a boundary layer crossing, next we looked for enhancements in the intensity of high energy electrons from FEEPS, where there was an order of magnitude increase in the FEEPS intensity inside the boundary layer excluding the lowest energy channel. Finally, when there were FEEPS enhancements, we took power spectra of the electric and magnetic fields on EDP and SCM data to see if there was any evidence of whistler-mode waves at around half of the electron cyclotron frequency.
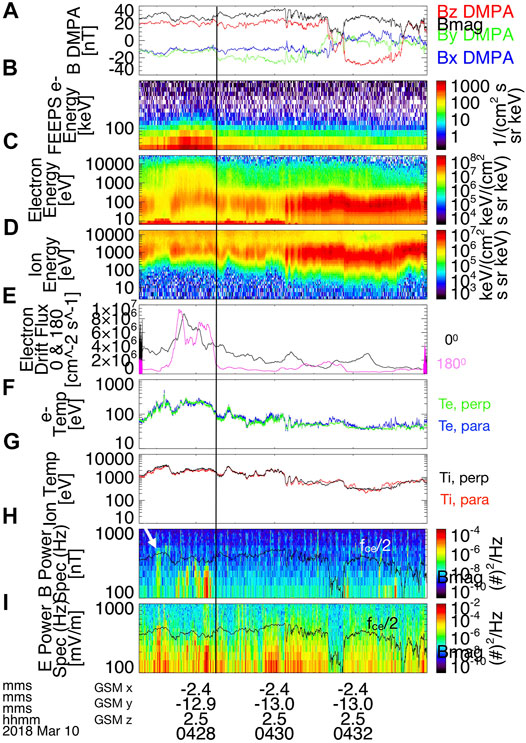
FIGURE 1. An example of a boundary crossing event containing whistler waves at 04:26 on 10 March 2018. (A) Magnetic field in DMPA coordinates, (B) FEEPS electron energies, (C) Lower-energy electron energies, (D) Lower-energy ion energies, (E) Flux of background thermal electrons looking at 0° (black) and 180° (pink), (F) Parallel (blue) and perpendicular (green) electron temperatures, (G) Parallel (red) and perpendicular (black) ion temperatures, (H) Magnetic field power spectral density, (I) Electric field power spectral density. For the last two panels, the half electron cyclotron frequency is plotted. The vertical line shows the end of the boundary layer crossing with FEEPS enhancements while the arrow points to the whistler waves.
Looking at these indicators on Figure 1, the magnetic field in panel a) is relatively slowly-varying from the start of the data until around 04:30, although not as smooth as often seen in other events. Panel b) shows a FEEPS enhancement from about 04:27:00–04:28:30. The low energy electrons are present in panel c) throughout the time covered in this graph, but the high energy thermal electron population is only consistently present until around 04:28:30, so this is when the boundary layer crossing is over, as indicated by the vertical black line. After that, there are a few instances where the higher energy thermal electrons in the FPI data in panel c) are measured momentarily but they immediately disappear each time. These are instances where we briefly enter the boundary layer but not for long enough to collect any data from that entry. In panel e), the black line showing the flux at 0° and the pink line showing the flux at 180° are very different and do not follow the same path during the boundary layer crossing, but converge once we leave the boundary layer. In panels h) and i), there are waves at about half of the electron cyclotron frequency (the line plotted over the spectrum) at about 04:27, as indicated by the arrow. There is also noise throughout at low frequencies, but that is not relevant to our study. In order for an event to be counted as one with FEEPS enhancements and waves, we looked for any wave activity in the relevant range between fce and 0.1 fce. We looked for signatures in both the electric and magnetic fields, unless there was broadband activity obscuring the whistler in the electric field, in which case magnetic field alone sufficed. To be counted, the wave activity only needed to last about 5 s, which is long enough to be longer than random noise and could have any amount of overlap with the energetic electrons or be immediately preceding or succeeding the electrons.
Figure 2 shows a wider view of this event where we can see an entire orbit. Panels a)-c) are the same as in Figure 1, showing magnetic field in GSM coordinates, FEEPS electron energies, and background thermal electron energies, respectively. Panel d) shows the electron density and panels e) and f) show the pitch angle distributions of FEEPS electrons at 40–60 and 70–90 keV, respectively. Finally, panel g) shows the components of the electron velocity in GSE coordinates. The data missing from the middle section is because FPI instruments turn off in the inner magnetosphere, but this does not affect our analysis. The magnetic field peak and high levels in FEEPS intensity show when the spacecraft is in the inner magnetosphere, but once it leaves that region, the FEPPS levels drop to 0, until the spike when the event shown in Figure 1 takes place. The mixed population of background electrons from FPI in panel c) show that this increase in energetic electron precisely corresponds with the time when the spacecraft is in the boundary layer, showing that this effect is localized to the boundary layer.
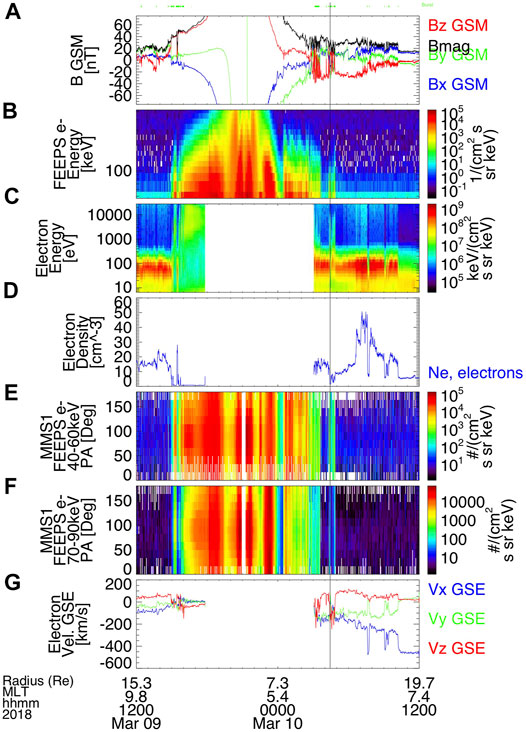
FIGURE 2. A full day plot of the same event as above, going from 12:00 on 9 March 2018 to 12:00 on March 10. (A) Magnetic field in GSM coordinates, (B) FEEPS electron energies, (C) Lower-energy electron energies, (D) electron density, (E) Pitch angle distribution of FEEPS electrons in the 40–60 keV range, (F) Pitch angle distribution of FEEPS electrons in the 70–90 keV range, (G) Electron velocity components in GSE coordinates. The lime green bars on top indicate where burst mode data is available and the gaps in the middle are from the FPI instruments turning off in the inner magnetosphere. The vertical line indicates where Figure 1 begins, which is located at a distance of 13.4 Re.
Statistical Results
Having examined every event, we sorted them into three groups: events with FEEPS enhancements and whistler waves, events with FEEPS enhancements but no waves, and boundary layer crossings without FEEPS enhancements. There were a total of 250 boundary layer crossings, 121 of which (48%) showed FEEPS enhancements, and 47 of which (19% of the total boundary layer crossings and 39% of the FEEPS events) had waves. We then graphed different parameters for all the boundary layer crossings. We looked at the location in GSM coordinates (Figure 3) and saw that most of the boundary layer crossings were on the dayside. Except for a cluster of boundary layer only events at high latitudes on the night side, events with FEEPS enhancements and events without were evenly distributed throughout other locations. The data points are plotted along with a typical magnetopause location for reference, using a model from Lin et al. (2010). The inputs for the model are solar wind dynamic pressure, solar wind magnetic pressure, IMF Bz, and corrected dipole tilt. Lin et al. (2010) give average values for 2,708 magnetopause crossings of Pd = 2.77 nPa, Pm = 0.01939 nPa, and Bz = −0.23 nT, and we used a dipole tilt of 0.
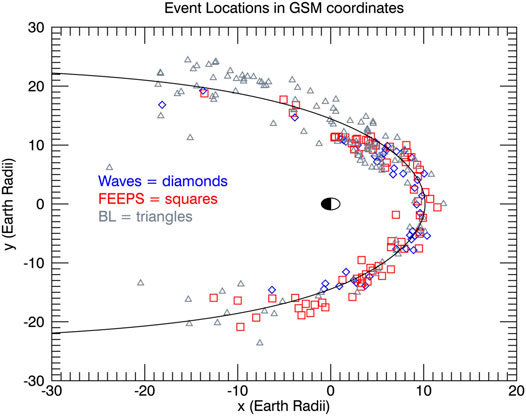
FIGURE 3. A scatter plot of x and y position of boundary layer crossings in GSM coordinates. The blue diamonds represent events with FEEPS enhancements and whistler waves, the red squares are events with FEEPS enhancements but no waves, and the gray triangles are boundary layer crossings with no FEEPS enhancements. The black line shows a typical magnetopause using a model and average data from Lin et al. (2010).
We also made histograms of the boundary layer crossings for magnetic local time, magnetic latitude, and radius (Figure 4). Panels a), d), and g), show the amount of burst data gathered by MMS throughout the time period of this study, binned by magnetic local time, magnetic latitude, and distance, respectively. Panels, b), e), and h) show the same parameters but just for boundary layer crossings, where the gray bar shows the amount of boundary layer crossings with no FEEPS enhancements and the red and blue bar shows crossings with enhancements. Finally, panels c), f), and i) show the ratio of total boundary layer crossings in that bin that have FEEPS enhancements. From panels b) and c), it is clear that FEEPS enhancements are more common for boundary layer crossings closer to noon or slightly on the dawn side, while the crossings farther away on the flanks see energetic electrons less often. Looking at the magnetic latitude in panels e) and f), there doesn’t seem to be much correlation with how often we see enhancements. Additionally, comparing panel e) to panel d), it is clear that the lowest latitude bin in panel e) has many more events because of the orbit of MMS spends more time at those latitudes and not because of any physical reason. Finally, from panels h) and i), events with FEEPS enhancements are more common at distances that are closer to the Earth; for events that are farther out that about 20 Earth radii, FEEPS enhancements are very rare. The error bars in panels c), f), and i) were derived using Poisson statistics, assuming that each bin of N events, either with or without enhancements has
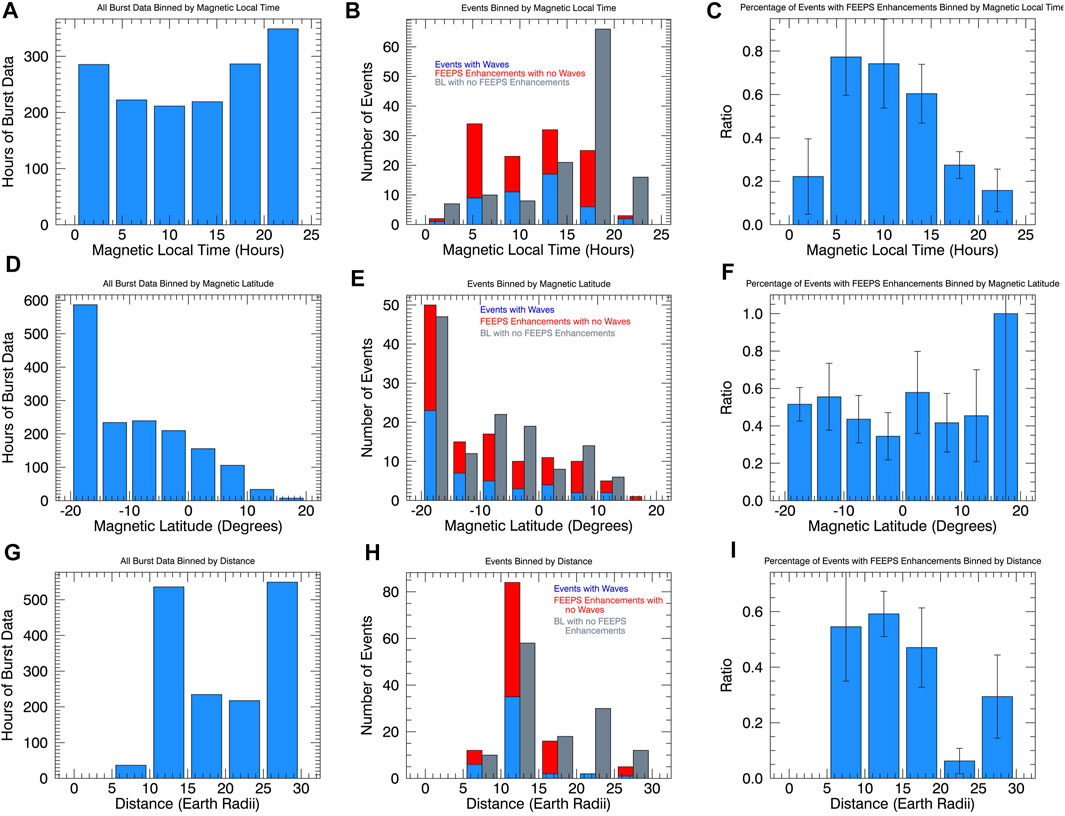
FIGURE 4. Bar plots comparing boundary layer crossings with FEEPS energetic electron enhancements and those without for different parameters. In the middle, the red and blue bar represents events with FEEPS enhancements (without and with whistler waves respectively) and the gray bar is crossings without FEEPS enhancements. (B) is magnetic local time, (E) is magnetic latitude, and (H) is distance. On the right is the same data graphed as percentage of total events that had FEEPS enhancements, with (C) Magnetic local time, (F) Magnetic latitude, (I) Distance. On the left is the same parameters for all burst data gathered by MMS in the relevant time period, with again (A) Magnetic local time, (D) Magnetic latitude, (G) Distance. Error bars derived using Poisson statistics, assuming a
The last aspect of these events we wanted to study was the pitch angle of the FEEPS electrons and evidence of reconnection in the vicinity (as a potential driver of whistler waves), as shown in Figure 5. Panels a) and b) show the FEEPS intensity and background thermal electron intensity for reference to show when the spacecraft is passing through the boundary layer and measuring energetic electrons. Panels c) and d) show pitch angle distributions at two different energy bands for FEEPS electrons, and panel e measures each component of the velocity in Geocentric Solar Ecliptic (GSE) coordinates. If pitch angle was centered around 0°/180°, then these electrons would be traveling into the boundary layer or from a different region in the boundary layer along the field lines, otherwise they would be locally produced. We found a distribution peaked around 90° or isotropic the vast majority of the time, only 10 events showed a field aligned pitch angle. To examine the connection between whistler waves (and thus enhancements) and reconnection, we examined the velocity moment. A reconnection jet would be associated with a sudden reversal in velocity from highly negative to highly positive (or vice-versa) in one dimension that is not mirrored in the other two or, more commonly but still rare, a spike from near zero to a high value. Features that looked like reconnection jets were very rare and we only found this in seven events. However, a reversal like this would only show up right at the point of reconnection. Zooming out around events, we saw a velocity moment maximum above 200 km/s within a few minutes for almost every event, suggesting reconnection nearby. Looking at these events in more detail, there was only clean enough data to make a more definitive determination in a small subset of events, where there was a stable entry into the magnetosheath to determine if a velocity jet during a boundary layer crossing is in fact over
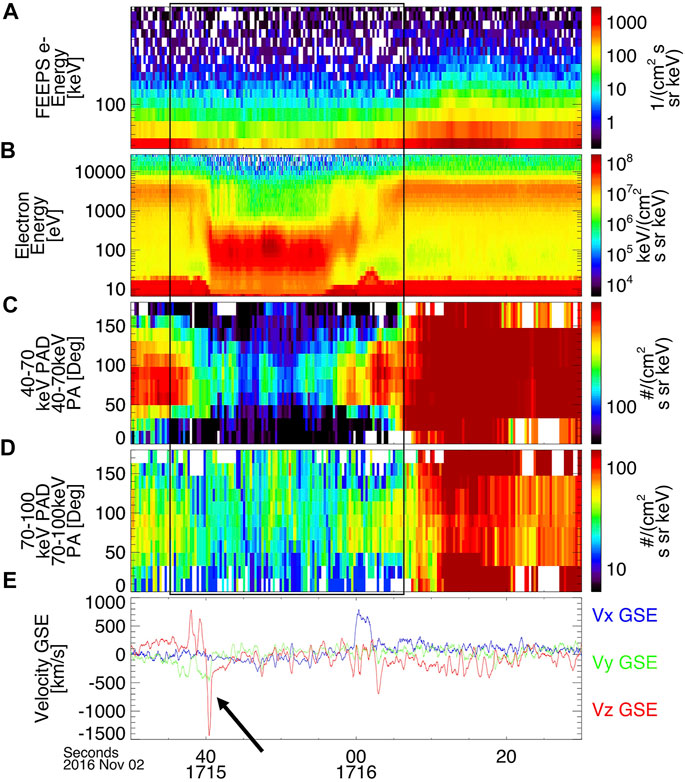
FIGURE 5. An example of a boundary crossing event that showed evidence of reconnection at 17:15 on 2 November 2016. (A) FEEPS electron energies, (B) background thermal electron energies, (C) Pitch angle distribution at 40–70 keV, (D) Pitch angle distribution at 70–100 keV, (E) Electron velocity components in GSE coordinates. The box shows the time of the boundary layer crossing and the arrow points to the velocity reversal suggestive of a reconnection jet.
Discussion
Overall, we found that enhancements of energetic electrons in the boundary layer was a common phenomenon but far from ever-present. Also, although both energetic electrons and whistler waves are thought to be common results of reconnection, we only found waves less than half the time we found energetic electrons. However, if waves are generated by the distribution of magnetospheric electrons as suggested by Graham et al. (2016), then it fits that events with waves would be a subset of events with electron enhancements. These events were more common on the dayside and when the boundary layer is relatively close to the Earth, which could relate to asymmetries in the boundary layer (Dunlop et al., 2008). For the distance away from the Earth, the boundary layer is often closer when there is stronger solar driving pushing the magnetosphere closer to Earth and it is possible that this also drives processes such as reconnection that create energetic electrons to happen more often. To test this hypothesis, we examined the disturbance storm time (Dst) index, a general indication of geomagnetic activity that has a more negative value when solar driving is stronger. We found no meaningful difference between events with FEEPS enhancements and boundary layer crossings without, taking the Dst index to the nearest hour. Boundary layer crossings without FEEPS enhancements had an average Dst index of -13.9 and crossings with enhancements had an average of -12.6. However, with standard deviations of 18.4 and 13.5 respectively, these differences are not significant. Similarly, there was no meaningful difference in the auroral electrojet (AE) index, another indicator of geomagnetic activity. Another possible explanation for this is that distance and magnetic local time (MLT) are not independent. Further down the flanks, the magnetopause and therefore the boundary layer is farther away from the Earth, so this pattern in the distance could be a different manifestation of the MLT pattern. The direction of the interplanetary magnetic field (IMF) could also be a factor in reconnection occurring. The IMF was rapidly flipping back and forth between northward and southward for many events, but we examined whether there was a southward IMF at any point within 15 min of a boundary layer crossing. Of events with no FEEPS enhancements, 87 out of 128 (68%) had a southward IMF, while it was 87 out of 119 (73%) for events with FEEPS enhancements. Splitting up the events with FEEPS enhancements, 52 out of 73 (71%) without waves had a southward IMF and 35 out of 46 (76%) with waves did. Although there is a small increase in events with southward IMF for FEEPS enhancements and waves, considering the ambiguities in determining whether a southward IMF did affect reconnection at a relevant time for our observations, it is difficult to say this relationship is meaningful.
Although we did not find many instances of reconnection jets, that is expected since that is a much more localized effect than the waves or energetic electrons which can travel and cover a wider area. We found many cases where there was likely reconnection nearby, so it still could be a relevant process even if we could not measure it directly. To investigate the driver of these whistler waves, we searched for temperature anisotropy (Artemyev et al., 2016) and beam anisotropy in our data (Wilder et al., 2019). We found some cases of each type of anisotropy in our dataset, though the majority of the events had neither and most of the temperature anisotropies we found were small enough that it is debatable whether that would be sufficient to drive waves, so examining the process that is driving the waves still requires further study. We also saw 90° peaked electrons in almost every event, only rarely finding field-aligned electrons. Whistler waves have been shown to trap electrons and create this kind of peaked distribution using multiple mechanisms, including in cases where the waves were generated elsewhere and traveled into a different region (Kellogg et al., 2010). Additionally, electrons can be trapped by the geometry of reconnection without the direct presence of whistler waves (Egedal et al., 2008). This is crucial for our results because 90° peaked electrons were prevalent in events that did not have waves as well as those that did. For the few events with field-aligned electrons, escape across the magnetopause along field lines could be one possible mechanism that is occurring(Cohen et al., 2017).
Phase trapping is one mechanism by which particles and waves interact and is not a stochastic process, so it can affect the particle’s pitch angle as well as its energy within one interaction. Phase trapping occurs when a particle becomes trapped inside a magnetic island and moves along with the wave for a time, which has a significant effect on the particle’s energy and/or pitch angle in a short amount of time. This has been considered a candidate for accelerating electrons, at least in other regions of the magnetosphere (Albert, 2002). Using data from this study, simulations can be run for individual events to examine phase trapping as an acceleration mechanism in the boundary layer. Although electron cyclotron resonance is a common mechanism that energizes electrons elsewhere in the magnetosphere, whistler waves in the boundary layer would not be a good candidate for that type of process since they are generally only present for a timescale on the order of seconds to a few minutes, so there would not be enough time for them to be energized to this level by cyclotron resonance. Additionally, these whistler waves have been shown to be highly nonlinear (Wilder et al., 2016) which leaves open the possibility for other methods of acceleration such as phase trapping. Overall, energetic electron enhancements are a fairly common occurrence and are likely correlated with reconnection.
Data Availability Statement
Publicly available datasets were analyzed in this study. This data can be found here: https://lasp.colorado.edu/mms/sdc/public/about/browse-wrapper/ http://cdaweb.gsfc.nasa.gov/istp_public/.
Author Contributions
AJ was Ph. D. advisor for the first author and contributed to work. DT advised on data products and analysis. DB and TL contributed expertise on the FEEPS instrument. BM, IC, JB, and JF gave advice on data usage. TP helped with interpretation for reconnection related events.
Funding
This work was supported by funding from the MMS mission, under NASA contract NNG04EB99C.
Conflict of Interest
The authors declare that the research was conducted in the absence of any commercial or financial relationships that could be construed as a potential conflict of interest.
Publisher’s Note
All claims expressed in this article are solely those of the authors and do not necessarily represent those of their affiliated organizations, or those of the publisher, the editors and the reviewers. Any product that may be evaluated in this article, or claim that may be made by its manufacturer, is not guaranteed or endorsed by the publisher.
References
Albert, J. M. (2002). Nonlinear Interaction of Outer Zone Electrons with Vlf Waves. Geophys. Res. Lett. 29, 1–2. doi:10.1029/2001gl013941
Artemyev, A., Agapitov, O., Mourenas, D., Krasnoselskikh, V., Shastun, V., and Mozer, F. (2016). Oblique Whistler-Mode Waves in the Earth's Inner Magnetosphere: Energy Distribution, Origins, and Role in Radiation Belt Dynamics. Space Sci. Rev. 200, 261–355. doi:10.1007/s11214-016-0252-5
Blake, J. B., Mauk, B. H., Baker, D. N., Carranza, P., Clemmons, J. H., Craft, J., et al. (2016). The Fly's Eye Energetic Particle Spectrometer (FEEPS) Sensors for the Magnetospheric Multiscale (MMS) Mission. Space Sci. Rev. 199, 309–329. doi:10.1007/s11214-015-0163-x
Burch, J. L., Moore, T. E., Torbert, R. B., and Giles, B. L. (2016). Magnetospheric Multiscale Overview and Science Objectives. Space Sci. Rev. 199, 5–21. doi:10.1007/s11214-015-0164-9
Cohen, I. J., Mauk, B. H., Anderson, B. J., Westlake, J. H., Sibeck, D. G., Turner, D. L., et al. (2017). Statistical Analysis of Mms Observations of Energetic Electron Escape Observed At/beyond the Dayside Magnetopause. J. Geophys. Res. Space Phys. 122, 9440–9463. doi:10.1002/2017ja024401
Demekhov, A. G., Trakhtengerts, V. Y., Rycroft, M. J., and Nunn, D. (2006). Electron Acceleration in the Magnetosphere by Whistler-Mode Waves of Varying Frequency. Geomagn. Aeron. 46, 711–716. doi:10.1134/s0016793206060053
Deng, X. H., and Matsumoto, H. (2001). Rapid Magnetic Reconnection in the Earth's Magnetosphere Mediated by Whistler Waves. Nature 410, 557–560. doi:10.1038/35069018
Drake, J. F., Swisdak, M., Che, H., and Shay, M. A. (2006). Electron Acceleration from Contracting Magnetic Islands during Reconnection. Nature 443, 553–556. doi:10.1038/nature05116
Dungey, J. W. (1961). Interplanetary Magnetic Field and the Auroral Zones. Phys. Rev. Lett. 6, 47–48. doi:10.1103/physrevlett.6.47
Dunlop, M., Taylor, M., Bogdanova, Y., Shen, C., Pitout, F., Pu, Z., et al. (2008). Electron Structure of the Magnetopause Boundary Layer: Cluster/double Star Observations. J. Geophys. Res. Space Phys. 113. doi:10.1029/2007ja012788
Egedal, J., Fox, W., Katz, N., Porkolab, M., Øieroset, M., Lin, R., et al. (2008). Evidence and Theory for Trapped Electrons in Guide Field Magnetotail Reconnection. J. Geophys. Res. Space Phys. 113. doi:10.1029/2008ja013520
Ergun, R. E., Tucker, S., Westfall, J., Goodrich, K. A., Malaspina, D. M., Summers, D., et al. (2016). The Axial Double Probe and Fields Signal Processing for the Mms Mission. Space Sci. Rev. 199, 167–188. doi:10.1007/s11214-014-0115-x
Fu, H. S., Peng, F. Z., Liu, C. M., Burch, J. L., Gershman, D. G., and Le Contel, O. (2019). Evidence of Electron Acceleration at a Reconnecting Magnetopause. Geophys. Res. Lett. 46, 5645–5652. doi:10.1029/2019gl083032
Fujimoto, K., and Sydora, R. D. (2008). Whistler Waves Associated with Magnetic Reconnection. Geophys. Res. Lett. 35. doi:10.1029/2008gl035201
Graham, D. B., Vaivads, A., Khotyaintsev, Y. V., and André, M. (2016). Whistler Emission in the Separatrix Regions of Asymmetric Magnetic Reconnection. J. Geophys. Res. Space Phys. 121, 1934–1954. doi:10.1002/2015ja021239
Jaynes, A. N., Turner, D. L., Wilder, F. D., Osmane, A., Baker, D. N., Blake, J. B., et al. (2016). Energetic Electron Acceleration Observed by Mms in the Vicinity of an X-Line Crossing. Geophys. Res. Lett. 43, 7356–7363. doi:10.1002/2016gl069206
Kellogg, P. J., Cattell, C. A., Goetz, K., Monson, S., and Wilson, L. (2010). Electron Trapping and Charge Transport by Large Amplitude Whistlers. Geophys. Res. Lett. 37.
Le Contel, O., Leroy, P., Roux, A., Coillot, C., Alison, D., Bouabdellah, A., et al. (2016). The Search-Coil Magnetometer for Mms. Space Sci. Rev. 199, 257–282.
Leinweber, H. K., Bromund, K. R., Strangeway, R. J., and Magnes, W. (2016). The MMS Fluxgate Magnetometers Science Data Products Guide. Springer.
Lin, R., Zhang, X., Liu, S., Wang, Y., and Gong, J. (2010). A Three-Dimensional Asymmetric Magnetopause Model. J. Geophys. Res. Space Phys. 115. doi:10.1029/2009ja014235
Lindqvist, P.-A., Olsson, G., Torbert, R. B., King, B., Granoff, M., Rau, D., et al. (2016). The Spin-Plane Double Probe Electric Field Instrument for Mms. Space Sci. Rev. 199, 137–165. doi:10.1007/s11214-014-0116-9
Mandt, M. E., Denton, R. E., and Drake, J. F. (1994). Transition to Whistler Mediated Magnetic Reconnection. Geophys. Res. Lett. 21, 73–76. doi:10.1029/93gl03382
Mauk, B., Blake, J., Baker, D., Clemmons, J., Reeves, G., Spence, H. E., et al. (2016). The Energetic Particle Detector (Epd) Investigation and the Energetic Ion Spectrometer (Eis) for the Magnetospheric Multiscale (Mms) Mission. Space Sci. Rev. 199, 471–514.
Nykyri, K., Otto, A., Adamson, E., Kronberg, E., and Daly, P. (2012). On the Origin of High-Energy Particles in the Cusp Diamagnetic Cavity. J. Atmos. solar-terrestrial Phys. 87-88, 70–81. doi:10.1016/j.jastp.2011.08.012
Pollock, C., Moore, T., Jacques, A., Burch, J., Gliese, U., Saito, Y., et al. (2016). Fast Plasma Investigation for Magnetospheric Multiscale. Space Sci. Rev. 199, 331–406.
Pritchett, P. L. (2008). Energetic Electron Acceleration during Multi-Island Coalescence. Phys. Plasmas 15, 102105. doi:10.1063/1.2996321
Russell, C. T., Anderson, B. J., Baumjohann, W., Bromund, K. R., Dearborn, D., Fischer, D., et al. (2016). The Magnetospheric Multiscale Magnetometers. Space Sci. Rev. 199, 189–256. doi:10.1007/978-94-024-0861-4_8
Sarafopoulos, D. V., Athanasiu, M. A., Sibeck, D. G., McEntire, R. W., Sarris, E. T., and Kokubun, S. (2000). Energetic Proton and Electron Dispersion Signatures in the Nightside Magnetosheath Supporting Their Leakage Out of the Magnetopause. J. Geophys. Res. 105, 15729–15739. doi:10.1029/2000ja900041
Tang, X., Cattell, C., Dombeck, J., Dai, L., Wilson, L. B., Breneman, A., et al. (2013). Themis Observations of the Magnetopause Electron Diffusion Region: Large Amplitude Waves and Heated Electrons. Geophys. Res. Lett. 40, 2884–2890.
Torbert, R. B., Russell, C. T., Magnes, W., Ergun, R. E., Lindqvist, P.-A., LeContel, O., et al. (2016a). The Fields Instrument Suite on Mms: Scientific Objectives, Measurements, and Data Products. Space Sci. Rev. 199, 105–135. doi:10.1007/s11214-014-0109-8
Torbert, R. B., Vaith, H., Granoff, M., Widholm, M., Gaidos, J. A., Briggs, B. H., et al. (2016b). The Electron Drift Instrument for Mms. Space Sci. Rev. 199, 283–305. doi:10.1007/s11214-015-0182-7
Trakhtengerts, V. Y., Rycroft, M., Nunn, D., and Demekhov, A. (2003). Cyclotron Acceleration of Radiation Belt Electrons by Whistlers. J. Geophys. Res. Space Phys. 108, 1. doi:10.1029/2002ja009559
Walsh, B. M., Haaland, S. E., Daly, P. W., Kronberg, E. A., and Fritz, T. A. (2012). Energetic Electrons along the High-Latitude Magnetopause. Ann. Geophys. 30, 1003–1013. doi:10.5194/angeo-30-1003-2012
Wilder, F. D., Ergun, R. E., Hoilijoki, S., Webster, J., Argall, M. R., Ahmadi, N., et al. (2019). A Survey of Plasma Waves Appearing Near Dayside Magnetopause Electron Diffusion Region Events. J. Geophys. Res. Space Phys. 124, 7837–7849. doi:10.1029/2019ja027060
Wilder, F., Ergun, R., Goodrich, K., Goldman, M., Newman, D., Malaspina, D., et al. (2016). Observations of Whistler Mode Waves with Nonlinear Parallel Electric Fields Near the Dayside Magnetic Reconnection Separatrix by the Magnetospheric Multiscale Mission. Geophys. Res. Lett. 43, 5909–5917.
Yahnin, A. G., Titova, E. E., Demekhov, A. G., Yahnina, T. A., Popova, T. A., Lyubchich, A., et al. (2019). Simultaneous Observations of Emic Waves, Elf/vlf Waves, and Energetic Particle Precipitation during Multiple Compressions of the Magnetosphere. Geomagn. Aeron. 59, 668–680. doi:10.1134/s0016793219060148
Keywords: boundary layer, energetic electrons, whistler waves, magnetosphere, MMS
Citation: Chepuri SNF, Jaynes AN, Baker DN, Mauk BH, Cohen IJ, Leonard T, Turner DL, Blake JB, Fennel JF and Phan TD (2022) A Statistical Study of Magnetopause Boundary Layer Energetic Electron Enhancements Using MMS. Front. Astron. Space Sci. 9:926660. doi: 10.3389/fspas.2022.926660
Received: 22 April 2022; Accepted: 02 June 2022;
Published: 23 June 2022.
Edited by:
Lauri Holappa, University of Oulu, FinlandReviewed by:
Ruilong Guo, Shandong University, ChinaTieyan Wang, Rutherford Appleton Laboratory, United Kingdom
Copyright © 2022 Chepuri, Jaynes, Baker, Mauk, Cohen, Leonard, Turner, Blake, Fennel and Phan. This is an open-access article distributed under the terms of the Creative Commons Attribution License (CC BY). The use, distribution or reproduction in other forums is permitted, provided the original author(s) and the copyright owner(s) are credited and that the original publication in this journal is cited, in accordance with accepted academic practice. No use, distribution or reproduction is permitted which does not comply with these terms.
*Correspondence: S. N. F. Chepuri, c2FuamF5LWNoZXB1cmlAdWlvd2EuZWR1