 Qian Jiao
 Yu Gao3,2
 Qinghua Tan
 Yang Gao
- 1School of Electrical and Electronic Engineering, Wuhan Polytechnic University, Wuhan, China
- 2Purple Mountain Observatory, Chinese Academy of Sciences (CAS), Nanjing, China
- 3Department of Astronomy, Xiamen University, Xiamen, Fujian, China
- 4College of Physics and Electronic Information, Dezhou University, Dezhou, China
We present a statistical study on dense molecular gas tracers of HCN (4–3), HCO+ (4–3) lines and molecular tracers of [C i], and CO observations for a sample of 26 infrared bright star-forming (SF) galaxies. We investigate the dependence of dense gas star formation efficiency traced by HCN (4–3), HCO+ (4–3) (that is
1 Introduction
In the past two decades, observational and theoretical studies have shown that molecular gas (Kennicutt, 1998; Bigiel et al., 2008; Daddi et al., 2010; Kennicutt and Evans, 2012), especially the dense molecular gas (Solomon et al., 1992; Gao and Solomon, 2004b; Gao and Solomon, 2004a; Wu et al., 2005; Gao et al., 2007; Baan et al., 2008; Chen et al., 2015; Bigiel et al., 2016; Zhang et al., 2014; Tan et al., 2018; Jiménez-Donaire et al., 2019; Jiang et al., 2020; Li et al., 2021) with a volume density of n > 104 cm−3 which can be traced by molecular emission lines with high critical densities as HCN and HCO+, plays a significant role in star formation.
Using a large survey of HCN (1–0) emission from nearby normal spiral galaxies to ultraluminous infrared galaxies (ULIRGs), Gao and Solomon (2004b) found a tight linear correlation between the infrared (IR) and HCN luminosities. Observations on smaller scales, such as resolved galaxy structures (Chen et al., 2015; Chen et al., 2017; Usero et al., 2015; Bigiel et al., 2016; Shimajiri et al., 2017; Jiménez-Donaire et al., 2019), Galactic giant molecular clouds (GMCs) in the Milky Way (Wu et al., 2005; Wu et al., 2010; Lada et al., 2010; Lada et al., 2012; Evans et al., 2014), have shown that this linearity continues to large GMC associations and even individual dense cores in the Milky Way, spanning over eight orders of magnitude. Moreover, the
In addition to HCN (1–0), linear correlations of
Using HCN (4–3), HCO+ (4–3), and CS (7–6) observations in 20 nearby star-forming (SF) galaxies, Zhang et al. (2014) found tight and linear correlations between the luminosity of IR and that of molecular lines for all three dense gas tracers which probe molecular gas with density higher than 106 cm−3. And this linear
Recent observations, especially those involving large-scale mapping with high resolution, show that there is a linear relationship between
Comparing to the dense molecular gas tracers, CO and [C i] (3P1 →3P0) [rest frequency: 492.161 GHz, hereafter [C i] (1–0)] and [C i] (3P2 →3P1) [rest frequency: 809.344 GHz, hereafter [C i] (2–1)] lines are widely used as total molecular gas tracers in galaxies near and far (e.g., Weiß et al., 2003; Weiß et al., 2005; Papadopoulos et al., 2004; Papadopoulos and Greve, 2004; Bolatto et al., 2013; Dunne et al., 2022; Papadopoulos et al., 2022). Observations show that both [C i] emissions correlate well with CO emission in giant molecular cloud (Ikeda et al., 1999; Ikeda et al., 2002; Shimajiri et al., 2013), and even perform well in tracing molecular gas in local IR luminous objects (Israel et al., 2015; Krips et al., 2016; Jiao et al., 2017; Jiao et al., 2019), as well as star-forming galaxies at z > 1 (Popping et al., 2017; Valentino et al., 2018; Valentino et al., 2020; Boogaard et al., 2020), high-redshift sub-millimeter galaxies (SMGs, Alaghband-Zadeh et al. 2013; Yang et al. 2017) and protocluster galaxies (Lee et al., 2021). Theoretical models including turbulent (Offner et al., 2014; Glover et al., 2015), metallicity (Glover and Clark, 2016), and cosmic ray (Bisbas et al., 2015; Bisbas et al., 2017; Papadopoulos et al., 2018; Gaches et al., 2019) also predict widespread [C i] emission maps which are similar to CO maps.
Jiao et al. (2017) found that both [C i] luminosities of
At present, the relationship between SFEdense and local physical conditions, such as the stellar surface density and gas pressure is still under debate. [C i]-CO and R[CI] ratios are sensitive to the excitation temperature, star-formation and AGN activities. In this work, we have selected a sample that includes J = 4–3 emissions of HCN and/or HCO+, as well as [C i] and CO (1–0) observations. Our aim is to investigate the possible correlation between the SFEdense with dense gas traced by HCN (4–3) and/or HCO+ (4–3) and the [C i]-CO ratios. We also aim to investigate the reliability of using
2 Sample and data reduction method
Systematic survey of HCN (4–3), HCO+ (4–3), and both [C i] emissions are rare. The sample discussed here consists of sources with available observations of HCN (4–3) and/or HCO+ (4–3), and [C i] (1–0) and/or [C i] (2–1), which are currently as comprehensive as possible based on literature. We finally obtained three subsamples named: Tan18, Zhang14, and Imanishi18, respectively. The subsample of Tan18 consists of five spatially resolved nearby star-forming galaxies that were selected by cross-matching the MALATANG sample in Tan et al. (2018) and [C i] mapping from Jiao et al. (2019). Zhang et al. (2014) reported HCN (4–3) and HCO+ (4–3) observations in 20 nearby star-forming galaxies with the Atacama Pathfinder EXperiment (APEX) 12 m telescope. By cross matching the galaxies in Zhang et al. (2014) with [C i] data observed with Herschel in Lu et al. (2017) and Fernández-Ontiveros et al. (2016), we finally obtain fifteen galaxies defined as subsample of Zhang14. We check the galaxies in Imanishi et al. (2018), and find five of them have [C i] observations in literature (e.g., Fernández-Ontiveros et al., 2016; Kamenetzky et al., 2016; Jiao et al., 2017). We further add galaxy NGC 7469 which has ALMA observations of HCN (4–3), HCO+ (4–3), and [C i] from Izumi et al. (2015), Izumi et al. (2020), and define these six galaxies as subsample of Imanishi18. The Tan18 and Zhang14 samples consist of IR bright galaxies with Sν(100 μm) > 100 Jy, which was selected from Infrared Astronomical Satellite (IRAS) Revised Bright Galaxy Sample (Sanders et al., 2003). Meanwhile, the Imanishi18 galaxies are classified as ULIRGs with LIR > 1012 L⊙, except for IRAS 04315-0840 which is categorized as a LIRG with LIR ∼ 5 × 10¹¹ L⊙. In brief, the three subsamples encompasses galaxies with LIR ranging from 1010 L⊙ to 1012.5 L⊙, including nearby normal star-forming galaxies, starbursts, and AGN galaxies. The basic information of each galaxy in our sample is shown in Table 1.
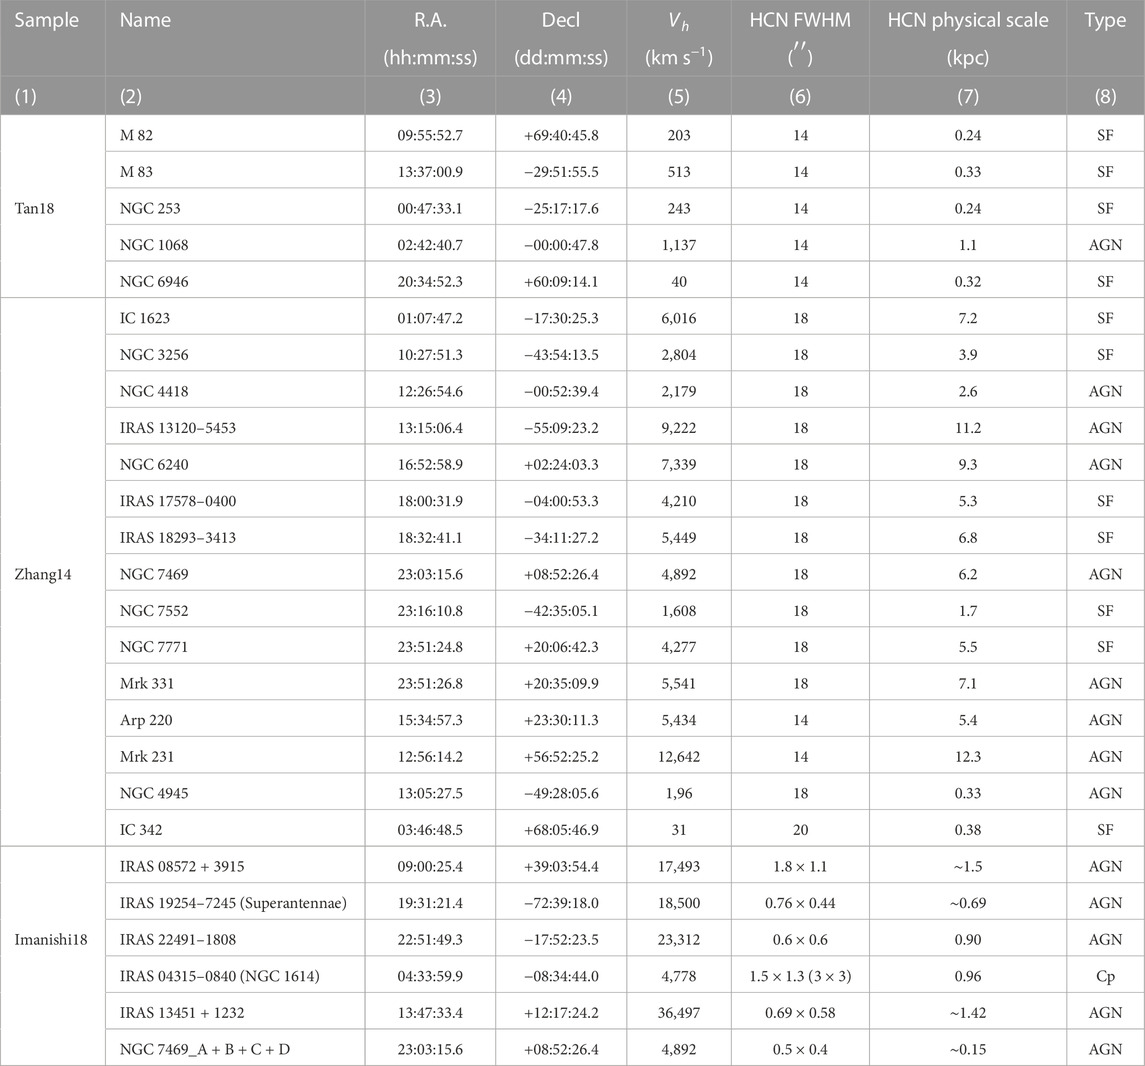
TABLE 1. The basic properties of the galaxies for the three subsamples.
2.1 Data reduction for Tan18 subsample
The HCN (4–3) and HCO+ (4–3) data in subsample Tan18 are from Tan et al. (2018) which were observed by JCMT with FWHM
The luminosities of
In MALATANG-I observations, M 83 was detected in HCN (4–3) and HCO+ (4–3) emissions at only the central position (Tan et al., 2018). However, more detections are found for M 83 by combining the MALATANG-I and MALATANG-II data. In this work, we use the combined data for M 83. The HCN (4–3) and HCO+ (4–3) detections of M 83 are also shown in Supplementary Figure S1.
2.2 Data reduction for Zhang14 subsample
The HCN (4–3) and HCO+ (4–3) emissions in the subsample of Zhang14 from Zhang et al. (2014) are mostly observed by the APEX in the central region with FWHM
The majority of [C i] lines used in this study are taken from Lu et al. (2017), and the corresponding galaxy is point-like with respect to the Herschel beam at [C i] (2–1) rest frequency, except for NGC 4945 and IC 342 which are obtained from Fernández-Ontiveros et al. (2016). The CO (1–0) are adopted from Jiao et al. (2017) with beam size greater than that of [C i] (2–1). Specifically, the [C i] (1–0) of Galaxy NGC 4418 was flagged as quality Q = 4 (3 ≤ SNR
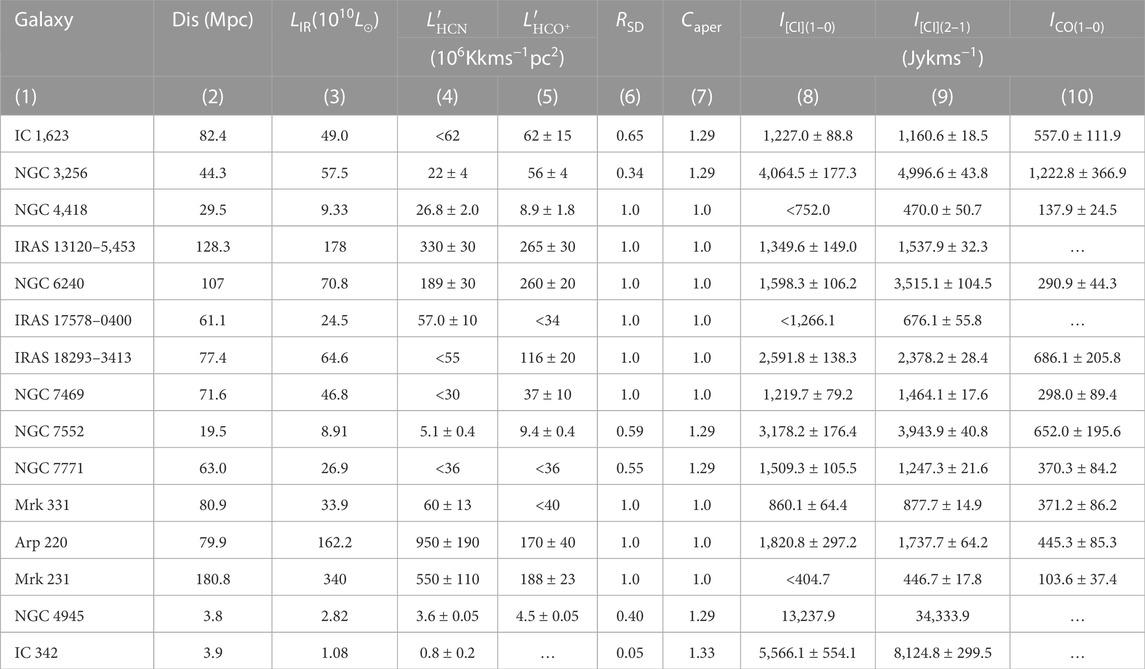
TABLE 2. The galaxy in Zhang14.
2.3 Data reduction for Imanishi18 subsample
The HCN (4–3) and HCO+ (4–3) emissions of subsample Imanishi18 are taken from Table 15 in Imanishi et al. (2018) that were observed with ALMA, and the corresponding LIR values are also adopted from Imanishi et al. (2018). In this sample of galaxies, the ALMA measurements mostly cover the emissions of HCN (4–3) and HCO+ (4–3). This is because ULIRGs are typically dominated by nuclear compact energy sources with ≲500 pc (Soifer et al., 2000), and the dense gas tracers mostly come from compact nuclear regions. The luminosities of HCN (4–3) and HCO+ (4–3) were measured using Gaussian fits of the spectra within the beam size. However, for the spatially extended galaxy IRAS 04315–1808, the luminosity was estimated from Gaussian fits (3″× 3″) of the spatially integrated spectra. The CO (1–0) and [C i] intensities are collected from literature as shown in Table 3.
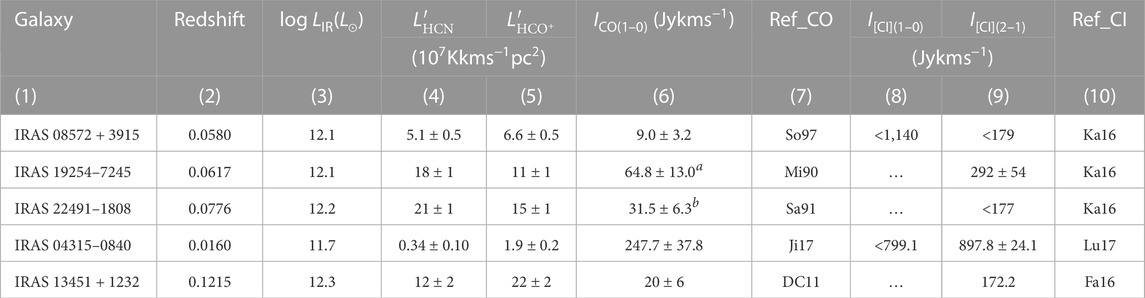
TABLE 3. ALMA sample in Imanishi.
Particularly, with unprecedented high resolution ALMA observation, NGC 7469 is regarded as an AGN position of A, and three bright knots in the starburst ring as B, C, and D (see the details in Izumi et al., 2015). In Table 4, we present the
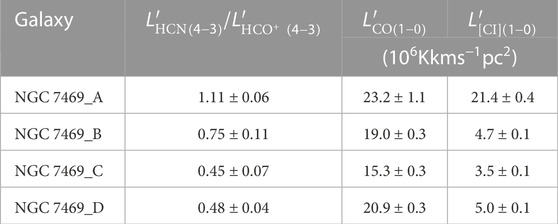
TABLE 4. NGC 7469.
The three subsample datasets are obtained from diverse telescope observations with distinct beam sizes, particularly for HCN (4–3) and HCO+ (4–3) observations. In Table 1, we list the FWHM of HCN (4–3) for each galaxy (the FWHMs of HCN (4–3) and HCO+ (4–3) are similar). The [C i] observations for all galaxies were obtained with Herschel, except for NGC 7469 which was observed with ALMA. Notablely, the line ratios of IR-HCN/HCO+ and
Columns 2 to 7 are adopted from Zhang et al. (2014). RSD is the ratio of flux densities within the beam size of HCN (4–3) to that measured in the whole galaxy, and Caper is the aperture correction factor for the beam size (see the details in Zhang et al., 2014). [C i] fluxes in columns 8 and 9 are adopted from Lu et al. (2017), except for NGC 4945 and IC 342 which obtained from Fernández-Ontiveros et al. (2016). Column 10 is the CO (1–0) fluxes adopted from Jiao et al. (2017). Columns 2 and 3 are the redshift and infrared luminosities adopted from Imanishi et al. (2018), column 4 and 5 are the HCN (4–3) and HCO+ (4–3) luminosities which are adopted from Table 15 in Imanishi et al. (2018). Columns 6 and 7 are CO (1–0) intensities and references: So97—Solomon et al. (1997), Mi90—Mirabel et al. (1990), Sa91—Sanders et al. (1991), Ji17—Jiao et al. (2017), DC11—Dasyra and Combes (2011). Columns 8, 9, and 10 are [C i] intensities and references: Ka16—Kamenetzky et al. (2016), Lu17—Lu et al. (2017), Fa16—Fernández-Ontiveros et al. (2016). a The CO (1–0) data is observed with SEST, and is converted from K km s−1 to Jy km s−1 with conversion factor Sv/T (Jy/K) = 27.b The CO (1–0) data is observed with 12m NRAO, and is converted from K km s−1 to Jy km s−1 with conversion factor Sv/T (Jy/K) = 35.The A, B, C, and D of NGC 7469 stand for the AGN position and three bright knots in the starburst ring (see details in Izumi et al., 2015). The
2.4 WISE data
We also use the Wide-field Infrared Survey Explorer (WISE) 3.4 μm (W1) and 4.6 μm (W2) emissions and uncertainties for each galaxy from the NASA/IPAC Infrared Science Archive. For the samples of Tan18 and Zhang14, we firstly estimate the background for each galaxy using SExtractor (Source-Extractor; Bertin and Arnouts, 1996) program with the corresponding uncertainty maps as inputs, and then subtract its estimated background. The background-subtracted image of each galaxy is smoothed to its corresponding HCN (4–3) resolution (JCMT or APEX) with convolution kernels generated by comparing the WISE profiles with JCMT/APEX Gaussian profile of FWHM 14″/18″(Aniano et al., 2011). For galaxies in sample of Imanish18 with high resolutions (observed with ALMA with FWHM mostly smaller than 1″at HCN (4–3) and HCO+ (4–3)), we directly use its profile-fit photometry magnitude from “WISE All-Sky Source Catalog” at IPAC.
The WISE images are originally in units of digital numbers (DN), and we convert them to luminosity units of L⊙ with method shown in Supplementary Material. Similar to Tan et al. (2018), in order to convert the units from L⊙ into L⊙ beam−1, we scale the image by a factor of 1.133 × (FWHM/pixel size)2, where FWHM = 14″for JCMT and 18″for APEX, pixel size is the length of a pixel in arcseconds. As shown in Supplementary Material, the WISE uncertainties include the zero-point magnitude uncertainty, and the instrumental uncertainty measured with WISE uncertainty maps.
3 Results and discussion
3.1 Correlations between SFEdense with [C i]-CO luminosity ratios
The MALATANG HCN (4–3) and HCO+ (4–3) mappings do not satisfy Nyquist sampling theorem with grid spacing of 10″for the JCMT FWHM of
Figure 1 shows the correlations between
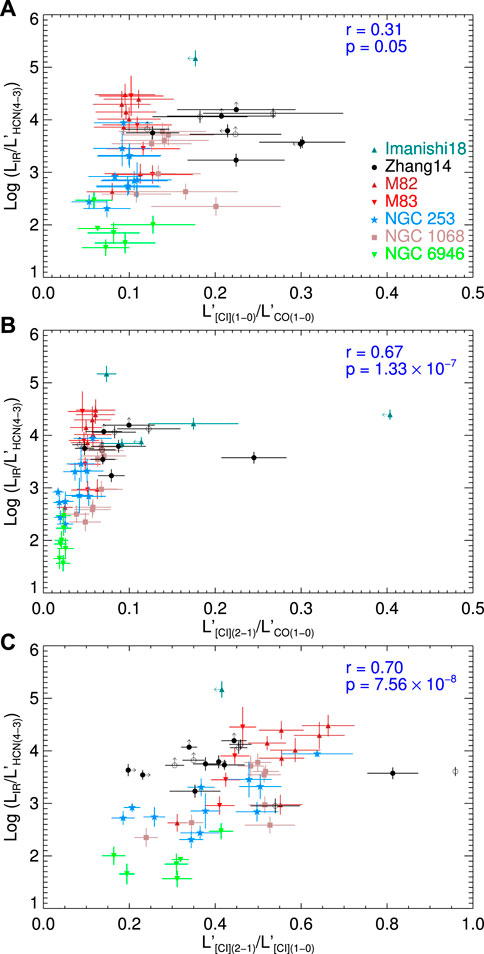
FIGURE 1. Comparison of the luminosity ratios of
We further use Monte Carlo method to estimate the Spearman’s rank correlation with those limits. For the upper limits (as Uupper), we generate 10,000 uniformly distributed random numbers ranging from 0 to Uupper. And for the lower limits (as Ulower), the 10,000 random numbers are uniformly distributed over Ulower to 103 Ulower. We then calculate the correlation coefficient 10,000 times using the detection points and the generated random numbers for the limits, and define the average r and p as the final results. As shown in Table 5, the results obtained with and without limits are similar. Moreover,
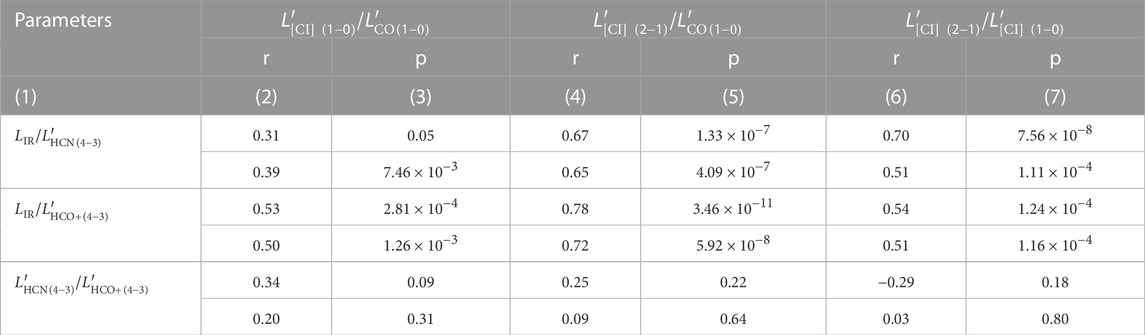
TABLE 5. The Spearman’s rank correlation coefficients and significance.
We further plot the
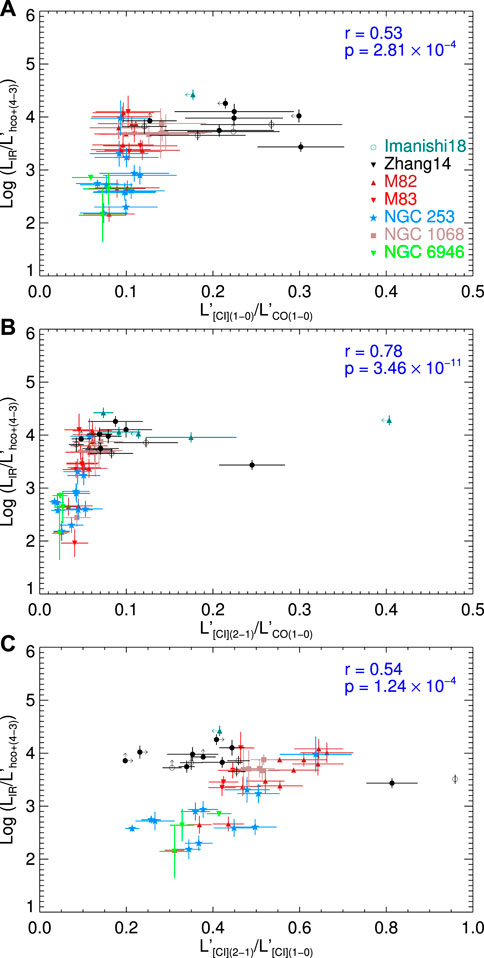
FIGURE 2. Comparison of the luminosity ratios of
3.2 The
In Figure 3, we present the correlation between
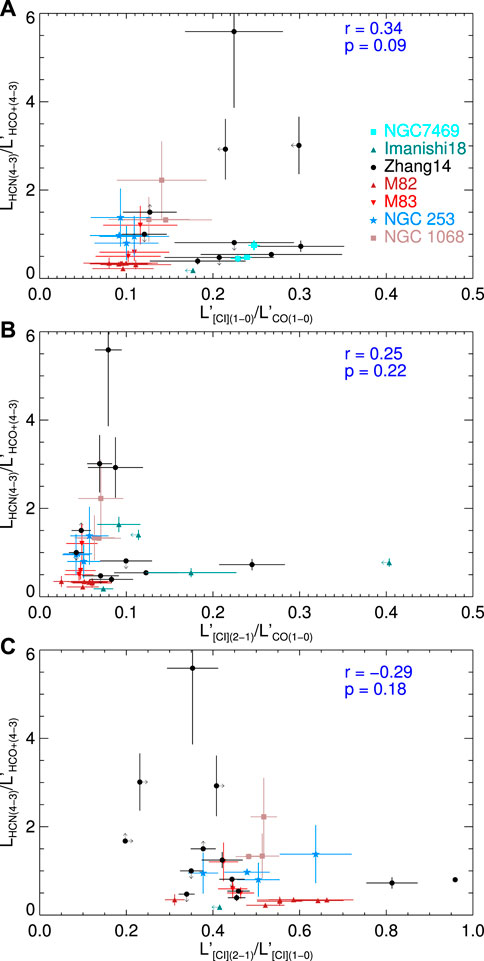
FIGURE 3. Comparison of the line luminosity ratios of
The
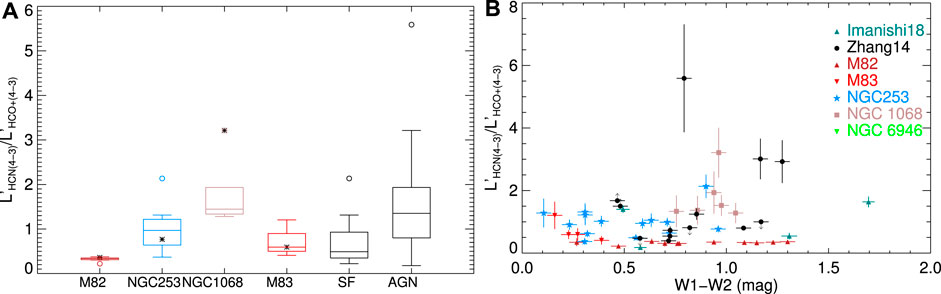
FIGURE 4. (A) boxes show the medians (colored lines in the boxes), the interquartile ranges (colored boxes), and the full range up to 1.5× the interquartile range (IQR; colored horizontal lines) of
Using the WISE surveys in COSMOS field, Stern et al. (2012) present a simple mid-infrared color criterion of W1 − W2 ≥ 0.8 for W2
3.3 Discussion
3.3.1 The relationship between SFEdense and [C i]-CO ratios
The line ratio R[CI] can be used to determine directly the excitation temperature by adopting the equation Tex = 38.8 K/ln[2.11/R[CI]] in optically thin limit (Stutzki et al., 1997). The excitation temperatures are typically in the range of 20–30 K for our sample, which is close to the excitation energy of [C i] (1–0) (24 K) but significantly lower than that of [C i] (2–1) (63 K). Tan et al. (2018) present the ratios of
According to Jiao et al. (2019), the
However, we note that the scatters of
The higher correlations observed in resolved samples indicate that
3.3.2 The variation of
Izumi et al. (2013), Izumi et al. (2015) observed the central kiloparsec region of AGN galaxies of NGC 1097 and NGC 7469 with ALMA at ∼ 100 and 150 pc resolutions. Both studies found higher
The
The ratio of
Using the IRAM 30 m observations of a sample of 58 local luminous and ultraluminous infrared galaxies from the Great Observatories All-sky LIRG Survey, Privon et al. (2015) found that the ratio of
4 Summary
In this paper, we select a sample of 26 galaxies which both have dense gas observations of HCN (4–3) and HCO+ (4–3) from Tan et al. (2018); Zhang et al. (2014); Imanishi et al. (2018), and molecular tracers of [C i] and CO observations from Lu et al. (2017); Fernández-Ontiveros et al. (2016); Jiao et al. (2017). We explore the correlations between
We plot
Data availability statement
The raw data supporting the conclusions of this article will be made available by the authors, without undue reservation.
Author contributions
QJ and YuG designed the study, and QJ was the main author of the article. QT and YaG made significant contributions and edits to the text. All authors contributed to the article and approved the submitted version.
Funding
This work is supported by National Natural Science Foundation of China (NSFC, Nos. 12003070 and 12033004). Research Funding of Wuhan Polytechnic University NO. 2022RZ035. Scientific Research Fund of Dezhou University, 3012304024.
Acknowledgments
This research has made use of the NASA/IPAC Infrared Science Archive, which is operated by the Jet Propulsion Laboratory, California Institute of Technology, under contract with the National Aeronautics and Space Administration. This publication makes use of data products from the Wide-field Infrared Survey Explorer, which is a joint project of the University of California, Los Angeles, and the Jet Propulsion Laboratory/California Institute of Technology, and NEOWISE, which is a project of the Jet Propulsion Laboratory/California Institute of Technology. WISE and NEOWISE are funded by the National Aeronautics and Space Administration.
Conflict of interest
The authors declare that the research was conducted in the absence of any commercial or financial relationships that could be construed as a potential conflict of interest.
Publisher’s note
All claims expressed in this article are solely those of the authors and do not necessarily represent those of their affiliated organizations, or those of the publisher, the editors and the reviewers. Any product that may be evaluated in this article, or claim that may be made by its manufacturer, is not guaranteed or endorsed by the publisher.
Supplementary material
The Supplementary Material for this article can be found online at: https://www.frontiersin.org/articles/10.3389/fspas.2023.1246978/full#supplementary-material
Footnotes
1https://irsa.ipac.caltech.edu/data/SPITZER/docs/mips/mipsinstrumenthandbook/
2https://www.cosmos.esa.int/web/herschel/pacs-overview
References
Alaghband-Zadeh, S., Chapman, S., Swinbank, A., Smail, I., Danielson, A., Decarli, R., et al. (2013). Using [c i] to probe the interstellar medium in z 2.5 sub-millimeter galaxies. Mon. Notices R. Astronomical Soc. 435, 1493–1510. doi:10.1093/mnras/stt1390
Aniano, G., Draine, B. T., Gordon, K., and Sandstrom, K. (2011). Common-resolution convolution kernels for space-and ground-based telescopes. Publ. Astronomical Soc. Pac. 123, 1218–1236. doi:10.1086/662219
Baan, W. A., Henkel, C., Loenen, A. F., Baudry, A., and Wiklind, T. (2008). Dense gas in luminous infrared galaxies. A&A 477, 747–762. doi:10.1051/0004-6361:20077203
Bertin, E., and Arnouts, S. (1996). Sextractor: software for source extraction. Astronomy astrophysics Suppl. Ser. 117, 393–404. doi:10.1051/aas:1996164
Béthermin, M., Greve, T., De Breuck, C., Vieira, J., Aravena, M., Chapman, S., et al. (2018). Dense-gas tracers and carbon isotopes in five 2.5< z< 4 lensed dusty star-forming galaxies from the spt smg sample. Astronomy Astrophysics 620, A115. doi:10.1051/0004-6361/201833081
Bigiel, F., Leroy, A. K., Jiménez-Donaire, M. J., Pety, J., Usero, A., Cormier, D., et al. (2016). The EMPIRE survey: systematic variations in the dense gas fraction and star formation efficiency from full-disk mapping of M51. Astrophysical J. Lett. 822, L26. doi:10.3847/2041-8205/822/2/l26
Bigiel, F., Leroy, A., Walter, F., Brinks, E., de Blok, W. J. G., Madore, B., et al. (2008). The star formation law in nearby galaxies on sub-kpc scales. Astronomical J. 136, 2846–2871. doi:10.1088/0004-6256/136/6/2846
Bisbas, T. G., Papadopoulos, P. P., and Viti, S. (2015). Effective destruction of co by cosmic rays: implications for tracing h2 gas in the universe. Astrophysical J. 803, 37. doi:10.1088/0004-637x/803/1/37
Bisbas, T. G., Van Dishoeck, E. F., Papadopoulos, P. P., Szűcs, L., Bialy, S., and Zhang, Z.-Y. (2017). Cosmic-ray induced destruction of co in star-forming galaxies. Astrophysical J. 839, 90. doi:10.3847/1538-4357/aa696d
Bolatto, A. D., Wolfire, M., and Leroy, A. K. (2013). The co-to-h2 conversion factor. Annu. Rev. Astronomy Astrophysics 51, 207–268. doi:10.1146/annurev-astro-082812-140944
Boogaard, L. A., van der Werf, P., Weiss, A., Popping, G., Decarli, R., Walter, F., et al. (2020). The alma spectroscopic survey in the hubble ultra deep field: co excitation and atomic carbon in star-forming galaxies at z= 1–3. Astrophysical J. 902, 109. doi:10.3847/1538-4357/abb82f
Chen, H., Braine, J., Gao, Y., Koda, J., and Gu, Q. (2017). Dense gas in the outer spiral arm of m51. Astrophysical J. 836, 101. doi:10.3847/1538-4357/836/1/101
Chen, H., Gao, Y., Braine, J., and Gu, Q. (2015). Spatially resolved dense molecular gas and star formation rate in M51. Astrophysical J. 810, 140–149. doi:10.1088/0004-637x/810/2/140
Costagliola, F., Aalto, S., Rodriguez, M., Muller, S., Spoon, H., Martín, S., et al. (2011). Molecules as tracers of galaxy evolution: an EMIR survey: I. Presentation of the data and first results⋆. Astronomy Astrophysics 528, A30. doi:10.1051/0004-6361/201015628
Daddi, E., Elbaz, D., Walter, F., Bournaud, F., Salmi, F., Carilli, C., et al. (2010). Different star formation laws for disks versus starbursts at low and high redshifts. Astrophysical J. Lett. 714, L118–L122. doi:10.1088/2041-8205/714/1/l118
Dasyra, K., and Combes, F. (2011). Turbulent and fast motions of h2 gas in active galactic nuclei. Astronomy Astrophysics 533, L10. doi:10.1051/0004-6361/201117730
Dunne, L., Maddox, S., Papadopoulos, P., Ivison, R., and Gomez, H. (2022). Dust, co, and [c i]: cross-calibration of molecular gas mass tracers in metal-rich galaxies across cosmic time. Mon. Notices R. Astronomical Soc. 517, 962–999. doi:10.1093/mnras/stac2098
Evans, N. J., Heiderman, A., Vutisalchavakul, N., et al. (2014). Star formation relations in nearby molecular clouds. Astrophysical J. 782, 114. doi:10.1088/0004-637x/782/2/114
Fernández-Ontiveros, J. A., Spinoglio, L., Pereira-Santaella, M., Malkan, M. A., Andreani, P., and Dasyra, K. M. (2016). Far-infrared line spectra of active galaxies from the herschel/pacs spectrometer: the complete database. Astrophysical J. Suppl. Ser. 226, 19. doi:10.3847/0067-0049/226/2/19
Gaches, B. A., Offner, S. S., and Bisbas, T. G. (2019). The astrochemical impact of cosmic rays in protoclusters. ii. ci-to-h2 and co-to-h2 conversion factors. Astrophysical J. 883, 190. doi:10.3847/1538-4357/ab3c5c
Galametz, M., Kennicutt, R., Calzetti, D., Aniano, G., Draine, B. T., Boquien, M., et al. (2013). Calibration of the total infrared luminosity of nearby galaxies from spitzer and herschel bands. Mon. Notices R. Astronomical Soc. 431, 1956–1986. doi:10.1093/mnras/stt313
Gao, Y., Carilli, C. L., Solomon, P. M., and Bout, P. A. V. (2007). Hcn observations of dense star-forming gas in high-redshift galaxies. Astrophysical J. Lett. 660, L93–L96. doi:10.1086/518244
Gao, Y., and Solomon, P. M. (2004a). HCN survey of normal spiral, infrared-luminous, and ultraluminous galaxies. Astrophysical J. Suppl. Ser. 152, 63–80. doi:10.1086/383003
Gao, Y., and Solomon, P. M. (2004b). The star formation rate and dense molecular gas in galaxies. Astrophysical J. 606, 271–290. doi:10.1086/382999
García-Burillo, S., Combes, F., Usero, A., Aalto, S., Krips, M., Viti, S., et al. (2014). Molecular line emission in ngc 1068 imaged with alma-i. an agn-driven outflow in the dense molecular gas. Astronomy Astrophysics 567, A125. doi:10.1051/0004-6361/201423843
García-Burillo, S., Usero, A., Alonso-Herrero, A., Graciá-Carpio, J., Pereira-Santaella, M., Colina, L., et al. (2012). Star-formation laws in luminous infrared galaxies: new observational constraints on models⋆. Astronomy Astrophysics 539, A8. doi:10.1051/0004-6361/201117838
Glover, S. C., and Clark, P. C. (2016). Is atomic carbon a good tracer of molecular gas in metal-poor galaxies? Mon. Notices R. Astronomical Soc. 456, 3596–3609. doi:10.1093/mnras/stv2863
Glover, S. C., Clark, P. C., Micic, M., and Molina, F. (2015). Modelling [c i] emission from turbulent molecular clouds. Mon. Notices R. Astronomical Soc. 448, 1607–1627. doi:10.1093/mnras/stu2699
Graciá-Carpio, J., García-Burillo, S., Planesas, P., and Colina, L. (2006). Is hcn a true tracer of dense molecular gas in luminous and ultraluminous infrared galaxies? Astrophysical J. 640, L135–L138. doi:10.1086/503361
Graciá-Carpio, J., García-Burillo, S., Planesas, P., Fuente, A., and Usero, A. (2008). Evidence of enhanced star formation efficiency in luminous and ultraluminous infrared galaxies. Astronomy Astrophysics 479, 703–717. doi:10.1051/0004-6361:20078223
Henkel, C., Mühle, S., Bendo, G., Józsa, G., Gong, Y., Viti, S., et al. (2018). Molecular line emission in ngc 4945, imaged with alma. Astronomy Astrophysics 615, A155. doi:10.1051/0004-6361/201732174
Ikeda, M., Maezawa, H., Ito, T., Saito, G., Sekimoto, Y., Yamamoto, S., et al. (1999). Large-scale mapping observations of the C [CSC]i[/CSC] ([TSUP]3[/TSUP] [ital]P[/ITAL] [TINF]1[/TINF]–[TSUP]3[/TSUP] [ital]P[/ITAL] [TINF]0[/TINF]) and CO ([ITAL]J[/ITAL] = 3–2) lines toward the orion A molecular cloud. Astrophysical J. 527, L59–L62. doi:10.1086/312395
Ikeda, M., Oka, T., Tatematsu, K., Sekimoto, Y., and Yamamoto, S. (2002). The distribution of atomic carbon in the orion giant molecular cloud 1. Astrophysical J. Suppl. Ser. 139, 467–485. doi:10.1086/338761
Imanishi, M., Nakanishi, K., and Izumi, T. (2018). Alma multiple-transition observations of high-density molecular tracers in ultraluminous infrared galaxies. Astrophysical J. 856, 143. doi:10.3847/1538-4357/aab42f
Israel, F., Rosenberg, M., and van der Werf, P. (2015). Neutral carbon and co in 76 (u) lirgs and starburst galaxy centers-a method to determine molecular gas properties in luminous galaxies. Astronomy Astrophysics 578, A95. doi:10.1051/0004-6361/201425175
Izumi, T., Kohno, K., Aalto, S., Doi, A., Espada, D., Fathi, K., et al. (2015). Alma observations of the submillimeter dense molecular gas tracers in the luminous type-1 active nucleus of ngc 7469. Astrophysical J. 811, 39. doi:10.1088/0004-637x/811/1/39
Izumi, T., Kohno, K., Aalto, S., Espada, D., Fathi, K., Harada, N., et al. (2016). Submillimeter-hcn diagram for energy diagnostics in the centers of galaxies. Astrophysical J. 818, 42. doi:10.3847/0004-637x/818/1/42
Izumi, T., Kohno, K., Martín, S., Espada, D., Harada, N., Matsushita, S., et al. (2013). Submillimeter ALMA observations of the dense gas in the low-luminosity type-1 active nucleus of NGC1097. Publ. Astron. Soc. Jpn. Nihon. Tenmon. Gakkai. 65, 100. doi:10.1093/pasj/65.5.100
Izumi, T., Nguyen, D. D., Imanishi, M., Kawamuro, T., Baba, S., Nakano, S., et al. (2020). Alma observations of multiple co and c lines toward the active galactic nucleus of ngc 7469: an x-ray-dominated region caught in the act. Astrophysical J. 898, 75. doi:10.3847/1538-4357/ab9cb1
Jiang, X.-J., Greve, T. R., Gao, Y., Zhang, Z.-Y., Tan, Q., de Grijs, R., et al. (2020). The MALATANG survey: dense gas and star formation from high-transition HCN and HCO+ maps of NGC 253. Mon. Notices R. Astronomical Soc. 494, 1276–1296. doi:10.1093/mnras/staa794
Jiao, Q., Zhao, Y., Lu, N., Gao, Y., Salak, D., Zhu, M., et al. (2019). Resolved neutral carbon emission in nearby galaxies:[c i] lines as total molecular gas tracers. Astrophysical J. 880, 133. doi:10.3847/1538-4357/ab29ed
Jiao, Q., Zhao, Y., Zhu, M., Lu, N., Gao, Y., and Zhang, Z.-Y. (2017). Neutral carbon emission in luminous infrared galaxies: the [c i] lines as total molecular gas tracers. Astrophysical J. Lett. 840, L18. doi:10.3847/2041-8213/aa6f0f
Jiménez-Donaire, M. J., Bigiel, F., Leroy, A., Usero, A., Cormier, D., Puschnig, J., et al. (2019). Empire: the iram 30 m dense gas survey of nearby galaxies. Astrophysical J. 880, 127. doi:10.3847/1538-4357/ab2b95
Kamenetzky, J., Rangwala, N., Glenn, J., Maloney, P., and Conley, A. (2016). Relations with co rotational ladders of galaxies across the herschel spire archive. Astrophysical J. 829, 93. doi:10.3847/0004-637x/829/2/93
Kennicutt, J. R. C., and Evans, N. J. (2012). Star formation in the milky way and nearby galaxies. Annu. Rev. Astronomy Astrophysics 50, 531–608. doi:10.1146/annurev-astro-081811-125610
Kennicutt, R. C. J. (1998). The global schmidt law in star-forming galaxies. Astrophysical J. 498, 541–552. doi:10.1086/305588
Knudsen, K., Walter, F., Weiss, A., Bolatto, A., Riechers, D., and Menten, K. (2007). New insights on the dense molecular gas in ngc 253 as traced by hcn and hco+. Astrophysical J. 666, 156–164. doi:10.1086/519761
Krips, M., Martín, S., Sakamoto, K., Aalto, S., Bisbas, T., Bolatto, A., et al. (2016). Aca [ci] observations of the starburst galaxy ngc 253. Astronomy Astrophysics 592, L3. doi:10.1051/0004-6361/201628882
Krips, M., Neri, R., García-Burillo, S., Martín, S., Combes, F., Graciá-Carpio, J., et al. (2008). A multi-transition hcn and hco+ study of 12 nearby active galaxies: active galactic nucleus versus starburst environments. Astrophysical J. 677, 262–275. doi:10.1086/527367
Kuno, N., Sato, N., Nakanishi, H., Hirota, A., Tosaki, T., Shioya, Y., et al. (2007). Nobeyama co atlas of nearby spiral galaxies: distribution of molecular gas in barred and nonbarred spiral galaxies. Publ. Astronomical Soc. Jpn. 59, 117–166. doi:10.1093/pasj/59.1.117
Lada, C. J., Forbrich, J., Lombardi, M., and Alves, J. F. (2012). Star formation rates in molecular clouds and the nature of the extragalactic scaling relations. Astrophysical J. 745, 190. doi:10.1088/0004-637x/745/2/190
Lada, C. J., Lombardi, M., and Alves, J. F. (2010). On the star formation rates in molecular clouds. Astrophysical J. 724, 687–693. doi:10.1088/0004-637x/724/1/687
Lee, M. M., Tanaka, I., Iono, D., Kawabe, R., Kodama, T., Kohno, K., et al. (2021). Revisited cold gas content with atomic carbon [c i] in z= 2.5 protocluster galaxies. Astrophysical J. 909, 181. doi:10.3847/1538-4357/abdbb5
Li, F., Wang, J., Fang, M., Tan, Q.-H., Zhang, Z.-Y., Gao, Y., et al. (2020). Hcn 3–2 survey towards a sample of local galaxies. Publ. Astronomical Soc. Jpn. 72, 41. doi:10.1093/pasj/psaa025
Li, F., Wang, J., Gao, F., Liu, S., Zhang, Z.-Y., Li, S., et al. (2021). Dense gas in local galaxies revealed by multiple tracers. Mon. Notices R. Astronomical Soc. 503, 4508–4528. doi:10.1093/mnras/stab745
Liu, D., Gao, Y., Isaak, K., Daddi, E., Yang, C., Lu, N., et al. (2015). High-j co versus far-infrared relations in normal and starburst galaxies. Astrophysical J. Lett. 810, L14. doi:10.1088/2041-8205/810/2/l14
Liu, T., Kim, K.-T., Yoo, H., Liu, S.-y., Tatematsu, K., Qin, S.-L., et al. (2016). Star formation laws in both galactic massive clumps and external galaxies: extensive study with dust coninuum, hcn (4-3), and cs (7-6). Astrophysical J. 829, 59. doi:10.3847/0004-637x/829/2/59
Lu, N., Zhao, Y., Díaz-Santos, T., Xu, C. K., Gao, Y., Armus, L., et al. (2017). A herschel space observatory spectral line survey of local luminous infrared galaxies from 194 to 671 microns. Astrophysical J. Suppl. Ser. 230, 1. doi:10.3847/1538-4365/aa6476
Makiwa, G., Naylor, D. A., Ferlet, M., Salji, C., Swinyard, B., Polehampton, E., et al. (2013). Beam profile for the herschel–spire fourier transform spectrometer. Appl. Opt. 52, 3864–3875. doi:10.1364/ao.52.003864
Martín, S., Kohno, K., Izumi, T., Krips, M., Meier, D., Aladro, R., et al. (2015). Multimolecule alma observations toward the seyfert 1 galaxy ngc 1097. Astronomy Astrophysics 573, A116. doi:10.1051/0004-6361/201425105
Martín, S., Mauersberger, R., Martín-Pintado, J., Henkel, C., and García-Burillo, S. (2006). A 2 millimeter spectral line survey of the starburst galaxy ngc 253. Astrophysical J. Suppl. Ser. 164, 450–476. doi:10.1086/503297
Matsushita, S., Boone, F., Krips, M., Lim, J., Muller, S., et al. (2015). Resolving the bright hcn (1- 0) emission toward the seyfert 2 nucleus of m51: shock enhancement by radio jets and weak masing by infrared pumping? Astrophysical J. 799, 26. doi:10.1088/0004-637x/799/1/26
Meier, D. S., and Turner, J. L. (2012). Spatially resolved chemistry in nearby galaxies. ii. the nuclear bar in maffei 2. Astrophysical J. 755, 104. doi:10.1088/0004-637x/755/2/104
Meier, D. S., Walter, F., Bolatto, A. D., Leroy, A. K., Ott, J., Rosolowsky, E., et al. (2015). Alma multi-line imaging of the nearby starburst ngc 253. Astrophysical J. 801, 63. doi:10.1088/0004-637x/801/1/63
Meijerink, R., Kristensen, L., Weiß, A., Van der Werf, P., Walter, F., Spaans, M., et al. (2012). Evidence for co shock excitation in ngc 6240 from herschel spire spectroscopy. Astrophysical J. Lett. 762, L16. doi:10.1088/2041-8205/762/2/l16
Meijerink, R., and Spaans, M. (2005). Diagnostics of irradiated gas in galaxy nuclei-i. a far-ultraviolet and x-ray dominated region code. Astronomy Astrophysics 436, 397–409. doi:10.1051/0004-6361:20042398
Meijerink, R., Spaans, M., and Israel, F. (2007). Diagnostics of irradiated dense gas in galaxy nuclei-ii. a grid of xdr and pdr models. Astronomy Astrophysics 461, 793–811. doi:10.1051/0004-6361:20066130
Meijerink, R., Spaans, M., Kamp, I., Aresu, G., Thi, W.-F., and Woitke, P. (2013). Tracing the physical conditions in active galactic nuclei with time-dependent chemistry. J. Phys. Chem. A 117, 9593–9604. doi:10.1021/jp312289f
Meijerink, R., Spaans, M., Loenen, A., and van der Werf, P. P. (2011). Star formation in extreme environments: the effects of cosmic rays and mechanical heating. Astronomy Astrophysics 525, A119. doi:10.1051/0004-6361/201015136
Mirabel, I., Booth, R., Garay, G., Johansson, L., and Sanders, D. (1990). Co (1-0) emission from luminous infrared galaxies in the southern hemisphere. Astronomy Astrophysics 236, 327–332.
Nguyen, Q., Jackson, J. M., Henkel, C., Truong, B., Mauersberger, R., et al. (1992). A survey for extragalactic hcn and hco (+). Astrophysical J. 399, 521–532. doi:10.1086/171944
Offner, S. S., Bisbas, T. G., Bell, T. A., and Viti, S. (2014). An alternative accurate tracer of molecular clouds: the ‘x ci-factor. Mon. Notices R. Astronomical Soc. Lett. 440, L81–L85. doi:10.1093/mnrasl/slu013
Oteo, I., Zhang, Z., Yang, C., Ivison, R., Omont, A., Bremer, M., et al. (2017). High dense gas fraction in intensely star-forming dusty galaxies. Astrophysical J. 850, 170. doi:10.3847/1538-4357/aa8ee3
Papadopoulos, P., Dunne, L., and Maddox, S. (2022). The subthermal excitation of the c i lines in the molecular gas reservoirs of galaxies: its significance and potential utility. Mon. Notices R. Astronomical Soc. 510, 725–733. doi:10.1093/mnras/stab3194
Papadopoulos, P. P., Bisbas, T. G., and Zhang, Z.-Y. (2018). New places and phases of co-poor/c i-rich molecular gas in the universe. Mon. Notices R. Astronomical Soc. 478, 1716–1725. doi:10.1093/mnras/sty1077
Papadopoulos, P. P., and Greve, T. R. (2004). Ci emission in ultraluminous infrared galaxies as a molecular gas mass tracer. Astrophysical J. 615, L29–L32. doi:10.1086/426059
Papadopoulos, P. P., Thi, W.-F., and Viti, S. (2004). C i lines as tracers of molecular gas, and their prospects at high redshifts. Mon. Notices R. Astronomical Soc. 351, 147–160. doi:10.1111/j.1365-2966.2004.07762.x
Papadopoulos, P. P., van der Werf, P. P., Xilouris, E., Isaak, K. G., Gao, Y., and Mühle, S. (2012). The molecular gas in luminous infrared galaxies–i. co lines, extreme physical conditions and their drivers. Mon. Notices R. Astronomical Soc. 426, 2601–2629. doi:10.1111/j.1365-2966.2012.21001.x
Popping, G., Decarli, R., Man, A. W., Nelson, E. J., Béthermin, M., De Breuck, C., et al. (2017). ALMA reveals starburst-like interstellar medium conditions in a compact star-forming galaxy atz∼ 2 using [CI] and CO. Astronomy Astrophysics 602, A11. doi:10.1051/0004-6361/201730391
Privon, G. C., Ricci, C., Aalto, S., Viti, S., Armus, L., Diaz-Santos, T., et al. (2020). A hard x-ray test of hcn enhancements as a tracer of embedded black hole growth. Astrophysical J. 893, 149. doi:10.3847/1538-4357/ab8015
Privon, G., Herrero-Illana, R., Evans, A., Iwasawa, K., Perez-Torres, M., Armus, L., et al. (2015). Excitation mechanisms for hcn (1–0) and hco+ (1–0) in galaxies from the great observatories all-sky lirg survey. Astrophysical J. 814, 39. doi:10.1088/0004-637x/814/1/39
Reiter, M., Shirley, Y. L., Wu, J., Brogan, C., Wootten, A., and Tatematsu, K. (2011). The physical properties of high-mass star-forming clumps: A systematic comparison of molecular tracers. Astrophysical J. Suppl. Ser. 195, 1. doi:10.1088/0067-0049/195/1/1
Saito, T., Michiyama, T., Liu, D., Ao, Y., Iono, D., Nakanishi, K., et al. (2020). The 300-pc scale alma view of [c i] 3 p 1–3 p 0, co j= 1–0, and 609-μ m dust continuum in a luminous infrared galaxy. Mon. Notices R. Astronomical Soc. 497, 3591–3600. doi:10.1093/mnras/staa2086
Salak, D., Nakai, N., Miyamoto, Y., Yamauchi, A., and Tsuru, T. G. (2013). Large-field co (j= 1 0) observations of the starburst galaxy m 82. Publ. Astronomical Soc. Jpn. 65, 66. doi:10.1093/pasj/65.3.66
Salak, D., Nakai, N., Seta, M., and Miyamoto, Y. (2019). Alma observations of atomic carbon [c i](3p1 3p0) and low-j co lines in the starburst galaxy ngc 1808. Astrophysical J. 887, 143. doi:10.3847/1538-4357/ab55dc
Sanders, D., Mazzarella, J., Kim, D.-C., Surace, J., and Soifer, B. (2003). The iras revised bright galaxy sample. Astronomical J. 126, 1607–1664. doi:10.1086/376841
Sanders, D., Scoville, N., and Soifer, B. (1991). Molecular gas in luminous infrared galaxies. Astrophysical J. 370, 158–171. doi:10.1086/169800
Shimajiri, Y., André, P., Braine, J., Könyves, V., Schneider, N., Bontemps, S., et al. (2017). Testing the universality of the star-formation efficiency in dense molecular gas. Astronomy Astrophysics 604, A74. doi:10.1051/0004-6361/201730633
Shimajiri, Y., Sakai, T., Tsukagoshi, T., Kitamura, Y., Momose, M., Saito, M., et al. (2013). Extensive [c i] mapping toward the orion-a giant molecular cloud. Astrophysical J. Lett. 774, L20. doi:10.1088/2041-8205/774/2/l20
Soifer, B., Neugebauer, G., Matthews, K., Egami, E., Becklin, E., Weinberger, A., et al. (2000). High resolution mid-infrared imaging of ultraluminous infrared galaxies. Astronomical J. 119, 509–523. doi:10.1086/301233
Solomon, P., Downes, D., Radford, S., and Barrett, J. (1997). The molecular interstellar medium in ultraluminous infrared galaxies. Astrophysical J. 478, 144–161. doi:10.1086/303765
Solomon, P., Downes, D., and Radford, S. (1992). Dense molecular gas and starbursts in ultraluminous galaxies. Astrophysical J. 387, L55–L59. doi:10.1086/186304
Stern, D., Assef, R. J., Benford, D. J., Blain, A., Cutri, R., Dey, A., et al. (2012). Mid-infrared selection of agn with the wide-field infrared survey explorer. i. characterizing wise-selected agn in cosmos. arXiv preprint arXiv:1205.0811.
Stutzki, J., Graf, U., Haas, S., Honingh, C., Hottgenroth, D., Jacobs, K., et al. (1997). Atomic carbon in M82: physical conditions derived from simultaneous observations of the [C [CSC]i[/CSC]] fine-structure submillimeter-wave transitions. Astrophysical J. 477, L33–L36. doi:10.1086/310514
Tan, Q.-H., Gao, Y., Zhang, Z.-Y., Greve, T. R., Jiang, X.-J., Wilson, C. D., et al. (2018). The malatang survey: the l gas–l ir correlation on sub-kiloparsec scale in six nearby star-forming galaxies as traced by hcn j= 4 3 and hco+ j= 4 3. Astrophysical J. 860, 165. doi:10.3847/1538-4357/aac512
Usero, A., Leroy, A. K., Walter, F., Schruba, A., García-Burillo, S., Sandstrom, K., et al. (2015). Variations in the star formation efficiency of the dense molecular gas across the disks of star-forming galaxies. Astronomical J. 150, 115. doi:10.1088/0004-6256/150/4/115
Valentino, F., Magdis, G. E., Daddi, E., Liu, D., Aravena, M., Bournaud, F., et al. (2018). A survey of atomic carbon [c i] in high-redshift main-sequence galaxies. Astrophysical J. 869, 27. doi:10.3847/1538-4357/aaeb88
Valentino, F., Magdis, G. E., Daddi, E., Liu, D., Aravena, M., Bournaud, F., et al. (2020). The properties of the interstellar medium of galaxies across time as traced by the neutral atomic carbon [c i]. Astrophysical J. 890, 24. doi:10.3847/1538-4357/ab6603
Viti, S., García-Burillo, S., Fuente, A., Hunt, L., Usero, A., Henkel, C., et al. (2014). Molecular line emission in NGC 1068 imaged with ALMA: II. The chemistry of the dense molecular gas⋆. Astronomy Astrophysics 570, A28. doi:10.1051/0004-6361/201424116
Wang, M., Henkel, C., Chin, Y.-N., Whiteoak, J., Cunningham, M. H., Mauersberger, R., et al. (2004). Dense gas in nearby galaxies: XVI. The nuclear starburst environment in NGC 4945. Astronomy Astrophysics 422, 883–905. doi:10.1051/0004-6361:20035722
Weiß, A., Downes, D., Henkel, C., and Walter, F. (2005). Atomic carbon at redshift ∼2.5. Astronomy Astrophysics 429, L25–L28. doi:10.1051/0004-6361:200400085
Weiß, A., Henkel, C., Downes, D., and Walter, F. (2003). Gas and dust in the cloverleaf quasar at redshift 2.5. Astronomy Astrophysics 409, L41–L45. doi:10.1051/0004-6361:20031337
Wu, J., Evans, N. J. I., Gao, Y., Solomon, P. M., Shirley, Y. L., and Vanden Bout, P. A. (2005). Connecting dense gas tracers of star formation in our galaxy to high-z star formation. Astrophysical J. 635, L173–L176. doi:10.1086/499623
Wu, J., Evans, N. J., Shirley, Y. L., and Knez, C. (2010). The properties of massive, dense clumps: mapping surveys of hcn and cs. Astrophysical J. Suppl. Ser. 188, 313–357. doi:10.1088/0067-0049/188/2/313
Yang, C., Omont, A., Beelen, A., Gao, Y., van Der Werf, P., Gavazzi, R., et al. (2017). Molecular gas in theHerschel-selected strongly lensed submillimeter galaxies atz ∼ 2–4 as probed by multi-JCO lines. Astronomy Astrophysics 608, A144. doi:10.1051/0004-6361/201731391
Zhang, Z.-Y., Gao, Y., Henkel, C., Zhao, Y., Wang, J., Menten, K. M., et al. (2014). Dense gas tracers and star formation laws in active galaxies: apex survey of hcn j= 4 3, hco+ j= 4 3, and cs j= 7 6. Astrophysical J. Lett. 784, L31. doi:10.1088/2041-8205/784/2/l31
Keywords: dense molecular gas, star formation-galaxies, sample, HCN (4−3), HCO + (4−3), AGN -active galactic nucleus
Citation: Jiao Q, Gao Y, Tan Q and Gao Y (2023) Dense gas star formation efficiency and the
Received: 25 June 2023; Accepted: 13 September 2023;
Published: 03 October 2023.
Edited by:
Milan S. Dimitrijevic, Astronomical Observatory, SerbiaReviewed by:
Toshiki Saito, National Astronomical Observatory of Japan (NAOJ), JapanXindi Tang, Chinese Academy of Sciences (CAS), China
Copyright © 2023 Jiao, Gao, Tan and Gao. This is an open-access article distributed under the terms of the Creative Commons Attribution License (CC BY). The use, distribution or reproduction in other forums is permitted, provided the original author(s) and the copyright owner(s) are credited and that the original publication in this journal is cited, in accordance with accepted academic practice. No use, distribution or reproduction is permitted which does not comply with these terms.
*Correspondence: Qian Jiao, amlhb3FpYW5Ad2hwdS5lZHUuY24=