 Simon Wing
 Jean Berchem2†
 C. Philippe Escoubet
- 1Applied Physics Laboratory, The Johns Hopkins University, Laurel, MD, United States
- 2Department of Physics and Astronomy, University of California Los Angeles, CA, United States
- 3European Space Agency, European Space Research and Technology Center, Noordwijk, Netherlands
- 4Space Science Center, University of New Hampshire, Durham, NH, United States
The dayside particle precipitation during the passage of a solar wind rotational discontinuity (RD) event on 10 April 2015 is examined and reviewed. The RD leads to complex structures at the magnetopause, boundary layer, mantle, and cusp even though the geomagnetic activity level remains low. Particle precipitation data from DMSP F17 reveal the formation of an unusual boundary layer where the low energy (cold) ions exhibit energy-latitude dispersion that is usually associated with mantle while the high energy (hot) ions look like typical magnetospheric ions. DMSP F17 and F19 observe a double cusp that is a signature of magnetic reconnection occurring at both high- and low-latitudes due to the dominant IMF By. A global MHD simulation of the event supports the existence of the simultaneous reconnections at high- and low-latitude magnetopause that are consistent with the anti-parallel and component merging models, respectively. Finally, Cluster C2, located at high-latitude and high-altitude in the southern hemisphere, observes velocity fluctuations and reversals with peak-to-peak amplitudes >800 km·s–1 as it crosses the magnetopause. Guided by the MHD simulation, the Cluster observation can be interpreted as the spacecraft crossing reconnection outflows while moving from one side of the X-line to the other.
1 Introduction
Solar wind directional discontinuities (DDs) can be categorized as either rotational discontinuities (RDs) or tangential discontinuities (TDs) (e.g., Liu et al., 2022). RDs are special cases of oblique shocks propagating at the intermediate speed (i.e., the Alfvén speed). For isotropic plasmas, the normal components of the plasma flow and magnetic field are continuous across RDs, hence their tangential components have to rotate together. The jump in the tangential flow velocity is exactly equal to the jump in the tangential Alfvén velocity. RDs occur frequently in the fast solar wind and are often described in terms of phase-steepened large-amplitude Alfvén waves (Tsurutani et al., 1994). On the other hand, TDs are characterized by the absence of a normal mass flow and magnetic field penetration across the discontinuity.
There have been many studies of the solar wind control of the dayside particle precipitation at high-latitudes, either in the open-field line regions such as cusp, mantle, low-latitude boundary layer (LLBL), open-field line LLBL (open-LLBL), and high-latitude boundary layer (Yeager et al., 1976; Newell and Meng, 1992; Lockwood et al., 1993; Lyons et al., 1994; Wing et al., 1996; Wing et al., 2001; Fairfield et al., 2008; Shi et al., 2013; Shi et al., 2009; Newell et al., 2009; Shen et al., 2022; Bouriat et al., 2023) or in the closed field lines such as boundary plasma sheet and central plasma sheet (Newell and Meng, 1992; Newell et al., 2004; Bouriat et al., 2023). However, there have been fewer studies on the response of the high-latitude particle precipitation to solar wind DDs, either RDs or TDs. Escoubet et al. (2008) observed the cusp precipitation during the sharp turning of the IMF from southward to northward and showed the quick change in the ion energy dispersion characteristics as the Cluster spacecraft crossed the cusp with a few minutes of delay. They, however, did not investigate the solar wind DD itself and its impact on the magnetopause and cusp.
Discontinuous cusps can develop as a temporal feature, which can be attributed to the time varying or pulsed reconnections (Lockwood and Smith, 1989; 1992; Escoubet et al., 1992; Trattner et al., 2002a; 2015). However, Smith et al. (1992) found that the occurrence probability of pulsed reconnections is low when the interplanetary magnetic field (IMF) By is dominant. The discontinuous cusps can also be a spatial feature occurring under stable solar wind/IMF, which can be attributed to reconnections occurring at two or more locations at the magnetopause simultaneously (e.g.,Trattner et al., 1999; Trattner et al., 2002b; Su et al., 2001; Wing et al., 2001; Pitout et al., 2002). Wing et al. (2001) developed an open-field line particle precipitation model. When IMF By is dominant, the model predicted a class of spatial discontinuous cusp where there are two cusps per hemisphere, which they termed double cusp (Wing et al., 2001). The double cusp was subsequently confirmed observationally (e.g., Wing et al., 2001; Wing et al., 2005b; Trattner et al., 2002b; Merka et al., 2002; Pitout et al., 2002; Pitout and Bogdanova, 2021).
This paper presents the short time-scale effects of a solar wind RD on the dayside particle precipitation (within ∼10 min after its arrival on the dayside magnetosphere). Recently, Wing et al. (2023) described the effects of a solar wind RD on the magnetosheath, magnetopause, dayside magnetosphere and ionosphere in multispacecraft observations. The present paper reviews and expands Wing et al. (2023) to include some key new material, including magnetic field data and field-aligned currents (FACs). In particular, for better alignment with the Frontiers research topic on particle precipitation, this paper gives a more complete treatment of and more emphasis on particle precipitation than Wing et al. (2023). As reported in Wing et al. (2023), the RD leads to complicated structures at the magnetopause, boundary layer, and cusp. Additionally, the low-altitude Defense Meteorological Satellite Program (DMSP) spacecraft observe a double cusp that is a signature of magnetic reconnection occurring at both low- and high-latitudes, while the Cluster C2 observes velocity and magnetic field fluctuations at the magnetopause consistent with the occurrence of reconnection at high-latitudes. A global MHD simulation for this event shows the existence of the simultaneous reconnections at high- and low-latitudes.
The rest of the paper is organized as follow. Section 2 reviews a class of discontinuous cusps called double cusps, which is a spatial feature when IMF By is dominant. Section 3 presents the DMSP observations of complicated particle precipitation regions when the RD interacts with the magnetosphere on 10 April 2015 06 UT. Section 4 presents the Cluster observations of the magnetosheath, magnetopause, and dayside magnetosphere during the RD event. A global MHD simulation of the event is presented in Section 5. Finally, Section 6 presents a discussion and summary.
2 Double cusp: a class of spatial discontinuous cusps when IMF By is dominant
Before we present the solar wind RD and its effects on the magnetosphere and ionosphere, it would be worthwhile to review the double cusp concept, which can provide context for the discussion of the RD event. Wing et al. (1996), Wing et al. (2001) developed an open-field line particle precipitation model that is computationally inexpensive (and yet can still illuminate the physical processes involved). The model inputs solar wind and magnetospheric parameters (solar wind ion velocity, temperature, and density, IMF, Earth’s magnetic field model, ionospheric convection electric field, and dipole tilt angle) and computes the phase space density of the precipitating particles (ions and electrons) in three steps. In the first step, which assumes that the magnetic moment is conserved, the ionospheric particles are traced back along the guiding centers to the magnetopause entry point using the Tsyganenko and Stern (1996) magnetic field model (T96 model) and the electric field obtained from the statistical Johns Hopkins University Applied Physics Laboratory (APL) convection patterns (Ruohoniemi and Greenwald, 1996). The second step is to compute deceleration (j • E < 0) or the acceleration (j • E > 0) imparted on the particles when they cross the magnetopause current layer from the magnetosheath to the magnetosphere. This computation is done using the de Hoffman-Teller reference frame in which E = 0 (e.g., Hill and Reiff, 1977; Cowley and Owen, 1989). From this calculation, the model obtains the velocity that the particles originally have in the magnetosheath. Finally, it computes the phase space density of the particles with that velocity, using Spreiter and Stahara (1985) gas dynamics model. Assuming conservation of phase space density along particle trajectories, the model can be used to compute the differential energy fluxes at the location where the particles are “detected” in the ionosphere. The model includes a parallel electric field that maintains charge-quasi neutrality; solar wind suprathermal (strahl) electrons; and κ distribution for ions. Wing et al. (1996), Wing et al. (2001) describe the model in more details.
Wing et al. (2001) ran the model for the case when the IMF Bz is weakly negative and By is strongly positive. The input parameters to the model are: IMF (Bx, By, Bz) = (−3.4, 12.3, −0.5) nT, solar wind thermal n = 11 cm-3, Ti = 1 × 10⁵ °K, Te = 3 × 10⁴ °K, suprathermal (strahl) electron ns = 0.2 cm-3, Ts = 1 × 10⁶ °K, κ = 7, and the altitude of “detected” particle = 1.13 RE, which corresponds to the DMSP spacecraft altitude. The model calculations are compared with the ion and electron precipitation measured by Special Sensor J (SSJ) instrument on board of DMSP spacecraft (Hardy et al., 1984). The model result is shown in Figure 1A. The model predicts two cusps (double cusp) that are latitudinally separated. The lower latitude cusp has little or no energy-latitude dispersion and the higher latitude cusp exhibits dispersion that has some resemblance to that of the classical southward IMF dispersion. The lower-latitude cusp ions originate from low-latitude magnetopause (−5 < z < 5 RE) and the higher-latitude cusp ions originate from high-latitude magnetopause (7 < z < 13 RE). The model stops tracing whenever the particle reaches x < −50 RE, which explains the sudden cutoff of the polar rain electrons in Figure 1A.
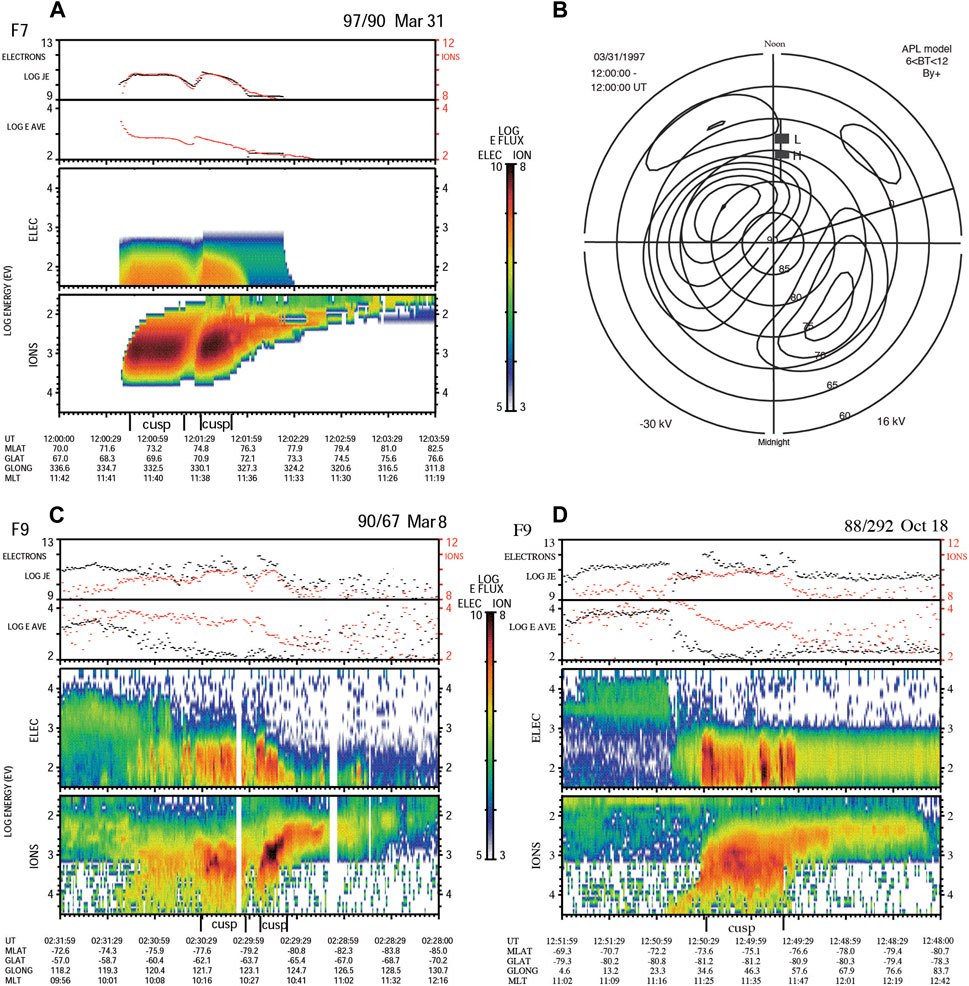
Figure 1. (A) An example of the model double cusp. The results of the model calculations for the IMF conditions where (1) By is dominant and positive; and (2) Bz is weakly negative. See text for the input parameters to the model. The spectrogram shows log differential energy flux, in units of eV/cm2 s sr eV, from 32 eV to 30 keV, with the ion energy scale inverted. The lower of the two line plots shows the average energy in eV for the electrons (black) and ions (orange), and the top line plot is of integral energy flux in units eV/cm2 s sr. The cusp regions are identified with labels beneath the x-axis. (B) The locations of the low- and high-latitude cusps overlain on top of the APL convection pattern for strong IMF By > 0 (Ruohoniemi and Greenwald, 1996). (C) An example of DMSP double cusp observation when IMF By > 0, and dominant. (D) A DMSP example showing that sometimes the two cusps of the double cusp can be so closely located together to form just a single cusp with an extended latitudinal width (adapted from Wing et al., 2001).
The dispersion can be explained by the satellite trajectory relative to the E × B convection, as shown in Figure 1B. The figure shows that the E × B convection in the lower latitude cusp region is weak and directed dawnward, whereas in the higher latitude cusp region, it is strong and directed dawnward and poleward. The model satellite traveling in the meridional direction near noon encounters ions from two magnetosheath sources. The first population is associated with the ions that enter from the low-latitude magnetopause near the noon meridian, and then undergo little E × B dawnward convection, nearly perpendicular to the satellite path. This results in the dispersionless ion signature in the lower-latitude cusp in Figure 1B. The second population is associated with ions that enter at the high-latitude magnetopause eastward of the satellite location. Upon entering the magnetopause, the ions E × B convect strongly westward and poleward. Because of a significant poleward convection, the model satellite observes dispersion that is similar to the classical southward IMF dispersion. The Wing et al. (1996), Wing et al. (2001) model does not have reconnection/merging processes explicitly. However, if we assume that all magnetosheath ion entries result from reconnections, then the result here suggests that reconnections simultaneously or nearly simultanesoulsy occurs at the high- and low-latitude magnetopause. The magnetopause reconnection/merging locations are investigated in Section 5 with a global Magnetohydrodynamic (MHD) model, which does include reconnection processes.
Figure 1C shows an example of DMSP observations when IMF Bz is small and By is large. Sometimes the separation between the two cusps narrows and gives the impression of just one cusp with an extended latitudinal width. An example of this is shown in Figure 1D. However, the dispersion signatures remain the same: the lower-latitude cusp exhibits little or no dispersion while the higher-latitude cusp exhibits some dispersion.
The model has caveats, some of which are described here. Although the APL convection pattern provides an accurate electric field, it is not consistent with the T96 magnetic field model. The T96 model itself has its own deficiencies, e.g., it does not take into account the effects of the IMF on the magnetopause shape and size, which in turn can affect the cusp footprint (e.g., Shue et al., 1997). The Spreiter and Stahara (1985) magnetosheath model is a single-fluid gas-dynamic model that does not take into account the magnetic field. In addition, the model has not taken all the particle precipitation processes into account such as wave-particle interactions, non-adiabatic motions, particle diffusion across the magnetopause, etc.
The Wing et al. (2001) model and observations show that the double cusp is a class of discontinuous cusps that is a spatial feature and that is associated with By dominant IMF. The low and high-latitude cusps result from solar wind entrees at low- and high-latitude magnetopause locations, respectively.
3 Complex particle precipitation during the passage of a solar wind rotational discontinuity
Wing et al. (2023) presents an example of complex particle precipitation that occurs during the passage of the solar wind RD event. This is summarized below.
Figure 2 panels A–H show the Wind observation of the solar wind RD event at L1 on 2015 April 10 at 05:11–05:15 UT (the time tags the beginning of the RD). The RD is accompanied by a decrease in the solar wind dynamic pressure (Pdyn) and density. Pdyn and solar wind density fluctuate for about 35 min following the RD (panel G). Figure 2B shows that IMF Bz and Bx are about 10 nT before the RD, but turn to −8 nT at the RD and remain stable at the same values thereafter for at least 30 min. IMF By changes from −8 to −16 nT at the RD and then remains relatively stable and dominant for at least 30 min thereafter. From the consideration of the IMF Bx and By, the solar wind orientation changes from Parker spiral to ortho-parker spiral at the RD. THEMIS C was in the solar wind equatorial region on the flank and confirmed the Wind’s observation of the RD.
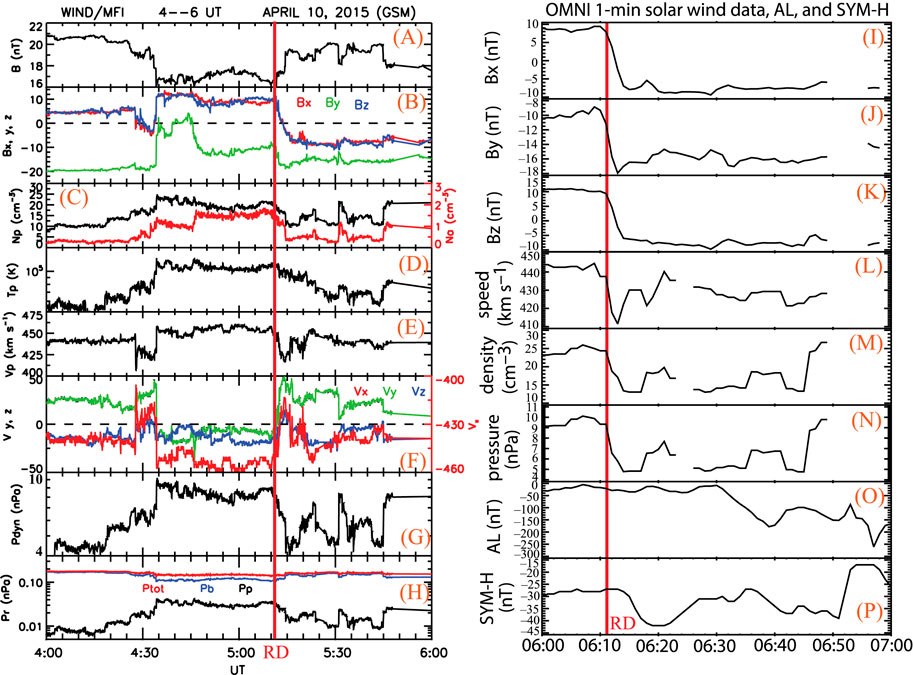
Figure 2. Wind 3-s plasma and magnetic field observations of the RD event: IMF magnitude (A), IMF Bx, By, and Bz (B), proton and the alpha-particle (red) number densities, (C), proton temperature (D), proton speed (E), the three components of the proton velocity (F), solar wind dynamic pressure (G), and proton thermal, magnetic, and total pressures (H). OMNI 1-min solar wind data: IMF Bx (I), By (J), Bz (K), solar wind speed (L), density (M), and dynamic pressure (N). Panels (O, P) display AL and SYM-H indices, respectively. Both the Wind and OMNI data are given in the Geocentric Solar Magnetospheric (GSM) coordinate system. The red vertical lines indicate the start of the RD (from Wing et al., 2023).
Panels I–N show the 1 min OMNI solar wind data indicating that the RD arrives at the nose of the bow shock at about 06:11 UT. Note that the OMNI solar wind data have 1 min resolution whereas the Wind data have 3 s resolution.
Panels O and P show quiet magnetospheric condition when the RD arrives. AL ∼ −20 nT and remains relatively stable for about 20 min after the arrival of the RD and there is no evidence of substorm (a substorm does not occur until 06:40 UT (Newell and Gjerloev, 2011), but the analysis focuses on the 10 min period after the RD arrival at the dayside magnetosphere). SYM-H ∼ −20 nT when RD arrives and decreases to about −42 nT at 06:20 UT and there is no geomagnetic storm.
During the RD event, DMSP F17, F18, and F19 are located on the dayside ionosphere as shown in Figure 3. Figure 3 shows that for a brief interval, F17 and F18 have trajectories that are close to each other with F18 leading F17 by about 4 min. F19 also follows F17 and F18 trajectories with about ∼25–30 min lag time.
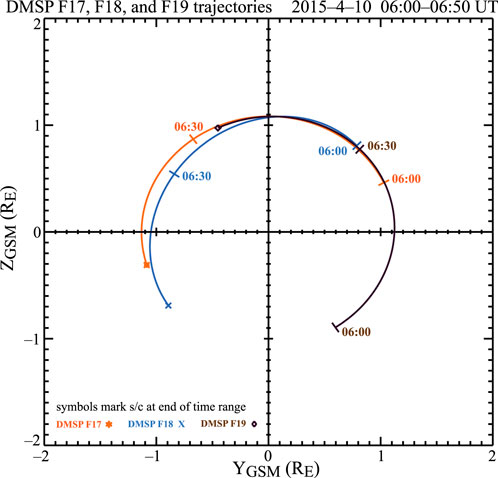
Figure 3. DMSP F17, F18, and F19 trajectories during the solar wind RD event 2015 April 10 06:00–06:50 UT. Adapted from NASA Satellite Situation Center (SSC) (https://sscweb.gsfc.nasa.gov/index.html).
Figures 4A, B present the complicated boundary layer and cusp structures detected by the SSJ particle precipitation instrument on board of the DMSP F17 and F18 during the RD event.
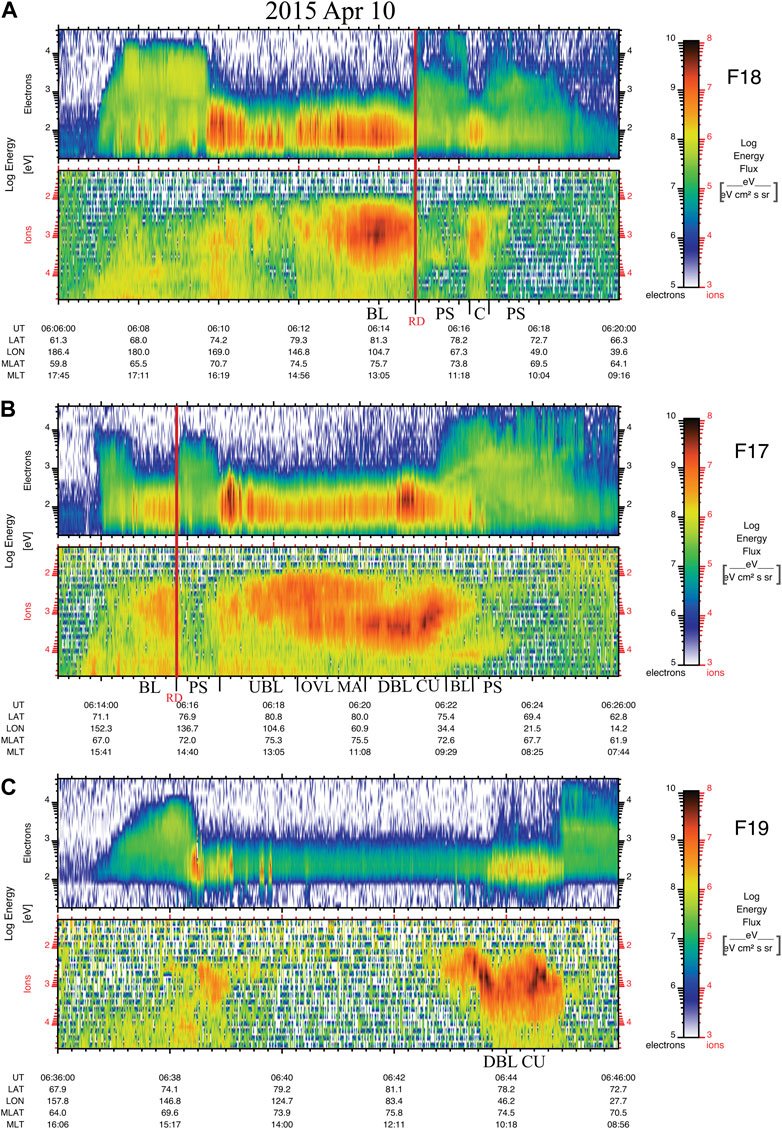
Figure 4. The DMSP ion and electron spectrograms from F18 (A), F17 (B), and F19 (C), in the same format as those in Figure 1. The F18 and F17 spectrograms show the auroral ion and electron precipitation shortly before and after the RD arrives while F19 spectrograms show the auroral precipitation 20–30 min after the RD arrives. The red vertical lines show the time when the effect of the RD arrives in the ionosphere. BL, boundary layer; UBL, unusual boundary layer; PS, plasma sheet; C, cusp or boundary layer; OVL MA, overlapping mantle; DBL CU, double cusp (from Wing et al., 2023).
Figure 4A shows that DMSP F18 observes the effect of the RD around 2015 April 10 06:14:57 UT around noon MLT, which is indicated by the red vertical line. Before the RD, F18 observes a rather thick boundary layer that is typical for northward IMF Bz (Nemecek et al., 2015). The boundary layer is characterized by ions having two populations: magnetospheric (energies >10 keV) and magnetosheath (energy ranges from a few hundred eV to a few keV) ions (Newell et al., 1991a; Newell et al., 1991b; Newell et al., 1991c; Newell et al., 2004). The arrival of the RD and the accompanying Pdyn decrease causes the plasma sheet (or boundary plasma sheet) to move to higher latitude due to the expansion of the magnetosphere. Hence, F18 observes the plasma sheet, where the plasma has higher energies and lower densities than those in the boundary layer (Wing and Newell, 1998; Wing and Newell, 2002; Newell et al., 2004; Wing et al., 2005a) from 06:14:58 to 06:16:13 UT. This interpretation is supported by the magnetic field observations presented later. From 06:16:14 to 06:16:40 UT, F18 observes cusp (MLT ∼11), which is characterized by intense precipitating ion and electron fluxes (Wing et al., 1996) because after the RD, the IMF rotates from northward to southward while By becomes more negative and dominant. There is no dispersion signature in the ion spectrogram because the IMF By is dominant and the F18 does not traverse the cusp parallel to the E × B convection direction (Section 2). However, cusp with no dispersion can sometimes be difficult to be distinguished from the boundary layer because much of the plasma in both regions originate from the solar wind. As F18 moves to lower latitudes it once again observes the plasma sheet at prenoon, starting at 06:16:41 UT to the end of the spectrogram in Figure 4A.
Figure 4B shows that F17 observes the effect of the RD around 06:15:50 UT at MLT = 14:47 (postnoon), 53 s after its arrival at MLT = 12:12 (observed by F18). This time delay is consistent with the ortho-Parker spiral orientation of the solar wind, which would tend to strike the magnetopause first at prenoon, from where the solar wind discontinuity would propagate to noon, and then afternoon (Kaufmann and Konradi, 1969; Wilken et al., 1982; Wing et al., 2002). The DMSP F18 and F17 observations suggest that the discontinuity travels a distance of ∼2.5 h in MLT in 53 s.
Prior to the arrival of the RD (left of the red vertical line in Figure 4B), F17 observes boundary layer plasma, which is typical for northward IMF, but when the RD arrives, the plasma sheet moves to higher latitude due to the expansion of the magnetosphere and consequently, F17 observes the plasma sheet. Then, as F17 moves to higher latitudes, it observes a rather unusual boundary layer (labeled UBL in Figure 4B). The typical boundary layer ions have two components: the hot component corresponding to the magnetospheric ions and the cold component corresponding to the magnetosheath ions. However, here the cold/magnetosheath ions exhibit an energy-latitude dispersion that is more commonly seen in the mantle (characterized by lower energies and fluxes than those in the cusp), but the mantle would usually be located on open-field lines that are devoid of magnetospheric ions (Wing et al., 1996; Wing et al., 2001). Although it is clear that this unusual ion structure can be attributed to the RD, but it is not clear how it is formed.
After the RD, the reconnection moves to the dayside due to the southward turning of a By-dominant IMF. As F17 moves toward noon, it observes another unusual feature: an overlapping mantle (labeled OVL MA in Figure 4B), which may indicate time varying reconnections perhaps due to the IMF rotation (a temporal feature). Overlapping cusp ion signature has been attributed to time varying reconnections (Trattner et al., 2002), but here F17, located at higher latitude, observes an overlapping mantle instead. As F17 moves to lower latitudes, it observes a double cusp from (labeled DBL CU in Figure 4B), where the high- and low-latitude cusps originate from the high- and low-latitude reconnection sites, respectively (Section 2). A global MHD simulation for this event corroborates the presence of these high- and low-latitude reconnection sites (Section 5). Hence, the double cusp is probably a stable spatial feature due to the dominant IMF By, but we cannot rule out a transient/temporal effect because IMF has just rotated southward. Pulsed reconnections can also lead to a discontinuous cusp that is a temporal feature (Lockwood and Smith, 1989; Lockwood and Smith, 1992; Trattner et al., 2015), but its occurrence probability is low when IMF By is dominant (Smith et al., 1992). As F17 continues moving to lower latitudes, it encounters the boundary layer and plasma sheet plasma.
Note that at ∼06:18 UT (after the RD), F17 is located at nearly the same location as F18 was 4 min earlier at ∼06:14 UT (before the RD). F18 observes the typical northward IMF boundary layer, but F17 observes UBL. This fortuitous conjunction provides the clearest evidence yet of the perturbation caused by the RD.
About 25 min after the RD, the solar wind is very stable and IMF By is dominant and DMSP F19 observes the classic double cusp as a spatial feature as shown in Figure 4C. There is no dispersion at the lower latitude cusp because the IMF By is dominant and the E × B convection is mainly in the azimuthal direction whereas F19 travels poleward (Section 2).
The DMSP spacecraft also carry Special Sensor Magnetic field (SSM) instrument, which is a triaxial fluxgate magnetometer with a range of ±65,535 nT and one-bit resolution of 2 nT (Rich et al., 1985). The SSM can measure magnetic field at 1 s time resolution. The DMSP SSM magnetic field data can provide estimates of the large-scale structure of FACs (e.g., Wing et al., 2010; Wing et al., 2011; Wing and Johnson, 2015; Johnson and Wing, 2015).
Figure 5 shows that the solar wind RD also introduces perturbations to the FACs. Figures 5A, B plot the cross-track (solid green curve) and along-track (dotted magenta curve) components of the magnetic field observations from the DMSP F18 and F17, respectively. The ion and electron spectrograms in panels A and B in Figure 5 are the same as those in Figure 4, and are included here to provide context to the magnetic field data.
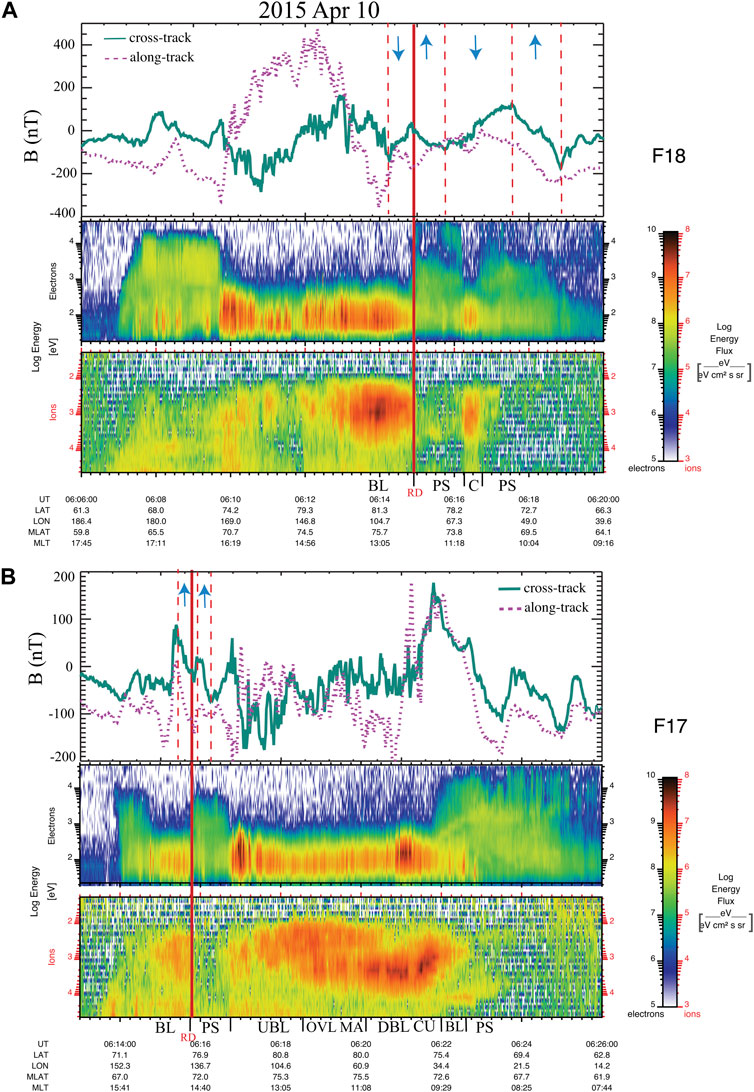
Figure 5. The DMSP magnetic field data, ion, and electron spectrograms from F18 (A) and F17 (B). The ion and electron spectrograms in panels (A) and (B) are the same as those in Figure 4 panels (A) and (B). The red vertical lines show the time when the effect of the RD arrives in the ionosphere. The magnetic field cross-track and along-track components are plotted as solid green and dotted magenta curves, respectively. The polarities of the field-aligned currents are indicated by the blue arrows. BL, boundary layer; UBL, unusual boundary layer; PS, plasma sheet; C, cusp or boundary layer; OVL MA, overlapping mantle; DBL CU, double cusp (adapted from Wing et al., 2023)
Figure 5A shows that F18 observes downward FAC before the arrival of the RD, but after the RD arrives, the FAC changes polarity to upward, which has the same sense as region-2 (R2) current at prenoon (e.g., Iijima and Potemra, 1976; Wing et al., 2010). At prenoon, the plasma sheet is typically located at lower latitude than boundary layer, cusp, or mantle (c.f. Figure 9) and is usually associated with the upward R2 current (see Figure 2 in Wing et al. (2010); Newell and Meng (1992)). Thus, the F18 observation of the upward FAC would be consistent with the R2 current in the plasma sheet and the R2 (plasma sheet) moving to higher latitude due to the expansion of the magnetosphere at the decrease of Pdyn as noted above. As F18 continues traveling toward prenoon, it observes downward FAC around the cusp/boundary layer region as would be expected because at prenoon, downward R1 current is typically associated with cusp and boundary layer (see Figure 2 in Wing et al., 2010). Then, as F18 travels to lower latitudes, it observes upward FAC, which is consistent with the SSJ observation of the plasma from the plasma sheet where the R2 current is typically upward at prenoon. At prenoon, the equatorward portion of the boundary layer can also be associated with upward R2 current, albeit less frequently (Wing et al., 2010).
In the afternoon, both the boundary layer and the poleward part of the plasma sheet typically can be associated with the upward R1 current (Wing et al., 2010). Figure 5B shows that before the arrival of the solar wind RD, FAC is upward, which has the same sense as the afternoon R1 current and is typical of the boundary layer. After the RD arrives, the plasma sheet moves up in latitude due to the expansion of the magnetosphere. F17 still observes upward FAC because R1 is upward in the poleward part of the plasma sheet. However, shortly after the RD arrives (vertical red line), there are small kinks in both the cross- and along-track components of the magnetic field where the plasma regime changes from the boundary layer to plasma sheet.
The magnetic field and inferred FACs in the F17 and F18 observations support the interpretation of the particle precipitation above. The different responses of the FACs observed by F18 and F17 can be attributed, at least partly, to the difference in MLTs.
4 Cluster observations of the magnetosheath, magnetopause, and dayside magnetosphere
Cluster satellites, which were launched in 2000, consists of four satellites (C1, C2, C3, and C4) in tetrahedral formation during the early days of the mission (Escoubet et al., 1997). The electron data are obtained from the Plasma Electron And Current Experiment (PEACE) instruments that measure the three-dimensional velocity distribution of electrons in the energy range from 0.6 eV to 26.5 keV (Johnstone et al., 1997) and the magnetometer data from the FluxGate Magnetometer (FGM) instrument (Balogh et al., 1997). The PEACE instrument time resolution varies during the time of observations: 4 s on C2 and C3, 8 s on C4, 68 s on C1 for the density and velocity and 4 s for the pitch-angle distributions on all spacecraft. During the RD event, the Cluster spacecraft are approximately in a string of pearl configuration with C2 leading, going out of the magnetosphere, followed by C1, C4, and finally C3 as shown in Figure 6.
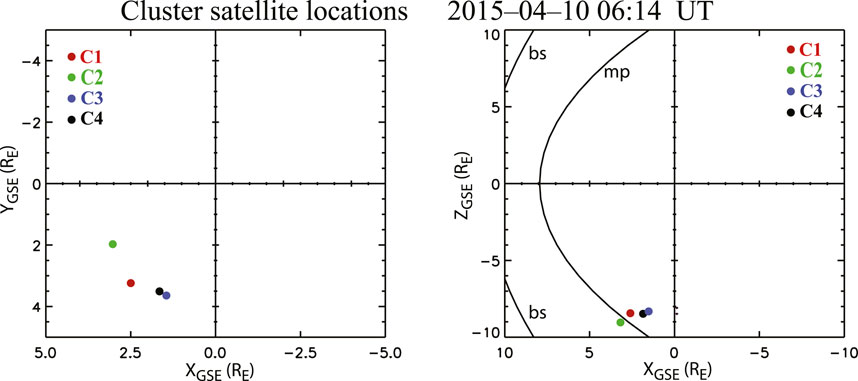
Figure 6. Cluster spacecraft locations just before the RD arrives. mp = magnetopause boundary from Roelof and Sibeck (1993) model. bs, bow shock boundary from Fairfield (1971) model. Adapted from NASA Satellite Situation Center (SSC) (https://sscweb.gsfc.nasa.gov/index.html).
Cluster satellites are located at the postnoon, high-latitude, and high-altitude southern hemisphere during the passage of the RD. Figure 7 shows that Cluster C2 is in the magnetosheath before 06:14 UT, but it moves to the magnetopause around 06:14 UT when the RD arrives because the RD is associated with a decrease in Pdyn and the resulting magnetospheric expansion. Then, C2 crosses to the boundary layer/high-latitude cusp at 06:15 UT as Pdyn continues to decrease. However, C2 only stays briefly in the boundary layer because the magnetosphere starts contracting when Pdyn starts increasing (Figure 2). C2 crosses the magnetopause again around 06:24 UT and by 06:25 UT C2 is back in the magnetosheath. This transition can be seen most notably in the By component, which changes sign from positive (the boundary layer/cusp) to negative (magnetosheath); and in the electron flow speed (Vt), which changes from low (boundary layer/cusp) to high (magnetosheath), and electron flux, which changes from low (the boundary layer/cusp) to high (magnetosheath) as shown in Figure 7 panels E, F, and G.
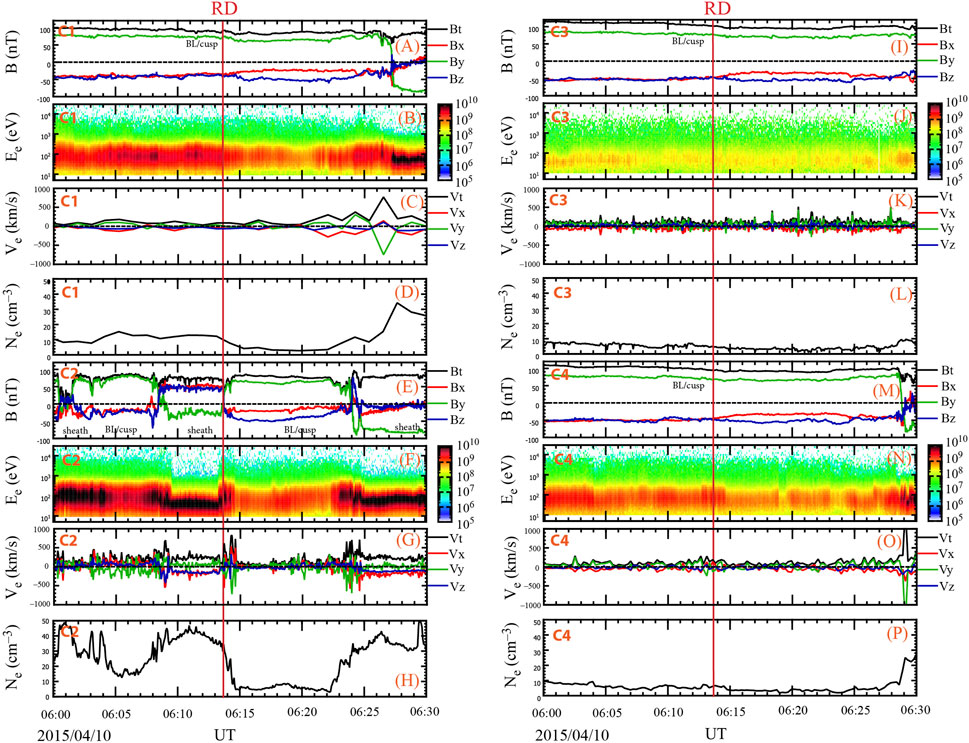
Figure 7. C1, C2, C3, and C4 observations around the time when the solar wind RD arrives. The vertical red lines indicate when RD arrives. C2 observes velocity (G) and magnetic field (E) fluctuations in the magnetopause right after the arrival of the RD. C1, C3, and C4, which are located earthward of C2, observe boundary layer/cusp plasma. The electron density (Ne) and velocity (Ve) time resolution vary on the four spacecraft: 68 s on C1, 4 s on C2, 4 s on C3 and 12 s on C4. [(A–H) are from Wing et al., 2023].
C2 observes that the velocities are higher and unusually highly fluctuating with direction reversals at the magnetopause around 06:14 UT (panel G). The peak-to-peak amplitude of the total velocity (Vt) is > 800 km·s–1 with Vx and Vy fluctuating from >300 km·s–1 to < −500 km·s–1 while Vz from 300 km·s–1 to −300 km·s–1. The velocity is obtained from electrons from PEACE, but similar high velocities and velocity fluctuations and reversals can also be seen in the velocity obtained from ExB (not shown). Interestingly, the velocities are higher inside the magnetopause than outside.
The magnetic field can also be seen fluctuating in the range of about 10 nT, but the largest change can be seen when the field rotates from (Bx, By, Bz) = (50, −20, 40) nT to (−20, 50, −50) nT (panel E), which can partly be attributed to the change in the solar wind magnetic field at the RD. The high frequency fluctuating velocity and magnetic field are observed again when C2 crosses the magnetopause at 06:24 UT. In the next section, the results of a global MHD simulation are used to help interpret the velocity and magnetic field fluctuations.
Figure 7 shows that C1, which is about 9,300 km (1.5 RE) earthward of C2, is at the boundary layer or cusp inside the magnetosphere before the arrival of the RD. After the arrival of the RD at 06:14 UT, C1 is located farther inward from the magnetopause because of the expansion of the magnetosphere. As shown in Figure 7, at 06:14 UT, C1 observes an increase in Bx, and a decrease in Bz, suggesting that perhaps C1 has moved to lower altitudes within the cusp geometry (but the spacecraft altitude remains roughly the same). However, the IMF rotates southward at the RD and Pdyn starts increasing several min after the RD. Pdyn reaches a maximum about 12 min after the RD, as shown in Figure 2, but the magnetopause may continue to erode due to the southward IMF such that by 06:28 UT C1 is located in the magnetosheath. As with C2, this transition can be characterized by the strong shear of By and the changes in the electron speed and flux (Figure 7 panels A, B, and C). When C1 crosses the magnetopause around 06:27 UT, it observes some velocity fluctuation, but its frequency and amplitude are smaller than those observed in C2. This may be attributed to the larger sampling time of PEACE on C1 (68s) than that of C2 (4 s) and some other factors.
Figure 7 shows that C4, which is located 5,400 km (0.85 RE) earthward of C1, observes boundary layer or cusp plasma before the arrival of RD like C1. Also like C1, C4 is located farther away from the magnetopause after the arrival of the RD at 06:14 UT. Like C1, C4 also observes an increase in Bx and a decrease in Bz, suggesting a reconfiguration of the magnetosphere. The compression of the magnetosphere due to Pdyn and the continued erosion of the magnetopause due to southward IMF cause C4 to cross the magnetopause by 06:29 UT and then to the magnetosheath. As with C1 and C2, this transition can be characterized by the strong shear of By and changes in the electron speed and flux (Figure 7 panels M, N, and O).
C3, which is located 1,700 km (0.27 RE) earthward of C4, is in the boundary layer/cusp and remains in the boundary layer when the RD passes by as shown in Figure 7. Like C1 and C4, C3 also observes an increase in Bx and a decrease in Bz, suggesting perhaps a change to a lower latitude geometry.
After 06:29 UT, Pdyn fluctuates (decrease–increase–decrease–increase) in the next 20 min (see Figure 2). As a result, C1, C3, and C4 moves in and out of the magnetosphere a couple more times before they settle in the magnetosheath by 07:00 UT (not shown).
5 Global MHD simulation
A global MHD (Berchem et al., 1998; Berchem et al., 2003) simulation of the 2015 April 10 06 UT RD event is performed to help interpret the DMSP and Cluster observations. The dimensions of the simulation system are 40 RE in the sunward direction (x), 200 RE along the tail, and ±50 RE in each transverse direction (y and z). Near the dayside magnetopause, the dimension of the cells is about 500 km in all directions. Figure 8 panels A and B show the topology of the magnetic field from the simulation. The small white sphere represents the location of C2. In panel B, color contours of the plasma beta are displayed in the x-y plane at the z location of C2. High beta values (red blobs) together with kinks in the field lines and the X topology seen in panel A suggest that the C2 spacecraft is crossing the outflow of a reconnection site where magnetic field orientations inside and outside the magnetopause are nearly anti-parallel consistent with predictions of the anti-parallel-merging model for IMF By < 0 (Crooker, 1979). In Figure 7G, the higher C2 velocities in the magnetopause would be consistent with the reconnection jets observed under strong magnetic field shear near the cusp (e.g., Phan et al., 2003). Panel A shows that there are also reconnections at both low-latitude (consistent with the component merging model) and at high-latitude prenoon in the northern hemisphere, which are consistent with the double cusp observations (Section 3).
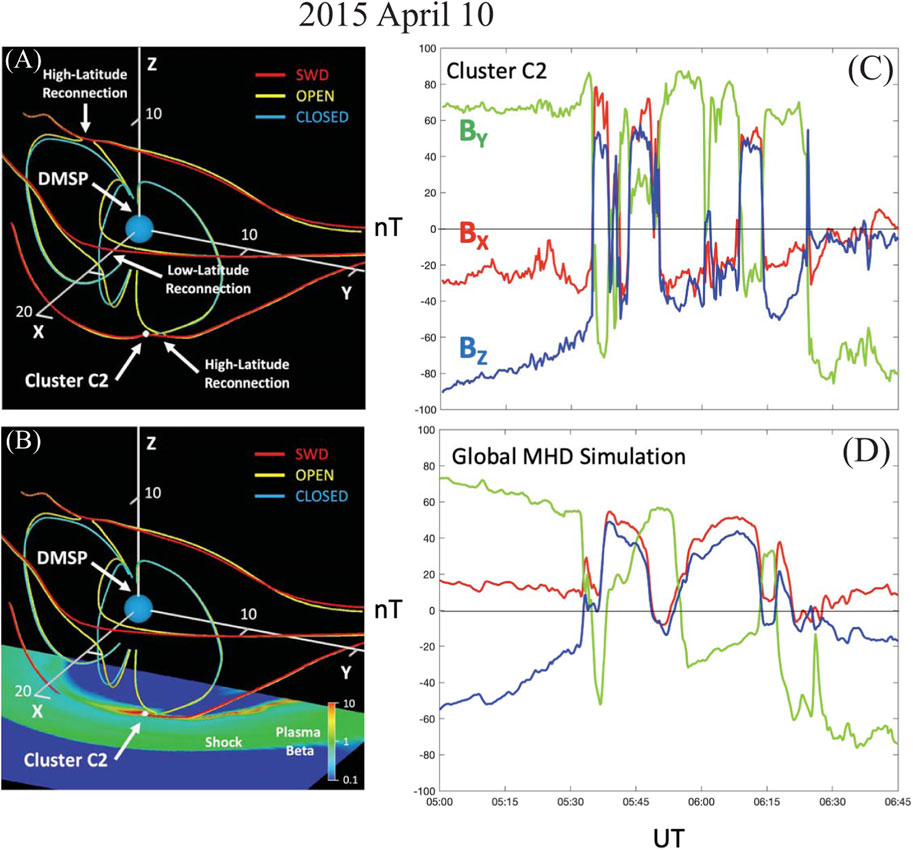
Figure 8. (A, B) show the MHD magnetic field line geometry predicted by a global MHD simulation of the 10 April 2015 RD. The small white sphere represents the location of the C2 spacecraft as the time the RD interacts with the magnetopause. Solar wind, open, and closed field lines are displayed in red, yellow, and blue, respectively. The locations of high- and low-latitude reconnections are indicated by the white arrows in (A). The locations of the DMSP and Cluster C2 spacecraft are pointed by white arrows. In (B), color contours of the plasma beta are displayed in the x-y plane at the z location of C2. (C, D) display the 3 components of the magnetic field measured by Cluster C2 and those predicted by the global MHD simulation along C2’s virtual trajectory, respectively (from Wing et al., 2023).
Panel C shows time series of the magnetic field measured by C2 around the time of the solar wind discontinuity interacts with the magnetopause while panel D shows the corresponding magnetic field in the simulation. In the first order, the simulated magnetic field agrees with the C2 observation. However, the model has difficulty reproducing the fast oscillations at the magnetopause observed by C2. The model-data comparison of fast multiple magnetopause crossings is difficult, especially when the spacecraft appears to be buffeted by reconnection outflows. Furthermore, while the 500 km simulation grid size in the region of C2 is comparable to the average thickness of the magnetopause (e.g., Berchem and Russell, 1982), the actual current layer for this event as observed by C2 is probably thinner. As a result, the simulation cannot catch boundary motions of small amplitudes. Another source of uncertainty is the solar wind observation. Although Wind is not too far from the Sun-Earth line, the ballistic propagation of the solar wind from L1 to the magnetopause can be inaccurate. Nonetheless, the general trend of the simulated magnetic field is in sufficient agreement with the C2 observation to give confidence in the reconnection topology predicted by the simulation. It is thus very plausible that the fluctuations and reversals of the electron velocity observed by C2 (Figure 7) result from C2 moving from one side of the X-line to the other.
6 Summary
Although there have been many studies on the effects of the solar wind on the auroral particle precipitation, the effects of the solar wind RD on the dayside particle precipitation have received relatively little attention. A solar wind RD can introduce complicated structures on the dayside particle precipitation (boundary layer, mantle, and cusp) even though the magnetosphere remains magnetically quiet. Moreover, field-aligned currents and magnetic field can also be perturbed by the RD. We present an example of such case where a solar wind RD interacts with the magnetosphere while the geomagnetic activity remains relatively quiet (SYM-H ∼ −30 to −40 nT and AL ∼ −20 nT) with no storm or substorm. In a broader context, this constitutes one aspect of the effects of the solar wind discontinuities in the magnetosphere-ionosphere system (c.f., Lugaz et al., 2015; Farrugia et al., 2022).
The following summarizes the satellite observations at the magnetosphere and ionosphere during the passage of the solar wind RD.
1. DMSP F18 and F17 observe boundary layer plasma before the arrival of the solar wind RD, but they observe plasma sheet plasma in the immediate aftermath of its arrival, which can be attributed to the solar wind flow rotation (dynamic pressure decrease) accompanying the RD.
2. Shortly after the arrival of the solar wind RD, DMSP F17 observes the formation of unusual boundary layer structure (UBL) and overlapping mantle ions near noon. The UBL ions have two components, hot and cold components, which are typical for boundary layer, but the cold component ions exhibit energy-latitude dispersion that is more commonly seen in the mantle ions. The overlapping mantle may result from time-varying reconnections as IMF and solar wind flow rotate in the RD.
3. The solar wind RD also perturbs the field-aligned currents.
4. Cluster C2, located at high-latitude and high-altitude in the southern hemisphere, observes velocity fluctuations and reversals with peak-to-peak amplitudes >800 km·s–1 in the magnetopause. Guided by the MHD simulation, the Cluster observation can be interpreted as a result of the spacecraft crossing reconnection outflows while moving from one side of the X-line to the other.
5. Double cusp is a class of discontinuous cusp that is a spatial feature associated with IMF By. In the RD event, DMSP F19 and F17 observe a double cusp in the northern hemisphere during an interval when the solar wind is stable and IMF By is dominant. In Wing et al. (2001) double cusp model, the lower latitude cusp particles originate from low-latitude magnetopause entry points while the high-latitude cusp particles originate from the high-latitude magnetopause entry points. The global MHD simulation of the event shows that reconnections indeed occur simultaneously at low- and high-latitudes in both hemispheres that are consistent with component and anti-parallel merging models, respectively (Figure 8A). The Cluster C2 observation at the magnetopause shows signatures of high-latitude reconnection in the southern hemisphere. (Unfortunately, there is no satellite located in the northern hemisphere magnetopause for this event.)
6. The solar wind RD and its accompanying flow rotation can introduce deviations from the Newell et al. (2004) and Newell and Meng (1992) statistical maps of the auroral particle precipitation regions. Figure 9 shows Newell and Meng (1992) statistical map of the dayside particle precipitation regions. However, observations from the individual passes of the DMSP spacecraft do not show such pattern sometimes. The solar wind RD can be responsible for some of these discrepancies.
As a final note, it is hoped that this paper will stimulate more studies and discussions of the effects of the solar wind RD or even TD on the magnetosphere. To illustrate, the following presents a few suggested topics that can be pursued in future studies, but these by no means form the exhaustive list. Other topics are certainly possible.
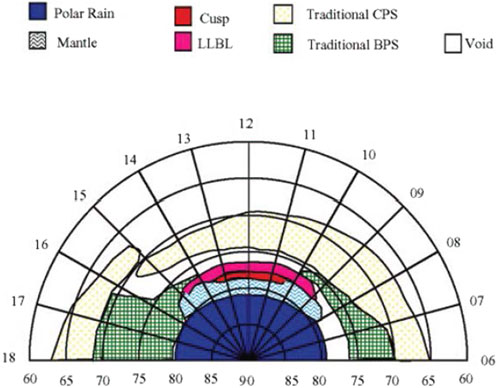
Figure 9. The statistical map of the dayside particle precipitation (adapted from Newell and Meng, 1992).
The double cusp has been modeled by Wing et al. (2001) open-field line particle precipitation model (Section 2), which is computationally inexpensive, but not self-consistent. It would be interesting to see if global models that are self-consistent can model double cusp. Particularly, global models that can take into account kinetic effects have been significantly improved in recent years, e.g., a hybrid model (Lin and Wang, 2005; Lin et al., 2017). It would be interesting to see if hybrid models can model the double cusp.
As discussed above, the solar wind RD can lead to UBL and overlapping mantle. These particle precipitation structures are not seen or identified in the well-known Newell and Meng (1992) map in Figure 9, which was developed from all solar wind conditions. Observationally, it would be interesting to see how frequently UBL and overlapping mantle are observed in solar wind RD events. Additionally, it would be worthwhile to construct a similar particle precipitation map as in Figure 9, but for solar wind RD. Numerically, it would be interesting to see if UBL and overlapping mantle can be modeled by global self-consistent models. Again, global models that can capture kinetic effects would be particularly suitable.
Open research
NASA OMNIweb (https://omniweb.gsfc.nasa.gov/) provides the 1-min resolution solar wind, SYM-H, and AL dataset were obtained from. NASA CDAweb (http://cdaweb.gsfc.nasa.gov/cdaweb/istp_public/) provides Wind data. We acknowledge the Cluster Principal Investigators and the Cluster Science archive for making the Cluster data available (https://csa.esac.esa.int; the plots are available at https://csa.esac.esa.int/csa-web/#graph). The Air Force Research Laboratory and the World Data Center provided the DMSP SSJ4/SSJ5 data. The DMSP data are available online at http://sd-www.jhuapl.edu/Aurora/spectrogram/. SuperMAG website (https://supermag.jhuapl.edu/substorms/) provides the substorm list (Newell and Gjerloev, 2011). Datasets from the global MHD simulation can be obtained online https://zenodo.org/record/7719717. NASA Satellite Situation Center (SSC) (https://sscweb.gsfc.nasa.gov/index.html) provides satellite trajectory plots.
Author contributions
SW: Conceptualization, Data curation, Formal Analysis, Funding acquisition, Investigation, Methodology, Project administration, Resources, Software, Supervision, Validation, Visualization, Writing–original draft, Writing–review and editing. JB: Data curation, Formal Analysis, Funding acquisition, Investigation, Methodology, Visualization, Writing–review and editing. CE: Data curation, Formal Analysis, Investigation, Methodology, Visualization, Writing–review and editing. CF: Data curation, Writing–review and editing
Funding
The author(s) declare that financial support was received for the research, authorship, and/or publication of this article. We acknowledge the support of NASA Grants 80NSSC20K0188, 80NSSC20K0704, 80NSSC22K0515, 80NSSC19K0843, 80NSS23K0899, 80NSSC23K0904, 80NSSC21K1321, and 80NSSC19K1293.
Conflict of interest
The authors declare that the research was conducted in the absence of any commercial or financial relationships that could be construed as a potential conflict of interest.
Publisher’s note
All claims expressed in this article are solely those of the authors and do not necessarily represent those of their affiliated organizations, or those of the publisher, the editors and the reviewers. Any product that may be evaluated in this article, or claim that may be made by its manufacturer, is not guaranteed or endorsed by the publisher.
References
Balogh, A., Dunlop, M. W., Cowley, S. W. H., Southwood, D. J., Thomlinson, J. G., Glass- meier, K. H., et al. (1997). The cluster magnetic field investigation. Space Sci. Rev. 79, 65–91. doi:10.1023/A:1004970907748
Belcher, J. W., and Davis, L. (1971). Large-amplitude Alfvén waves in the interplanetary medium, 2. J. Geophys. Res. 76 (16), 3534–3563. doi:10.1029/JA076i016p03534
Berchem, J., Fuselier, S., Petrinec, S., Frey, H., and Burch, J. (2003). Dayside proton aurora: comparisons between global MHD simulations and IMAGE observations. Space Sci. Rev. 109, 313–349. doi:10.1023/B:SPAC.0000007523.23002.92
Berchem, J., Marchaudon, A., Dunlop, M., Escoubet, C. P., Bosqued, J. M., Reme, H., et al. (2008). Reconnection at the dayside magnetopause: comparisons of global MHD simulation results with Cluster and Double Star observations. J. Geophys. Res. 113, A07S12. doi:10.1029/2007.JA012743
Berchem, J., Raeder, J., Ashour-Abdalla, M., Frank, L. A., Paterson, W. R., Ackerson, L., et al. (1998). The distant tail at 200 RE: comparison between Geotail observations and the results from a global magnetohydrodynamic simulation. J. Geophys. Res. 103, 9121–9141. doi:10.1029/97ja02926
Berchem, J., and Russell, C. T. (1982). The thickness of the magnetopause current layer: ISEE 1 and 2 observations. J. Geophys. Res. 87, 2108–2114. doi:10.1029/JA087iA04p02108
Borovsky, J. E., and Denton, M. H. (2006). Differences between CME-driven storms and CIR-driven storms. J. Geophys. Res. 111, A07S08. doi:10.1029/2005JA011447
Bouriat, S., Wing, S., and Barthélémy, M. (2023). Electron aurora and polar rain dependencies on solar wind parameters. J. Geophys. Res. Space Phys. 128, e2023JA031598. doi:10.1029/2023JA031598
Cowley, S. W. H., and Owen, C. J. (1989). A simple illustrative model of open flux tube motion over the dayside magnetopause. Planet. Space Sci. 37, 1461–1475. doi:10.1016/0032-0633(89)90116-5
Crooker, N. (1979). Dayside merging and cusp geometry. J. Geophys. Res. 84, 951–959. doi:10.1029/JA084iA03p00951
Crooker, N. U., and Cliver, E. W. (1994). Postmodern view of M-regions. J. Geophys. Res. 99 (A12), 23383–23390. doi:10.1029/94JA02093
Denton, M. H., and Borovsky, J. E. (2012). Magnetosphere response to high-speed solar wind streams: a comparison of weak and strong driving and the importance of extended periods of fast solar wind. J. Geophys. Res. 117, A00L05. doi:10.1029/2011JA017124
Escoubet, C. P., Berchem, J., Bosqued, J. M., Trattner, K. J., Taylor, M. G. G. T., Pitout, F., et al. (2008). Effect of a northward turning of the interplanetary magnetic field on cusp precipitation as observed by Cluster. J. Geophys. Res. 113, A07S13. doi:10.1029/2007JA012771
Escoubet, C. P., Schmidt, R., and Goldstein, M. L. (1997). Cluster - Science and mission overview. Space Sci. Rev. 79, 11–32. doi:10.1023/A:1004923124586
Escoubet, C. P., Smith, M. F., Fung, S. F., Anderson, P. C., Hoffman, R. A., Basinska, E. M., et al. (1992). Staircase ion signature in the polar cusp: a case study. Geophys. Res. Lett. 19, 1735–1738. doi:10.1029/92gl01806
Fairfield, D. H. (1971). Average and unusual locations of the Earth's magnetopause and bow shock. J. Geophys. Res. 76 (28), 6700–6716. doi:10.1029/JA076i028p06700
Fairfield, D. H., Wing, S., Newell, P. T., Ruohoniemi, J. M., Gosling, J. T., and Skoug, R. M. (2008). Polar rain gradients and field-aligned polar cap potentials. J. Geophys. Res. 113, A10203. doi:10.1029/2008JA013437
Farrugia, C. J., Lugaz, N., Wing, S., Wilson, L. B., Sibeck, D. J., Cowley, S. W. H., et al. (2022). Effects from dayside magnetosphere to distant tail unleashed by a bifurcated, non-reconnecting interplanetary current sheet. Front. Phys. 10. doi:10.3389/fphy.2022.942486
Gosling, J. T. (1999). On the determination of electron polytrope indices within coronal mass ejections in the solar wind. J. Geophys. Res. 104 (A9), 19851–19857. doi:10.1029/1999JA900254
Grandin, M., Aikio, A. T., and Kozlovsky, A. (2019). Properties and geoeffectiveness of solar wind high-speed streams and stream interaction regions during solar cycles 23 and 24. J. Geophys. Res. Space Phys. 124, 3871–3892. doi:10.1029/2018JA026396
Gustafsson, G., Bostrom, R., Holback, B., Holmgren, G., Lundgren, A., Stasiewicz, K., et al. (1997). The electric field and wave experiment for the cluster mission. Space Sci. Rev. 79, 137–156. doi:10.1023/A:1004975108657
Hardy, D. A., Schmitt, L. K., Gussenhoven, M. S., Marshall, F. J., Yeh, H. C., Shumaker, T. L., et al. (1984).Precipitating electron and ion detectors (SSJ/4) for the block 5D/flights 6-10 DMSP satellites: calibration and data presentation. Rep. AFGL-TR-84-0317. Hanscom Air Force Base, MA, USA: Air Force Geophys. Lab.
Hill, T. W., and Reiff, P. H. (1977). Evidence of magnetospheric cusp proton acceleration by magnetic merging at the dayside magnetopause. J. Geophys. Res. 82, 3623–3628. doi:10.1029/ja082i025p03623
Iijima, T., and Potemra, T. A. (1976). Field-aligned currents in the dayside cusp observed by Triad. J. Geophys. Res. 81 (34), 5971–5979. doi:10.1029/JA081i034p05971
Johnson, J. R., and Wing, S. (2015). The dependence of the strength and thickness of field-aligned currents on solar wind and ionospheric parameters. J. Geophys. Res. Space Phys. 120, 3987–4008. doi:10.1002/2014JA020312
Johnstone, A. D., Alsop, C., Burge, S., Carter, P. J., Coates, A. J., Coker, A. J., et al. (1997), Peace: a plasma electron and current experi-ment, The Cluster and Phoenix Missions. Springer, Dordrecht, Netherlands, doi:10.1007/978-94-011-5666-013
Kaufmann, R. L., and Konradi, A. (1969). Explorer 12 magnetopause observations: large-scale nonuniform motion. J. Geophys. Res. 74, 3609–3627. doi:10.1029/ja074i014p03609
Lin, Y., and Wang, X. (2005). Three-dimensional global hybrid simulation of dayside dynamics associated with the quasi-parallel bow shock. J. Geophys. Res. 110, A12216. doi:10.1029/2005JA011243
Lin, Y., Wing, S., Johnson, J. R., Wang, X. Y., Perez, J. D., and Cheng, L. (2017). Formation and transport of entropy structures in the magnetotail simulated with a 3-D global hybrid code. Geophys. Res. Lett. 44, 5892–5899. doi:10.1002/2017GL073957
Liu, Y. Y., Fu, H. S., Cao, J. B., Wang, Z., He, R. J., Guo, Z. Z., et al. (2022). Magnetic discontinuities in the solar wind and magnetosheath: magnetospheric multiscale mission (mms) observations. Astrophysical J. 65 (1), 63. Accessed. doi:10.3847/1538-4357/ac62d2
Lockwood, M., Denig, W., Farmer, A., Davda, V. N., Cowley, S. W. H., and Lühr, H. (1993). Ionospheric signatures of pulsed reconnection at the Earth's magnetopause. Nature 361, 424–428. doi:10.1038/361424a0
Lockwood, M., and Smith, M. F. (1989). Low-altitude signatures of the cusp and flux transfer events. Geophys. Res. Lett. 16m 879, 879–882. doi:10.1029/gl016i008p00879
Lockwood, M., and Smith, M. F. (1992). The variation of reconnection rate at the dayside magnetopause and cusp ion precipitation. J. Geophys. Res. 97 (14), 14841–14847. doi:10.1029/92ja01261
Lugaz, N., Farrugia, C. J., Huang, C.-L., and Spence, H. E. (2015). Extreme geomagnetic disturbances due to shocks within CMEs. Geophys. Res. Lett. 42, 4694–4701. doi:10.1002/2015GL064530
Lyons, L. R., Schulz, M., Pridmore-Brown, D. C., and Roeder, J. L. (1994). Low-latitude boundary layer near noon: an open field line model. J. Geophys. Res. 99 (A9), 17367–17377. doi:10.1029/94JA00867
Merka, J., Safrankova, J., and Nemecek, Z. (2002). Cusp-like plasma in high altitudes: a statistical study of the width and location of the cusp from Magion-4. Ann. Geophys. 20, 311–320. doi:10.5194/angeo-20-311-2002
Němeček, Z., Šafránková, J., Kruparova, O., Přech, L., Jelínek, K., Dušík, Š., et al. (2015). Analysis of temperature versus density plots and their relation to the LLBL formation under southward and northward IMF orientations. J. Geophys. Res. Space Phys. 120, 3475–3488. doi:10.1002/2014JA020308
Newell, P. T., and Gjerloev, J. W. (2011). Substorm and magnetosphere characteristic scales inferred from the SuperMAG auroral electrojet indices. J. Geophys. Res. 116, A12232. doi:10.1029/2011JA016936
Newell, P. T., Burke, W. J., Meng, C.-I., Sanchez, E. R., and Greenspan, M. E. (1991a). Identification and observations of the plasma mantle at low altitude. J. Geophys. Res. 96, 35–45. doi:10.1029/90JA01760
Newell, P. T., Burke, W. J., Sanchez, E. R., Meng, C.-I., Greenspan, M. E., and Clauer, C. R. (1991c). The low-latitude boundary layer and the boundary plasma sheet at low altitude: prenoon precipitation regions and convection reversal boundaries. J. Geophys. Res. 96 (21), 21013–21023. doi:10.1029/91JA01818
Newell, P. T., Liou, K., and Wilson, G. R. (2009). Polar cap particle precipitation and aurora: review and commentary. J. Atmos. Solar-Terrestrial Phys., 71 (2), 199–215. Accessed https://www.sciencedirect.com/science/article/pii/S1364682608003738:doi:10.1016/j.jastp.2008.11.004
Newell, P. T., and Meng, C.-I. (1992). Mapping the dayside ionosphere tothe magnetosphere according to particle precipitation characteristics. Geophys. Res. Lett. 19, 609–612. doi:10.1029/92gl00404
Newell, P. T., Ruohoniemi, J. M., and Meng, C.-I. (2004). Maps of precipitation by source region, binned by IMF, with inertial convection streamlines. J. Geophys. Res. 109, A10206. doi:10.1029/2004JA010499
Newell, P. T., Wing, S., Meng, C. I., and Sigillito, V. (1991b). The auroral oval position, structure and intensity of precipitation from 1984 onwards: an automated on-line data base. J. Geophys. Res. 96, 5877–5882. doi:10.1029/90JA02450
Phan, T., Frey, H. U., Frey, S., Peticolas, L., Fuselier, S., and Carlson, C. (2003). Simultaneous cluster and image observations of cusp reconnection and auroral proton spot for northward IMF. Geophysical Research Letters 30 (10), 1509. doi:10.1029/2003GL016885
Pitout, F., and Bogdanova, Y. V. (2021). The polar cusp seen by Cluster. J. Geophys. Res. Space Phys. 126, e2021JA029582. doi:10.1029/2021JA029582
Pitout, F., Newell, P., and Buchert, S. (2002). Simultaneous high- and low-latitude reconnection: ESR and DMSP observations. Ann. Geophys. 20, 1311–1320. doi:10.5194/angeo-20-1311-2002
Rich, F. J., Hardy, D. A., and Gussenhoven, M. S. (1985). Enhanced ionosphere-magnetosphere data from the DMSP satellites. Eos 66, 513–514. doi:10.1029/eo066i026p00513
Richardson, I. G. (2018). Solar wind stream interaction regions throughout the heliosphere. Living Rev. Sol. Phys. 15, 1. doi:10.1007/s41116-017-0011-z
Roelof, E. C., and Sibeck, D. G. (1993). Magnetopause shape as a bivariate function of interplanetary magnetic field Bz and solar wind dynamic pressure. J. Geophys. Res. 98 (A12), 21421–21450. doi:10.1029/93JA02362
Ruohoniemi, J. M., and Greenwald, R. A. (1996), Statistical patterns of high-latitude convection obtained from Goose Bay HF radar observations, J. Geophys. Res., 101, 21,21743-21763, doi:10.1029/96ja01584
Shen, H.-W., Shue, J.-H., Dombeck, J., and Han, D.-S. (2022). Influences of IMF by polarity on dayside electron precipitation in terms of energy channels. J. Geophys. Res. Space Phys. 127, e2021JA030082. doi:10.1029/2021JA030082
Shi, Q., Zong, Q. G., Fu, S., Dunlop, M., Pu, Z., Parks, G., et al. (2013). Solar wind entry into the high-latitude terrestrial magnetosphere during geomagnetically quiet times. Nat. Commun. 4, 1466. doi:10.1038/ncomms2476
Shi, Q. Q., Zong, Q., Zhang, H., Pu, Z. Y., Fu, S. Y., Xie, L., et al. (2009). Cluster observations of the entry layer equatorward of the cusp under northward interplanetary magnetic field. J. Geophys. Res. 114, A12219. doi:10.1029/2009JA014475
Shue, J.-H., Chao, J. K., Fu, H. C., Russell, C. T., Song, P., Khurana, K. K., et al. (1997). A new functional form to study the solar wind control of the magnetopause size and shape. J. Geophys. Res. 102, 9497–9511. doi:10.1029/97ja00196
Smith, M., Lockwood, M., and Cowley, S. (1992). The statistical cusp: a flux transfer event model. Planet. Space Sci. 40 (9), 1251–1268. Accessed. doi:10.1016/0032-0633(92)90082-Y
Spreiter, J. R., and Stahara, S. S. (1985). “Magnetohydrodynamic and gasdynamic theories for planetary bow waves,” in Collisionless shocks in the heliosphere: reviews of current research, geophys. Monogr. Ser. Editors B. T. Tsurutani, and R. G. Stone (Washington, DC, USA: AGU), 35, 85–107.
Su, Y.-J., Ergun, R. E., Peterson, W. K., Onsager, T. G., Pfaff, R., Carlson, C. W., et al. (2001). FAST auroral snapshot observations of cusp electron and ion structures. J. Geophys. Res. 106 (25), 25595–25600. doi:10.1029/2001ja000093
Trattner, K. J., Fuselier, S. A., Peterson, W. K., Boehm, M., Klumpar, D., Carlson, C. W., et al. (2002a). Temporal versus spatial interpretation of cusp ion structures observed by two spacecraft. J. Geophys. Res. 107 (A10), 1287. doi:10.1029/2001JA000181
Trattner, K. J., Fuselier, S. A., Peterson, W. K., and Carlson, C. W. (2002b). Spatial features observed in the cusp under steady solar wind conditions. J. Geophys. Res. 107 (A0). doi:10.1029/2001JA000262
Trattner, K. J., FuselierPeterson, S. A. W. K., Sauvaud, J.-A., Stenuit, H., Dubouloz, N., et al. (1999). On spatial and temporal structures in the cusp. J. Geophys. Res. 104, 28411–28421. doi:10.1029/1999ja900419
Trattner, K. J., Onsager, T. G., Petrinec, S. M., and Fuselier, S. A. (2015). Distinguishing between pulsed and continuous reconnection at the dayside magnetopause. J. Geophys. Res. Space Phys. 120, 1684–1696. doi:10.1002/2014JA020713
Tsurutani, B. T., Gonzalez, W. D., Gonzalez, A. L. C., Tang, F., Arballo, J. K., and Okada, M. (1995). Interplanetary origin of geomagnetic activity in the declining phase of the solar cycle. J. Geophys. Res. 100 (A11), 21717–21733. doi:10.1029/95JA01476
Tsurutani, B. T., Gonzalez, W. D., Tang, F., and Lee, Y. T. (1992). Great magnetic storms. Geophys. Res. Lea. 19, 73–76. doi:10.1029/91GL02783
Tsurutani, B. T., Ho, C. M., Smith, E. J., Neugebauer, M., Goldstein, B. E., Mok, J. S., et al. (1994). The relationship between interplanetary discontinuities and Alfvén waves: ulysses observations. Geophys. Res. Lett. 21, 2267–2270. doi:10.1029/94GL02194
Tsyganenko, N. A., and Stern, D. P. (1996). Modeling the global magnetic field of the large-scale Birkeland current systems. J. Geophys. Res. 101 (27), 27187–27198. doi:10.1029/96ja02735
Wilken, B., Goertz, C. K., Baker, D. N., Higbie, P. R., and Fritz, T. A. (1982). The SSC on July 29, 1977, and its propagation within the magnetosphere. J. Geophys. Res. 87, 5901–5910. doi:10.1029/ja087ia08p05901
Wing, S., Berchem, J., Escoubet, C. P., Farrugia, C., and Lugaz, N. (2023). Multispacecraft observations of the simultaneous occurrence of magnetic reconnection at high and low latitudes during the passage of a solar wind rotational discontinuity embedded in the April 9-11, 2015 ICME. Geophys. Res. Lett. 50, e2023GL103194. doi:10.1029/2023GL103194
Wing, S., and Johnson, J. R. (2015). Theory and observations of upward field-aligned currents at the magnetopause boundary layer. Geophys. Res. Lett. 42, 9149–9155. doi:10.1002/2015GL065464
Wing, S., Johnson, J. R., Newell, P. T., and Meng, C.-I. (2005a). Dawn-dusk asymmetries, ion spectra, and sources in the northward interplanetary magnetic field plasma sheet. J. Geophys. Res. 110, A08205. doi:10.1029/2005JA011086
Wing, S., and Newell, P. T. (1998). Central plasma sheet ion properties as inferred from ionospheric observations. J. Geophys. Res. 103 (A4), 6785–6800. doi:10.1029/97JA02994
Wing, S., and Newell, P. T. (2002). 2D plasma sheet ion density and temperature profiles for northward and southward IMF. Geophys. Res. Lett. 29 (9). doi:10.1029/2001GL013950
Wing, S., Newell, P. T., and Meng, C. I. (2005b). “Cusp modeling and observations at low altitude,” in The magnetospheric cusps: structure and dynamics. Editors T. A. Fritz, and S. F. Fung (Dordrecht, he Netherlands: Springer). doi:10.1007/1-4020-3605-1_14
Wing, S., Newell, P. T., and Onsager, T. G. (1996). Modeling the entry of magnetosheath electrons into the dayside ionosphere. J. Geophys. Res. 101 (A6), 13155–13167. doi:10.1029/96JA00395
Wing, S., Newell, P. T., and Ruohoniemi, J. M. (2001). Double cusp: model prediction and observational verification. J. Geophys. Res. 106 (A11), 25571–25593. doi:10.1029/2000JA000402
Wing, S., Newell, P. T., Sibeck, D. G., and Baker, K. B. (1995). A large statistical study of the entry of interplanetary magnetic field Y-component into the magnetosphere. Geophys. Res. Lett. 22, 2083–2086. doi:10.1029/95GL02261
Wing, S., Ohtani, S., Johnson, J. R., Echim, M., Newell, P. T., Higuchi, T., et al. (2011). Solar wind driving of dayside field-aligned currents. J. Geophys. Res. 116, A08208. doi:10.1029/2011JA016579
Wing, S., Ohtani, S., Newell, P. T., Higuchi, T., Ueno, G., and Weygand, J. M. (2010). Dayside field-aligned current source regions. J. Geophys. Res. 115, A12215. doi:10.1029/2010JA015837
Keywords: solar wind rotational discontinuity, double cusp, magnetopause, velocity fluctuations, particle precipitation, magnetic reconnection, unusual boundary layer, overlapping mantle
Citation: Wing S, Berchem J, Escoubet CP and Farrugia C (2024) Complex dayside particle precipitation observed during the passage of a solar wind rotational discontinuity. Front. Astron. Space Sci. 11:1320809. doi: 10.3389/fspas.2024.1320809
Received: 13 October 2023; Accepted: 20 February 2024;
Published: 12 April 2024.
Edited by:
Yiqun Yu, Beihang University, ChinaReviewed by:
Georgios Balasis, National Observatory of Athens, GreeceHan-Wen Shen, The University of Iowa, United States
Copyright © 2024 Wing, Berchem, Escoubet and Farrugia. This is an open-access article distributed under the terms of the Creative Commons Attribution License (CC BY). The use, distribution or reproduction in other forums is permitted, provided the original author(s) and the copyright owner(s) are credited and that the original publication in this journal is cited, in accordance with accepted academic practice. No use, distribution or reproduction is permitted which does not comply with these terms.
*Correspondence: Simon Wing, c2ltb24ud2luZ0BqaHVhcGwuZWR1
†ORCID: Simon Wing, orcid.org/0000-0001-9342-1813; Jean Berchem, orcid.org/0000-0003-3304-415X