 F. Civano1*
 X. Zhao2
 P. G. Boorman3
 S. Marchesi4,5T. Ananna6S. Creech7,8C.-T. Chen9,10R. C. Hickox11D. Stern12
 K. Madsen1J. A. García1R. Silver1,13J. Aird14D. M. Alexander15M. Baloković16,17
 W. N. Brandt18,19,20
 J. Buchner21P. Gandhi22E. Kammoun23,24S. LaMassa25
 G. Lanzuisi4
 A. Merloni21
 A. Moretti26K. Nandra21E. Nardini23A. Pizzetti5
 S. Puccetti27R. W. Pfeifle1,13C. Ricci28,29
 D. Spiga30N. Torres-Albà5on behalf of the HEX-P Collaboration
- 1NASA Goddard Space Flight Center, Greenbelt, MD, United States
- 2Harvard-Smithsonian Center for Astrophysics, Cambridge, MA, United States
- 3Cahill Center for Astrophysics, California Institute of Technology, Pasadena, CA, United States
- 4INAF—Osservatorio di Astrofisica e Scienza dello Spazio di Bologna, Bologna, Italy
- 5Department of Physics and Astronomy, Kinard Lab of Physics, Clemson University, Clemson, SC, United States
- 6Department of Physics and Astronomy, Wayne State University, Detroit, MI, United States
- 7Department of Physics and Astronomy, University of Utah, Salt Lake City, UT, United States
- 8Astrophysics Science Division, SURA/GSFC/CRESST II, Greenbelt, MD, United States
- 9Science and Technology Institute, Universities Space Research Association, Huntsville, AL, United States
- 10Astrophysics Office, NASA Marshall Space Flight Center, Huntsville, AL, United States
- 11Department of Physics and Astronomy, Dartmouth College, Hanover, NH, United States
- 12Jet Propulsion Laboratory, California Institute of Technology, Pasadena, CA, United States
- 13NASA NPP Program, Oak Ridge Associated Universities, Oak Ridge, TN, United States
- 14Institute for Astronomy, Royal Observatory, University of Edinburgh, Edinburgh, United Kingdom
- 15Department of Physics, Centre for Extragalactic Astronomy, Durham University, Durham, United Kingdom
- 16Yale Center for Astronomy and Astrophysics, New Haven, CT, United States
- 17Department of Physics, Yale University, New Haven, CT, United States
- 18Department of Astronomy & Astrophysics, The Pennsylvania State University, University Park, PA, United States
- 19Institute for Gravitation and the Cosmos, The Pennsylvania State University, University Park, PA, United States
- 20Department of Physics, The Pennsylvania State University, University Park, PA, United States
- 21Max-Planck-Institut für Extraterrestrische Physik, Garching, Germany
- 22Department of Physics and Astronomy, Faculty of Physical Sciences and Engineering, University of Southampton, Southampton, United Kingdom
- 23INAF–Osservatorio Astrofisico di Arcetri, Florence, Italy
- 24Dipartimento di Matematica e Fisica, Università Roma Tre, Rome, Italy
- 25Space Telescope Science Institute, Baltimore, MD, United States
- 26INAF, Osservatorio Astronomico di Brera, Milano, Italy
- 27ASI—Agenzia Spaziale Italiana, Rome, Italy
- 28Núcleo de Astronom ía de la Facultad de Ingeniería, Universidad Diego Portales, Santiago, Chile
- 29Kavli Institute for Astronomy and Astrophysics, Peking University, Beijing, China
- 30INAF, Osservatorio Astronomico di Brera, Merate, Italy
Since the discovery of the cosmic X-ray background (CXB), astronomers have strived to understand the accreting supermassive black holes (SMBHs) contributing to its peak in the 10–40 keV band. Existing soft X-ray telescopes could study this population up to only 10 keV, and, while NuSTAR (focusing on 3–24 keV) made great progress, it also left significant uncertainties in characterizing the hard X-ray population, crucial for calibrating current population synthesis models. This paper presents an in-depth analysis of simulations of two extragalactic surveys (deep and wide) with the High-Energy X-ray Probe (HEX-P), each observed for 2 Ms. Applying established source detection techniques, we show that HEX-P surveys will reach a flux of
1 Introduction
The cosmic X-ray background (CXB), i.e., the diffuse emission from 0.1 to 100 keV discovered in the early 1960s by Giacconi et al. (1962), has been a focal point at the center of X-ray astronomy research since then. As most of the emission between 10 and 100 keV is expected to come from accretion of matter onto supermassive black holes (SMBHs; see Ueda et al., 1999; Gandhi and Fabian, 2003; Gilli et al., 2007; Comastri et al., 2015; Ananna et al., 2019), the CXB provides a crucial verification for current models of SMBH growth across cosmic time. The growth of these SMBHs, which are known as active galactic nuclei (AGN) during phases of accretion, is intricately linked to the evolution of galaxies and their episodes of star formation (see Harrison, 2017). Consequently, studying the population contributing to the CXB offers invaluable insights into the co-evolution of SMBHs and galaxies.
We now understand that the CXB represents the total integrated emission of faint X-ray sources across the sky. Thanks to the extragalactic surveys (e.g., Civano et al., 2016; Luo et al., 2017; Chen et al., 2018) performed over the past ∼25 years, particularly with the use of focusing soft X-ray telescopes like Chandra and XMM-Newton, we have been able to resolve and study the accreting SMBHs that contribute to approximately ∼80%–85% of the CXB at energies below 10 keV (e.g., Moretti et al., 2003, Moretti et al., 2012; Worsley et al., 2005; Hickox and Markevitch, 2006; Xue et al., 2012; Cappelluti et al., 2017). The large samples of AGN in these soft band surveys have allowed us to constrain various properties including, e.g., the evolution of the X-ray luminosity functions of AGN out to z ∼ 5 (Vito et al., 2014; Aird et al., 2015b; Buchner et al., 2015) and the evolution of the unobscured (NH < 1022 cm−2) and obscured (NH > 1022 cm−2) fraction to comparable redshifts (e.g., Marchesi et al., 2016b; Vito et al., 2018; Peca et al., 2023).
Compton-thick AGN (CT; NH > 1024 cm−2) are a crucial piece of the CXB that still remains unresolved. Soft X-ray surveys have faced challenges to detect CT AGN as the low–energy photons (
The launch of NuSTAR (Harrison et al., 2013) and the extragalactic surveys that were performed in the hard X-rays (3–24 keV) have provided a breakthrough, enabling us to observe the high-energy X-ray universe where obscuration is less of an issue, and CT sources can be more easily detected. NuSTAR adopted the classic “wedding cake” survey strategy by observing the most notable extragalactic fields (COSMOS, ECDFS, EGS, CDFN and UDS; Civano et al., 2015; Mullaney et al., 2015; Masini et al., 2018a), and a survey of all the serendipitous sources in NuSTAR observations (Alexander et al., 2013; Lansbury et al., 2017a). Moreover, NuSTAR is currently observing the deepest survey ever performed in the 3–24 keV range in the North Ecliptic Pole, a JWST Time Domain Field, reaching fluxes of 3.7 × 10⁻¹⁴ erg s−1 cm−2 (over 50% of the area) in the 8–24 keV band (Zhao et al., 2021, Zhao et al., 2024). These NuSTAR surveys have probed the demographics of hard X-ray emitting AGN up to z ∼ 3, providing the most precise measurements of the hard X-ray flux distribution (log N − log S) and luminosity function (Aird et al., 2015a; Harrison et al., 2016; Zhao et al., 2024) and directly resolving 35% of the CXB in the 8–24 keV range with detected sources (Harrison et al., 2016; Hickox, 2024). Interestingly, NuSTAR surveys have uncovered a local CT AGN that was previously misidentified by the soft X-ray surveys alone in the same field (Civano et al., 2015), and that luminous obscured AGN selected at other wavelengths (e.g., WISE) remain extremely weak or undetected in deep NuSTAR exposures, implying NH > 1025 cm−2 (Stern et al., 2014; Yan et al., 2019; Carroll et al., 2023). Spectral analysis of the 63 brightest hard X-ray sources in NuSTAR surveys (Zappacosta et al., 2018) has shown that broadband data covering the 0.5–24 keV band (Chandra or XMM-Newton combined with NuSTAR) are essential for constraining the spectral parameters such as photon index, column density, reflection and luminosity. Similarly, Marchesi et al. (2017, 2018, 2019) have shown that the combination of non-simultaneous soft X-ray data with Swift-BAT can lead to an overestimation of the line-of-sight column density which results in an overestimate of the CT-AGN fraction. While NuSTAR has made substantial progress in measuring the spectral properties of CT AGN in the local Universe, there are still significant inconsistencies between the observed and predicted CT fraction (see Boorman et al., 2023, and references therein). At higher redshift, the CT fraction remains unconstrained, with an upper limit of 66% at 90% confidence level (Zappacosta et al., 2018). Similarly, results solely from hardness ratio analysis have led to very large uncertainties on the CT fraction at z > 0.1 (Civano et al., 2015; Masini et al., 2018a; Zhao et al., 2021, Zhao et al., 2024).
Population synthesis models (e.g., Comastri et al., 1995; Ballantyne et al., 2006; Gilli et al., 2007; Treister et al., 2009; Ueda et al., 2014; Ananna et al., 2019) combine AGN spectral shapes and AGN space densities in luminosity, obscuration, and redshift bins to reproduce the intensity and shape of the CXB. The space densities are constrained using the results from existing X-ray surveys described above. The completeness and robustness of such results are limited by the energy band probed (most of the sources are only detected by Chandra and XMM-Newton below 10 keV) and by the survey’s flux limits. AGN samples from higher energy surveys such as NuSTAR are quite scarce, and most of the hard X-ray constraints are from Swift-BAT, therefore limited to bright, low redshift sources (Ricci et al., 2017; Oh et al., 2018). The typical AGN spectrum is another piece of the puzzle when calibrating population synthesis models: without high-energy X-ray data, constraining spectral parameters such as the reflection scaling factor (relevant at 20–40 keV) and the high-energy cutoff (relevant at E > 60 keV) remains challenging (Ricci et al., 2017; Ananna et al., 2020; Kammoun et al., 2023). As the dominant AGN contribution to the CXB is expected to be in the 10–100 keV energy band, poorly constrained spectral parameters can hinder the accuracy of population synthesis models. To justify the low resolved fraction of the CXB at high energy, the latest models have either changed assumptions on AGN spectral shapes (e.g., Akylas et al., 2012) or predicted that a large fraction of the sources contributing to the CXB must be extremely obscured or CT, and that the fraction should reach ∼50% at faint fluxes (
Resolving the population contributing to the CXB in the 10–40 keV band, determining their spectral properties and constraining the CT fraction at faint fluxes with the goal of providing strong constraints on population synthesis models are the major goals of the High-Energy X-ray Probe (HEX-P; Madsen et al., 2023). In this paper, we present the results obtained from accurate simulations (carried out using the observatory performance based on current best estimates as of Spring 2023) of a deep narrow (∼0.16 deg2) and a shallow wide (∼1.1 deg2) extragalactic survey, employing 2 Ms of exposure time each. We assume such surveys will be performed in well-known extragalactic fields, providing rich datasets (e.g., including data from Rubin, JWST, Roman) for a multiwavelength characterization of HEX-P detections.
The paper is structured as follows: Section 2 describes the telescope’s characteristics; Section 3 explains the details of the survey simulations; Section 4 presents the source properties; Section 5 discusses the findings regarding the CXB resolved fraction; Section 6 presents the results related to obscured sources detected in the surveys, spectral analysis, and the CT fraction; and Section 7 includes a concise summary.
2 The high energy X-ray probe
HEX-P is a probe-class mission concept that offers sensitive broad-band coverage (0.2–80 keV) of the X-ray spectrum with exceptional spectral, timing and angular capabilities. It features two high-energy telescopes (hereafter HET; 2–80 keV) that focus hard X-rays, and a low-energy telescope (hereafter LET; 0.2–25 keV) that has soft X-ray coverage.
The LET consists of a segmented mirror assembly coated with Ir on monocrystalline silicon that achieves a half-power diameter of 3.5″, and a low-energy DEPFET detector of the same type as the Wide Field Imager (WFI; Meidinger et al., 2020) onboard Athena (Nandra et al., 2013). It has 512 × 512 pixels that cover a field of view of 11.3′ × 11.3′. It has an effective passband of 0.2–25 keV, and a full frame readout time of 2 ms, which can be operated in a 128 and 64-channel window mode for higher count-rates to mitigate pile-up and faster readout. Pile-up effects remain below an acceptable limit of
The HET consists of two co-aligned telescopes and detector modules. The optics are made of Ni-electroformed full shell mirror substrates, leveraging the heritage of XMM-Newton (Jansen et al., 2001), and coated with Pt/C and W/Si multilayers for an effective passband of 2–80 keV. The high-energy detectors are of the same type as flown on NuSTAR (Harrison et al., 2013), and they consist of 16 CZT sensors per focal plane, tiled 4 × 4, for a total of 128 × 128 pixels spanning a field of view of 13.4′×13.4′, slightly larger than that of the LET.
The broad X-ray passband of HEX-P and superior sensitivity to NuSTAR will provide a unique opportunity to probe the evolution of AGN in extragalactic surveys over a wide range of obscuration regimes that is not possible with soft X-ray instruments alone. The spectral constraints provided by simultaneous coverage of the soft and hard X-ray bands will remove any issues associated with variability and provide spectral constraints for new sources detected above 10 keV. By resolving a high fraction of the CXB in hard X-rays, HEX-P will ultimately enable far more sensitive population synthesis of SMBH growth in the context of the evolution of their host galaxies as probed by a plethora of multiwavelength observations.
3 HEX-P survey simulations
The approach we used to perform end-to-end simulations of surveys with HEX-P is essentially identical to the one adopted in Marchesi et al. (2020), to which we refer the reader for a detailed explanation while providing an overview here. The analysis of our simulated data was developed based on NuSTAR extragalactic surveys (Civano et al., 2015; Mullaney et al., 2015; Masini et al., 2018a; Zhao et al., 2021). Here, we briefly present the tool we used to perform the simulations, as well as the input mock catalogs of AGN and non-active galaxies and the analysis of such simulated data.
3.1 The SIXTE simulation tool
The HEX-P surveys presented in this paper have been simulated using the Monte Carlo code Simulation of X-ray Telescopes (hereafter SIXTE, Dauser et al., 2019). This software enables the simulation of observations using an X-ray telescope in the following manner. Initially, the tool creates a photon list, which includes the arrival time, energy and position of each photon. To generate this initial information, SIXTE reads the instrument configuration from an xml file. This first step uses the instrument’s effective area, the field of view and pointing. The photon list created in the first step is then convolved with the instrument PSF and vignetting. In doing so, SIXTE generates an impact list that contains the energy and arrival time of each photon, as well as its position on the detector. The final event file is obtained from this intermediate list and reprocessed to take into account the simulated detector read-out properties and redistribution matrix file.
The HEX-P simulations presented in this work were produced with a set of response files that represent the observatory performance based on current best estimates as of Spring 2023 (v07; see Madsen et al., 2023). The effective area is derived from ray-tracing the mirror design, including obscuration by all known structures. The detector responses are based on simulations performed by the hardware groups, with an optical blocking filter for the LET and a Be window and thermal insulation for the HET. The LET background was derived from a GEANT4 simulation (Eraerds et al., 2021) of the WFI instrument. The HET background was derived from a GEANT4 simulation of the NuSTAR instrument. Both simulations adopt the planned L1 orbit for HEX-P. The SIXTE team has included the above HEX-P configuration files (i.e., telescope setup, response matrices, vignetting, point spread function) for both the HET and LET in their system, ready to be used.
3.2 Active galactic nuclei mock catalog
In order to perform the steps above and to produce a realistic representation of the X-ray sky, SIXTE needs an input source list generated in the SIMPUT data format. In this paper, we use the mock catalogs of AGN and non-active galaxies presented in Marchesi et al. (2020). The catalogs we used are available online in FITS format and ready to be used within SIXTE.
The mocks have been calibrated to reproduce known trends between AGN number densities and luminosity, redshift and column density. In detail, each AGN in the catalog has intrinsic 0.5–2 keV luminosities, redshift and column density, computed by resampling the X-ray luminosity function of unabsorbed AGN given by Hasinger et al. (2005), scaled up by a luminosity–dependent factor to account for the whole AGN population (see Gilli et al., 2007). No assumption is made on AGN or host clustering. AGN have been simulated down to a 0.5–2 keV luminosity L0.5−2 = 1040 erg s−1 and up to z = 10. The mock AGN number counts match the observed ones over the whole range of fluxes sampled by current X-ray surveys. The mock AGN sample average CT fraction is fCT = 39%. As a reference, this is a similar figure to that found in the current AGN population synthesis models: Ueda et al. (2014, fCT = 33%), Buchner et al. (2015, fCT = 38%), and Ananna et al. (2019, fCT = 50%). These are all average values; however, all models adopt a luminosity-dependent CT fraction, consistent with what is observed in X-ray surveys of AGN (see, e.g., Ricci et al., 2015; Marchesi et al., 2016a).
Finally, while the Gilli et al. (2007) model is generally in close agreement with the observational results from X-ray surveys, in the high-redshift regime (i.e., at z > 3, where the AGN space density starts declining) the discrepancy becomes more prominent, with the model underestimating the expected number of sources with respect to the observational evidence. For this reason, Marchesi et al. (2020) developed a separate z > 3 catalog using as a reference the Vito et al. (2014) z > 3 AGN luminosity function, which describes the observational evidence from the deepest X-ray surveys currently available (e.g., Vito et al., 2018).
In the simulations of HEX-P surveys presented in this work, we also include the non-active galaxies mock catalogs presented in Marchesi et al. (2020) and derived from the peakM and peakG model log N − log S by Ranalli et al. (2005). The galaxies in the mock have X-ray flux information but lack redshifts and luminosity, so we do not include them in our source detection analysis. The presence of the galaxies in the simulation, however, ensures that the overall simulated emission closely matches the CXB intensity.
3.3 HEX-P surveys layout and tiling strategy
We simulated two HEX-P fields, a Deep and a Wide survey. Each survey has been simulated both with the LET camera and with the two HET cameras. The two HET cameras are then co-added for the analysis. The total exposure for each survey is 2 Ms. Since the LET field of view
The HEX-P Deep Field is obtained by combining four 500 ks observations. The survey tiling is a 2 × 2 grid where the pointing centers are offset by 11.3′ (i.e., a whole LET field of view) in right ascension or declination. Because the LET is smaller in size than the HET, the HET pointings are slightly overlapping by about 2′. The overall HET survey area is Adeep = 0.1668 deg2, while the overall LET survey area is 0.1469 deg2 (see blue dashed curves in Figures 1, 3). The HEX-P Wide Field survey consists of 81 overlapping pointings, each having nominal exposures of 25 ks, in a 9 × 9 grid. The survey tiling is done using the half-a-field shift strategy, which was successfully used in the NuSTAR COSMOS survey (Civano et al., 2015): the center of each pointing is offset by 6.7′ (i.e., half a HET field of view) in right ascension or declination with respect to the previous one. The overall survey exposure per detector is therefore 25 ks × 81 pointings = 2.025 Ms. The overall HET survey area is Awide = 1.083 deg × 1.083 deg = 1.174 deg2, while the overall LET area is 1.12 deg2 (see salmon curves in Figures 1, 3).
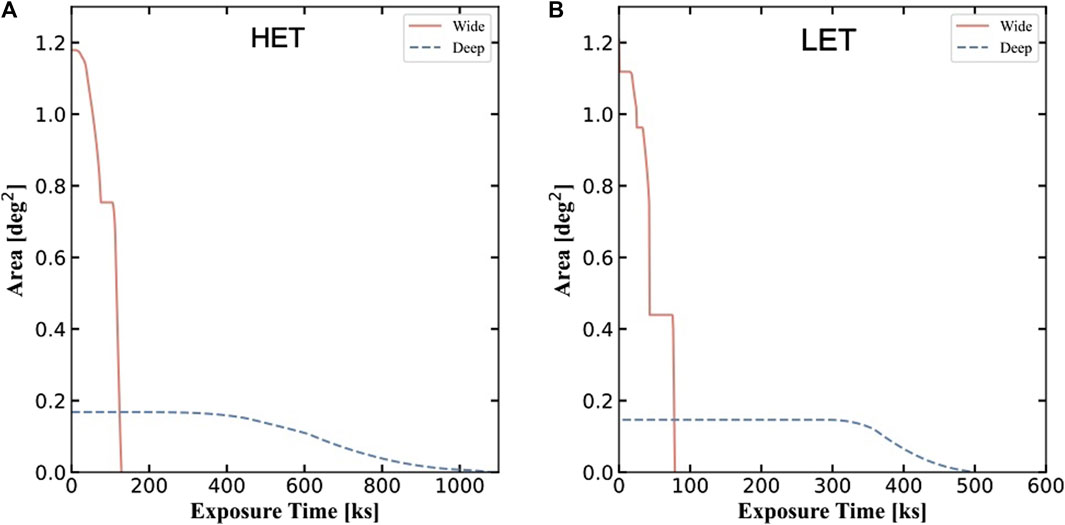
FIGURE 1. Survey area as a function of the effective, i.e., vignetting-corrected, exposure time for the HET (A) in the 3–24 keV band and LET (B) in the 0.5–2 keV band. The deep and wide surveys are in blue and salmon, respectively.
The area versus exposure for the deep (blue) and wide (salmon) surveys are shown in Figure 1 for the HET (left) and the LET (right). A zoomed in section of the wide survey mosaics for the LET (0.5–2 keV), HET (2 telescopes summed, 3–24 keV) and NuSTAR (2 telescopes summed, 3–24 keV) is shown in Figure 2. The areas at lower exposure due to the overlapping of the tiles in the LET is visible but does not really affect the source detection (see Section 3.4). While hundreds of sources are visible by eye in the HET and LET images, only one source is clearly visible in a NuSTAR simulation of the same field that was done using the same exposure and tiling strategy (25 ks × 81 pointings = 2.025 Ms).
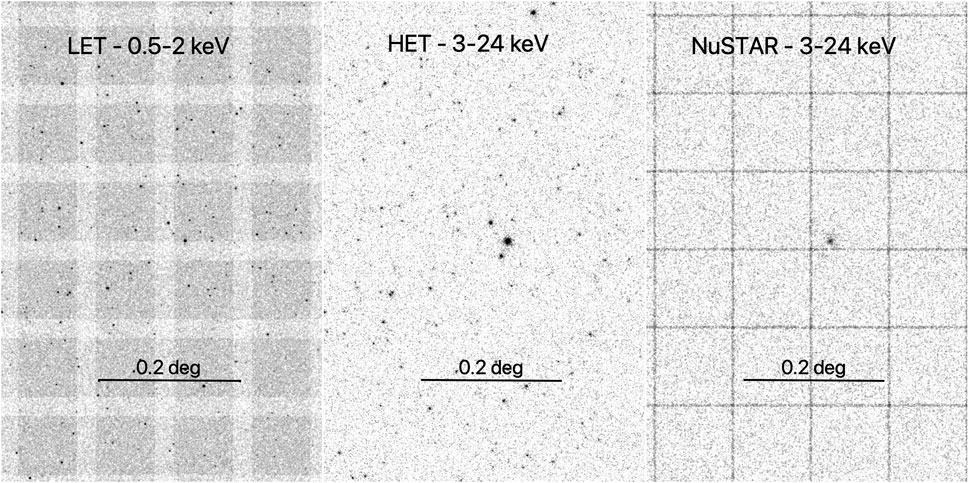
FIGURE 2. A zoomed in section of the wide survey mosaics for the LET (0.5–2 keV), HET (2 telescopes summed, 3–24 keV) and NuSTAR (2 telescopes summed, 3–24 keV; this simulation was performed with SIXTE). Hundreds of sources are visible in the HET and LET mosaics.
3.4 Source detection
We performed source detection on the simulated data in five energy bands for the HET (3–8, 8–24, 3–24, 10–40 and 35–55 keV) and two bands for the LET (0.5–2 and 2–10 keV) following the procedure used in previous NuSTAR surveys (Civano et al., 2015; Mullaney et al., 2015; Masini et al., 2018a; Zhao et al., 2021). All the parameters used at each step (smoothing and matching radius, probability and significance thresholds, etc) were chosen to maximize the detection rate, the completeness and the reliability in the simulated HEX-P surveys. We summarize the process in the following.
First, we used Source-Extractor (Bertin and Arnouts, 1996) on the false-probability maps of the two surveys, which measures the probability (Pfalse) that a signal is due to a background fluctuation rather than a real source. The false-probability maps were generated from the smoothed simulated maps (with a 7.5″ and 3″ smoothing radius for the HET and LET, respectively) and the background mosaics at each pixel using the incomplete Gamma function. The detection limit in Source-Extractor is set to be Pfalse ≤ 10−p (where p is determined to maximize the detection rate). The coordinates of the detected sources were then used to extract the Poisson probability (Prandom) of each source, which is used to characterize the probability that a detection is due to a random fluctuation of the background. The Poisson probability is calculated using the total and background counts extracted from the simulated maps and the background maps at the coordinate of the detection using a circular aperture of 10″ and 5″ radius for the HET and LET, respectively. We then define the maximum likelihood (DET ML) of each detection as the inverse logarithm of the Poisson probability, i.e., DET ML = – ln Prandom. Therefore, a lower Prandom (i.e., a higher DET ML) suggests a lower chance that the signal arises from a background fluctuation. Multiple detections of the same X-ray source (∼2%) were removed using a radius of 20″. The detections were then matched with the input mock catalog using 10″ and 7″ searching radii for the HET and LET catalogs, respectively.
3.5 Reliability, completeness and survey sensitivity
To evaluate and maximize the accuracy and efficiency of the source detection in real observations, we compute the survey’s reliability and completeness. Reliability is the ratio of the number of detected sources matched to input sources to the total number of detected sources at or above a particular DET ML. Completeness is defined as the ratio of the number of detected sources matched to the input catalog and above a chosen reliability threshold to the number of sources in the input catalog at a particular flux level. The definition of reliability and completeness can be found in Zhao et al. (2021), and references therein.
For the HEX-P surveys presented in this paper, we choose to set a reliability of 99%, which implies a 1% spurious detection rate. Reliability and completeness depend on exposure, and if the observation tiling is planned in a way to have the field exposure uniform, it is possible to adopt a single DET ML threshold. The DET ML values are listed in Table 1 along with the number of sources detected and matched to the input catalogs above the threshold in each energy band.
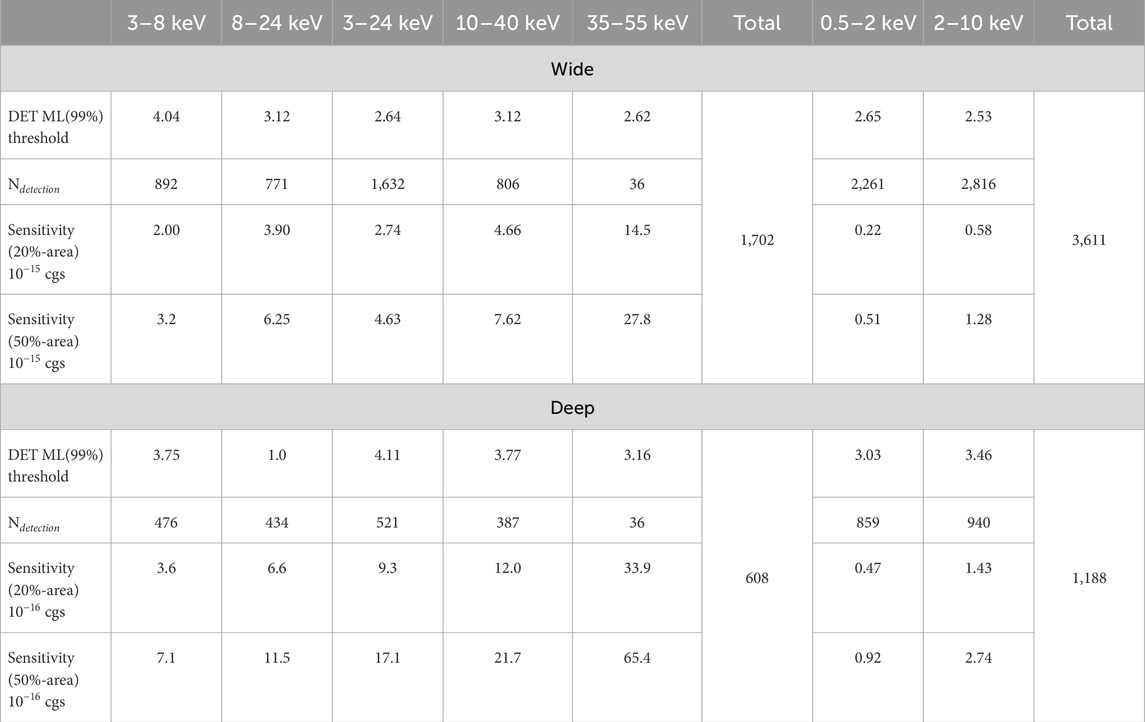
TABLE 1. Summary of simulation results on detection and sensitivity in 7 different bands.
The sky coverage (or the sensitivity) of the survey at a given flux can be derived from the completeness curve: if, at the chosen detection threshold, the completeness is sufficiently high (with reliability also high), the number of detected sources should correspond to the number of input sources with DET ML greater than the threshold value. In this case, the sky coverage is the normalized version of the completeness curve to the total area of the survey. The sensitivity curves for the LET and HET wide and deep surveys are shown in Figure 3 compared with current NuSTAR surveys for the HET and Chandra and XMM-Newton surveys for the LET. Thanks to the large effective area, the lower background and the smaller PSF, HEX-P surveys reach significantly fainter fluxes than any previous NuSTAR survey. The HEX-P wide area survey is comparable in area and total exposure time (1.2 deg2 and 2 Ms) to the COSMOS NuSTAR survey (1.7 deg2 and 3 Ms) and reaches a ∼20 times fainter flux limit in the 8–24 keV band, as shown in Figure 3. The deep HEX-P survey is comparable in area and exposure to the NuSTAR North Ecliptic Pole (NuSTAR-NEP; 0.16 deg2 and 1.6 Ms) survey (Zhao et al., 2021), the deepest survey that NuSTAR has ever performed, but it is a factor of 25 times deeper in flux in the 8–24 keV band. In the lower energy regime, the wide LET survey is comparable in area covered with literature Chandra and XMM-Newton COSMOS surveys (Cappelluti et al., 2009; Civano et al., 2016;), but reach flux limits 4–5 times deeper employing roughly the same exposure time (e.g., Chandra COSMOS Legacy Survey used 4.6 Ms to cover 2.2 deg2, XMM-COSMOS is slightly shallower and used 1.5 Ms to cover 2.2 deg2, while the HEX-P wide survey employs 2 Ms of time to cover 1.1 deg2).
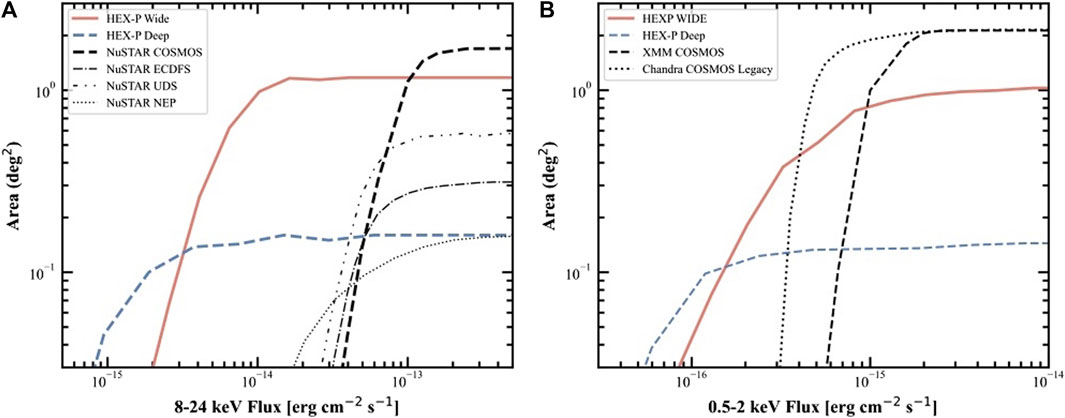
FIGURE 3. Survey sensitivity for the HET (A) in the 8–24 keV band and LET (B) in the 0.5–2 keV band. The deep and wide surveys are in blue and salmon, respectively. In each panel, the predicted sensitivities are compared with surveys published in the literature using NuSTAR in the left panel and Chandra and XMM-Newton in the right panel.
Because one of HEX-P’s major goals is to detect the sources that contribute to the peak of the CXB, we have also performed the detection in higher energy bands, 10–40 and 35–55 keV, which have never been effectively exploited and explored before. The sensitivities in the two bands are presented in Figure 4. While a previous attempt to detect sources in the 35–55 keV band was performed by Masini et al. (2018b) combining the COSMOS, ECDFS and UDS NuSTAR surveys, no sources were detected above the reliability threshold due to the very shallow flux limit in that band (brighter than 10−13 erg s−1 cm−2; see Figure 4B). Their derived upper limit on the expected number counts is consistent with population synthesis model predictions (e.g., Gilli et al., 2007; Ananna et al., 2019), HEX-P instead will provide detected number counts for the first time up to at least 55 keV to stringently test the model predictions.
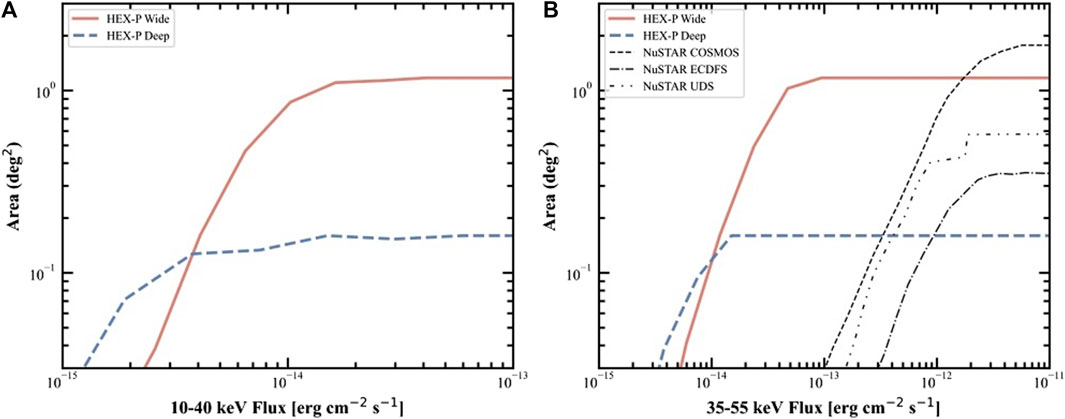
FIGURE 4. Survey sensitivity for the HET (A) in the 10–40 keV (B) and 35–55 keV (right) bands. The deep and wide surveys are in blue and salmon, respectively. The dashed, dot-dashed and dot-dot-dashed lines in the right panel shows the sensitivity in the same band computed for the COSMOS, ECDFS and UDS NuSTAR surveys (Masini et al., 2018b).
4 Source statistics and properties
In Table 1, the number of detected sources with DET ML above the thresholds are reported for the wide and deep surveys in five energy bands for the HET and two energy bands for the LET. The total number of sources detected in the HET is
As mentioned above, the detection in the hardest X-ray band (35–55 keV) did not find any sources in previous NuSTAR surveys. In the HEX-P simulations, we detect more than ∼1,000 sources in the 10–40 keV band and ∼70 sources in the 35–55 keV band, combining deep and wide surveys. These results show that HEX-P will be able to provide the first detections in a band encompassing the entire peak of the CXB and above it.
Thanks to the information in the original mock catalog used for populating the sources of the HEX-P simulations, we associate a redshift and a column density to each detected source. By the time HEX-P is launched, extensive spectroscopic campaigns and photometric survey data will be available in the majority of the well-known fields (e.g., COSMOS, CDFS, UDS) and also new and larger surveys, using data from JWST, Euclid (Euclid Collaboration et al., 2022), Roman (Troxel et al., 2023; Yung et al., 2023) as well as ground-based telescopes like Rubin (Brandt et al., 2018; Scolnic et al., 2018), 4MOST and SDSS Kollmeier et al. (2017). This will allow the complete characterization of the multiwavelength properties of HEX-P–detected AGN. In Figure 5, the luminosity distributions for the HET and LET sources from the deep and wide surveys are plotted. The reported luminosities were not corrected for intrinsic absorption. The HEX-P detections are compared with samples in the literature including the Swift-BAT 105 months all-sky survey sample (black open circles; Oh et al., 2018), the catalog of NuSTAR extragalactic survey sources, including COSMOS (Civano et al., 2015), ECDFS (Mullaney et al., 2015), UDS (Masini et al., 2018a), and the 40-month serendipitous (Lansbury et al., 2017b) surveys. While the NuSTAR surveys already reach luminosities two orders of magnitude fainter than the Swift-BAT sample and extend to significantly higher redshift, with HEX-P sources, it will be possible to explore a new area of the high-energy luminosity-redshift space by reaching Seyfert-like luminosities up to redshift z ∼ 3. HEX-P will also detect in the hard X-rays a statistically significant sample of sources at z > 2, thanks to the combination of flux and area covered. Even in the low energy band, the LET surveys will achieve luminosity and redshift limits comparable or deeper than archival Chandra and XMM-Newton surveys.
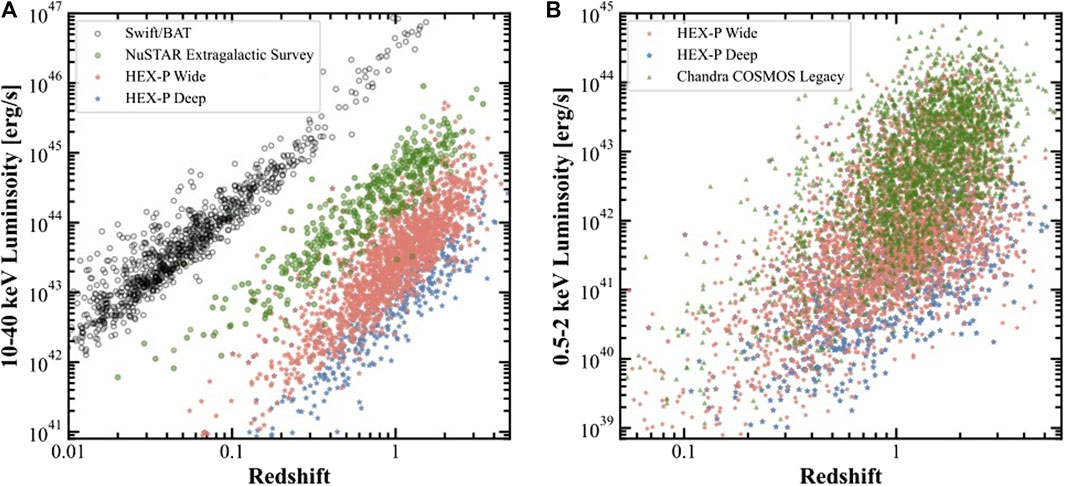
FIGURE 5. (A) 10–40 keV rest frame luminosity versus redshift of the HET detected sources in the deep (blue) and wide (salmon) surveys. (B) 0.5–2 keV rest frame luminosity versus redshift of the LET detected sources in the deep (blue) and wide (salmon) surveys. In both panels, the HEX-P surveys are compared with surveys in the literature using NuSTAR and Swift-BAT in the left panel and Chandra in the right panel.
5 CXB resolved fraction
Before NuSTAR, the spectrum of the CXB in the hard X-ray band (
With HEX-P, it will be possible to measure the resolved fraction up to energies of ∼40 keV. Because we used the well-calibrated mock catalog from Marchesi et al. (2020), computing the resolved fraction in the simulated HEX-P surveys is straightforward.
To this end, we have summed the input fluxes of the HET–detected sources in the deep and wide surveys separately in four different bands (3–8 keV, 8–16 keV, 8–24 keV, and 10–40 keV) that were chosen a posteriori to minimize the uncertainty on the resolved fraction. We then summed the fluxes of all the sources in the total input mock catalog in each energy band, which indeed returns the total intensity of the CXB (within a few percent) as reported and shown in Figure 5 of Marchesi et al. (2020). The CXB resolved fraction in the wide and deep surveys was then calculated by dividing the sum of the input fluxes of the detected sources by the total fluxes from the input catalog in each of the four aforementioned energy bands.
The uncertainty on the resolved fraction was derived from the uncertainty on the measured net counts of the detected sources. The net counts of each detected source are the background subtracted counts, extracted from a circular region centered at the source detected position with a 8.5″ radius (corresponding to an energy encircled fraction of 50%). The uncertainty on the net counts (σnet) of each source is the combination of the uncertainties on the total (σtot) and background counts (σbkg) in quadrature (
As a result, the measured CXB resolved fractions (and errors) in the simulated wide survey are 73% ± 2%, 73% ± 2%, 73% ± 6%, and 74% ± 3% in the 3–8, 8–16, 16–24, and 10–40 keV energy bands, respectively and the measured CXB resolved fractions (and errors) in the simulated deep survey are 86% ± 2%, 85% ± 2%, 86% ± 6%, and 86% ± 3% in the four energy bands, respectively. The measured CXB resolved fraction is shown in Figure 6 together with the Chandra and NuSTAR measurements. The width of the x-axis error bar on each of the HEX-P point corresponds to the width of the energy band used for that measurement. We note that the measured resolved fraction is almost constant across a wide energy range and this is due to the combination of the deep flux limit reached in these simulations that enables the detection of all the bright unobscured and also obscured sources contributing to the CXB and also to the use of the source input flux in the computation of the resolved fraction and not the measured flux (see below).
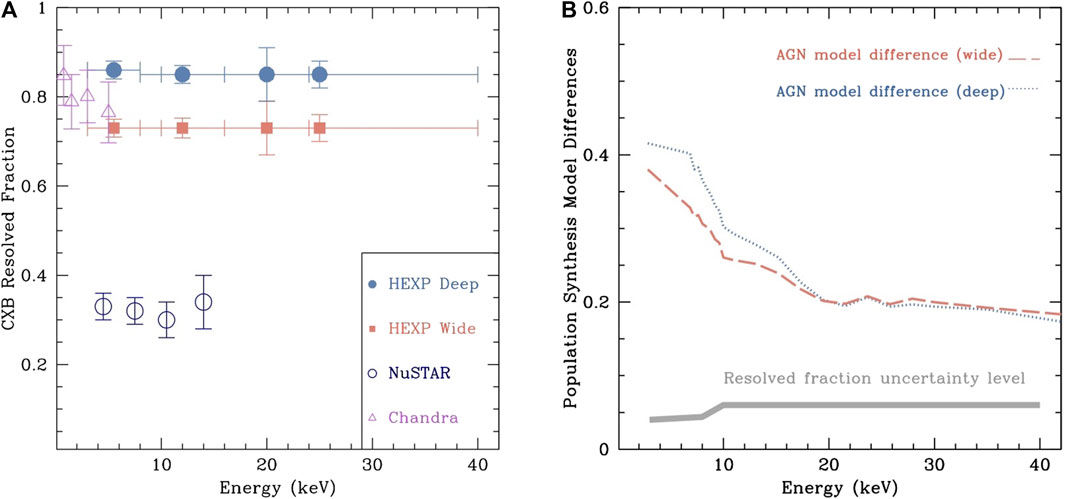
FIGURE 6. (A) Resolved fraction of the CXB as a function of energy as measured by Chandra (open violet triangles), NuSTAR deep surveys (open blue circles) and predicted for HEX-P deep (solid teal circles) and wide (solid salmon squares). (B) Difference between population synthesis models compared to the level of uncertainties (grey) measured for the CXB resolved fraction. The population synthesis models from Gilli et al. (2007) and Ananna et al. (2019) are folded with the deep (teal) and wide (salmon) survey sensitivity curves.
Just using the detected sources in the HET, we predict that HEX-P will reach a resolved fraction comparable with the results obtained from Chandra deep surveys below 8 keV (e.g., Xue et al., 2012) but reaching above the peak of the CXB up to 40 keV (see Figure 6). While ∼70 sources are detected in the 35–55 keV band as shown in Table 1, this sample is too small to obtain strong constraints on the resolved fraction and provides only an upper limit (not reported in Figure 6). While the actual intensity of the CXB remains still uncertain, as recently shown by Rossland et al. (2023), the resolved fraction measured here is self-consistent as the input source fluxes are drawn from the mock catalog of Marchesi et al. (2020) and the total flux used is the sum of all the sources from the same mock catalog. Therefore, the uncertainties affecting the intensity of the CXB do not play a role in our measurement.
A fraction of the detected sources might be affected by Eddington bias, and their measured fluxes might be over-estimated compared to the input fluxes. This excess (over-estimation) of the measured fluxes mostly affects the sources at the flux limit of a survey (see, e.g., Figure 11 in Zhao et al., 2021). In this paper, the input fluxes from the mock catalog were used to compute the resolved fraction, and consequently, the Eddington bias does not affect our measurement. However, we did assess how Eddington bias will affect the measured resolved CXB fraction in real HEX-P surveys compared to the resolved CXB fraction computed above. For this analysis, we used the 50%-area sensitivity reported in Table 1 as the indicator of the turnover in a flux-flux distribution, following the method in Zhao et al. (2021), and derived that fluxes below the 50% area sensitivity in the wide survey might be overestimated by 2%, 6%, 10%, and 3% for the 3–8, 8–16, 16–24, and 10–40 keV bands. On the other hand, the fluxes of the sources in the deep survey are predicted to be overestimated by less than 1%–2%. Therefore, we anticipate that the resolved CXB fraction computed from future HEX-P surveys might be higher than the resolved CXB fraction presented in this paper by 2%–10% in the wide survey (depending on the energy band) and
5.1 Comparison with population synthesis models
As shown in Figure 5, the luminosity-redshift space sampled by HEX-P will fill an important gap in our understanding of the AGN population. Currently, there are significant disagreements between population synthesis models, in particular at the faintest fluxes where the lack of detected sources makes it impossible to constrain the models. The faintest fluxes are populated by low-luminosity and/or heavily obscured AGN (see Figures 12 and 15 from Ananna et al., 2019). Sampling these parts of the population is one of the goals of the HEX-P surveys and will be of extreme importance for calibrating the next-generation of synthesis models.
The wide survey will also provide high-energy information on the poorly sampled population of luminous AGN which are rare and require larger volumes to be found (see the right panel of Figure 5). Although different population synthesis models predict different fractions of AGN at each obscuration level, usually these contributions sum to the same value of CXB (e.g., the CXB broken into bins of obscuration is given in Figure 11 of Ananna et al., 2019). One way to break the degeneracy is by applying different flux limits in different energy bands, as that leads to varying predictions between models of the CXB resolved fraction.
Comparing the measured resolved fraction with population synthesis models in this work would not return valuable information as the mock catalog used in these simulations is drawn from the Gilli et al. (2007) model and therefore the obtained results are in agreement with it. However, we can use the measurement uncertainties to showcase HEX-P’s capability to distinguish between model differences. In Figure 6B, the uncertainty level measured on the CXB resolved fraction (gray band) is compared with the typical difference between resolved fractions predicted by population synthesis models at the HEX-P flux limits in the wide and deep surveys. We used the models from Gilli et al. (2007) and Ananna et al. (2019) for this comparison, all of which were folded with the deep and wide survey sensitivities. Several other models were considered, but the above models captured the typical discrepancy between model predictions. We find that the difference between models is significantly larger than the simulated HEX-P measurement uncertainties, which will help us converge toward the most accurate population synthesis model.
HEX-P will focus X-rays in an energy range where it has never been achieved by any instruments before, allowing us to study the hard X-ray emission of AGN to flux limits never reached before. This will open the parameter space for new serendipitous discoveries. It is possible, even likely, that no existing model will perfectly predict the population that HEX-P will observe, as has happened in the past when new facilities reached unprecedented capabilities (Ananna et al., 2019; Kirkpatrick et al., 2023).
6 Obscured sources in surveys
Besides the detection of the sources contributing to the peak of the CXB, one of the main goals of HEX-P extragalactic surveys will be to characterize AGN spectral properties such as spectral indices, cut-off temperatures, reflection scaling factors and circum-nuclear obscuration covering factors (Boorman et al., 2023; Kammoun et al., 2023; Piotrowska et al., 2023). Extragalactic field surveys will contribute to this analysis by providing deep exposures for faint sources. While the CXB is an aggregate population statistic, data from HEX-P can be directly incorporated into models and can contribute greatly towards constraining one of the biggest uncertainties in AGN populations: the fraction of heavily obscured (i.e., CT) objects.
Zappacosta et al. (2018) carried out a systematic broad-band (0.5–24 keV) spectral analysis of 63 sources detected in NuSTAR extragalactic surveys with a flux brighter than 7 × 10⁻¹⁴ erg s−1 cm−2 (8–24 keV) to characterize their spectral properties, obtain a column density distribution and measure the absorbed/CT fractions to compare with predictions from population-synthesis models. However, their sample lacks large statistics, its soft band data (needed to perform the spectral fitting) was taken at a different epoch and the spectral analysis can be affected by variability. As a consequence, the results on the derived properties, like the obscured and CT fractions, have large uncertainties or are basically unconstrained (CT = 0.02–0.56 or
In Figure 7, the net counts distribution in 10″ and 5″ radius apertures (∼30% of the PSF) for the HET and LET detections in the simulated surveys are reported. As shown by Zappacosta et al. (2018), above 40 counts in the 3–24 keV band, it is possible to obtain good
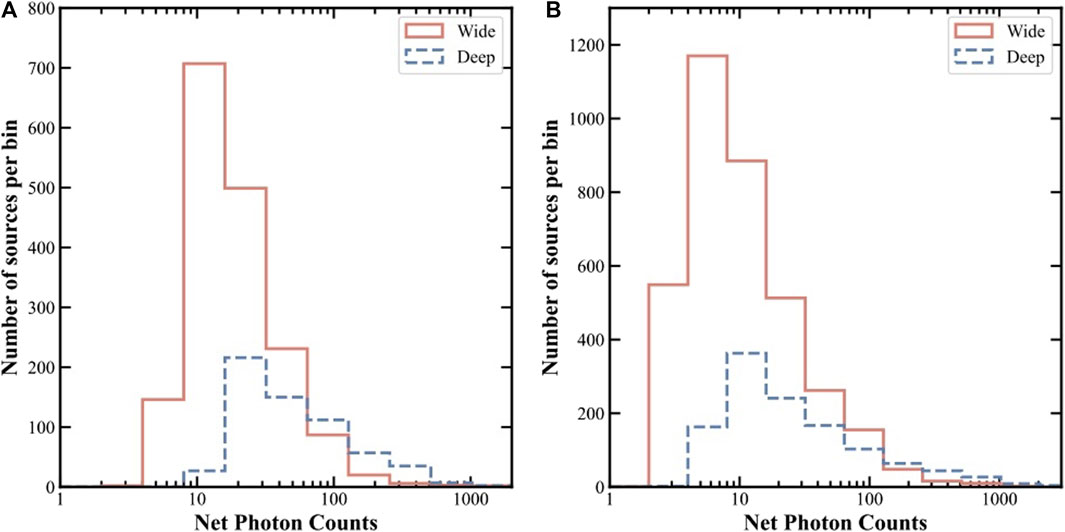
FIGURE 7. Source count distributions showcasing how many counts we will have in HET (A) and LET (B) over the bandpass to perform spectral analysis. The counts were extracted in the 0.5–15 keV band for the LET and the 3–40 keV band for the HET (summing two telescopes). The sources from the deep survey are in blue, those from the wide survey are in salmon.
The good quality X-ray spectra will also allow us to investigate further potential observational biases caused by rapidly spinning black holes with strong reflection components that mimic obscured spectra (Gandhi et al., 2007; Vasudevan et al., 2016). Deconvolving spin-related reflection signatures from obscuration will reval SMBH growth with cosmic time.
While spectral analysis is the best tool to measure intrinsic source properties (spectral index, column density, luminosity), the hardness ratio (HR = H-S/H+S where H and S are typically the number of counts in a given hard and soft band respectively) has been used before in XMM-Newton, Chandra and NuSTAR surveys (Civano et al., 2015; Marchesi et al., 2016a; Zhao et al., 2021) to obtain a rough measurement of obscuration. As shown in Zhao et al. (2021), the hardness ratio computed using NuSTAR bands (3–8 and 8–24 keV) is more sensitive to obscuration above NH > 1024 cm−2 than just using softer bands (0.5–2 and 2–10 keV), which can better distinguish column densities below NH < 1023 cm−2. However, usually, soft and hard X-ray data are not simultaneous in extragalactic surveys, and therefore the estimate of obscuration using non-simultaneous hardness ratios can give erroneous results. With HEX-P, HET detections will have soft energy data readily available to build a color-color diagram spanning the 0.5–40 keV band. Figure 8A shows such a color-color diagram using the hard X-ray HRHET (with H = 10–40 keV and S = 3–8 keV counts) compared to the soft X-ray HRLET (with H = 2–10 keV and S = 0.5–2 keV counts); the sources are color-coded according to their column density from the input mock catalog. Only detections in the 10–40 keV and 3–8 keV bands are used. As most of these sources will be in the low-counts regime, the best estimate of the HR will be obtained using a Bayesian tool such as BEHR (Park et al., 2006). The spread of the points on the x-axis for each given column density is due to the degeneracy of hardness ratio with redshift. Still, we foresee that most, if not all, of the sources in the HEX-P extragalactic surveys will have a spectroscopic or photometric redshift measure. The contours represent number densities associated with 1, 2 and 3 σ from a two-dimensional Gaussian distribution, according to different input obscuration values. Thanks to the coverage at energies above 10 keV, it will be possible to distinguish the CT AGN from the less obscured ones as the CT AGN are separated by the rest of the sources mainly on the HRHET axis/color. Adding multi-wavelength information (e.g., redshifts, infrared fluxes, etc) will constrain the column density to even higher precision and accuracy (e.g., Carroll et al., 2021, Carroll et al., 2023; Silver et al., 2023) and therefore deliver a robust sample of CT AGN.
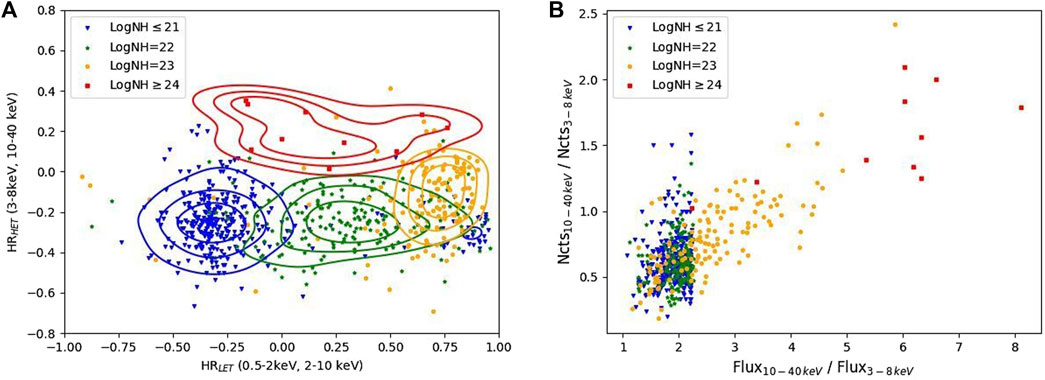
FIGURE 8. (A) HRHET versus HRLET for sources detected in the 10–40 keV band. The sources are color-coded by obscuration from the input catalog. The density contours represent 1, 2 and 3 σ from a two-dimensional Gaussian distribution. (B) 10–40 and 3–8 keV observed counts ratio plotted against the input flux ratio in the same bands. The sources are color-coded by obscuration from the input catalog.
Another method to select candidate obscured and CT sources is to use a simple band ratio (H/S) as done in NuSTAR by Mullaney et al. (2015). Previously, an anti-correlation was observed between band ratio (H/S) and count rates in the chosen soft band (S), attributed to the decrease of soft band counts with increasing obscuration (Della Ceca et al., 1999; Ueda et al., 1999; Mushotzky et al., 2000; Tozzi et al., 2001; Alexander et al., 2003). We have used the 10–40 keV to 3–8 keV input flux ratio and compared it with the detected counts ratio in the same band to test the reliability of the band ratio to find CT sources (Figure 8B). The two quantities correlate when considering the 10–40 keV detected sample with fluxes above the 50%-area flux limit and with detections in both the 10–40 and 3–8 keV bands. When including upper limits on the 3–8 keV flux, the correlation between the two band ratios is not equally strong due to few unobscured sources, which are just detected in the 10–40 keV band, possibly due to Eddington bias.
6.1 Spectral analysis of obscured sources
To quantify the spectral constraints attainable from HEX-P surveys and compare with the quality of the best sources in NuSTAR’s surveys, we simulated known CT and obscured Compton-thin (log(NH) < 24) AGN detected in the NuSTAR COSMOS (Civano et al., 2015) and serendipitous (Lansbury et al., 2017a) surveys which were both presented in Zappacosta et al. (2018). The observed/measured spectral properties (from Zappacosta et al., 2018) are summarized in Table 2. We used the spectra from Zappacosta et al. (2018) and performed broadband spectral fitting using the Bayesian X-ray Analysis (BXA) code from Buchner (2016) with the uxclumpy model (Buchner et al., 2019). The original Chandra, XMM-Newton and NuSTAR spectra and their best-fit models are shown in Figure 9. As presented by Zappacosta et al. (2018), two of the three sources (nuid117 and cnuid330) are classified as CT, and one (cnuid272) is obscured but Compton-thin.

TABLE 2. Properties of targets chosen for spectral analysis simulations.
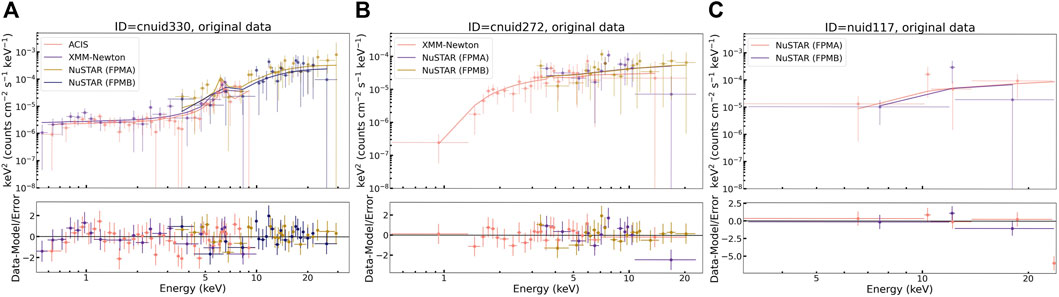
FIGURE 9. The original spectra for cnuid330 (A), cnuid272 (B) and nuid117 (C), unfolded with the best-fit uxclumpy model (denoted with solid lines) found using BXA.
Using the best-fit uxclumpy models found by BXA, we simulated HEX-P spectra for both the LET and HET. For the bright CT source (cnuid330), we simulated exposure times consistent with the proposed wide field survey (50, 60, and 100 ks; see Figure 1, salmon curves) which is likely to detect similarly bright CT sources. For the two fainter sources (nuid117 and cnuid272), we used exposure times consistent with the HEX-P deep survey (250, 500, and 700 ks; see Figure 1, blue curves), which probes the faint population.
The goal of these simulations is to test the ability of HEX-P to differentiate the subtle effects that the geometry of obscuring material has on the AGN spectral shape. As described by Buchner et al. (2019), the uxclumpy model includes an optional CT inner ring of obscuring material that can help to explain the features of some, but not all, CT AGN at hard energies (≳ 10 keV). For example, Buchner et al. (2019) shows that this additional component is needed to efficiently model the broadband X-ray spectrum of the prototypical CT-AGN in the Circinus Galaxy. The inner ring is parameterized by the covering fraction of the material (CTK-cover, which ranges from 0.0 to 0.6). For the faint and higher redshift AGN (nuid117 and cnuid272), CTK-cover is not constrained with previous data. HEX-P’s effective area beyond 20 keV will allow us to discern the subtle effects (e.g., a general sharpening of the Compton hump at
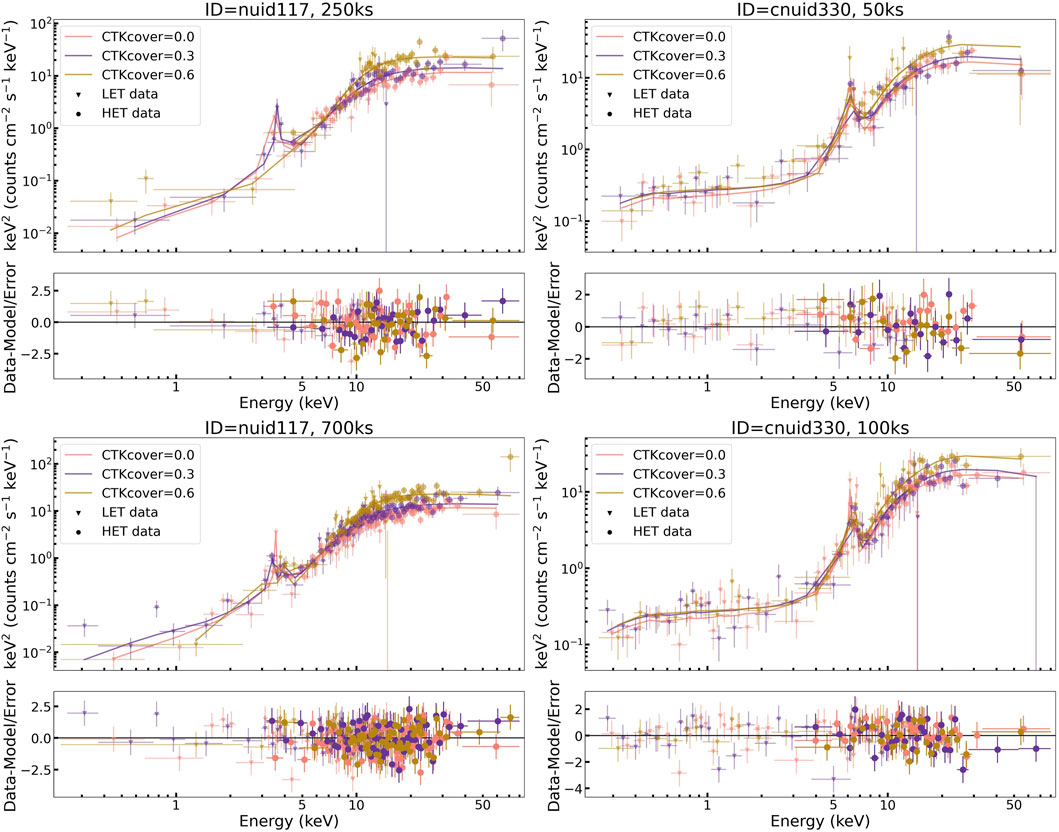
FIGURE 10. Unfolded HEX-P spectra for two CT sources (nuid117, left and cnuid330, right) simulated for the minimum (top) and maximum (bottom) exposure times of the deep (nuid117, left) and wide (cnuid330, right) surveys. LET and HET data are plotted as triangles and circles, respectively. The theoretical spectra on which the simulations were based are shown by solid lines. The three colors denote simulations with different values of uxclumpy’s CTK-cover parameter. The spectra of nuid117 have been normalized at 6 keV and of cnuid330 have been normalized at 5 keV.
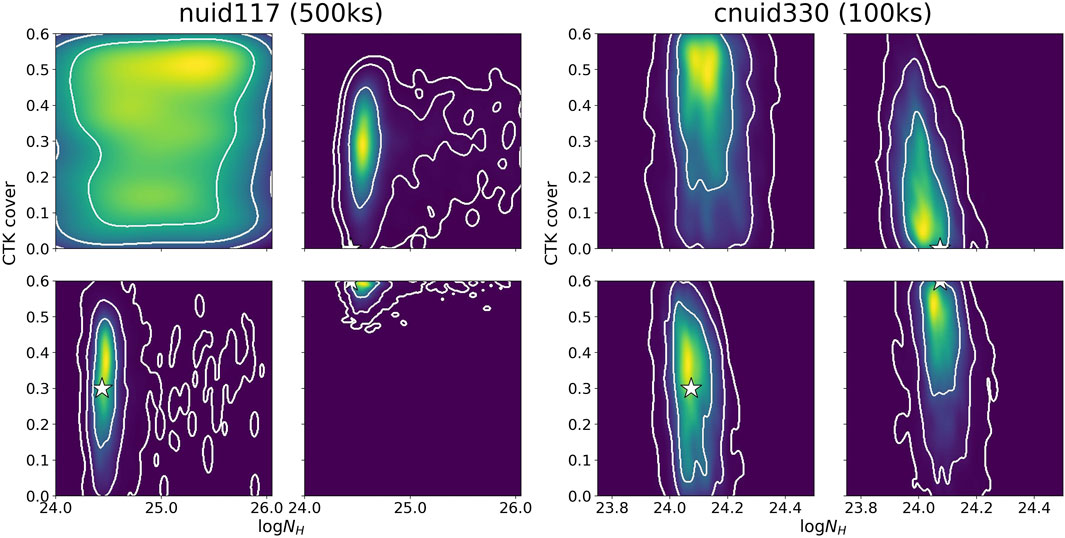
FIGURE 11. Constraints on NH and CTK-cover for nuid117/cnuid330 (left/right). Constraints are shown for the original data (top-left) and 500 ks/100 ks HEX-P simulations with CTK-cover = 0.0 (top-right), 0.3 (bottom-left), and 0.6 (bottom-right). The white contour lines demonstrate 1σ, 2σ, and 3σ constraints and a white star denotes the nominal parameter values for the simulations.
For obscured, Compton-thin AGN, the effects of CTK-cover are negligible within HEX-P’s energy range. But it is still of interest to constrain NH of these AGN. In the case of cnuid272, this constraint is shown for 500 ks simulation of the object at its nominal flux, as well as an identical object that is ten times fainter as well as to the NH constraints of the existing NuSTAR observation in Figure 12. Similar constraints as NuSTAR will be achieved for a source that is 10 times fainter with HEX-P. It may be noted that the maximum a posteriori value of NH derived by BXA (which is taken as the “truth” value for the simulations) does not align with the peak of the distribution. This shift can occur when analyzing a multi-dimensional parameter space where one or more parameters become limits. In these cases, it is difficult to define a best-fit model, and therefore, it is more useful to compare the posterior distribution of the parameters, which is done here.
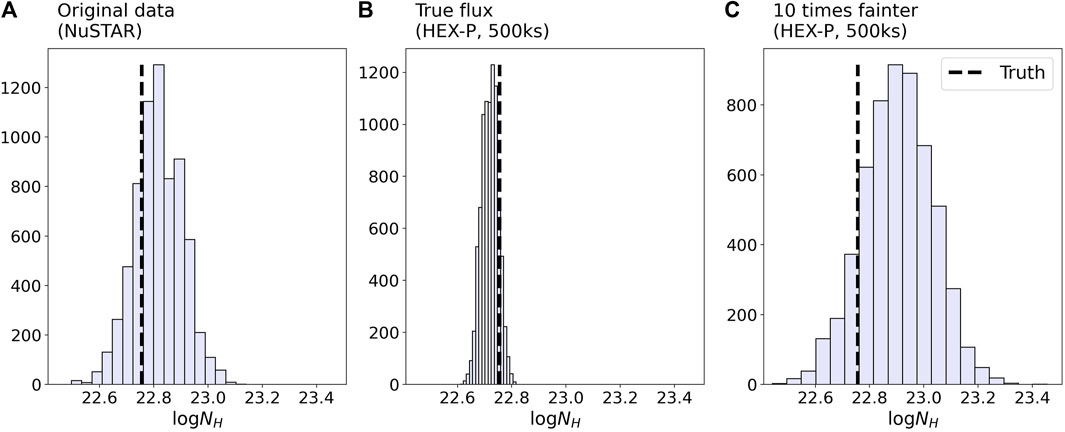
FIGURE 12. The NH constraints for cnuid272 (a Compton-thin source) found using the original data (A) and 500 ks HEX-P simulation (B) and a simulated object ten times fainter than (but otherwise identical to) cnuid272 (C). The dashed black line in all three panels marks the best-fit NH for the original data, which is set to the “truth” value for the simulated spectra.
6.2 Predictions on the compton-thick fraction
Constraining the space densities of CT objects has remained elusive due to a lack of high-energy X-ray telescopes capable of detecting faint sources. HEX-P can help fill this gap in several ways. Combining spectral analysis of the brightest sources with hardness and band ratio analyses, it will be possible to place constraints on the CT fraction at fluxes ten times, or more, fainter than has been reported before (Burlon et al., 2011; Civano et al., 2015; Ricci et al., 2015; Masini et al., 2018a; Torres-Albà et al., 2021). To visualise the importance of flux limits in assessing the CT fraction, we show the contribution to the CXB from CT objects using the Ananna et al. (2019) model with two different assumed CT fractions (30% and 50%) as solid lines in Figure 13. For a series of increasing flux depths, we then considered the detected CT sources above that flux level and re-sampled a random number of not-CT AGN detected above that flux level to give a fraction as close as possible to the value given by each model. We note that since the simulations performed in this work follow a mock catalog based on Gilli et al. (2007), we are not directly comparing the measured CT fraction in simulations with the Ananna et al. (2019) models. Still, we derive uncertainties on the curves in Figure 13 based on the binomial uncertainties associated with the number of CT sources detected in the surveys above a given flux. For the comparison in Figure 13, the sources detected in the 10–40 keV band in the combined deep and wide surveys were considered.
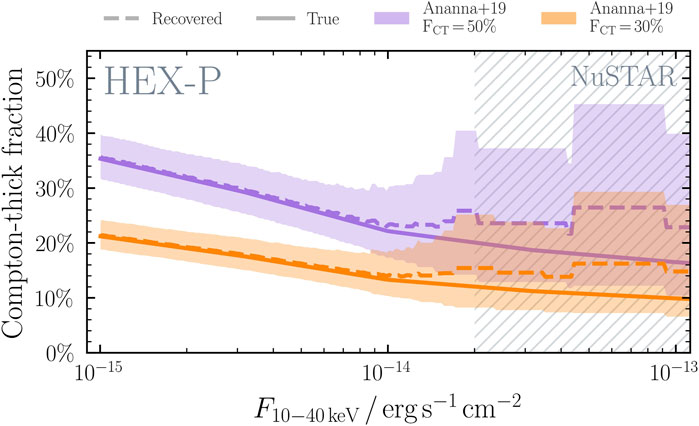
FIGURE 13. The ability to distinguish between population synthesis model predictions of the CT fraction as a function of flux limit in the 10–40 keV band with the simulated wide and deep HEX-P surveys combined. The true predicted CT fractions from the population synthesis models of Ananna et al. (2019) are shown with solid lines for 30% and 50% in orange and purple, respectively. The CT fraction recovered purely from CT sources detected above each flux limit on the x-axis is shown with dashed lines and associated binomial uncertainty shading. Clearly the two models can be differentiated by reaching fainter flux levels than NuSTAR is currently able to (hatched shading).
At the flux level sampled by NuSTAR surveys (
There are several other ways in which HEX-P will help us constrain CT space densities. One important approach would be to consider the entire population detected by HEX-P and infer the CT fraction with multi-wavelength diagnostics and machine learning algorithms, in particular using infrared colors (Stern et al., 2005; Stern et al., 2012; Mateos et al., 2013; Assef et al., 2015; Carroll et al., 2021, Carroll et al., 2023; Silver et al., 2023). Moreover, given the improved PSF of HEX-P compared to NuSTAR, it will be possible to perform stacking analysis (see the results in Hickox, 2024) at the position of non-X-ray detected candidate CT AGN selected from multiwavelength analysis. We can then apply the HEX-P wide and deep survey flux limits in the 10–40 keV energy window to population synthesis models and compare the results with the HEX-P observed sample to find the most accurate models. This will be a useful check not only for CT sources but also for relatively unobscured sources, as there are significant disagreements between population synthesis models at Compton-thin obscuration levels as well (as these models have to add up to reproduce the CXB, overestimation in one obscuration level needs to be compensated for by reducing the contribution in others, and vice versa). Overall, HEX-P’s data promises a deeper, more nuanced insight into AGN space densities, shedding light on the evolution of AGN across cosmic time.
7 Summary
In this paper, we have presented a small selection of the results that will be obtained by performing wide and deep extragalactic surveys with the High Energy X-ray Probe. These findings are based on extensive simulations using AGN mock catalogs derived from Marchesi et al. (2020). We followed the standard survey detection process to analyze these simulations, leading to the detection of several thousand sources above 3 keV, in contrast to the few hundred sources detected in all of NuSTAR’s surveys performed to date. Notably, we predict the detection of the first sample of AGN in the 35–55 keV energy band.
The analysis of these simulations demonstrates that HEX-P will, for the first time, have the capability to significantly constrain the contribution of AGN to the CXB around its peak (3–40 keV). We anticipate reaching a resolved fraction of approximately ∼86% in the 3–40 keV energy range, comparable to what Chandra has resolved in the 0.5–8 keV range. This result was achieved using HET detections alone, and even higher resolved fractions can be obtained by performing a stacking analysis of the HET data at the position of LET sources. Furthermore, the resolved fraction could be computed in the 0.5–15 keV energy band exclusively from LET detections.
With the large samples of sources HEX-P will detect, it will be possible to compute the resolved fraction by separating sources in different classes based on X-ray (obscured, unobscured, CT or C-Thin) or optical classifications, allowing to study their relative contribution (and spectrum) at different energies to the total CXB with the ultimate goal of informing population synthesis models and understanding the full cosmic history of black hole growth.
Understanding the spectrum of the AGN population is a crucial aspect when calibrating population synthesis models. HEX-P’s simultaneous broadband coverage will enable spectral analysis for ∼1,000 sources (combining the LET and HET detections) with sufficient counts to measure and strongly constrain spectral parameters beside obscuration and spectral slope, including, e.g., the covering factor and high-energy cut-off. For sources with low-count spectra, we have shown that the combination of soft and hard X-ray colors can estimate their obscuration level by comparing these colors with the simulations presented in this paper and future simulations. For the first time, we will measure the CT fraction in the 10–40 keV band at a flux limit that is one order of magnitude fainter than NuSTAR with a sample of CT AGN large enough to finally calibrate the next-generation of population synthesis models.
When comparing the uncertainty on the measured CXB resolved fraction with the typical difference between AGN population synthesis models, it becomes evident that these new HEX-P measurements will be able to disentangle models. It is also plausible that no currently existing model will offer a perfect fit to the population that HEX-P will uncover. Together with dedicated observations of local CT AGN (Boorman et al., 2023), the survey data will open the door to a recalibration of existing population synthesis models, facilitating the integration of more precise constraints on both space densities and AGN spectra.
The potential residing in HEX-P surveys extends far beyond what is covered in this paper. For example, we have not discussed the great potential of serendipitous detections of AGN pairs in surveys (see discussion in Pfeifle et al., 2023) nor the measurements of SMBH spins for the brighter AGN (Piotrowska et al., 2023) and also the possible detection of blazars in the wide area survey (Marcotulli et al., 2023). By the time HEX-P is launched, comprehensive spectroscopic campaigns and photometric data will be available for the majority of the extragalactic fields that HEX-P will target from major ground and space-based observatories. These data will allow the complete characterization of the multiwavelength properties of HEX-P detected AGN as well as the properties of their host galaxies. Understanding the connection between SMBH growth and host galaxy evolution is one of the main goals of the Astro2020 Decadal Survey (National Academies of Sciences, Engineering, and Medicine, 2021) and the HEX-P survey samples, combined with these exquisite and rich multiwavelength datasets, will allow us to finally address this goal in the early 2030s.
Data availability statement
The raw data supporting the conclusion of this article will be made available by the authors, without undue reservation.
Author contributions
FC: Writing–original draft, Writing–review and editing. XZ: Formal Analysis, Writing–review and editing. PB: Writing–review and editing. SM: Writing–review and editing. TA: Writing–review and editing. SC: Writing–review and editing. C-TC: Writing–review and editing. RH: Writing–review and editing. DS: Writing–review and editing. KM: Writing–review and editing. JG: Writing–review and editing. RS: Writing–review and editing. JA: Writing–review and editing. DA: Writing–review and editing. MB: Writing–review and editing. WB: Writing–review and editing. JB: Writing–review and editing. PG: Writing–review and editing. EK: Writing–review and editing. SL: Writing–review and editing. GL: Writing–review and editing. AMe: Writing–review and editing. AMo: Writing–review and editing. KN: Writing–review and editing. EN: Writing–review and editing. AP: Writing–review and editing. SP: Writing–review and editing. RP: Writing–review and editing. CR: Writing–review and editing. DS: Writing–review and editing. NT-A: Writing–review and editing.
Funding
The author(s) declare financial support was received for the research, authorship, and/or publication of this article. RS acknowledges support from the NuSTAR grant number 19-NuSTAR-0036. CR acknowledges support from the Fondecyt Regular grant 1230345 and ANID BASAL project FB210003. The work of DS was carried out at the Jet Propulsion Laboratory, California Institute of Technology, under a contract with NASA. SC work is supported by NASA under award number 80GSFC21M0002.
Conflict of interest
Author SP was employed by ASI—Agenzia Spaziale Italiana.
The remaining authors declare that the research was conducted in the absence of any commercial or financial relationships that could be construed as a potential conflict of interest.
Publisher’s note
All claims expressed in this article are solely those of the authors and do not necessarily represent those of their affiliated organizations, or those of the publisher, the editors and the reviewers. Any product that may be evaluated in this article, or claim that may be made by its manufacturer, is not guaranteed or endorsed by the publisher.
References
Aird, J., Alexander, D. M., Ballantyne, D. R., Civano, F., Del-Moro, A., Hickox, R. C., et al. (2015a). The NuSTAR extragalactic survey: first direct measurements of the ≳10 KeV X-ray luminosity function for active galactic nuclei at z>0.1. ApJ 815, 66. doi:10.1088/0004-637X/815/1/66
Aird, J., Coil, A. L., Georgakakis, A., Nandra, K., Barro, G., and Pérez-González, P. G. (2015b). The evolution of the X-ray luminosity functions of unabsorbed and absorbed AGNs out to z ∼ 5. MNRAS 451, 1892–1927. doi:10.1093/mnras/stv1062
Akylas, A., Georgakakis, A., Georgantopoulos, I., Brightman, M., and Nandra, K. (2012). Constraining the fraction of Compton-thick AGN in the Universe by modelling the diffuse X-ray background spectrum. A&A 546, A98. doi:10.1051/0004-6361/201219387
Alexander, D. M., Bauer, F. E., Brandt, W. N., Schneider, D. P., Hornschemeier, A. E., Vignali, C., et al. (2003). The Chandra deep field North survey. XIII. 2 Ms point-source catalogs. AJ 126, 539–574. doi:10.1086/376473
Alexander, D. M., Stern, D., Del Moro, A., Lansbury, G. B., Assef, R. J., Aird, J., et al. (2013). The NuSTAR extragalactic survey: a first sensitive look at the high-energy cosmic X-ray background population. ApJ 773, 125. doi:10.1088/0004-637X/773/2/125
Ananna, T. T., Treister, E., Urry, C. M., Ricci, C., Hickox, R. C., Padmanabhan, N., et al. (2020). Accretion history of AGNs. II. Constraints on AGN spectral parameters using the cosmic X-ray background. ApJ 889, 17. doi:10.3847/1538-4357/ab5aef
Ananna, T. T., Treister, E., Urry, C. M., Ricci, C., Kirkpatrick, A., LaMassa, S., et al. (2019). The accretion history of AGNs. I. Supermassive black hole population synthesis model. ApJ 871, 240. doi:10.3847/1538-4357/aafb77
Assef, R. J., Eisenhardt, P. R. M., Stern, D., Tsai, C. W., Wu, J., Wylezalek, D., et al. (2015). Half of the most luminous quasars may Be obscured: investigating the nature of WISE-selected hot dust-obscured galaxies. ApJ 804, 27. doi:10.1088/0004-637X/804/1/27
Ballantyne, D. R., Everett, J. E., and Murray, N. (2006). Connecting galaxy evolution, star formation, and the cosmic X-ray background. ApJ 639, 740–752. doi:10.1086/499558
Bertin, E., and Arnouts, S. (1996). SExtractor: software for source extraction. A&AS 117, 393–404. doi:10.1051/aas:1996164
Bogdan, A., Goulding, A., Natarajan, P., Kovacs, O., Tremblay, G., Chadayammuri, U., et al. (2023). Evidence for heavy seed origin of early supermassive black holes from a z˜10 X-ray quasar. arXiv. doi:10.48550/arXiv.2305.15458
Boorman, P. G., Torres-Albà, N., Annuar, A., Marchesi, S., Pfeifle, R., Stern, D., et al. (2023). The high energy X-ray probe (HEX-P): the circum-nuclear environment of growing supermassive black holes. arXiv. doi:10.48550/arXiv.2311.04949
Brandt, W. N., Ni, Q., Yang, G., Anderson, S. F., Assef, R. J., Barth, A. J., et al. (2018). Active galaxy science in the LSST deep-drilling fields: footprints, cadence requirements, and total-depth requirements. arXiv. doi:10.48550/arXiv.1811.06542
Brightman, M., Nandra, K., Salvato, M., Hsu, L.-T., Aird, J., and Rangel, C. (2014). Compton thick active galactic nuclei in Chandra surveys. MNRAS 443, 1999–2017. doi:10.1093/mnras/stu1175
Buchner, J. (2016). BXA: bayesian X-ray analysis. Astrophysics Source Code Library, record ascl:1610.011. Available at: https://ui.adsabs.harvard.edu/abs/2016ascl.soft10011B
Buchner, J., Brightman, M., Nandra, K., Nikutta, R., and Bauer, F. E. (2019). X-ray spectral and eclipsing model of the clumpy obscurer in active galactic nuclei. A&A 629, A16. doi:10.1051/0004-6361/201834771
Buchner, J., Georgakakis, A., Nandra, K., Brightman, M., Menzel, M.-L., Liu, Z., et al. (2015). Obscuration-dependent evolution of active galactic nuclei. ApJ 802, 89. doi:10.1088/0004-637X/802/2/89
Buchner, J., Georgakakis, A., Nandra, K., Hsu, L., Rangel, C., Brightman, M., et al. (2014). X-ray spectral modelling of the AGN obscuring region in the CDFS: Bayesian model selection and catalogue. A&A 564, A125. doi:10.1051/0004-6361/201322971
Burlon, D., Ajello, M., Greiner, J., Comastri, A., Merloni, A., and Gehrels, N. (2011). Three-year swift-bat survey of active galactic nuclei: reconciling theory and observations? Astrophysical J. 728, 58. doi:10.1088/0004-637x/728/1/58
Cappelluti, N., Brusa, M., Hasinger, G., Comastri, A., Zamorani, G., Finoguenov, A., et al. (2009). The XMM-Newton wide-field survey in the COSMOS field. The point-like X-ray source catalogue. A&A 497, 635–648. doi:10.1051/0004-6361/200810794
Cappelluti, N., Li, Y., Ricarte, A., Agarwal, B., Allevato, V., Tasnim Ananna, T., et al. (2017). The Chandra COSMOS legacy survey: energy spectrum of the cosmic X-ray background and constraints on undetected populations. ApJ 837, 19. doi:10.3847/1538-4357/aa5ea4
Carroll, C. M., Ananna, T. T., Hickox, R. C., Masini, A., Assef, R. J., Stern, D., et al. (2023). A high fraction of heavily X-ray-obscured active galactic nuclei. ApJ 950, 127. doi:10.3847/1538-4357/acc402
Carroll, C. M., Hickox, R. C., Masini, A., Lanz, L., Assef, R. J., Stern, D., et al. (2021). A large population of luminous active galactic nuclei lacking X-ray detections: evidence for heavy obscuration? ApJ 908, 185. doi:10.3847/1538-4357/abd185
Chen, C. T. J., Brandt, W. N., Luo, B., Ranalli, P., Yang, G., Alexander, D. M., et al. (2018). The XMM-SERVS survey: new XMM-Newton point-source catalogue for the XMM-LSS field. MNRAS 478, 2132–2163. doi:10.1093/mnras/sty1036
Civano, F., Hickox, R. C., Puccetti, S., Comastri, A., Mullaney, J. R., Zappacosta, L., et al. (2015). The nustar extragalactic surveys: overview and catalog from the COSMOS field. ApJ 808, 185. doi:10.1088/0004-637X/808/2/185
Civano, F., Marchesi, S., Comastri, A., Urry, M. C., Elvis, M., Cappelluti, N., et al. (2016). The Chandra cosmos legacy survey: overview and point source catalog. ApJ 819, 62. doi:10.3847/0004-637X/819/1/62
Comastri, A., Gilli, R., Marconi, A., Risaliti, G., and Salvati, M. (2015). Mass without radiation: heavily obscured AGNs, the X-ray background, and the black hole mass density. A&A 574, L10. doi:10.1051/0004-6361/201425496
Comastri, A., Setti, G., Zamorani, G., and Hasinger, G. (1995). The contribution of AGNs to the X-ray background. A&A 296, 1. doi:10.48550/arXiv.astro-ph/9409067
Dauser, T., Falkner, S., Lorenz, M., Kirsch, C., Peille, P., Cucchetti, E., et al. (2019). SIXTE: a generic X-ray instrument simulation toolkit. A&A 630, A66. doi:10.1051/0004-6361/201935978
Della Ceca, R., Castelli, G., Braito, V., Cagnoni, I., and Maccacaro, T. (1999). A medium survey of the hard X-ray sky with ASCA. II. The source’s broadband X-ray spectral properties. ApJ 524, 674–683. doi:10.1086/307836
Eraerds, T., Antonelli, V., Davis, C., Hall, D., Hetherington, O., Holland, A., et al. (2021). Enhanced simulations on the athena/wide field imager instrumental background. J. Astronomical Telesc. Instrum. Syst. 7, 034001. doi:10.1117/1.JATIS.7.3.034001
Euclid Collaboration Moneti, A., McCracken, H. J., Shuntov, M., Kauffmann, O. B., Capak, P., et al. (2022). Euclid preparation. XVII. Cosmic dawn survey: spitzer space telescope observations of the Euclid deep fields and calibration fields. A&A 658, A126. doi:10.1051/0004-6361/202142361
Gandhi, P., and Fabian, A. C. (2003). X-ray background synthesis: the infrared connection. MNRAS 339, 1095–1102. doi:10.1046/j.1365-8711.2003.06259.x
Gandhi, P., Fabian, A. C., Suebsuwong, T., Malzac, J., Miniutti, G., and Wilman, R. J. (2007). Constraints on light bending and reflection from the hard X-ray background. MNRAS 382, 1005–1018. doi:10.1111/j.1365-2966.2007.12462.x
Gehrels, N. (1986). Confidence limits for small numbers of events in astrophysical data. ApJ 303, 336. doi:10.1086/164079
Giacconi, R., Gursky, H., Paolini, F. R., and Rossi, B. B. (1962). Evidence for x rays from sources outside the solar system. Phys. Rev. Lett. 9, 439–443. doi:10.1103/PhysRevLett.9.439
Gilli, R., Comastri, A., and Hasinger, G. (2007). The synthesis of the cosmic X-ray background in the Chandra and XMM-Newton era. A&A 463, 79–96. doi:10.1051/0004-6361:20066334
Goulding, A. D., Greene, J. E., Setton, D. J., Labbe, I., Bezanson, R., Miller, T. B., et al. (2023). UNCOVER: the growth of the first massive black holes from JWST/NIRSpec-Spectroscopic redshift confirmation of an X-ray luminous AGN at z = 10.1. ApJL 955, L24. doi:10.3847/2041-8213/acf7c5
Harikane, Y., Zhang, Y., Nakajima, K., Ouchi, M., Isobe, Y., Ono, Y., et al. (2023). JWST/NIRSpec first census of broad-line AGNs at z=4-7: detection of 10 faint AGNs with M_BH106-107 M_sun and their host galaxy properties. arXiv. doi:10.48550/arXiv.2303.11946
Harrison, C. M. (2017). Impact of supermassive black hole growth on star formation. Nat. Astron. 1, 0165. doi:10.1038/s41550-017-0165
Harrison, F. A., Aird, J., Civano, F., Lansbury, G., Mullaney, J. R., Ballantyne, D. R., et al. (2016). The NuSTAR extragalactic surveys: the number counts of active galactic nuclei and the resolved fraction of the cosmic X-ray background. ApJ 831, 185. doi:10.3847/0004-637X/831/2/185
Harrison, F. A., Craig, W. W., Christensen, F. E., Hailey, C. J., Zhang, W. W., Boggs, S. E., et al. (2013). The nuclear spectroscopic telescope array (NuSTAR) high-energy X-ray mission. ApJ 770, 103. doi:10.1088/0004-637X/770/2/103
Hasinger, G., Miyaji, T., and Schmidt, M. (2005). Luminosity-dependent evolution of soft X-ray selected AGN. New Chandra and XMM-Newton surveys. A&A 441, 417–434. doi:10.1051/0004-6361:20042134
Hickox, R. (2024). PEARLS: NuSTAR and XMM-Newton extragalactic survey of the JWST North Ecliptic Pole time-domain field II. arXiv.
Hickox, R. C., and Markevitch, M. (2006). Absolute measurement of the unresolved cosmic X-ray background in the 0.5-8 keV band with Chandra. ApJ 645, 95–114. doi:10.1086/504070
Jansen, F., Lumb, D., Altieri, B., Clavel, J., Ehle, M., Erd, C., et al. (2001). XMM-Newton observatory. I. The spacecraft and operations. A&A 365, L1–L6. doi:10.1051/0004-6361:20000036
Kammoun, E., Lohfink, A. M., Masterson, M., Wilkins, D. R., Zhao, X., Baloković, M., et al. (2023). The High Energy X-ray Probe (HEX-P): probing the physics of the X-ray corona in active galactic nuclei. arXiv. doi:10.48550/arXiv.2311.04679
Kirkpatrick, A., Yang, G., Le Bail, A., Troiani, G., Bell, E. F., Cleri, N. J., et al. (2023). CEERS key paper VII: JWST/MIRI reveals a faint population of galaxies at cosmic noon unseen by spitzer. arXiv. doi:10.48550/arXiv.2308.09750
Kollmeier, J. A., Zasowski, G., Rix, H.-W., Johns, M., Anderson, S. F., Drory, N., et al. (2017). SDSS-V: pioneering panoptic spectroscopy. arXiv. doi:10.48550/arXiv.1711.03234
Lansbury, G. B., Alexander, D. M., Aird, J., Gandhi, P., Stern, D., Koss, M., et al. (2017a). The NuSTAR serendipitous survey: hunting for the most extreme obscured AGN at >10 keV. ApJ 846, 20. doi:10.3847/1538-4357/aa8176
Lansbury, G. B., Stern, D., Aird, J., Alexander, D. M., Fuentes, C., Harrison, F. A., et al. (2017b). TheNuSTARSerendipitous survey: the 40-month catalog and the properties of the distant high-energy x-ray source population. Astrophysical J. 836, 99. doi:10.3847/1538-4357/836/1/99
Lanzuisi, G., Civano, F., Marchesi, S., Comastri, A., Brusa, M., Gilli, R., et al. (2018). The Chandra COSMOS legacy survey: Compton thick AGN at high redshift. MNRAS 480, 2578–2592. doi:10.1093/mnras/sty2025
Luo, B., Brandt, W. N., Xue, Y. Q., Lehmer, B., Alexander, D. M., Bauer, F. E., et al. (2017). The Chandra deep field-south survey: 7 Ms source catalogs. ApJS 228, 2. doi:10.3847/1538-4365/228/1/2
Madsen, K. K., García, J. A., Stern, D., Armini, R., Basso, S., Coutinho, D., et al. (2023). The high energy X-ray probe (HEX-P): instrument and mission profile. arXiv. doi:10.48550/arXiv.2312.04678
Maiolino, R., Scholtz, J., Curtis-Lake, E., Carniani, S., Baker, W., de Graaff, A., et al. (2023a). JADES. The diverse population of infant Black Holes at 4<z<11: merging, tiny, poor, but mighty. arXiv. doi:10.48550/arXiv.2308.01230
Maiolino, R., Scholtz, J., Witstok, J., Carniani, S., D’Eugenio, F., de Graaff, A., et al. (2023b). A small and vigorous black hole in the early Universe. arXiv:2305.12492. doi:10.48550/arXiv.2305.12492
Marchesi, S., Ajello, M., Marcotulli, L., Comastri, A., Lanzuisi, G., and Vignali, C. (2018). Compton-thick AGNs in the NuSTAR era. ApJ 854, 49. doi:10.3847/1538-4357/aaa410
Marchesi, S., Ajello, M., Zhao, X., Comastri, A., La Parola, V., and Segreto, A. (2019). Compton-thick AGNs in the NuSTAR era. V. Joint NuSTAR and XMM-Newton spectral analysis of three “soft-gamma” candidate CT-AGNs in the swift/BAT 100-month catalog. ApJ 882, 162. doi:10.3847/1538-4357/ab340a
Marchesi, S., Civano, F., Elvis, M., Salvato, M., Brusa, M., Comastri, A., et al. (2016a). The Chandra COSMOS Legacy survey: optical/IR identifications. ApJ 817, 34. doi:10.3847/0004-637X/817/1/34
Marchesi, S., Gilli, R., Lanzuisi, G., Dauser, T., Ettori, S., Vito, F., et al. (2020). Mock catalogs for the extragalactic X-ray sky: simulating AGN surveys with ATHENA and with the AXIS probe. A&A 642, A184. doi:10.1051/0004-6361/202038622
Marchesi, S., Lanzuisi, G., Civano, F., Iwasawa, K., Suh, H., Comastri, A., et al. (2016b). The Chandra COSMOS-legacy survey: source X-ray spectral properties. ApJ 830, 100. doi:10.3847/0004-637X/830/2/100
Marchesi, S., Tremblay, L., Ajello, M., Marcotulli, L., Paggi, A., Cusumano, G., et al. (2017). Chandra and NuSTAR follow-up observations of swift-BAT-selected AGNs. ApJ 848, 53. doi:10.3847/1538-4357/aa8ee6
Marcotulli, L., Ajello, M., Böttcher, M., Coppi, P., Costamante, L., Di Gesu, L., et al. (2023). The High Energy X-ray Probe (HEX-P): the most powerful jets through the lens of a superb X-ray eye. arXiv. doi:10.48550/arXiv.2311.04801
Masini, A., Civano, F., Comastri, A., Fornasini, F., Ballantyne, D. R., Lansbury, G. B., et al. (2018a). The NuSTAR extragalactic surveys: source catalog and the compton-thick fraction in the UDS field. ApJS 235, 17. doi:10.3847/1538-4365/aaa83d
Masini, A., Comastri, A., Civano, F., Hickox, R. C., Carroll, C. M., Suh, H., et al. (2018b). The NuSTAR extragalactic surveys: unveiling rare, buried AGNs and detecting the contributors to the peak of the cosmic X-ray background. ApJ 867, 162. doi:10.3847/1538-4357/aae539
Mateos, S., Alonso-Herrero, A., Carrera, F. J., Blain, A., Severgnini, P., Caccianiga, A., et al. (2013). Uncovering obscured luminous AGN with WISE. MNRAS 434, 941–955. doi:10.1093/mnras/stt953
Meidinger, N., Albrecht, S., Beitler, C., Bonholzer, M., Emberger, V., Frank, J., et al. (2020). “Development status of the wide field imager instrument for Athena,” in Space Telescopes and Instrumentation 2020: Ultraviolet to Gamma Ray. Editors J-W. A. den Herder, S. Nikzad, and K. Nakazawa (Society of Photo-Optical Instrumentation Engineers SPIE 11444), 114440T. Available at: https://ui.adsabs.harvard.edu/abs/2020SPIE11444E.0TM. doi:10.1117/12.2560507
Moretti, A., Campana, S., Lazzati, D., and Tagliaferri, G. (2003). The resolved fraction of the cosmic X-ray background. ApJ 588, 696–703. doi:10.1086/374335
Moretti, A., Vattakunnel, S., Tozzi, P., Salvaterra, R., Severgnini, P., Fugazza, D., et al. (2012). Spectrum of the unresolved cosmic X-ray background: what is unresolved 50 years after its discovery. A&A 548, A87. doi:10.1051/0004-6361/201219921
Mullaney, J. R., Del-Moro, A., Aird, J., Alexander, D. M., Civano, F. M., Hickox, R. C., et al. (2015). The NuSTAR extragalactic surveys: initial results and catalog from the extended Chandra deep field south. ApJ 808, 184. doi:10.1088/0004-637X/808/2/184
Mushotzky, R. F., Cowie, L. L., Barger, A. J., and Arnaud, K. A. (2000). Resolving the extragalactic hard X-ray background. Nature 404, 459–464. doi:10.1038/35006564
Nandra, K., Barret, D., Barcons, X., Fabian, A., den Herder, J.-W., Piro, L., et al. (2013). The hot and energetic universe: a white paper presenting the science theme motivating the Athena+ mission. arXiv. doi:10.48550/arXiv.1306.2307
National Academies of Sciences, Engineering, and Medicine (2021). Pathways to discovery in astronomy and astrophysics for the 2020s. Washington, DC: The National Academies Press. doi:10.17226/26141
Ni, Y., Di Matteo, T., Bird, S., Croft, R., Feng, Y., Chen, N., et al. (2022). The ASTRID simulation: the evolution of supermassive black holes. MNRAS 513, 670–692. doi:10.1093/mnras/stac351
Oh, K., Koss, M., Markwardt, C. B., Schawinski, K., Baumgartner, W. H., Barthelmy, S. D., et al. (2018). The 105-month swift-BAT all-sky hard x-ray survey. Astrophysical J. Suppl. Ser. 235, 4. doi:10.3847/1538-4365/aaa7fd
Padmanabhan, H., and Loeb, A. (2023). Constraining the AGN luminosity function from JWST with the X-ray Background. arXiv. doi:10.48550/arXiv.2310.08633
Park, T., Kashyap, V. L., Siemiginowska, A., van Dyk, D. A., Zezas, A., Heinke, C., et al. (2006). Bayesian estimation of hardness ratios: modeling and computations. ApJ 652, 610–628. doi:10.1086/507406
Peca, A., Cappelluti, N., Urry, C. M., LaMassa, S., Marchesi, S., Ananna, T. T., et al. (2023). On the cosmic evolution of AGN obscuration and the X-ray luminosity function: XMM-Newton and Chandra spectral analysis of the 31.3 deg2 stripe 82X. ApJ 943, 162. doi:10.3847/1538-4357/acac28
Pfeifle, R. W., Boorman, P. G., Weaver, K. A., Buchner, J., Civano, F., Madsen, K., et al. (2023). The high energy X-ray probe (HEX-P): the future of hard X-ray dual AGN science. arXiv. doi:10.48550/arXiv.2311.05154
Piotrowska, J. M., García, J. A., Walton, D. J., Beckmann, R. S., Stern, D., Ballantyne, D. R., et al. (2023). The high energy X-ray probe (HEX-P): constraining supermassive black hole growth with population spin measurements. arXiv. doi:10.48550/arXiv.2311.04752
Ranalli, P., Comastri, A., and Setti, G. (2005). The X-ray luminosity function and number counts of spiral galaxies. A&A 440, 23–37. doi:10.1051/0004-6361:20042598
Ricci, C., Trakhtenbrot, B., Koss, M. J., Ueda, Y., Del Vecchio, I., Treister, E., et al. (2017). BAT AGN spectroscopic survey. V. X-ray properties of the swift/BAT 70-month AGN catalog. ApJS 233, 17. doi:10.3847/1538-4365/aa96ad
Ricci, C., Ueda, Y., Koss, M. J., Trakhtenbrot, B., Bauer, F. E., and Gandhi, P. (2015). Compton-thick accretion in the local universe. ApJL 815, L13. doi:10.1088/2041-8205/815/1/L13
Rossland, S., Wik, D. R., Grefenstette, B., Cappelluti, N., Civano, F., Gastaldello, F., et al. (2023). Measuring the cosmic X-ray background in 3-20 KeV with stray light from NuSTAR. AJ 166, 20. doi:10.3847/1538-3881/acd0ae
Scolnic, D. M., Lochner, M., Gris, P., Regnault, N., Hložek, R., Aldering, G., et al. (2018). Optimizing the LSST observing strategy for dark energy science: DESC recommendations for the deep drilling fields and other special programs. arXiv. doi:10.48550/arXiv.1812.00516
Silver, R., Torres-Albà, N., Zhao, X., Marchesi, S., Pizzetti, A., Cox, I., et al. (2023). A machine learning algorithm for reliably predicting active galactic nucleus absorbing column densities. A&A 675, A65. doi:10.1051/0004-6361/202345980
Stern, D., Assef, R. J., Benford, D. J., Blain, A., Cutri, R., Dey, A., et al. (2012). Mid-infrared selection of active galactic nuclei with the wide-field infrared survey explorer. I. Characterizing WISE-selected active galactic nuclei in COSMOS. ApJ 753, 30. doi:10.1088/0004-637X/753/1/30
Stern, D., Eisenhardt, P., Gorjian, V., Kochanek, C. S., Caldwell, N., Eisenstein, D., et al. (2005). Mid-infrared selection of active galaxies. ApJ 631, 163–168. doi:10.1086/432523
Stern, D., Lansbury, G. B., Assef, R. J., Brandt, W. N., Alexander, D. M., Ballantyne, D. R., et al. (2014). NuSTAR and XMM-Newton observations of luminous, heavily obscured, WISE-selected quasars at z ˜2. ApJ 794, 102. doi:10.1088/0004-637X/794/2/102
Torres-Albà, N., Marchesi, S., Zhao, X., Ajello, M., Silver, R., Ananna, T. T., et al. (2021). Compton-thick AGN in the NuSTAR era VI: the observed compton-thick fraction in the local universe. arXiv.
Tozzi, P., Rosati, P., Nonino, M., Bergeron, J., Borgani, S., Gilli, R., et al. (2001). New results from the X-ray and optical survey of the Chandra deep field-south: the 300 kilosecond exposure. II. ApJ 562, 42–51. doi:10.1086/322492
Treister, E., Urry, C. M., and Virani, S. (2009). The space density of compton-thick active galactic nucleus and the X-ray background. ApJ 696, 110–120. doi:10.1088/0004-637X/696/1/110
Troxel, M. A., Lin, C., Park, A., Hirata, C., Mandelbaum, R., Jarvis, M., et al. (2023). A joint Roman Space Telescope and Rubin Observatory synthetic wide-field imaging survey. MNRAS 522, 2801–2820. doi:10.1093/mnras/stad664
Ueda, Y., Akiyama, M., Hasinger, G., Miyaji, T., and Watson, M. G. (2014). Toward the standard population synthesis model of the X-ray background: evolution of X-ray luminosity and absorption functions of active galactic nuclei including compton-thick populations. ApJ 786, 104. doi:10.1088/0004-637X/786/2/104
Ueda, Y., Takahashi, T., Inoue, H., Tsuru, T., Sakano, M., Ishisaki, Y., et al. (1999). LOG N-log S relations and spectral properties of sources from the ASCA large sky survey: their implications for the origin of the cosmic X-ray background (CXB). ApJ 518, 656–671. doi:10.1086/307291
Vasudevan, R. V., Fabian, A. C., Reynolds, C. S., Aird, J., Dauser, T., and Gallo, L. C. (2016). A selection effect boosting the contribution from rapidly spinning black holes to the cosmic X-ray background. MNRAS 458, 2012–2023. doi:10.1093/mnras/stw363
Vito, F., Brandt, W. N., Yang, G., Gilli, R., Luo, B., Vignali, C., et al. (2018). High-redshift AGN in the Chandra Deep Fields: the obscured fraction and space density of the sub-L* population. MNRAS 473, 2378–2406. doi:10.1093/mnras/stx2486
Vito, F., Gilli, R., Vignali, C., Comastri, A., Brusa, M., Cappelluti, N., et al. (2014). The hard X-ray luminosity function of high-redshift (3 < z ≤ 5) active galactic nuclei. MNRAS 445, 3557–3574. doi:10.1093/mnras/stu2004
Worsley, M. A., Fabian, A. C., Bauer, F. E., Alexander, D. M., Hasinger, G., Mateos, S., et al. (2005). The unresolved hard X-ray background: the missing source population implied by the Chandra and XMM-Newton deep fields. MNRAS 357, 1281–1287. doi:10.1111/j.1365-2966.2005.08731.x
Xue, Y. Q., Wang, S. X., Brandt, W. N., Luo, B., Alexander, D. M., Bauer, F. E., et al. (2012). Tracking down the source population responsible for the unresolved cosmic 6-8 keV background. ApJ 758, 129. doi:10.1088/0004-637X/758/2/129
Yan, W., Brandt, W. N., Zou, F., Zhu, S., Chen, C.-T. J., Hickox, R. C., et al. (2023). The most obscured AGNs in the XMM-SERVS fields. ApJ 951, 27. doi:10.3847/1538-4357/accea6
Yan, W., Hickox, R. C., Hainline, K. N., Stern, D., Lansbury, G., Alexander, D. M., et al. (2019). NuSTAR and keck observations of heavily obscured quasars selected by WISE. ApJ 870, 33. doi:10.3847/1538-4357/aaeed4
Yung, L. Y. A., Somerville, R. S., Finkelstein, S. L., Behroozi, P., Davé, R., Ferguson, H. C., et al. (2023). Semi-analytic forecasts for Roman - the beginning of a new era of deep-wide galaxy surveys. MNRAS 519, 1578–1600. doi:10.1093/mnras/stac3595
Zappacosta, L., Comastri, A., Civano, F., Puccetti, S., Fiore, F., Aird, J., et al. (2018). The NuSTAR extragalactic surveys: X-ray spectroscopic analysis of the bright hard-band selected sample. ApJ 854, 33. doi:10.3847/1538-4357/aaa550
Zhao, X., Civano, F., Willmer, C. N. A., Bonoli, S., Chen, C.-T., Creech, S., et al. (2024). PEARLS: nuSTAR and XMM-Newton extragalactic survey of the JWST north ecliptic pole time-domain field II. arXiv e-prints, arXiv:2402.13508. doi:10.48550/arXiv.2402.13508
Keywords: X-ray, surveys, AGN, obscuration, models, cosmic X-ray background, Compton-thick
Citation: Civano F, Zhao X, Boorman PG, Marchesi S, Ananna T, Creech S, Chen C-T, Hickox RC, Stern D, Madsen K, García JA, Silver R, Aird J, Alexander DM, Baloković M, Brandt WN, Buchner J, Gandhi P, Kammoun E, LaMassa S, Lanzuisi G, Merloni A, Moretti A, Nandra K, Nardini E, Pizzetti A, Puccetti S, Pfeifle RW, Ricci C, Spiga D and Torres-Albà N (2024) The high energy X-ray probe (HEX-P): bringing the cosmic X-ray background into focus. Front. Astron. Space Sci. 11:1340719. doi: 10.3389/fspas.2024.1340719
Received: 18 November 2023; Accepted: 26 February 2024;
Published: 18 March 2024.
Edited by:
Daniel Stern, NASA Jet Propulsion Laboratory (JPL), United StatesReviewed by:
Zhiyuan Ma, University of Massachusetts Amherst, United StatesMartin Hardcastle, University of Hertfordshire, United Kingdom
Copyright © 2024 Civano, Zhao, Boorman, Marchesi, Ananna, Creech, Chen, Hickox, Stern, Madsen, García, Silver, Aird, Alexander, Baloković, Brandt, Buchner, Gandhi, Kammoun, LaMassa, Lanzuisi, Merloni, Moretti, Nandra, Nardini, Pizzetti, Puccetti, Pfeifle, Ricci, Spiga and Torres-Albà. This is an open-access article distributed under the terms of the Creative Commons Attribution License (CC BY). The use, distribution or reproduction in other forums is permitted, provided the original author(s) and the copyright owner(s) are credited and that the original publication in this journal is cited, in accordance with accepted academic practice. No use, distribution or reproduction is permitted which does not comply with these terms.
*Correspondence: F. Civano, ZnJhbmNlc2NhLm0uY2l2YW5vQG5hc2EuZ292