 Peng Zou
 Chaowei Jiang
 Xinkai Bian
 Juntao Wang2,3
- 1Shenzhen Key Laboratory of Numerical Prediction for Space Storm, Institute of Space Science and Applied Technology, Harbin Institute of Technology, Shenzhen, China
- 2Institute of Space Science and Applied Technology, Harbin Institute of Technology, Shenzhen, China
- 3School of Physical Science and Technology, Lingnan Normal University, Zhanjiang, China
Introduction: The triggering mechanism for filaments located in a weak magnetic field typically leans toward magnetohydrodynamic instabilities due to the weak magnetic strength inherent in filament structures. However, a subset of eruption events associated with significant flares remains. Therefore, we seek to understand the role that reconnection plays in the eruption of filaments with weak magnetic fields.
Methods: We reconstruct the coronal magnetic field of an eruptive filament located in a relatively weaker magnetic environment, and analyze the magnetic field properties such as twist number and squashing factor.
Results: This filament remains stable until the expansion of the heated bright arcades underneath. This expansion initially activates the filament, prompting its upward movement, leading to a gentle reconnection slightly to its south. The ensuing reconnection continues to propel the filament upward with uniform acceleration. These upward motions cause the drainage of filament mass, likely activating the torus instability of the filament. This torus instability then triggers the final eruption of the filament, successfully generating a coronal mass ejection (CME) and leaving behind a double-ribbon flare.
Discussion: We conclude that the torus instability serves as the primary triggering mechanism of this eruption, while pre-eruption reconnection plays a role in pushing the filament upward to meet the instability condition.
1 Introduction
The triggering mechanisms of coronal mass ejections (CMEs) have been extensively investigated over several decades (Sakurai, 1976; van Ballegooijen and Martens, 1989; Antiochos et al., 1999; Chen and Shibata, 2000; Moore et al., 2001; Aulanier et al., 2010; Török and Kliem, 2005; Kliem and Török, 2006; Jiang et al., 2021). The CSHKP model, a tool to interpret observations, was developed through several studies (Carmichael, 1964; Sturrock, 1966; Hirayama, 1974; Kopp and Pneuman, 1976). This model describes that a magnetic flux rope (MFR) is activated in some manner, triggering an eruption. The MFR is ejected and becomes the CME, while the newly reconnected arcades underneath form the flare loops. Various mechanisms have been proposed to elucidate this triggering mechanism and explain why the evolution of the coronal magnetic field can lead to such massive eruptions. Some of these mechanisms effectively interpret observed eruption phenomena and the associated magnetic configurations, with numerical simulations providing supporting evidence for their efficacy in initiating eruptions. These mechanisms can be broadly categorized into two types: one dominated by magnetic reconnection and the other by the ideal magnetohydrodynamics (MHD) instability domain.
In the first type, the process of reconnection plays a key role in transforming magnetic energy into kinetic energy. Magnetic arcades undergo shearing near the polarity inversion line (PIL), accumulating substantial free magnetic energy. Subsequently, converging flows compel these arcades to reconnect with adjacent ones, forming a new magnetic flux rope (MFR). This MFR is then propelled into the higher corona, potentially leading to the generation of a CME. This mechanism is known as the tether-cutting model (Moore et al., 2001), where reconnection beneath the MFRs generates an upward force that sustains the propagation of MFRs. Reconnection can also occur above the MFRs, triggering CMEs as described by the breakout model (Antiochos et al., 1999). In this model, a continually sheared arcade underneath a quadrupole field pushes the null point of the quadrupole field, leading to reconnection. The reconnection weakens the constraining force of the sheared core field, allowing it to escape from the corona and become a CME.
However, some studies argue that magnetic reconnection alone is unlikely to be able to generate a CME (Aulanier et al., 2010; Zou et al., 2019a). MFRs may eject themselves through MHD instabilities, such as kink instability. This instability transforms the twist of the MFR into writhe, causing the axis of the MFR to rise and trigger further eruption when the twist is sufficiently high (Sakurai, 1976; Török et al., 2004). As the rising MFR crosses a height where the background field strength rapidly decreases, it breaks the constraint of the background field, leading to the generation of a CME. The theoretically critical rate of decrease in the background magnetic field strength, denoted as
In addition to these models, other factors influence the eruption of magnetic flux ropes (MFRs) or filaments. For example, the drainage of filament mass may disrupt the equilibrium of the filament structure (Fan, 2018; Jenkins et al., 2019), and inflows from the higher corona can disturb and even destabilize low-coronal structures when they approach the solar surface (Seaton et al., 2021).
Typically, these processes mainly unfold within active regions, where the core magnetic field possesses sufficient strength to overcome the constraining field, yielding ample free energy to sustain further propagation (Yashiro et al., 2005; Cheng et al., 2010; Jing et al., 2014; Duan et al., 2021). However, observations indicate that CMEs can originate not only from active regions but also from areas with weak magnetic fields (McCauley et al., 2015; Zou et al., 2019b). Additionally, a statistical examination of filament eruptions reveals that more eruptions occur in relatively quiescent areas, with approximately half ultimately evolving into CMEs (McCauley et al., 2015).
These eruptions exhibit different triggering mechanisms (Zou et al., 2019b). In the case of active region filaments, both instability and reconnection can serve as triggers for CMEs, with their probabilities being relatively similar. Conversely, magnetic reconnection appears to play a minor role for quiescent filaments. This is plausible, considering that the magnetic field in the quiescent sun is comparatively weaker than in active regions. It is noteworthy that quiescent flares can also produce flares higher than C-class, as exemplified by the well-known filament eruption on 31 August 2012. These occurrences are also documented in the statistical studies conducted by McCauley et al. (2015) and Zou et al. (2019b). The reduced magnetic field strength implies a weaker tension force generated by reconnection to propel the magnetic configuration. Consequently, reconnection tends to be less significant in the initiation of quiescent filament ejections, often occurring significantly later than the onset of the high-speed eruption phase (Zou et al., 2019b). This is supported by observations that flare onset lags obviously behind the filament acceleration.
However, some filament eruptions in the quiescent sun exhibit onset times very close to the flare starting time, aligning with the reconnection onset time (Zou et al., 2019b). For these events, it is challenging to unambiguously determine whether the trigger mechanism involves a reconnection process or a non-reconnection process. Nevertheless, reconnection evidently plays a considerable role in these eruptions, as indicated by previous studies; it is capable of initiating ejections, facilitating further propagation, and even interrupting eruptions (Moore et al., 2001; Antiochos et al., 1999; Jiang et al., 2021; Peng et al., 2022). The precise trigger mechanisms and the role of magnetic reconnection in filament eruptions located in relatively weaker magnetic fields, such as quiescent filaments and parts of intermediate filaments, remain an intriguing subject of investigation.
Due to challenges in reconstructing the coronal magnetic field in the quiescent sun, previous studies have faced difficulties in quantifying magnetic field characteristics, leading to ambiguity in diagnosing trigger mechanisms. In this study, we address this issue by employing an MHD relaxation model called the CESE-MHD-NLFFF code to extrapolate the magnetic configuration of an eruptive filament (Jiang and Feng, 2013). This model has been previously utilized for reconstructing several filaments within a weak magnetic environment, both quiescent filament and intermediate filament, demonstrating a close fit between the extrapolated configuration and the observed filament spine (Jiang et al., 2014; Peng et al., 2022). In this article, we performed an analysis of the eruption of a filament located in a weak active region. With the help of the extrapolated configuration, our investigation aims to unravel the eruptive mechanism of this filament, specifically exploring the role of magnetic reconnection in the eruption scenario.
The article is organized into the following sections. In Section 2, we present the data set and methods. Section 3 summarizes the evolution of the filament eruption and the related magnetic characteristics. Section 4 introduces a scenario to describe the eruption and discusses the role of reconnection in this event.
2 Data and method
The filament is situated in between active regions NOAA AR11480 and NOAA 11477, in a zone that, although not cataloged by NOAA as active, can be considered as a weak active region. It initiated its eruption around 23:00 UT and completed the eruption by approximately 23:40 UT on 11 May 2012. The Atmospheric Imaging Assembly (AIA) (Lemen et al., 2012) onboard the Solar Dynamics Observatory (SDO) effectively recorded this filament eruption in EUV filters. SDO/AIA has seven EUV filters, offering a pixel size of 0.6 arcsec per pixel and a cadence of 12 s.
To study the distribution of magnetic features and photosphere velocity and reconstruct the coronal magnetic field, we employed the magnetograms of the Helioseismic and Magnetic Imager (HMI) (Scherrer et al., 2012; Schou et al., 2012), also onboard the SDO. These magnetograms have a pixel size of 0.5 arcsec per pixel and a cadence of 45 s for line-of-sight (LOS) magnetograms, with a cadence of 720 s for vector magnetograms. The fact that the SDO team has produced Space-weather HMI Active Region Patch (SHARP) (Bobra et al., 2014) data for the region (HMI SHARP 1642) further supports our appreciation of this region as active. However, the SHARP area covers only the northern part of the filament and, therefore, cannot be used for our study. To encompass the entire filament structure, we utilized the full-disc vector magnetogram. Despite its difference from SHARPs, the HMI group provides programs to resolve the
It is noteworthy that the study area is within a weak active region for which many non-linear force-free field (NLFFF) codes fail to extrapolate the coronal field due to data uncertainties of the weak field. The CESE-MHD-NLFFF code appears to be the only method we have mastered that can reconstruct a coronal field in reasonable consistency with the observations in such weak field regions, as has been demonstrated in studies of a few events (Jiang et al., 2014; 2019; Duan et al., 2022; Peng et al., 2022). Hence, we employed the CESE-MHD-NLFFF extrapolation method to reconstruct the coronal magnetic field.
Using the reconstructed magnetic configuration, we calculated several parameters to quantify magnetic field characteristics. These parameters include the twist number and squashing factor of magnetic tubes, as well as the decay index of the background magnetic field overlying the filament. The twist number
where
3 Results
The SDO/AIA provides coverage of the entire structure and evolution of the observed eruption. This filament initiated its eruption at approximately 23:05 UT on 11 May 2012, resulting in a double-ribbon flare. Prior to the eruption, several notable phenomena were observed in connection with the filament, such as bright arcades beneath the middle section of the filament, seemingly rooted in the strongest magnetic polarities (see Figure 1, panels A and D). In addition, material draining from the filament spine was frequently observed in both footpoints (see Figure 2). The yellow slice indicates the drainage flow from the spine to the north footpoint of the filament, while the cyan slice indicates the drainage flow from the spine to the south footpoint.
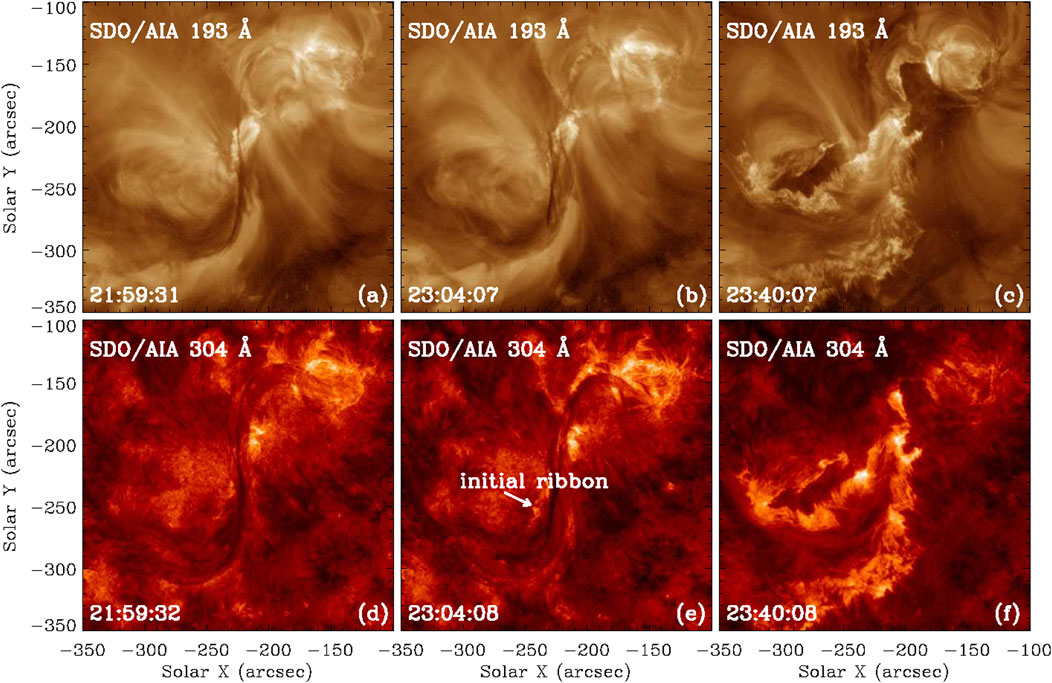
Figure 1. Multiple snapshots are presented to depict the progression of the filament in both 193 Å and 304 Å filters. The luminous arcades are clearly observable in panels (A, B). Additionally, the initial flare ribbons are highlighted with an arrow in panel (E).
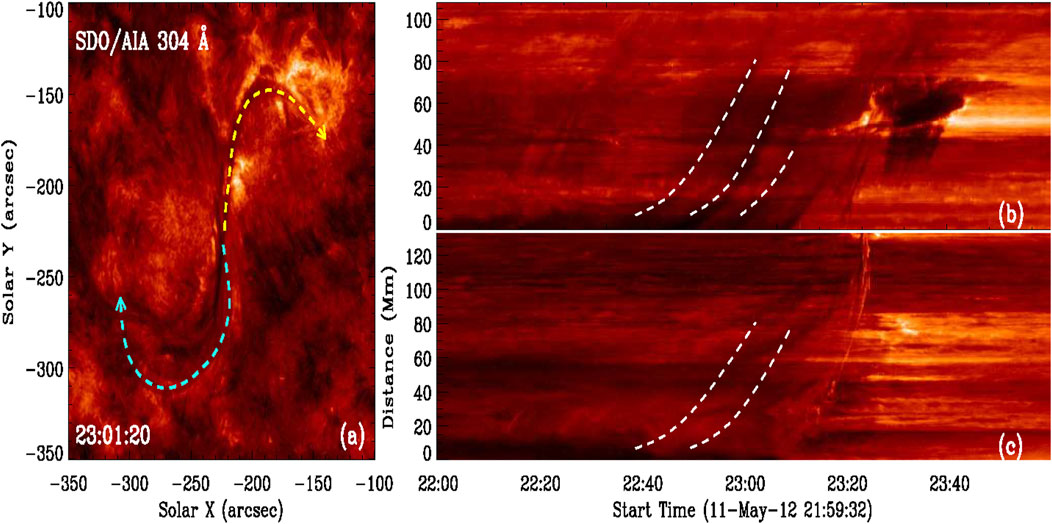
Figure 2. The time-distance map along the filament spine illustrates the drainage flows, detectable from approximately 22:37 UT onward. The arrows in panel (A) indicates the direction of the slices. The panel (B) displays the yellow slice, while the panel (C) showcases the cyan slice. The white dashed lines in the two panels on the right represent the flows along the slice, indicating the drainage flow of the filament spine.
To illustrate the complete trajectory of the eruption process, we selected a slice tracing the eruption direction to construct a time-distance map (depicted in Figure 3). Additionally, as we observed flare ribbons adjacent to the filament, we incorporated the soft X-ray (SXR) flux onto the map using a solid white line (Chamberlin et al., 2009). Notably, several fluctuations in the SXR flux were discernible. We endeavored to ascertain if these fluctuations corresponded to specific events and noted that the bright arcades beneath the filament were luminous during this period. Consequently, we delineated a box to compute the light curve, represented by a solid red line on the map. Upon comparison of these two lines, we observed that the light curve increase was almost synchronous with the SXR flux jump around 22:30 UT.
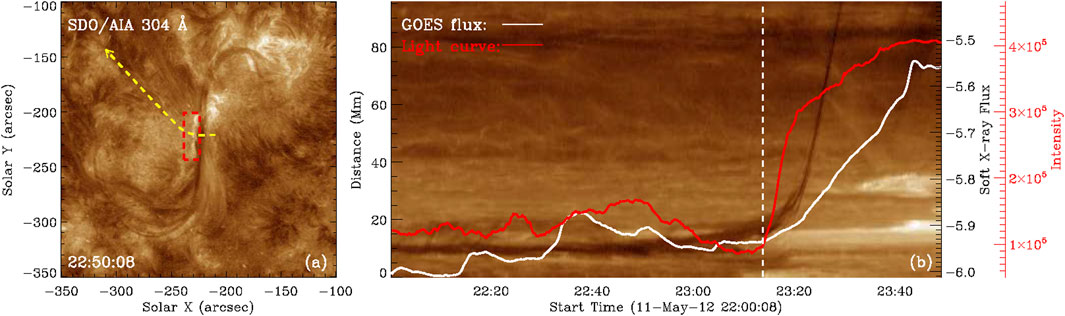
Figure 3. The trajectory of the time-distance map is presented in the panel (B), while the right panel displays the actual time-distance map. A white line is utilized in the time-distance map to illustrate the evolution of the GOES flux, and a red line is the light curve within the dashed red rectangle box shown in panel (A).
Furthermore, we estimated the approximate transverse velocities of the filament using the trajectory depicted in the time-distance map (shown in Figure 4). They are the derivation of each distance over time (using the central deference). Based on this velocity, we roughly divided the eruption process into four phases. The first is the stable phase, during which the filament remained nearly stable with minimal upward velocity. These velocities were likely caused by material oscillations. The next phase, the slow upraise phase, exhibited a very slight velocity, approximately 1 or 2 km
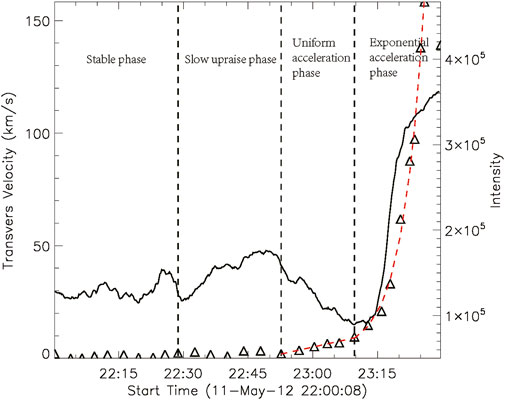
Figure 4. Comparing the light curve with the velocity derived from the time-distance map, the solid line depicts the intensity within the red box in the left panel of Figure 3, while the triangle symbol represents the velocity. Vertical black dashed lines divide the entire evolution into four phases based on velocity transients, and the red dashed lines represent the fitted lines for the velocity during the uniform acceleration phase and exponential acceleration phase.
As coronal activities are predominantly governed by the magnetic field, obtaining a comprehensive magnetic configuration of this filament is crucial for understanding the physics underlying its evolution, particularly the eruption event. In Figure 5, we present the magnetic configuration of the filament alongside the observations for comparison. As is well known, the filament materials are supported by twisted or arched magnetic tubes, and when they fill up the tubes, they will manifest as filament fibrils. Thus, the traced magnetic lines are used to represent the filament fibrils. As can be seen, most magnetic field lines (marked in magenta lines) align well with the structure of the filament. Notably, features such as the large hook-like structure with attached threads in the southern part of the filament and the straight spine in the middle are effectively captured by the extrapolated magnetic field lines. Despite some persistent disparities between the observed filament and extrapolated magnetic lines, two notable issues arise. First, the alignment discrepancy between the observed north footpoint and the extrapolated field lines suggests that the observed north filament footpoint originates from magnetic patches situated further westward. Second, the southern half of the filament spine is discernible, yet we encounter difficulty in tracing out a bundle of magnetic lines to replicate it accurately. These discrepancies likely stem from the presence of a weak magnetic field. It is worth noting that this filament is situated within a weak active region, with filament fibrils rooted in both strong and weak magnetic fields. However, the weak magnetic field exhibits a low signal-to-noise ratio, rendering the extrapolated field from weak magnetic sources unreliable. Consequently, we can only trace out those field lines rooted in the strong magnetic field and endeavor to select lines that closely match the observed fibrils. While we may not entirely replicate the filament structure, the traced magnetic lines still adequately align with the observed filament threads. Consequently, we believe this extrapolation can offer valuable insights into analyzing the triggering mechanism of the eruption.
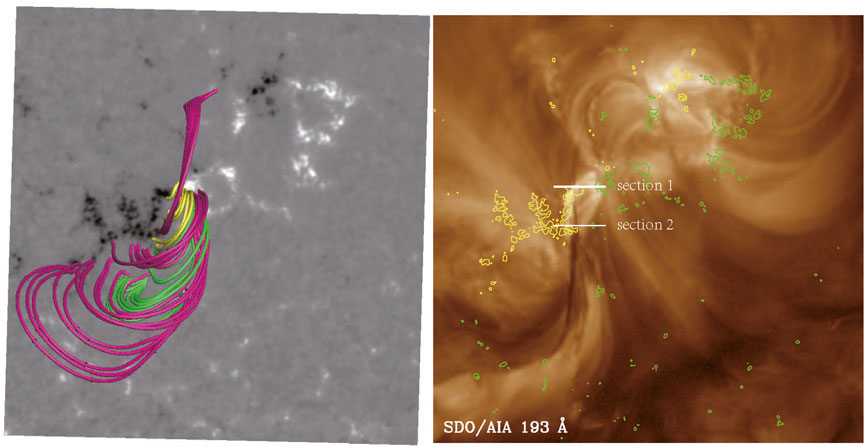
Figure 5. Comparison between the extrapolated magnetic field lines with the observed filament in the 193 Å filter: the magenta lines represent the filament arcades, the green lines depict the magnetic field lines associated with the initial flare ribbon, and the yellow lines indicate the bright arcades. The contours represent
Based on the observations, the initial detection of the corresponding intensity enhancement occurs south of the red box marked in Figure 3. Additionally, the traced magnetic lines appear to be discontinuous in this area. Therefore, we designate this area as the center, and the magnetic lines associated with the filament can be broadly classified into three bundles. The upper bundle extends from the north footpoint of the filament and roots in the strongest negative magnetic polarities. The middle bundle, which we mark using green lines in Figure 5, roots between the two strongest opposite polarities in the middle, and this bundle relates to the initial flare ribbons. The bottom bundle extends from the strongest positive polarities, forming a large hook-like structure. The previously mentioned bright arcades beneath the filament, marked in yellow in the figure, are well-fitted to the observed arcades. A side-view figure (see Figure 6) illustrates their height relative to the filament spine, revealing that the arcades are slightly below it. Additionally, we have chosen specific filament arcades delineated by green lines to illustrate the magnetic field lines associated with the initial intensity enhancement. These arcades are situated between the middle bundle and the south bundle.
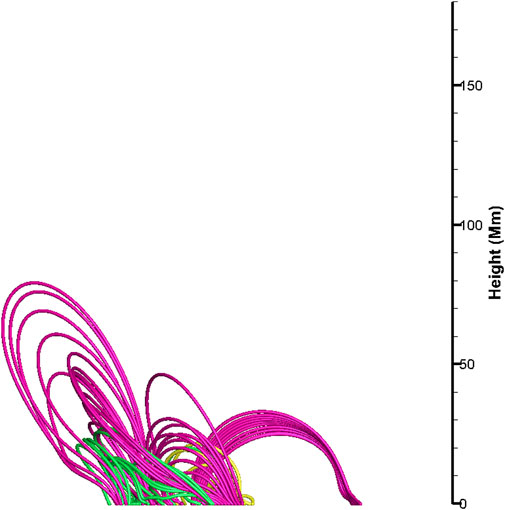
Figure 6. Displaying a lateral perspective of the extrapolated filament to illustrate the relative height relationship between the bright arcades and the filament spine.
As mentioned in Section 2, certain characteristic parameters indicate whether the magnetic configuration is in an unstable critical state. These parameters include the twist number of the filament spine and the decay index at the height of the filament axis. In Figure 7, we present a twist map of a longitudinal section in the middle part of the filament. The twist is relatively low, with most magnetic field lines of the filament exhibiting nearly one turn. Based on the observed filament, the filament should be a sinistral filament. According to Martin’s Rule (Martin et al., 1992) and its supplementary explanation by Chen et al. (2014), a sinistral filament is typically considered to have inverse polarity when threads exhibit left-bearing orientation, while right-bearing threads indicate normal polarity. In our scenario, the predominant left-bearing orientation suggests that the supporting magnetic structure is likely a magnetic flux rope (MFR). Thus, we hypothesize the existence of an axis within this filament, surrounded by a cluster of tightly twisted magnetic field lines, constituting the MFR. This flux rope likely extends from the north footpoint to the south footpoint of the filament. The magnetic lines traced out represent those enveloping the MFR. However, owing to the low signal-to-noise ratio, tracing magnetic lines from one footpoint to the other often results in accumulated errors, particularly when one footpoint is situated in a weak magnetic area or when magnetic lines are excessively lengthy. This discrepancy likely accounts for our inability to accurately replicate the entire filament spine within the extrapolated magnetic field.
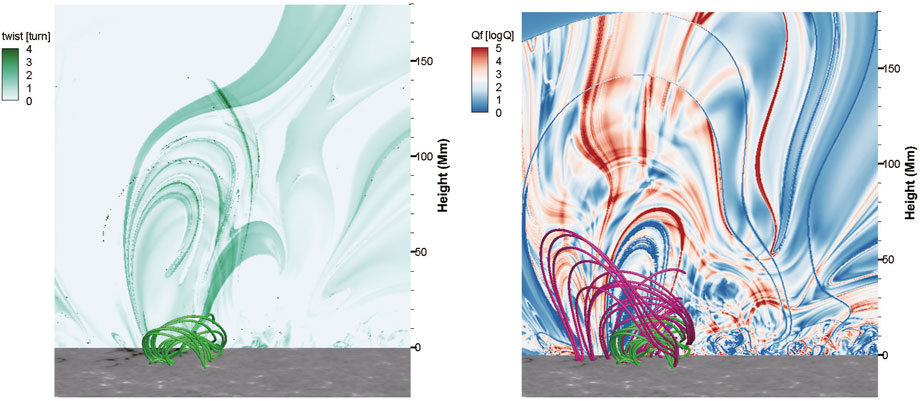
Figure 7. The twist map calculated using Equation 1 and the Q factor map pertain to a longitudinal section. In the Q factor map, only the green lines are displayed.
Similarly, in the squashing factor map presented in the next panel with the same location, the
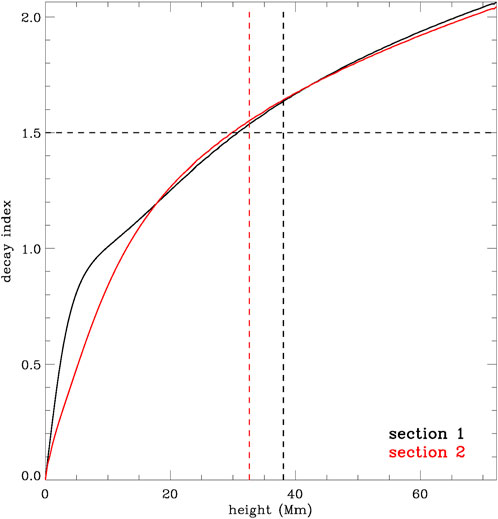
Figure 8. The evolution of the decay index with respect to height is depicted. Two vertical lines indicate the heights of two selected sections, while a horizontal line represents the threshold for triggering torus instability.
4 Discussion and conclusion
Solar eruptions have been extensively studied from both observational and theoretical perspectives (Sakurai, 1976; Moore et al., 2001; Török et al., 2004; Török and Kliem, 2005; Aulanier et al., 2010; Jiang et al., 2019; Zou et al., 2019a; Peng et al., 2022). However, there is a notable scarcity of research focusing on the eruptions of solar structures within weak magnetic environments. The challenges in coronal magnetic reconstruction limit our ability to determine the triggers for these eruptive phenomena. Nevertheless, recent statistical research emphasizes the significance of investigating quiescent solar eruptions to gain a comprehensive understanding of solar eruption dynamics (McCauley et al., 2015; Zou et al., 2019b).
Building on previous work utilizing the CESE-MHD-NLFFF model (Jiang et al., 2014; 2019; Duan et al., 2022; Peng et al., 2022), which has demonstrated its effectiveness in reconstructing structures rooted in the network field of weak active areas, we present a case study focusing on a filament located in a weak active region. In this study, we employ the model to reconstruct the complete body of the filament, utilizing extrapolated coronal magnetic field lines. Most of these reconstructed lines align well with the observed filament. We leverage this reconstructed configuration to conduct a detailed analysis of the trigger process leading to the eruption of this filament.
First, as discussed in Section 3, the eruption process is segmented into four phases. The initial phase transition triggers the activation of a nearly stable filament. This occurs several minutes after the intensity enhancement observed in the selected box in Figure 4, primarily induced by the east footpoint of the underlying arcades (refer to the attached movie). Consequently, the arcades experience heating, leading to filament activation. Thus, we posit that arcade heating initiates upward expansion, propelling the filament. This upward motion persists for more than 20 min, during which the arcade intensity peaks. At this peak, intensity enhancement spreads slightly southward from the arcade footpoint (as seen in the left panel of Figure 3). Shortly after this localized heating, the filament undergoes uniform acceleration. Previous studies have associated such parabolic height profiles, indicative of linear velocity profiles, with reconnection acceleration processes (Lynch et al., 2004). Hence, we infer that the new heating patch signifies magnetic reconnection, likely associated with the green lines delineated in Figure 5. These green lines originate from the bright patch within an area exhibiting relatively high quashing factor values (refer to the Q value map in Figure 7). However, this reconnection is too subtle to elicit corresponding changes in the SXR flux. Approximately 15 min later, the velocity undergoes an impulsive increase, with acceleration rising in tandem with filament height, as noted by Mierla et al. (2013). This velocity increase aligns well with an exponential function, consistent with previous assertions linking such evolution to torus instability or kink instability (Török and Kliem, 2005; Kliem and Török, 2006). Although no kink motions are discernible in the observations, we posit that this phase likely results from torus instability. Subsequently, after the filament attains sufficient height, reconnection propagates throughout, leading to an impulsive increase in SXR flux, indicative of flare formation. Such forced reconnections by filament eruptions are also reported by Srivastava et al. (2021).
This discussion depicts the inferred scenario of the eruption process based on observations. However, several aspects warrant clarification. First, what constitutes the primary triggering mechanism for the ultimate eruption? In our interpretation, both reconnection and instability play pivotal roles in driving the final eruption. In the statistical analysis by Zou et al. (2019b), the authors assert that magnetic reconnection triggers the eruption, as its onset slightly precedes that of the flare. They employ an equation featuring linear and exponential forms to model the eruption trajectory. As their fitting function lacks piecewise characteristics, they set the eruption onset when the gradient (i.e., velocity) reaches twice the initial gradient. Conversely, our detailed analysis reveals a specific time point in the velocity evolution where velocity shifts from linear to impulsive. This transition suggests that reconnection (during the uniform acceleration phase) maintains a slow acceleration, potentially insufficient to sustain further filament eruption. Conversely, the impulsive phase, synonymous with the eruption phase, accelerates the filament to significantly higher velocities. In fact, it is not uncommon for the impulsive increase in velocity to correlate well with the impulsive increase in SXR flux (Zhang et al., 2004). However, in certain events like this one, the impulsive increase in velocity or height precedes the impulsive increase in SXR flux by several minutes. In such cases, we believe that instability is more likely to trigger the eruption than reconnection. Consequently, we posit that torus instability, associated with the impulsive phase, serves as the primary triggering mechanism. Thus, the second aspect pertains to the role of magnetic reconnection. Based on the observational analysis, we believe the initial reconnection (related to the small bright patch observed south of the east footpoint of the bright arcade) plays a crucial role in initiating filament ascent and ultimately triggering instability, akin to the scenario outlined by Cheng et al. (2023). However, regarding the second reconnection, namely, the flare, delineating its specific contribution is challenging. Unlike active region filaments, quiescent filaments can erupt successfully without discernible reconnection signatures, as observed in the datasets of McCauley et al. (2015) and Zou et al. (2019b). Upon examining the database of McCauley et al. (2015), we find that among quiescent filaments and polar crown filaments accompanied by flares (75 identified events), only 10% fail to produce CMEs. In contrast, approximately 36% of identified quiescent filaments and polar crown filaments do not result in CMEs. This leads us to infer that the flare or reconnection during the rapid rise phase likely contributes positively to CME formation, possibly through mechanisms such as the second reconnection in the tether-cutting model (Moore et al., 2001), which cut off the constraining field above, or via reconnection in the BASIC model (Jiang et al., 2021), which furnishes an upward tension force.
The third aspect pertains to how the torus instability is triggered. In the extrapolation presented earlier, the results indicate that the magnetic field lines we traced exhibit low twist, while torus instability typically correlates with magnetic flux ropes (MFRs) characterized by higher twist. Here, we propose two potential explanations. First, as mentioned in Section 3, it is plausible that an MFR is embedded within the magnetic lines depicted in Figure 5, although it may be undetectable due to the limitations of extrapolation in weak magnetic fields. Secondly, if the extrapolation is accurate, the MFR could form after the initial reconnection between the sheared arcades involved in the filament, thereby meeting the conditions for triggering torus instability. The formation of magnetic flux ropes through this type of reconnection has been achieved in the simulations of Jiang et al. (2021) and Bian et al. (2022). Thus, in either scenario, the establishment of an MFR is conceivable. However, this raises the question: why is the filament that is already under the torus unstable before the instability is actually triggered? In the case of the second inference, it is conceivable that the gradual process of reconnection requires time to form the MFR. Regarding the first inference, we propose that the observed drainage at both footpoints plays a key role. Simulations conducted by Fan (2018) and Zhang et al. (2021) suggest that the mass contained within the filament significantly influences the equilibrium of MFRs. Thus, we think the drainage would attenuate gravity and activate the instability.
In conclusion, we present a comprehensive scenario elucidating the evolution of the filament eruption process and the GOES flux curve. This narrative outlines the collaborative action of two mechanisms, namely, magnetic reconnection and torus instability, throughout the entire process of a filament eruption within a weak active region. Filaments characterized by weak magnetic fields seldom erupt through reconnection processes (Zou et al., 2019b). In our study, we confirm that the triggering mechanism of this eruptive filament is the torus instability. There should be two reconnections similar to the scenario described by Moore et al. (2001). The first reconnection is very gentle but forces the filament upward and triggers the torus instability. The second reconnection, corresponding to the flare, may contribute positively to the formation of the CME. This result contradicts the findings of Zou et al. (2019b). Therefore, we believe that a more detailed analysis is needed to confirm whether those filaments can be triggered by reconnection for filaments within the relatively weaker magnetic environment, where it can be difficult to distinguish the contribution of reconnection or instability.
Data availability statement
The raw data supporting the conclusions of this article will be made available by the authors, without undue reservation.
Author contributions
PZ: conceptualization, investigation, writing–original draft, writing–review and editing. CJ: funding acquisition, methodology, software, writing–review and editing. XB: methodology, writing–review and editing. JW: funding acquisition, writing–review and editing.
Funding
The author(s) declare that financial support was received for the research, authorship, and/or publication of this article. This work is supported by the National Natural Science Foundation of China (NSFC 12003005, 42174200), the Shenzhen Key Laboratory Launching Project (No. ZDSYS20210702140800001), and the Guangdong Basic and Applied Basic Research Foundation (2023B1515040021). Data from observations are courtesy of NASA SDO science teams.
Conflict of interest
The authors declare that the research was conducted in the absence of any commercial or financial relationships that could be construed as a potential conflict of interest.
Publisher’s note
All claims expressed in this article are solely those of the authors and do not necessarily represent those of their affiliated organizations, or those of the publisher, the editors and the reviewers. Any product that may be evaluated in this article, or claim that may be made by its manufacturer, is not guaranteed or endorsed by the publisher.
Supplementary material
The Supplementary Material for this article can be found online at: https://www.frontiersin.org/articles/10.3389/fspas.2024.1369362/full#supplementary-material
References
Antiochos, S. K., DeVore, C. R., and Klimchuk, J. A. (1999). A model for solar coronal mass ejections. ApJ 510, 485–493. doi:10.1086/306563
Aulanier, G., Török, T., Démoulin, P., and DeLuca, E. E. (2010). ApJ 708, 314–333. doi:10.1088/0004-637x/708/1/314
Bian, X., Jiang, C., Feng, X., Zuo, P., Wang, Y., and Wang, X. (2022). Numerical simulation of a fundamental mechanism of solar eruption with a range of magnetic flux distributions. A& 658, A174. doi:10.1051/0004-6361/202141996
Bobra, M. G., Sun, X., Hoeksema, J. T., Turmon, M., Liu, Y., Hayashi, K., et al. (2014). The helioseismic and magnetic imager (HMI) vector magnetic field pipeline: SHARPs – space-weather HMI active region patches. SoPh 289, 3549–3578. doi:10.1007/s11207-014-0529-3
Chamberlin, P. C., Woods, T. N., Eparvier, F. G., and Jones, A. R. (2009). in Society of photo-optical instrumentation engineers (SPIE) conference series. Solar physics and Space weather instrumentation. Editors S. Fineschi, and J. A. Fennelly, III.743802
Chen, P. F., and Shibata, K. (2000). An emerging flux trigger mechanism for coronal mass ejections. APJ 545, 524–531. doi:10.1086/317803
Cheng, X., Xing, C., Aulanier, G., Solanki, S. K., Peter, H., and Ding, M. D. (2023). Deciphering the slow-rise precursor of a major coronal mass ejection. APJL 954, L47. doi:10.3847/2041-8213/acf3e4
Cheng, X., Zhang, J., Ding, M. D., and Poomvises, W. (2010). APJ 712, 752–760. doi:10.1088/0004-637x/712/1/752
Démoulin, P. (2006). Extending the concept of separatrices to QSLs for magnetic reconnection. Adv. Space Res. 37, 1269–1282. doi:10.1016/j.asr.2005.03.085
Duan, A., Jiang, C., Zou, P., Feng, X., and Cui, J. (2021). Structure and evolution of an inter–active region large-scale magnetic flux rope. APJ 906, 45. doi:10.3847/1538-4357/abc701
Filippov, B. P., and Den, O. G. (2000). Prominence height and vertical gradient in magnetic field. Astron. Lett. 26, 322. doi:10.1134/1.20397
Gary, G. A., and Hagyard, M. J. (1990). Transformation of vector magnetograms and the problems associated with the effects of perspective and the azimuthal ambiguit. SoPh 126, 21. doi:10.1007/BF00158295
Hirayama, T. (1974). Theoretical model of flares and prominences: I: evaporating flare model. SoPh 34, 323–338. doi:10.1007/bf00153671
Jenkins, J. M., Hopwood, M., Démoulin, P., Valori, G., Aulanier, G., Long, D. M., et al. (2019). Modeling the effect of mass-draining on prominence eruptions. APJ 873, 49. doi:10.3847/1538-4357/ab037a
Jiang, C., Duan, A., Feng, X., Zou, P., Zuo, P., and Wang, Y. (2019). Reconstruction of a highly twisted magnetic flux rope for an inter-active-region X-class solar flare. Front. Astronomy Space Sci. 6, 63. doi:10.3389/fspas.2019.00063
Jiang, C., and Feng, X. (2013). Extrapolation of the solar coronal magnetic field fromsdo/hmi magnetogram by a cese-mhd-nlfff code. APJ 769, 144. doi:10.1088/0004-637x/769/2/144
Jiang, C., Feng, X., Liu, R., Yan, X., Hu, Q., Moore, R. L., et al. (2021). A fundamental mechanism of solar eruption initiation. Nat. Astron. 5, 1126–1138. doi:10.1038/s41550-021-01414-z
Jiang, C., Wu, S. T., Feng, X., and Hu, Q. (2014). Nonlinear force-free field extrapolation of a coronal magnetic flux rope supporting a large-scale filament from photospheric vector magnetogram. Astrophysical J. Lett. doi:10.1088/2041-8205/786/2/L16
Jing, J., Liu, C., Lee, J., Wang, S., Wiegelmann, T., Xu, Y., et al. (2014). Evolution of a magnetic flux rope and its overlying arcade based on nonlinear force-free field extrapolations. APJL 784, L13. doi:10.1088/2041-8205/784/1/l13
Kliem, B., and Török, T. (2006). Torus instability. PhRvL 96, 255002. doi:10.1103/physrevlett.96.255002
Kopp, R. A., and Pneuman, G. W. (1976). Magnetic reconnection in the corona and the loop prominence phenomenon. SoPh 50, 85. doi:10.1007/bf00206193
Lemen, J. R., Title, A. M., Akin, D. J., Boerner, P., Chou, C., Drake, J. F., et al. (2012). The atmospheric imaging assembly (AIA) on the solar dynamics observatory (SDO). SoPh 275, 17. doi:10.1007/s11207-011-9776-8
Lynch, B. J., Antiochos, S. K., MacNeice, P. J., Zurbuchen, T. H., and Fisk, L. A. (2004). Observable properties of the breakout model for coronal mass ejections. APJ 617, 589–599. doi:10.1086/424564
Martin, S. F., Marquette, W. H., and Bilimoria, R. (1992). “Astronomical society of the pacific conference series,”. The solar cycle. Editor K. L. Harvey, 53.
McCauley, P. I., Su, Y. N., Schanche, N., Evans, K. E., Su, C., McKillop, S., et al. (2015). Prominence and filament eruptions observed by the solar dynamics observatory: statistical properties, kinematics, and online catalog. SoPh 290, 1703–1740. doi:10.1007/s11207-015-0699-7
Mierla, M., Seaton, D. B., Berghmans, D., Chifu, I., De Groof, A., Inhester, B., et al. (2013). Study of a prominence eruption using PROBA2/SWAP and STEREO/EUVI data. SoPh 286, 241–253. doi:10.1007/s11207-012-9965-0
Moore, R. L., Sterling, A. C., Hudson, H. S., and Lemen, J. R. (2001). Onset of the magnetic explosion in solar flares and coronal mass ejections. APJ 552, 833–848. doi:10.1086/320559
Peng, Z., Chaowei, J., Juntao, W., and Xinkai, B. (2022). Mechanism of the failed eruption of an intermediate solar filament. APJ 928, 160. doi:10.3847/1538-4357/ac581f
Scherrer, P. H., Schou, J., Bush, R. I., Kosovichev, A. G., Bogart, R. S., Hoeksema, J. T., et al. (2012). The helioseismic and magnetic imager (HMI) investigation for the solar dynamics observatory (SDO). SoPh 275, 207–227. doi:10.1007/s11207-011-9834-2
Schou, J., Scherrer, P. H., Bush, R. I., Wachter, R., Couvidat, S., Rabello-Soares, M. C., et al. (2012). Design and ground calibration of the helioseismic and magnetic imager (HMI) instrument on the solar dynamics observatory (SDO). SoPh 275, 229–259. doi:10.1007/s11207-011-9842-2
Seaton, D. B., Hughes, J. M., Tadikonda, S. K., Caspi, A., DeForest, C. E., Krimchansky, A., et al. (2021). The Sun’s dynamic extended corona observed in extreme ultraviolet. Nat. Astron. 5, 1029–1035. doi:10.1038/s41550-021-01427-8
Srivastava, A. K., Mishra, S. K., and Jelínek, P. (2021). The prominence driven forced reconnection in the solar corona and associated plasma dynamics. APJ 920, 18. doi:10.3847/1538-4357/ac1519
Sturrock, P. A. (1966). Model of the high-energy phase of solar flares. nature 211, 695–697. doi:10.1038/211695a0
Titov, V. S., Hornig, G., and Démoulin, P. (2002). Theory of magnetic connectivity in the solar corona. J. Geophys. Res. Space Phys. 107, 1164. doi:10.1029/2001ja000278
Török, T., and Kliem, B. (2005). Confined and ejective eruptions of kink-unstable flux ropes. Astrophysical J. doi:10.1086/462412
Török, T., Kliem, B., and Titov, V. S. (2004). Ideal kink instability of a magnetic loop equilibrium. A&A 413, L27. doi:10.1051/0004-6361:20031691
van Ballegooijen, A. A., and Martens, P. C. H. (1989). Formation and eruption of solar prominences. APJ 343, 971. doi:10.1086/167766
Yashiro, S., Gopalswamy, N., Akiyama, S., Michalek, G., and Howard, R. A. (2005). Visibility of coronal mass ejections as a function of flare location and intensity. J. Geophys. Res. Space Phys. 110, A12S05. doi:10.1029/2005ja011151
Zhang, J., Dere, K. P., Howard, R. A., and Vourlidas, A. (2004). A study of the kinematic evolution of coronal mass ejections. APJ 604, 420–432. doi:10.1086/381725
Zhang, Q., Liu, R., Wang, Y., Li, X., and Lyu, S. (2021). Confined and eruptive catastrophes of solar magnetic flux ropes caused by mass loading and unloading. APJ 921, 172. doi:10.3847/1538-4357/ac1fef
Zou, P., Jiang, C., Feng, X., Zuo, P., Wang, Y., and Wei, F. (2019a). A two-step magnetic reconnection in a confined X-class flare in solar active region 12673. APJ 870, 97. doi:10.3847/1538-4357/aaf3b7
Keywords: Sun: coronal mass ejections (CMEs), Sun: filaments, prominences, Sun: magnetic fields, magnetic reconenction, magnetic reconstruction
Citation: Zou P, Jiang C, Bian X and Wang J (2024) Triggering mechanism of an eruptive filament located in a weak active region. Front. Astron. Space Sci. 11:1369362. doi: 10.3389/fspas.2024.1369362
Received: 12 January 2024; Accepted: 24 July 2024;
Published: 28 August 2024.
Edited by:
Hebe Cremades, University of Mendoza and Conicet, ArgentinaReviewed by:
Ritesh Patel, Southwest Research Institute Boulder, United StatesScott William McIntosh, National Center for Atmospheric Research (UCAR), United States
Copyright © 2024 Zou, Jiang, Bian and Wang. This is an open-access article distributed under the terms of the Creative Commons Attribution License (CC BY). The use, distribution or reproduction in other forums is permitted, provided the original author(s) and the copyright owner(s) are credited and that the original publication in this journal is cited, in accordance with accepted academic practice. No use, distribution or reproduction is permitted which does not comply with these terms.
*Correspondence: Zou Peng, YXdha2VuQGhpdC5lZHUuY24=