 Peng Wu
 Jian Li1,3
- 1Xinjiang Astronomical Observatory, Chinese Academy of Sciences, Urumqi, China
- 2University of Chinese Academy of Sciences, Beijing, China
- 3Xinjiang Key Laboratory of Microwave Technology, Urumqi, China
Xinjiang Qitai is constructing a 110-m fully steerable radio telescope (QiTai radio Telescope [QTT]) equipped with a phased array feeds (PAF) receiver, which will install the focal plane operating from 0.7 to 1.8 GHz. In this article, we introduce a PAF receiver model for beamforming, and the numerical model of the internal and external noise for this PAF receiver is provided using electromagnetic field simulation software. The linear constraint minimum variance (LCMV) algorithm is used to simulate the interference mitigation. The interference mitigation rate is from 0.581 to 0.921, and the signal restoration rate is from 0.998 to 1.512 within the error range of an interference arrival angle of 10°. This conclusion can be used in the signal correction of the PAF receiver for interference mitigation.
1 Introduction
The phased array feeds (PAF) receiver has been extensively studied worldwide as it is considered the next-generation receiver for telescopes. Compared to the horn receiver, which has a single-point receiving system, the PAF receiver is a multi-point (19–200) receiving system placed on the focal plane of telescopes (Warnick et al., 2016). The benefits of PAF receivers include a continuous field of view, flexible beam control, and active interference mitigation.
The search for faint astronomical signals is often limited by relatively large noise and interference in radio telescopes. The utilization of a PAF receiver in a telescope can result in increased system fluctuations, thereby leading to an increase in noise variance. This effect cannot be eliminated by integration (Jeffs et al., 2008). For single-dish radio telescopes, these noise sources include, but are not limited to, spillover noise observed by the PAF receiver from beyond the reflector edge; sky noise collected by the main and side beams of the telescope pattern, as shown in Figure 1; cross-coupling between the closely packed elements of the array (Warnick et al., 2009b); and additional noise due to resistance losses in the connector between the antenna, cable, and low-noise amplifier (LNA), as shown in Figure 2.
The QiTai radio Telescope (QTT), the largest fully steerable single-dish radio telescope currently under construction, has been selected by
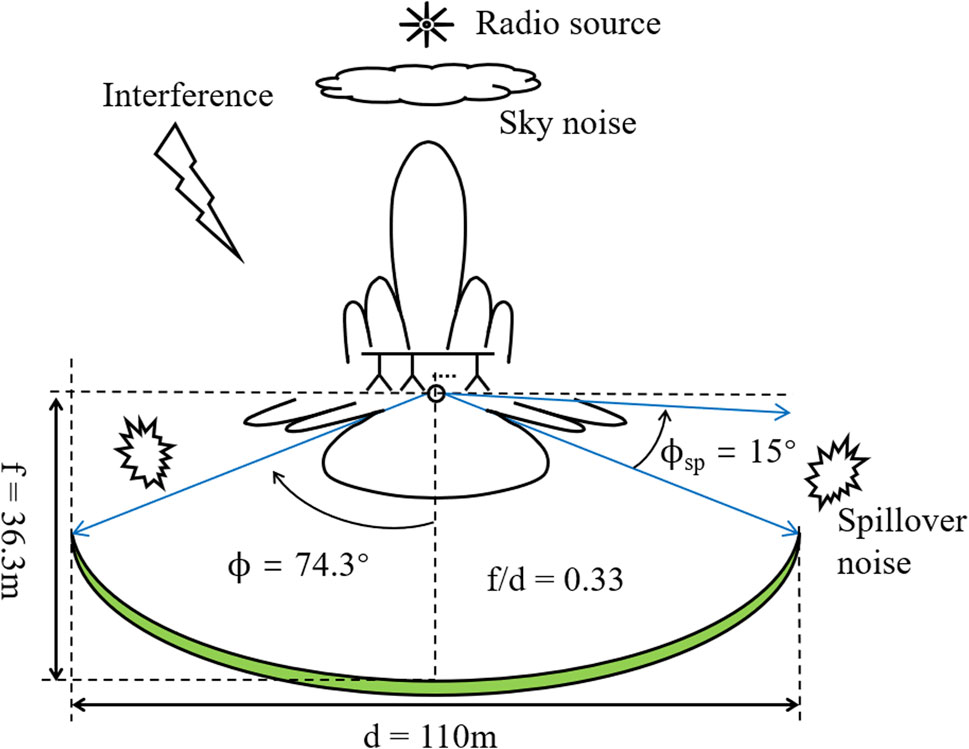
Figure 1. Sky noise and spillover noise diagram of the QTT-PAF receiver, when the telescope is pointed at the zenith.
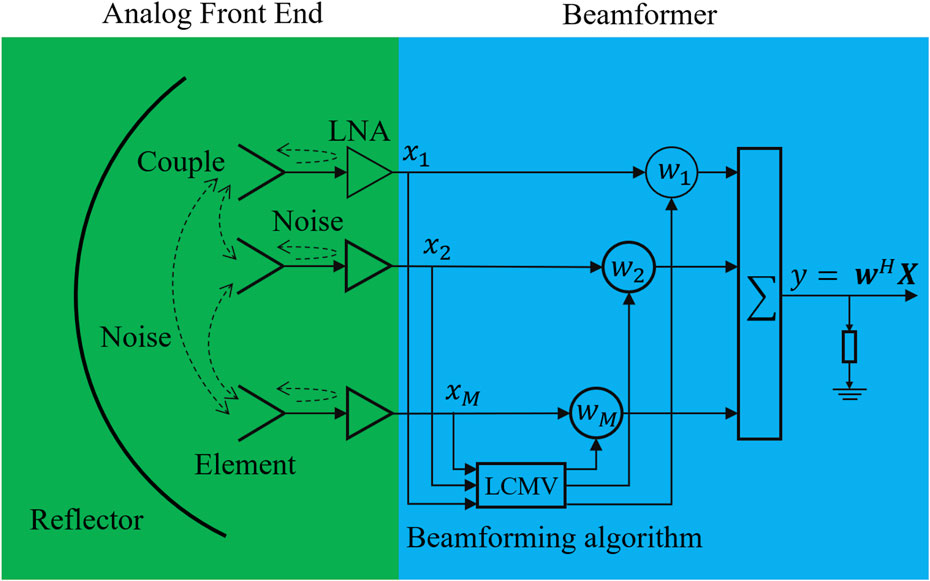
Figure 2. Beamforming schematic diagram of the PAF receiver. Here, the dashed line represents the noise caused by the coupling, connector, and LNA.
This paper aims to investigate and establish the noise environment of the QTT-PAF receiver and to offer a numerical model for noise and interference mitigation in the design of the array and beamforming algorithm of the QTT-PAF receiver. At the same time, it is also important to obtain the relation between the interference arrival angle error, interference mitigation, and signal restoration, which is helpful in the correction of system errors and the estimation of cosmic signal power. Furthermore, this research can also provide theoretical validation and an experimental foundation for the pre-project research and development.
2 The mathematical principles of the PAF beamformer
2.1 Signal stream of the PAF receiver
Figure 2 shows a PAF receiving system with
2.2 Signal analysis
The sensitivity metric
where
2.3 Beamforming algorithm
At present, the main algorithms used in the beamformer are based on the maximum signal-to-noise ratio (MaxSNR), minimum variance distortionless response (MVDR), subspace projection (SP), and LCMV (Jeffs et al., 2008; Warnick et al., 2009a; Ivashina et al., 2011; Young et al., 2013). The LCMV algorithm can achieve interference mitigation without affecting the main beam response. When there is no interference, it is the MVDR algorithm. Suppressing the power of interference is equivalent to controlling the PAF pattern on interference orientation in a telescope. At the same time, because of the good control of the beam, it is also applied to the multi-beam joint optimization problem of PAF. Mathematically, the weight vector
where
3 Simulation
This section presents the simulated signals used for beamforming and the hardware model to generate these signals. Antenna simulation software and the PAF signal generator mentioned by Wu et al. (2024) are mainly used in the experiment. Finally, the relationship between the interference arrival angle and interference mitigation and signal restoration in the LCMV beamfromer of Eq. 2 is calculated.
3.1 Model of the 110-m reflector and 25 Vivaldi PAF antennas
The QTT-PAF receiver is designed to operate at a center frequency of 1.25 GHz, with the array element being a Vivaldi antenna, and the operating temperature is 20 k in a cryogenic environment. The design of the QTT-PAF receiver has not yet been completed. The antenna model used for generating the simulation signal consists of 25 Vivaldi antennas arranged in a quadrilateral pattern on the focal plane of a 110-m parabolic reflector, as depicted in Figure 3. This section introduces a 2D Vivaldi antenna model, which does not compromise the principle of beamforming. Figure 4 illustrates the Vivaldi antenna model and the parameters of its quadrilateral arrangement. Due to computer memory constraints, the antenna model is divided into 192,680 grids. The pattern of all array elements under uniform excitation is shown in Figure 5.
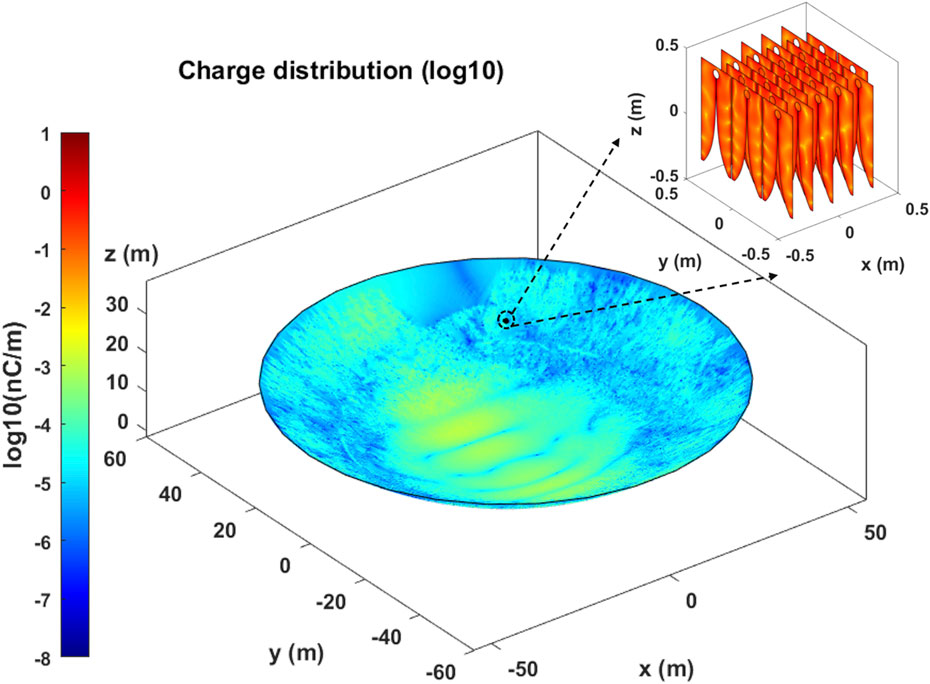
Figure 3. Charge distribution of a 110-m parabola antenna in the illumination of a PAF receiver consisting of 25 Vivaldi antennas. All Vivaldi antennas are unit-excited and operate at 1.25 GHz.
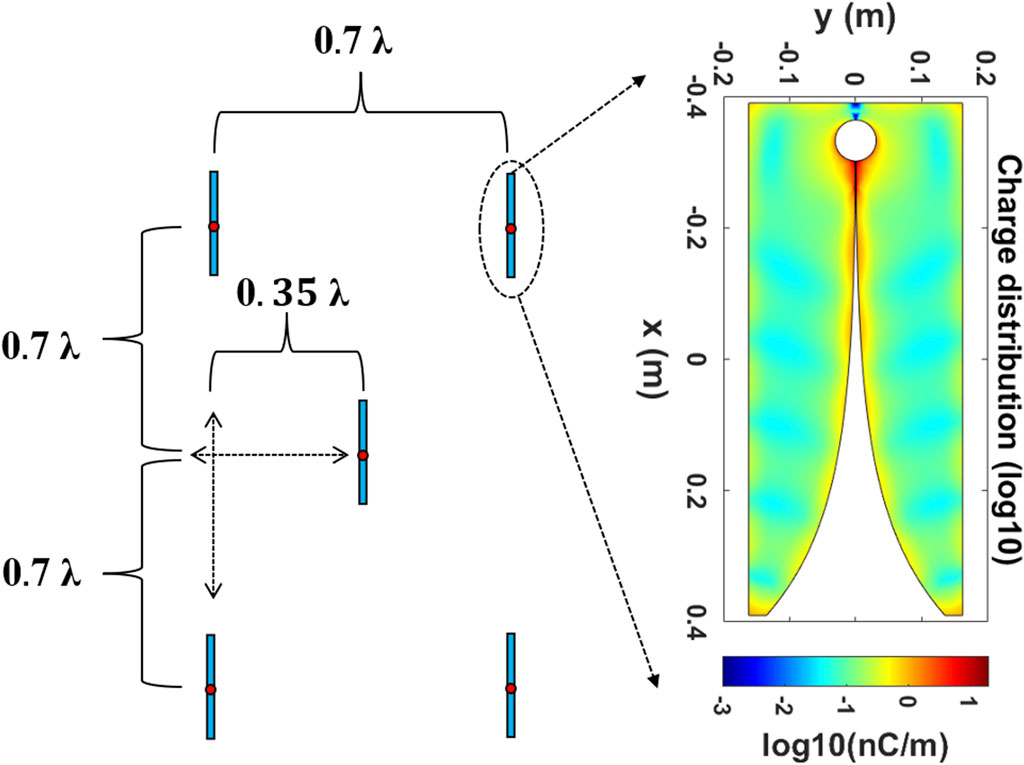
Figure 4. Planar diagram of the array and charge diagram of the 2D Vivaldi model (unit excitation).
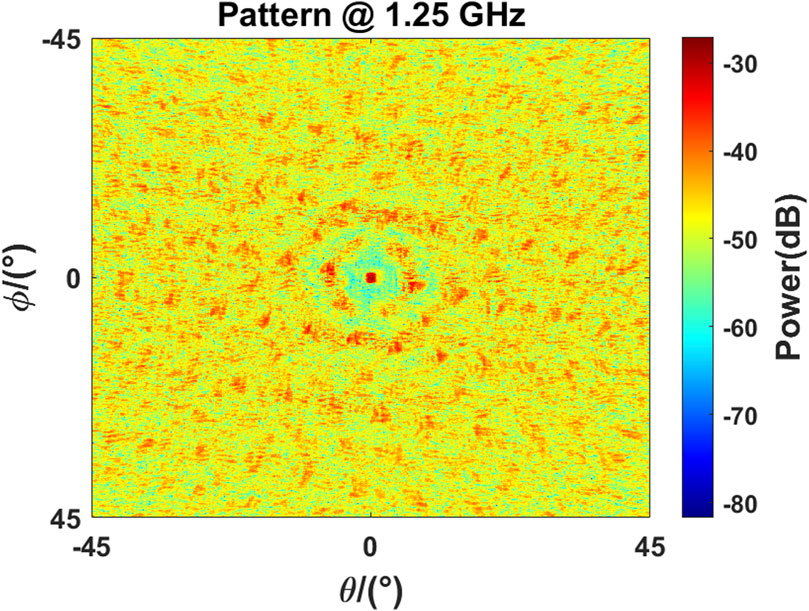
Figure 5. 2D beam image in the model in Figure 3; the display range is 90 square degrees, and the operating frequency is 1.15 GHz.
3.2 The numerical model of noise
In radio astronomy, electric power is equated to temperature. The relationship between the average electrical power
where
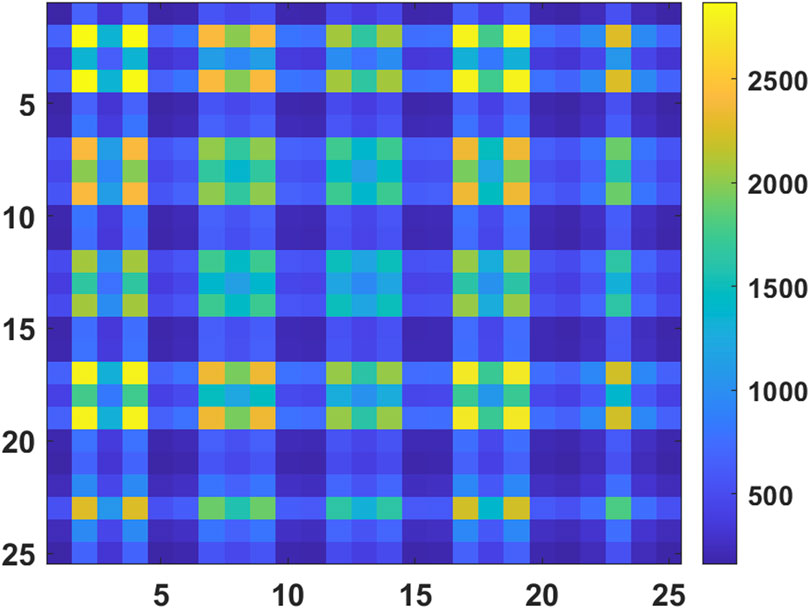
Figure 6. Correlation matrix of impedance coefficients of 25 elements.
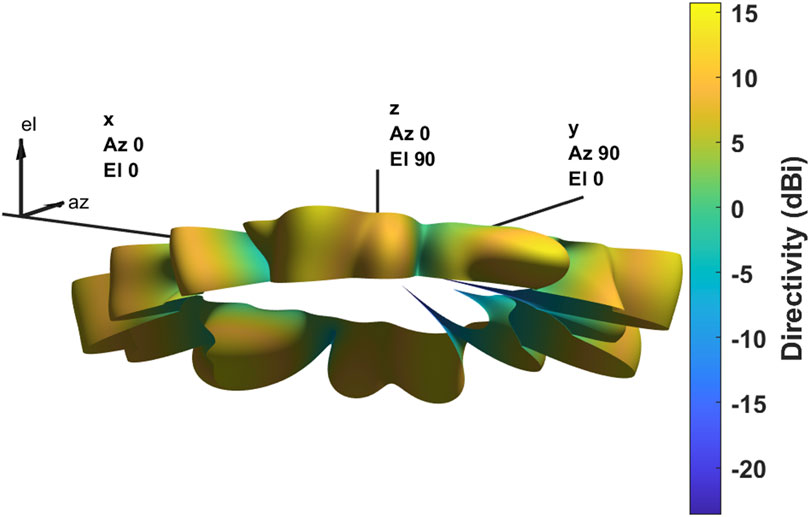
Figure 7. Pattern of PAF spillover noise, i.e., the pattern of
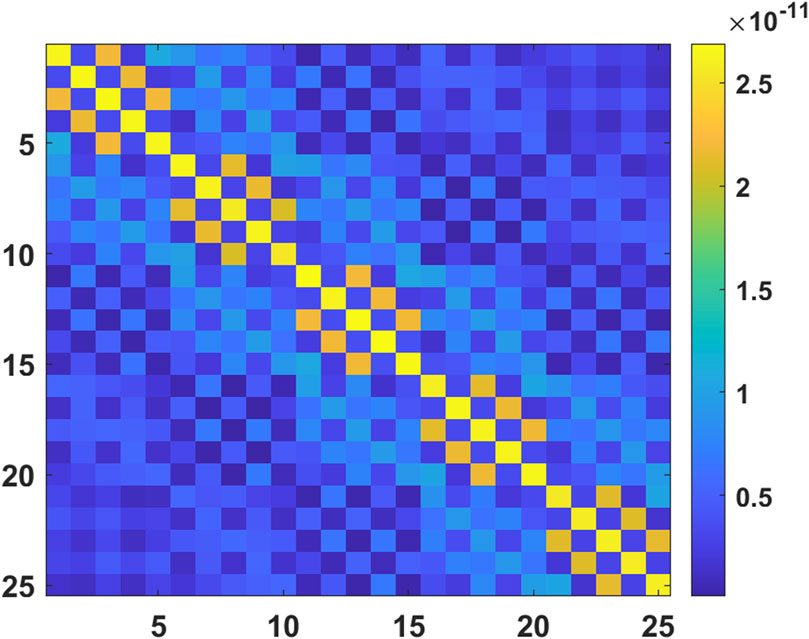
Figure 8. Covariance matrix of spillover noise in the telescope.
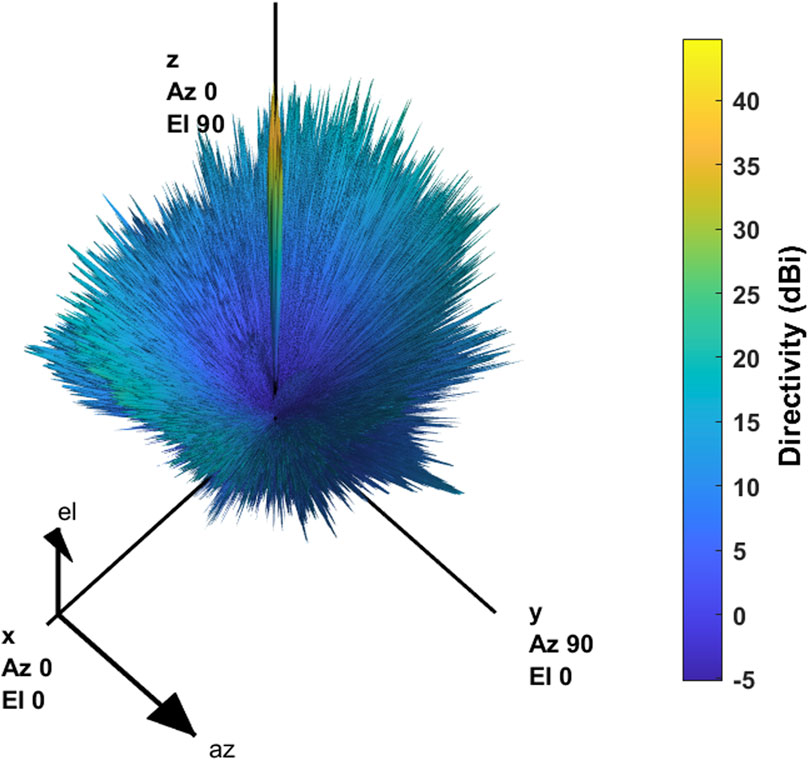
Figure 9. Pattern of the telescope-collected noise from the sky.
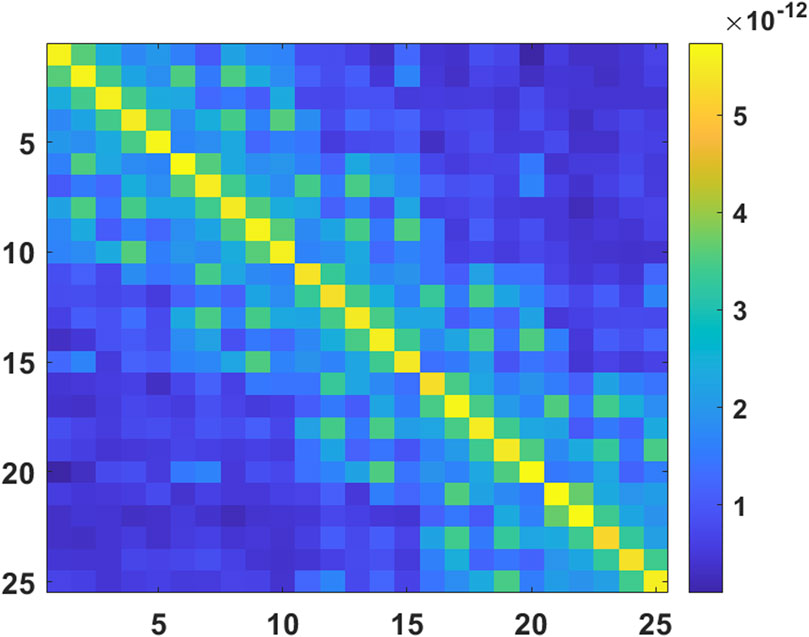
Figure 10. Covariance matrix of sky noise in the telescope.
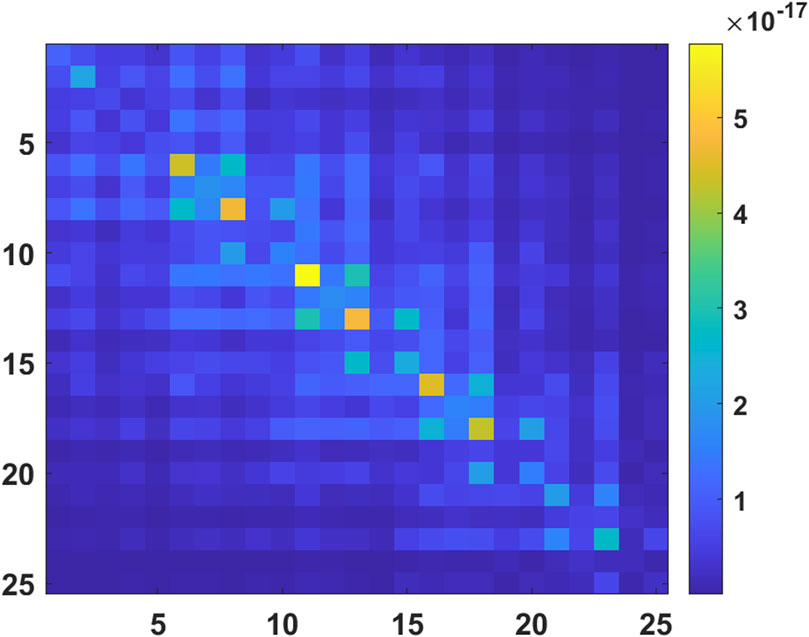
Figure 11. Covariance matrix of LNA noise in the PAF receiver.
3.3 Beamforming and interference mitigation
The minimum signal power that a radio telescope can detect is limited by the variance of the noise. Usually, the SOI enters along the main beam of a telescope, and the interference enters through the side beam, and these and the noise are uncorrelated to each other. The covariance matrix of the output signal of the PAF receiver can be described as
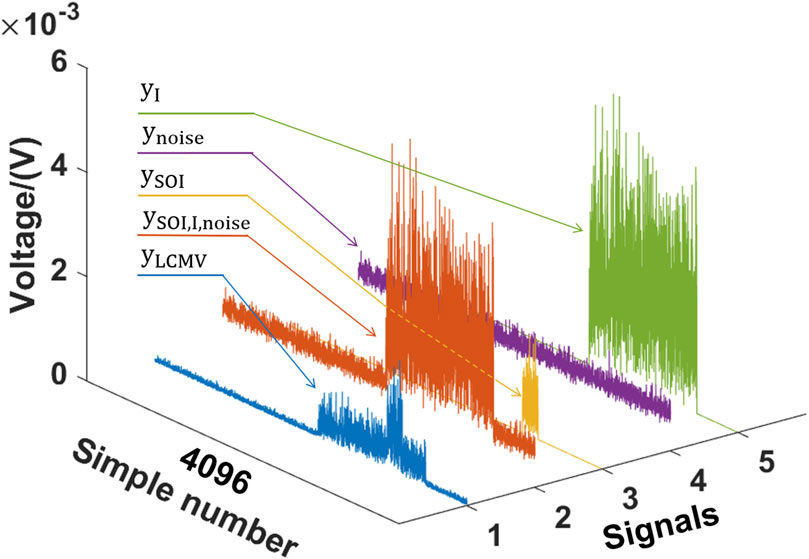
Figure 12. Voltage images of each signal over time, which are the average result of 10 STI windows.
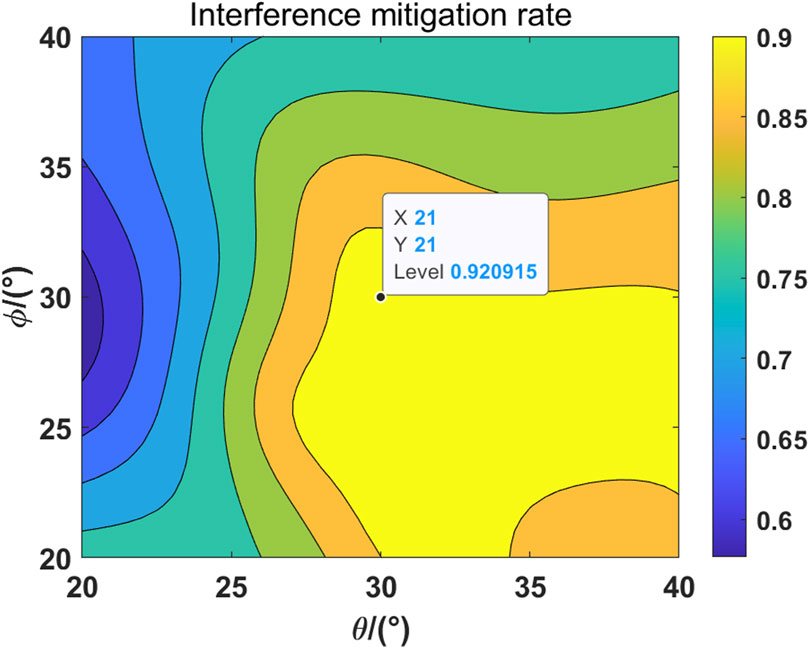
Figure 13. The relationship between the estimation of the interference arrival angle and the interference mitigation rate is plotted.
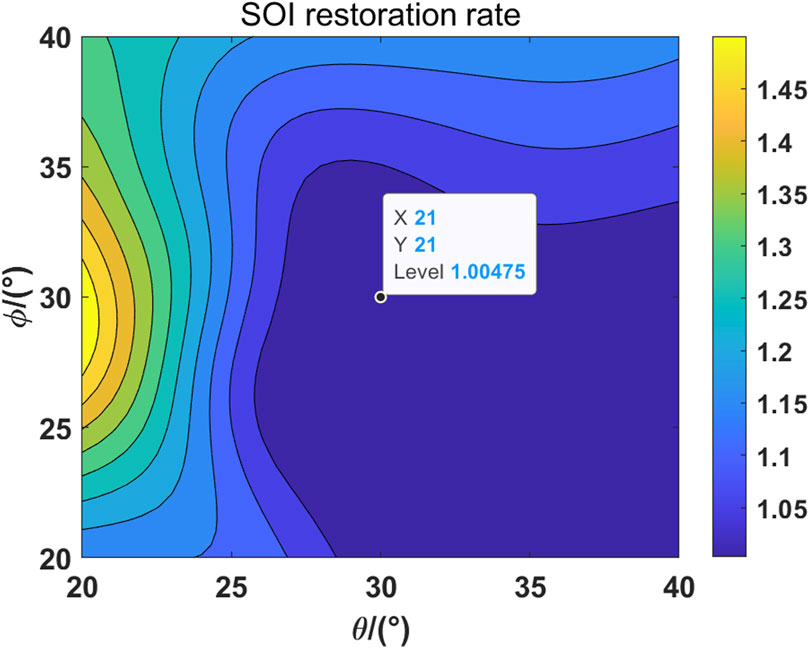
Figure 14. The relationship between the estimation of the interference arrival angle and the SOI restoration rate is plotted.
By examining Figures 12–14, it becomes evident that when there is a clear interference orientation, the LCMV algorithm demonstrates significant interference reduction. The interference mitigation rate is 0.921, and the SOI restoration rate is 1.005. It should be noted that the ratio is greater than 1 due to interference. The interference orientation vector and the SOI orientation vector are not orthogonal. With the change in the spherical angle of interference, the interference mitigation rate and the SOI restoration rate show similar patterns. We believe that the primary factors are the pattern and single polarization of the telescope. Regarding the pattern, the telescope exhibits an approximately 10 dB variation in gain on the interference within the estimated range of interference orientations. Given that the telescope’s overall dynamic range exceeds 50 dB, this change is not substantial. Furthermore, the PAF model considers only single polarization. Consequently, when the interference shifts in an orientation not aligned with the polarization, the telescope does not respond sensitively to these changes.
4 Conclusion
In this paper, the signal numerical model and interference mitigation verification under the QTT-PAF model are implemented. The PAF receiver and parabolic antenna composed of 25 array elements are co-simulated under the Vivaldi antenna model, and the internal and external noise of the system is given from the perspective of covariance. Finally, the noise is mixed into the SOI and interference, and the interference is mitigated by the LCMV algorithm. The mitigation results show that the LCMV algorithm has a good mitigation ability for interference under this model and has a small impact on the SOI, but the premise is that the interference orientation is accurately estimated.
Data availability statement
The original contributions presented in the study are included in the article/Supplementary Material; further inquiries can be directed to the corresponding author.
Author contributions
PW: writing–original draft and writing–review and editing. JL: funding acquisition and writing–review and editing. M-ZC: funding acquisition, project administration, supervision, and writing–review and editing.
Funding
The author(s) declare that financial support was received for the research, authorship, and/or publication of this article. This work was funded by the National Key R&D Program of China under Grant No. 2022YFC2205300, the National Natural Science Foundation of China (12073067), and the Chinese Academy of Sciences (CAS) “Light of West China” Program under Grant No. 2022-XBQNXZ-012.
Conflict of interest
The authors declare that the research was conducted in the absence of any commercial or financial relationships that could be construed as a potential conflict of interest.
Publisher’s note
All claims expressed in this article are solely those of the authors and do not necessarily represent those of their affiliated organizations, or those of the publisher, the editors, and the reviewers. Any product that may be evaluated in this article, or claim that may be made by its manufacturer, is not guaranteed or endorsed by the publisher.
Footnotes
1https://www.nature.com/articles/d41586-022-04444-3
References
Ivashina, M. V., Iupikov, O., Maaskant, R., van Cappellen, W. A., and Oosterloo, T. (2011). An optimal beamforming strategy for wide-field surveys with phased-array-fed reflector antennas. IEEE Trans. Antennas Propag. 59, 1864–1875. doi:10.1109/TAP.2011.2123865
James, E. M. (2012) Improved methods for phased array feed beamforming in single dish radio astronomy. Provo, UT, United States; Brigham Young University. Ph.D. thesis.
Jeffs, B. D., Warnick, K. F., Landon, J., Waldron, J., Jones, D., Fisher, J. R., et al. (2008). Signal processing for phased array feeds in radio astronomical telescopes. IEEE J. Sel. Top. Signal Process. 2, 635–646. doi:10.1109/JSTSP.2008.2005023
Ma, J., Pei, X., Wang, N., Li, J., Wang, K., and Liu, Y. (2019). Ultra wideband and multi-beam signal receiving and processing system of qtt. Sci. Sinica Phys. Mech. Astronomica 49, 99502, 1–13. doi:10.1360/SSPMA-2019-0014
Wang, N. (2014). Xinjiang Qitai 110 m radio telescope. Sci. Sinica Phys. Mech. Astronomica 44, 783–794. doi:10.1360/SSPMA2014-00039
Warnick, K. F., and Jeffs, B. D. (2008). Efficiencies and system temperature for a beamforming array. IEEE Antennas Wirel. Propag. Lett. 7, 565–568. doi:10.1109/LAWP.2008.2001752
Warnick, K. F., Jeffs, B. D., Landon, J., Waldron, J., Jones, D., Richard Fisher, J., et al. (2009a). “Beamforming and imaging with the byu/nrao l-band 19-element phased array feed,” in 2009 13th International Symposium on Antenna Technology and Applied Electromagnetics and the Canadian Radio Science Meeting, Banff, AB, February 15–18, 2009 (IEEE) 1–4. doi:10.1109/ANTEMURSI.2009.4805125
Warnick, K. F., Maaskant, R., Ivashina, M. V., Davidson, D. B., and Jeffs, B. D. (2016). High-sensitivity phased array receivers for radio astronomy, Proc. IEEE 104 (3), 607–622. doi:10.1109/JPROC.2015.2491886
Warnick, K. F., Woestenburg, B., Belostotski, L., and Russer, P. (2009b). Minimizing the noise penalty due to mutual coupling for a receiving array. IEEE Trans. Antennas Propag. 57, 1634–1644. doi:10.1109/TAP.2009.2019898
Wu, P., Li, J., and Chen, M.-Z. (2024). Simulation of rfi cancellation using subspace projection algorithm for paf receiver. Res. Astron. Astrophys. 24, 015019. doi:10.1088/1674-4527/ad0b84
Keywords: QiTai radio Telescope, array signal processing, signal numerical model, linear constraint minimum variance, phased array feeds, beamforming, beamformer design
Citation: Wu P, Li J and Chen M-Z (2024) Numerical model of the QiTai radio Telescope PAF receiver signal and simulation of interference mitigation. Front. Astron. Space Sci. 11:1392970. doi: 10.3389/fspas.2024.1392970
Received: 28 February 2024; Accepted: 10 June 2024;
Published: 10 July 2024.
Edited by:
Hairen Wang, Purple Mountain Observatory (CAS), ChinaReviewed by:
Mario Gai, Osservatorio Astrofisico di Torino (INAF), ItalyWeiye Zhong, Shanghai Astronomical Observatory (CAS), China
Jinqing Wang, Shanghai Astronomical Observatory (CAS), China
Copyright © 2024 Wu, Li and Chen. This is an open-access article distributed under the terms of the Creative Commons Attribution License (CC BY). The use, distribution or reproduction in other forums is permitted, provided the original author(s) and the copyright owner(s) are credited and that the original publication in this journal is cited, in accordance with accepted academic practice. No use, distribution or reproduction is permitted which does not comply with these terms.
*Correspondence: Mao-Zheng Chen, Y2hlbkB4YW8uYWMuY24=